
Arterial Safety Performance Functions...arterial road segment system on the state highway system in...
168
Office of Research & Library Services WSDOT Research Report Urban and Suburban Arterial Safety Performance Funcons: Final Report WA-RD 857.1 June 2016 16-09-0357 Venky Shankar Narayan Venkataraman Jungyeol Hong Barad Hariharan Daniel Kwon
Transcript of Arterial Safety Performance Functions...arterial road segment system on the state highway system in...

Office of Research & Library ServicesWSDOT Research Report
Urban and Suburban Arterial Safety Performance Functions: Final Report
WA-RD 857.1 June 2016
16-09-0357
Venky Shankar Narayan VenkataramanJungyeol Hong Barad HariharanDaniel Kwon

THE PENNSYLVANIA STATE UNIVERSITY
Urban and Suburban Arterial Safety Performance Functions
Final Report
Dr. Venky Shankar, Professor of Civil Engineering Dr. Narayan Venkataraman
Dr. Jungyeol Hong Dr. Barad Hariharan
Dr. Daniel Kwon
226C Sackett Building Department of Civil and Environmental Engineering
Pennsylvania State University University Park, PA 16802
E-mail: [email protected] Tel: (814) 865-9434
Prepared for: Washington State
Department of Transportation Roger Millar, Acting Secretary
June 30, 2016
TECHNICAL REPORT DOCUMENTATION PAGE
1. Report No. WA-RD 857.1
2. Government Accession No. 3. Recipient’s Catalog No.
4. Title and Subtitle Urban and Suburban Arterial Safety Performance Functions: Final Report
5. Report Date June 30, 2016 6. Performing Organization Code
7. Author(s) Venky Shankar, PhD, PE; Narayan Venkataraman, PhD; Jungyeol Hong, PhD; Barad Hariharan, PhD; Daniel Kwon, PhD.
8. Performing Organization Report No.
9. Performing Organization Name and Address Department of Civil and Environmental Engineering Pennsylvania State University 226C Sackett Building University Park, PA 16802
10. Work Unit No. 11. Contract or Grant No. GCA 6865 and No. 8218
12. Sponsoring Agency Name and Address Research Office Washington State Department of Transportation PO Box 47372, Olympia, WA 98504-7372 Jon Peterson, Research Manager; Ph: 360-705-7499
13. Type of Report and Period Covered Final Report 11/1/2012 – 6/30/2016 14. Sponsoring Agency Code
15. Supplementary Notes 16. Abstract This report documents findings from a comprehensive set of safety performance functions developed for the entire urban-suburban arterial road segment system on the state highway system in Washington. Conventional urban suburban safety performance functions on the basis of cross sectional classifications were developed using random parameter negative binomial models. Total crashes, as well as crashes by severity type were modeled. It was found that out of 20 statistically significant variables, number of lanes, roadway width, shoulder width, point of vertical tangent grade (PVT), vertical curve point of vertical curve grade (PVC) horizontal curve maximum super elevation (e), curve central angle (delta), horizontal curve radius (R) were found to be random parameters. In addition, derived measures such as degree of curve, absolute vertical grade difference (A), and rate of vertical curvature (K) were also found to be random. The majority of the statistically significant effects were geometric. In addition, functional class indicators such as minor arterial indicator were also found to be random. Roadside information was not fully evaluated due to inconsistencies in matching roadside inventories for all homogeneous segments. An alternative classification of the safety performance functions on the basis of ADT-population thresholds was also considered. Similar patterns of parameter randomness were found. In the absence of roadside and land use information, it appears from the 173 advanced random parameter models that were developed, that the treatment of geometric parameters as random is justified, due to significant unobserved heterogeneity in the urban-suburban arterial crash context. 17. Key Words Urban-suburban arterials; Safety Performance Functions; random parameter models
18. Distribution Statement No restrictions. This document is available to the public through the National Technical Information Service, Springfield, VA 22616
19. Security Classif. (of this report) None
20. Security Classif. (of this page) None
21. No. of Pages 168
22. Price
Form DOT F 1700.7 (8-72) Reproduction of completed page authorized

Disclaimers The contents of this report reflect the views of the authors who are responsible for the facts and accuracy of the data presented herein. The contents do not necessarily reflect the official views or policies of the Washington State Department of Transportation. This report does not constitute a standard, specification, or regulation.
Under 23 U.S. Code section 148 and 23 U.S. Code section 409, safety data, reports, surveys, schedules, lists compiled or collected for the purpose of identifying, evaluating, or planning the safety enhancement of potential crash sites, hazardous roadway conditions, or railway-highway crossings are not subject to discovery or admitted into evidence in a Federal or State court proceeding or considered for other purposes in any action for damages arising from any occurrence at a location mentioned or addressed in such reports, surveys, schedules, lists, or data.

ii
iii
Table of Contents
Table of Contents ............................................................................................................................ iii
List of Figures .................................................................................................................................. v
List of Tables .................................................................................................................................. vi
1.0 Introduction ............................................................................................................................... 8
1.1 Overview of Study Area ........................................................................................................ 8
1.2 WSDOT Functional Classification Methodology ................................................................ 13
1.3 Organization of Report ........................................................................................................ 18
2.0 Data Description ...................................................................................................................... 19
2.1 Source Accident Data .......................................................................................................... 19
2.2 Source Roadway Geometrics Data ...................................................................................... 25
2.3 Source AADT Data .............................................................................................................. 29
2.4 Source Functional Classification Data ................................................................................. 30
2.5 Homogeneous Segments Crash Database 2010-2012 .......................................................... 32
3.0 Functional Classification (Centerline Miles) ........................................................................... 37
3.1 Population Based Geographic Type Classification .............................................................. 37
3.2 AADT Based Geographic Type Classification .................................................................... 37
3.3 Highway Log Centerline Miles Validation .......................................................................... 38
4.0 Functional Classification (Segments) ...................................................................................... 41
4.1 Interstate Segments .............................................................................................................. 43
4.2 Principal Arterial (Freeway/Expressway + Other Principal Arterial) Segments ................. 44
4.3 Minor Arterial Segments ...................................................................................................... 46
4.4 Collector Segments .............................................................................................................. 47
4.5 Non-Interstate Segments (Collector + Minor Arterial + Principal Arterial) ........................ 48
5.0 Crash Summary ....................................................................................................................... 49
5.1 Crash Summaries by Roadway Functional Class ................................................................ 50
5.2 Crash Summaries by Geographic Class ............................................................................... 61
6.0 Model Findings .................................................................................................................... 70
6.1 Conclusions and Recommendations .................................................................................... 72
A.1 Appendix on Population-ADT Classification SPFs ............................................................ 75

iv
v
List of Figures
Figure 1.1: Washington State Highway Map 2011-2012................................................................. 9
Figure 1.2: WSDOT Census Urbanized Areas and Urban Clusters Map. ..................................... 14
Figure 1.3: WSDOT Functional Classification Request Flow Chart. ............................................ 15
Figure 1.4: Federal Functional Classification Decision Tree (FHWA). ........................................ 17
vi
List of Tables
Table 1.1: 2010 Washington State Routes and Total Mileage. ...................................................... 10
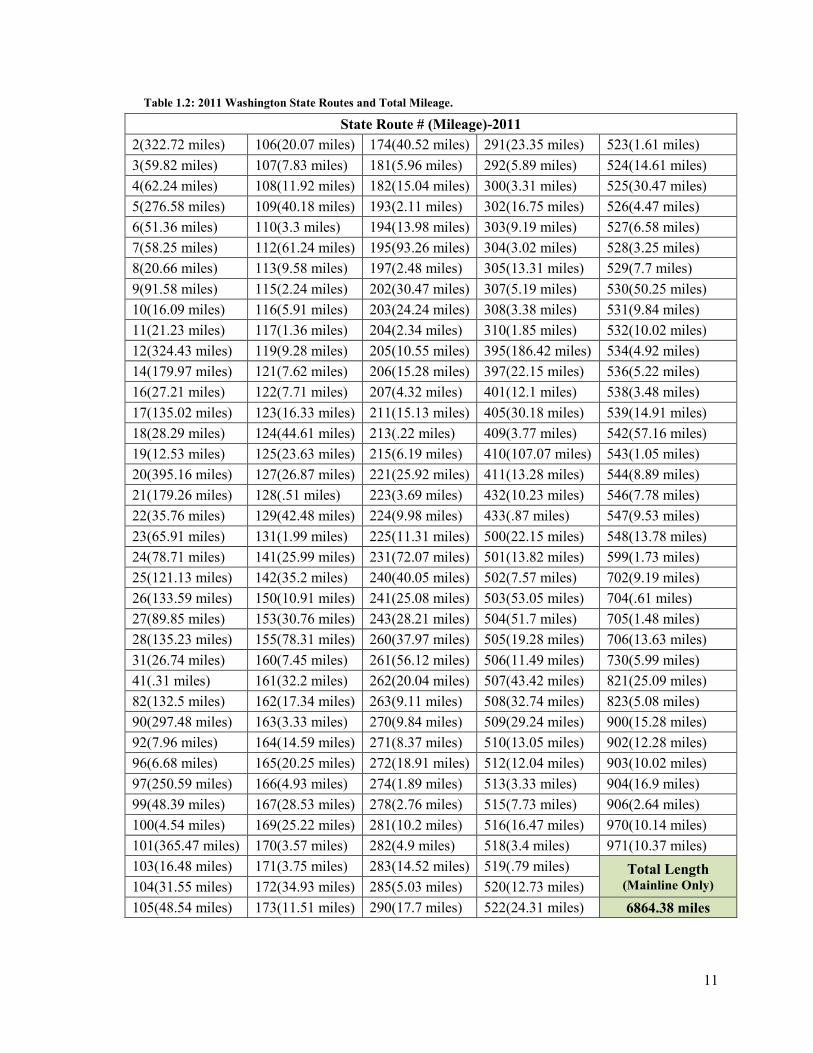
Table 1.2: 2011 Washington State Routes and Total Mileage. ...................................................... 11
Table 1.3: 2012 Washington State Routes and Total Mileage. ...................................................... 12
Table 2.1: WSDOT Source Accident Dataset Parameters. ............................................................ 20
Table 2.2: WSDOT Horizontal Alignment Data. .......................................................................... 25
Table 2.3: Average WSDOT Horizontal Alignment Values for 2010 and 2011. .......................... 26
Table 2.4: WSDOT Vertical Alignment Data. ............................................................................... 27
Table 2.5: WSDOT Number of Lanes and Roadway Width Data. ................................................ 28
Table 2.6: WSDOT Shoulder Width Data. .................................................................................... 29
Table 2.7: WSDOT TPT Traffic Sections Data. ............................................................................ 30
Table 2.8: WSDOT Functional Class State Routes Data. .............................................................. 31
Table 2.9: Homogeneous Roadway Segments Database Parameters. ........................................... 33
Table 3.1: AADT Ranges for Functional and Geographic Class. .................................................. 38
Table 3.2: Functional Class Centerline Miles by Lane Configuration. .......................................... 39
Table 3.3: Population Based Functional Class Centerline Miles by Geographic Classification. .. 39
Table 3.4: AADT Based Functional Class Centerline Miles by Geographic Classification. ......... 39
Table 3.5: Matrix of 2010 Population Based and AADT Based Functional Class Centerline Miles. ....................................................................................................................................................... 40
Table 3.6: Matrix of 2010 Population Based and AADT Based Functional Class Centerline Miles by Percent. ..................................................................................................................................... 41
Table 4.1: Matrix of 2010 Population Based and AADT Based Functional Class Homogeneous Roadway Segments. ....................................................................................................................... 42
Table 4.2: Matrix of 2011 Population Based and AADT Based Functional Class Homogeneous Roadway Segments. ....................................................................................................................... 42
Table 4.3: Matrix of 2012 Population Based and AADT Based Functional Class Homogeneous Roadway Segments. ....................................................................................................................... 42
Table 4.4: Matrix of 2010 Population Based and AADT Based Functional Class Homogeneous Interstate Segments. ....................................................................................................................... 43
Table 4.5: Matrix of 2011 Population Based and AADT Based Functional Class Homogeneous Interstate Segments. ....................................................................................................................... 43
Table 4.6: Matrix of 2012 Population Based and AADT Based Functional Class Homogeneous Interstate Segments. ....................................................................................................................... 44
Table 4.7: Matrix of 2010 Population Based and AADT Based Functional Class Homogeneous Principal Arterial Segments. .......................................................................................................... 45
Table 4.8: Matrix of 2011 Population Based and AADT Based Functional Class Homogeneous Principal Arterial Segments. .......................................................................................................... 45
Table 4.9: Matrix of 2012 Population Based and AADT Based Functional Class Homogeneous Principal Arterial Segments. .......................................................................................................... 45
Table 4.10: Matrix of 2010 Population Based and AADT Based Functional Class Homogeneous Minor Arterial Segments. ............................................................................................................... 46
vii
Table 4.11: Matrix of 2011 Population Based and AADT Based Functional Class Homogeneous Minor Arterial Segments. ............................................................................................................... 46
Table 4.12: Matrix of 2012 Population Based and AADT Based Functional Class Homogeneous Minor Arterial Segments. ............................................................................................................... 47
Table 4.13: Matrix of 2010 Population Based and AADT Based Functional Class Homogeneous Collector Segments. ....................................................................................................................... 47
Table 4.14: Matrix of 2011 Population Based and AADT Based Functional Class Homogeneous Collector Segments. ....................................................................................................................... 47
Table 4.15: Matrix of 2012 Population Based and AADT Based Functional Class Homogeneous Collector Segments. ....................................................................................................................... 48
Table 4.16: Matrix of 2010 Population Based and AADT Based Functional Class Homogeneous Non-Interstate Segments. ............................................................................................................... 48
Table 4.17: Matrix of 2011 Population Based and AADT Based Functional Class Homogeneous Non-Interstate Segments. ............................................................................................................... 49
Table 4.18: Matrix of 2012 Population Based and AADT Based Functional Class Homogeneous Non-Interstate Segments. ............................................................................................................... 49
Table 5.1: Total Crash Count by Functional Class from 2010 to 2012. ........................................ 50
Table 5.2: Functional Class Crash Count by Impact Location from 2010 to 2012........................ 51
Table 5.3: Functional Class Crash Count by Collision Severity from 2010 to 2012. .................... 52
Table 5.4: Functional Class Crash Count by Number of Vehicles Involved from 2010 to 2012. . 54
Table 5.5: Functional Class Crash Count by Collision Type from 2010 to 2012. ......................... 56
Table 5.6: Total Crash Count by Geographic Class from 2010 to 2012. ....................................... 62
Table 5.7: Geographic Class Crash Count by Impact Location from 2010 to 2012. ..................... 63
Table 5.8: Geographic Class Crash Count by Collision Severity from 2010 to 2012. .................. 64
Table 5.9: Geographic Class Crash Count by Number of Vehicles Involved from 2010 to 2012. 65
Table 5.10: Geographic Class Crash Count by Collision Type from 2010 to 2012. ..................... 67

1.0 Introduction
The scope of this study is to provide a detailed analysis of all Washington State highway crashes from 2010 to 2012 with specific attention focused on addressing the manner in which urban-suburban functional classes are assigned to highway segments or various stretches of roadway within the Washington State highway network. The conventional method of assigning highway functional class type in transportation applications is to base the functional classifications on surrounding land-use definitions that include such factors as census information, population density, and property boundaries. Efforts by the Washington State Department of Transportation (WSDOT) have aimed to establish a more detailed methodology for assigning highway functional classifications that are based on the afore mentioned metrics as illustrated by the Detailed Functional Classification Criteria document (prior to October 2013) and the more recent release of WSDOT’s report on Guidelines for Amending Functional Classification in Washington State (October 2013).
These existing methods of highway functional classification incorporate additional metrics that are not necessarily conducive to highway safety analysis. Multiple factors that influence highway segment functional class or geographic class misrepresent how highway crashes should be evaluated because of the way in which the roadway is defined. In transportation safety analysis, Annual Average Daily Traffic (AADT) is a crucial component in safety modeling. By utilizing AADT as a means for determining highway functional class, it is hypothesized that such a classification system would result in more robust crash prediction with respect to functional class and geographic class type. This report will compare two core methodologies of highway geographic classification: 1) land-use population estimates and 2) AADT counts. The two methods of classification will be compared and the differences in approach will be explained. The intent of this report and the resulting SPF methodology is to offer clarity and assist WSDOT in their efforts for establishing a standard safety protocol for developing SPFs for various urban-suburban classifications.
1.1 Overview of Study Area The study area for this research focuses on all highways in Washington State, which totals 187
routes. The following figure displays all state routes for Washington as shown in an available state highway map downloaded from the WSDOT Highway Map webpage.

9
Figure 1.1: Washington State Highway Map 2011-2012.
The next three tables list all of the routes from Washington State that are included in the study
from 2010, 2011, and 2012. The routes are listed by number with their associated route mileage shown in parentheses. The tables show consistent mileage for all state routes across the three-year time span and minimal changes in total mileage, with a total centerline mileage of 6,867.68 miles for 2010, 6,864.38 miles for 2011, and 6,864.30 miles for 2012.
From 2010 to 2011, there was a recorded reduction of 3.0 centerline miles across the state highway network, of which 2.63 miles were reduced for State Route 527. From 2011 to 2012, the reduction in centerline miles across the Washington State highway network totaled 0.08 miles, with State Route 7 reducing 0.07 miles between 2011 and 2012.

10
Table 1.1: 2010 Washington State Routes and Total Mileage.
State Route # (Mileage)-2010 2(322.72 miles) 106(20.07 miles) 174(40.52 miles) 291(23.35 miles) 523(1.61 miles) 3(59.82 miles) 107(7.83 miles) 181(5.96 miles) 292(5.89 miles) 524(14.61 miles) 4(62.24 miles) 108(11.92 miles) 182(15.04 miles) 300(3.31 miles) 525(30.47 miles) 5(276.58 miles) 109(40.18 miles) 193(2.11 miles) 302(16.75 miles) 526(4.47 miles) 6(51.36 miles) 110(3.3 miles) 194(13.98 miles) 303(9.19 miles) 527(9.21 miles) 7(58.25 miles) 112(61.24 miles) 195(93.26 miles) 304(3.02 miles) 528(3.25 miles) 8(20.66 miles) 113(9.58 miles) 197(2.48 miles) 305(13.31 miles) 529(7.7 miles) 9(91.58 miles) 115(2.24 miles) 202(30.47 miles) 307(5.19 miles) 530(50.32 miles) 10(16.09 miles) 116(5.91 miles) 203(24.24 miles) 308(3.38 miles) 531(9.84 miles) 11(21.23 miles) 117(1.36 miles) 204(2.34 miles) 310(1.85 miles) 532(10.02 miles) 12(324.4 miles) 119(9.28 miles) 205(10.55 miles) 395(186.42 miles) 534(4.92 miles) 14(179.97 miles) 121(7.62 miles) 206(15.28 miles) 397(22.15 miles) 536(5.22 miles) 16(27.06 miles) 122(7.71 miles) 207(4.32 miles) 401(12.1 miles) 538(3.48 miles) 17(135.02 miles) 123(16.33 miles) 211(15.13 miles) 405(30.18 miles) 539(14.91 miles) 18(28.29 miles) 124(44.61 miles) 213(.22 miles) 409(3.77 miles) 542(57.16 miles) 19(12.53 miles) 125(23.63 miles) 215(6.19 miles) 410(107.07 miles) 543(1.05 miles) 20(395.16 miles) 127(26.87 miles) 221(25.92 miles) 411(13.28 miles) 544(8.89 miles) 21(179.26 miles) 128(.51 miles) 223(3.69 miles) 432(10.23 miles) 546(7.78 miles) 22(35.76 miles) 129(42.48 miles) 224(9.98 miles) 433(.87 miles) 547(9.53 miles) 23(65.91 miles) 131(1.99 miles) 225(11.31 miles) 500(22.15 miles) 548(13.78 miles) 24(78.71 miles) 141(25.99 miles) 231(72.07 miles) 501(13.82 miles) 599(1.73 miles) 25(121.13 miles) 142(35.2 miles) 240(40.05 miles) 502(7.57 miles) 702(9.19 miles) 26(133.59 miles) 150(10.91 miles) 241(25.08 miles) 503(53.05 miles) 704(.61 miles) 27(89.85 miles) 153(30.76 miles) 243(28.21 miles) 504(51.7 miles) 705(1.48 miles) 28(135.23 miles) 155(78.31 miles) 260(37.97 miles) 505(19.28 miles) 706(13.63 miles) 31(26.74 miles) 160(7.45 miles) 261(56.12 miles) 506(11.49 miles) 730(5.99 miles) 41(.31 miles) 161(32.2 miles) 262(20.04 miles) 507(43.42 miles) 821(25.09 miles) 82(132.5 miles) 162(17.34 miles) 263(9.11 miles) 508(32.74 miles) 823(5.14 miles) 90(297.5 miles) 163(3.33 miles) 270(9.84 miles) 509(29.24 miles) 900(15.28 miles) 92(7.96 miles) 164(14.59 miles) 271(8.37 miles) 510(13.05 miles) 902(12.28 miles) 96(6.68 miles) 165(20.25 miles) 272(18.91 miles) 512(12.04 miles) 903(10.02 miles) 97(250.59 miles) 166(4.93 miles) 274(1.89 miles) 513(3.33 miles) 904(16.9 miles) 99(49.09 miles) 167(28.53 miles) 278(2.76 miles) 515(7.73 miles) 906(2.64 miles) 100(4.54 miles) 169(25.22 miles) 281(10.2 miles) 516(16.47 miles) 970(10.14 miles) 101(365.47 miles) 170(3.57 miles) 282(4.9 miles) 518(3.4 miles) 971(10.37 miles) 103(16.48 miles) 171(3.75 miles) 283(14.52 miles) 519(.79 miles) Total Length
(Mainline Only) 104(31.55 miles) 172(34.93 miles) 285(5.03 miles) 520(12.73 miles) 105(48.54 miles) 173(11.51 miles) 290(17.7 miles) 522(24.31 miles) 6867.683 miles
11
Table 1.2: 2011 Washington State Routes and Total Mileage.
State Route # (Mileage)-2011 2(322.72 miles) 106(20.07 miles) 174(40.52 miles) 291(23.35 miles) 523(1.61 miles) 3(59.82 miles) 107(7.83 miles) 181(5.96 miles) 292(5.89 miles) 524(14.61 miles) 4(62.24 miles) 108(11.92 miles) 182(15.04 miles) 300(3.31 miles) 525(30.47 miles) 5(276.58 miles) 109(40.18 miles) 193(2.11 miles) 302(16.75 miles) 526(4.47 miles) 6(51.36 miles) 110(3.3 miles) 194(13.98 miles) 303(9.19 miles) 527(6.58 miles) 7(58.25 miles) 112(61.24 miles) 195(93.26 miles) 304(3.02 miles) 528(3.25 miles) 8(20.66 miles) 113(9.58 miles) 197(2.48 miles) 305(13.31 miles) 529(7.7 miles) 9(91.58 miles) 115(2.24 miles) 202(30.47 miles) 307(5.19 miles) 530(50.25 miles) 10(16.09 miles) 116(5.91 miles) 203(24.24 miles) 308(3.38 miles) 531(9.84 miles) 11(21.23 miles) 117(1.36 miles) 204(2.34 miles) 310(1.85 miles) 532(10.02 miles) 12(324.43 miles) 119(9.28 miles) 205(10.55 miles) 395(186.42 miles) 534(4.92 miles) 14(179.97 miles) 121(7.62 miles) 206(15.28 miles) 397(22.15 miles) 536(5.22 miles) 16(27.21 miles) 122(7.71 miles) 207(4.32 miles) 401(12.1 miles) 538(3.48 miles) 17(135.02 miles) 123(16.33 miles) 211(15.13 miles) 405(30.18 miles) 539(14.91 miles) 18(28.29 miles) 124(44.61 miles) 213(.22 miles) 409(3.77 miles) 542(57.16 miles) 19(12.53 miles) 125(23.63 miles) 215(6.19 miles) 410(107.07 miles) 543(1.05 miles) 20(395.16 miles) 127(26.87 miles) 221(25.92 miles) 411(13.28 miles) 544(8.89 miles) 21(179.26 miles) 128(.51 miles) 223(3.69 miles) 432(10.23 miles) 546(7.78 miles) 22(35.76 miles) 129(42.48 miles) 224(9.98 miles) 433(.87 miles) 547(9.53 miles) 23(65.91 miles) 131(1.99 miles) 225(11.31 miles) 500(22.15 miles) 548(13.78 miles) 24(78.71 miles) 141(25.99 miles) 231(72.07 miles) 501(13.82 miles) 599(1.73 miles) 25(121.13 miles) 142(35.2 miles) 240(40.05 miles) 502(7.57 miles) 702(9.19 miles) 26(133.59 miles) 150(10.91 miles) 241(25.08 miles) 503(53.05 miles) 704(.61 miles) 27(89.85 miles) 153(30.76 miles) 243(28.21 miles) 504(51.7 miles) 705(1.48 miles) 28(135.23 miles) 155(78.31 miles) 260(37.97 miles) 505(19.28 miles) 706(13.63 miles) 31(26.74 miles) 160(7.45 miles) 261(56.12 miles) 506(11.49 miles) 730(5.99 miles) 41(.31 miles) 161(32.2 miles) 262(20.04 miles) 507(43.42 miles) 821(25.09 miles) 82(132.5 miles) 162(17.34 miles) 263(9.11 miles) 508(32.74 miles) 823(5.08 miles) 90(297.48 miles) 163(3.33 miles) 270(9.84 miles) 509(29.24 miles) 900(15.28 miles) 92(7.96 miles) 164(14.59 miles) 271(8.37 miles) 510(13.05 miles) 902(12.28 miles) 96(6.68 miles) 165(20.25 miles) 272(18.91 miles) 512(12.04 miles) 903(10.02 miles) 97(250.59 miles) 166(4.93 miles) 274(1.89 miles) 513(3.33 miles) 904(16.9 miles) 99(48.39 miles) 167(28.53 miles) 278(2.76 miles) 515(7.73 miles) 906(2.64 miles) 100(4.54 miles) 169(25.22 miles) 281(10.2 miles) 516(16.47 miles) 970(10.14 miles) 101(365.47 miles) 170(3.57 miles) 282(4.9 miles) 518(3.4 miles) 971(10.37 miles) 103(16.48 miles) 171(3.75 miles) 283(14.52 miles) 519(.79 miles) Total Length
(Mainline Only) 104(31.55 miles) 172(34.93 miles) 285(5.03 miles) 520(12.73 miles) 105(48.54 miles) 173(11.51 miles) 290(17.7 miles) 522(24.31 miles) 6864.38 miles

12
Table 1.3: 2012 Washington State Routes and Total Mileage.
State Route # (Mileage)-2012 2(322.72 miles) 106(20.07 miles) 174(40.52 miles) 291(23.35 miles) 523(1.61 miles) 3(59.82 miles) 107(7.83 miles) 181(5.96 miles) 292(5.89 miles) 524(14.61 miles) 4(62.24 miles) 108(11.92 miles) 182(15.04 miles) 300(3.31 miles) 525(30.47 miles) 5(276.58 miles) 109(40.18 miles) 193(2.11 miles) 302(16.75 miles) 526(4.47 miles) 6(51.36 miles) 110(3.3 miles) 194(13.98 miles) 303(9.19 miles) 527(6.58 miles) 7(58.25 miles) 112(61.24 miles) 195(93.26 miles) 304(3.02 miles) 528(3.25 miles) 8(20.66 miles) 113(9.58 miles) 197(2.48 miles) 305(13.31 miles) 529(7.7 miles) 9(91.58 miles) 115(2.24 miles) 202(30.47 miles) 307(5.19 miles) 530(50.25 miles) 10(16.09 miles) 116(5.91 miles) 203(24.24 miles) 308(3.38 miles) 531(9.84 miles) 11(21.23 miles) 117(1.36 miles) 204(2.34 miles) 310(1.85 miles) 532(10.02 miles) 12(324.43 miles) 119(9.28 miles) 205(10.55 miles) 395(186.39 miles) 534(4.92 miles) 14(179.95 miles) 121(7.62 miles) 206(15.28 miles) 397(22.15 miles) 536(5.22 miles) 16(27.21 miles) 122(7.71 miles) 207(4.32 miles) 401(12.1 miles) 538(3.48 miles) 17(135.02 miles) 123(16.33 miles) 211(15.13 miles) 405(30.18 miles) 539(14.91 miles) 18(28.29 miles) 124(44.65 miles) 213(.22 miles) 409(3.77 miles) 542(57.16 miles) 19(12.53 miles) 125(23.63 miles) 215(6.19 miles) 410(107.07 miles) 543(1.05 miles) 20(395.16 miles) 127(26.87 miles) 221(25.92 miles) 411(13.28 miles) 544(8.89 miles) 21(179.26 miles) 128(.51 miles) 223(3.69 miles) 432(10.23 miles) 546(7.78 miles) 22(35.76 miles) 129(42.48 miles) 224(9.98 miles) 433(.87 miles) 547(9.53 miles) 23(65.91 miles) 131(1.99 miles) 225(11.31 miles) 500(22.15 miles) 548(13.78 miles) 24(78.71 miles) 141(25.99 miles) 231(72.07 miles) 501(13.82 miles) 599(1.73 miles) 25(121.13 miles) 142(35.2 miles) 240(40.05 miles) 502(7.57 miles) 702(9.19 miles) 26(133.59 miles) 150(10.91 miles) 241(25.08 miles) 503(53.05 miles) 704(.61 miles) 27(89.85 miles) 153(30.76 miles) 243(28.21 miles) 504(51.7 miles) 705(1.48 miles) 28(135.16 miles) 155(78.31 miles) 260(37.97 miles) 505(19.28 miles) 706(13.63 miles) 31(26.74 miles) 160(7.45 miles) 261(56.12 miles) 506(11.49 miles) 730(5.99 miles) 41(.31 miles) 161(32.2 miles) 262(20.04 miles) 507(43.42 miles) 821(25.09 miles) 82(132.5 miles) 162(17.34 miles) 263(9.11 miles) 508(32.74 miles) 823(5.08 miles) 90(297.48 miles) 163(3.33 miles) 270(9.84 miles) 509(29.24 miles) 900(15.28 miles) 92(7.96 miles) 164(14.59 miles) 271(8.37 miles) 510(13.05 miles) 902(12.28 miles) 96(6.68 miles) 165(20.25 miles) 272(18.91 miles) 512(12.04 miles) 903(10.02 miles) 97(250.59 miles) 166(4.93 miles) 274(1.89 miles) 513(3.33 miles) 904(16.9 miles) 99(48.39 miles) 167(28.53 miles) 278(2.76 miles) 515(7.73 miles) 906(2.64 miles) 100(4.54 miles) 169(25.22 miles) 281(10.2 miles) 516(16.47 miles) 970(10.14 miles) 101(365.47 miles) 170(3.57 miles) 282(4.9 miles) 518(3.4 miles) 971(10.37 miles) 103(16.48 miles) 171(3.75 miles) 283(14.52 miles) 519(.79 miles) Total Length
(Mainline Only) 104(31.55 miles) 172(34.93 miles) 285(5.03 miles) 520(12.73 miles) 105(48.54 miles) 173(11.51 miles) 290(17.7 miles) 522(24.31 miles) (6864.30 miles)
13
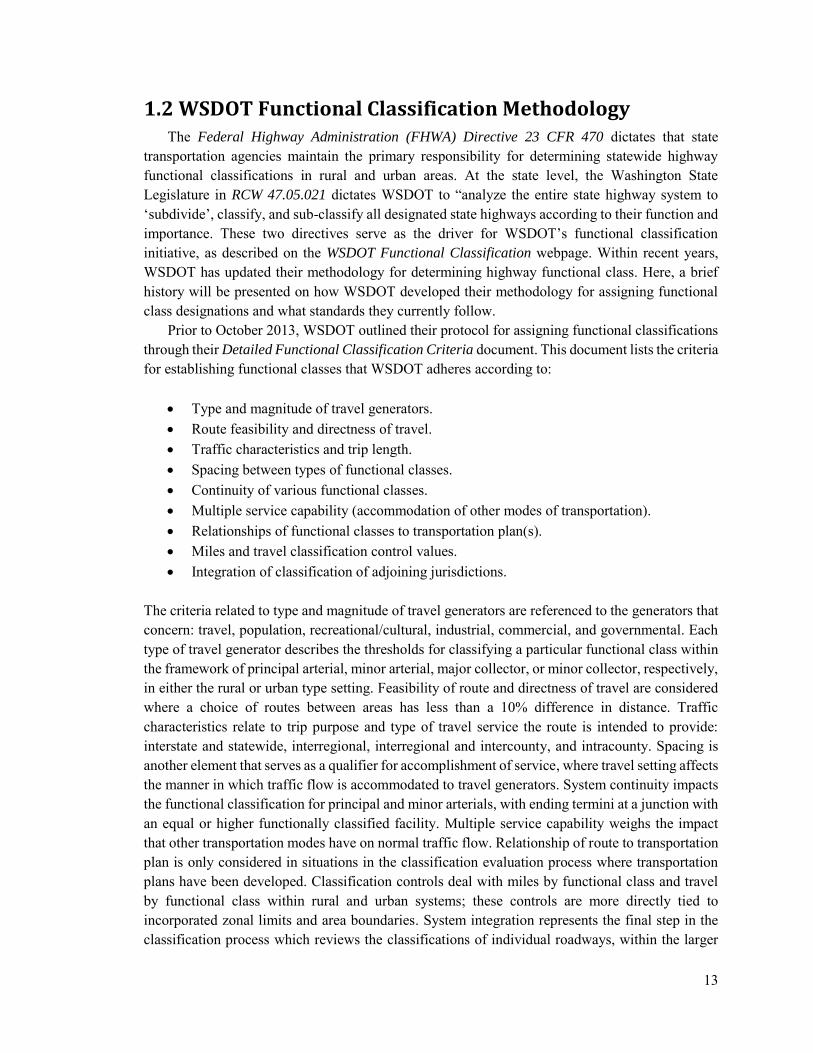
1.2 WSDOT Functional Classification Methodology The Federal Highway Administration (FHWA) Directive 23 CFR 470 dictates that state
transportation agencies maintain the primary responsibility for determining statewide highway functional classifications in rural and urban areas. At the state level, the Washington State Legislature in RCW 47.05.021 dictates WSDOT to “analyze the entire state highway system to ‘subdivide’, classify, and sub-classify all designated state highways according to their function and importance. These two directives serve as the driver for WSDOT’s functional classification initiative, as described on the WSDOT Functional Classification webpage. Within recent years, WSDOT has updated their methodology for determining highway functional class. Here, a brief history will be presented on how WSDOT developed their methodology for assigning functional class designations and what standards they currently follow.
Prior to October 2013, WSDOT outlined their protocol for assigning functional classifications through their Detailed Functional Classification Criteria document. This document lists the criteria for establishing functional classes that WSDOT adheres according to:
Type and magnitude of travel generators. Route feasibility and directness of travel. Traffic characteristics and trip length. Spacing between types of functional classes. Continuity of various functional classes. Multiple service capability (accommodation of other modes of transportation). Relationships of functional classes to transportation plan(s). Miles and travel classification control values. Integration of classification of adjoining jurisdictions.
The criteria related to type and magnitude of travel generators are referenced to the generators that concern: travel, population, recreational/cultural, industrial, commercial, and governmental. Each type of travel generator describes the thresholds for classifying a particular functional class within the framework of principal arterial, minor arterial, major collector, or minor collector, respectively, in either the rural or urban type setting. Feasibility of route and directness of travel are considered where a choice of routes between areas has less than a 10% difference in distance. Traffic characteristics relate to trip purpose and type of travel service the route is intended to provide: interstate and statewide, interregional, interregional and intercounty, and intracounty. Spacing is another element that serves as a qualifier for accomplishment of service, where travel setting affects the manner in which traffic flow is accommodated to travel generators. System continuity impacts the functional classification for principal and minor arterials, with ending termini at a junction with an equal or higher functionally classified facility. Multiple service capability weighs the impact that other transportation modes have on normal traffic flow. Relationship of route to transportation plan is only considered in situations in the classification evaluation process where transportation plans have been developed. Classification controls deal with miles by functional class and travel by functional class within rural and urban systems; these controls are more directly tied to incorporated zonal limits and area boundaries. System integration represents the final step in the classification process which reviews the classifications of individual roadways, within the larger
14
context of areas and regions, involving interagency collaborations to present a statewide classification of roadways.
In 2013, WSDOT, in cooperation with the FHWA, implemented procedures for adjusting the Urban Area (UA) boundaries due in part to the 2010 Census. Thus, the 2010 Census Adjusted
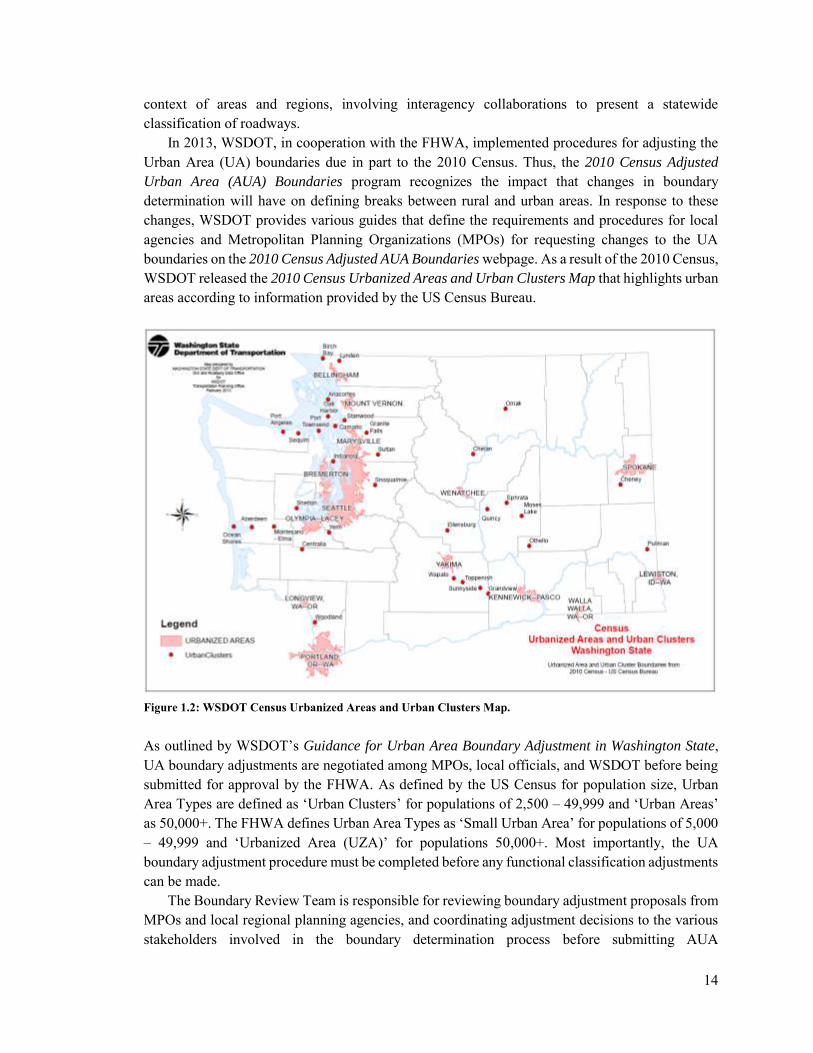
Urban Area (AUA) Boundaries program recognizes the impact that changes in boundary determination will have on defining breaks between rural and urban areas. In response to these changes, WSDOT provides various guides that define the requirements and procedures for local agencies and Metropolitan Planning Organizations (MPOs) for requesting changes to the UA boundaries on the 2010 Census Adjusted AUA Boundaries webpage. As a result of the 2010 Census, WSDOT released the 2010 Census Urbanized Areas and Urban Clusters Map that highlights urban areas according to information provided by the US Census Bureau.
Figure 1.2: WSDOT Census Urbanized Areas and Urban Clusters Map. As outlined by WSDOT’s Guidance for Urban Area Boundary Adjustment in Washington State, UA boundary adjustments are negotiated among MPOs, local officials, and WSDOT before being submitted for approval by the FHWA. As defined by the US Census for population size, Urban Area Types are defined as ‘Urban Clusters’ for populations of 2,500 – 49,999 and ‘Urban Areas’ as 50,000+. The FHWA defines Urban Area Types as ‘Small Urban Area’ for populations of 5,000 – 49,999 and ‘Urbanized Area (UZA)’ for populations 50,000+. Most importantly, the UA boundary adjustment procedure must be completed before any functional classification adjustments can be made.
The Boundary Review Team is responsible for reviewing boundary adjustment proposals from MPOs and local regional planning agencies, and coordinating adjustment decisions to the various stakeholders involved in the boundary determination process before submitting AUA

15
recommendations for FHWA approval. In the summer of 2013, the FHWA approved the resulting Highway Urban Area (HUA) boundaries as a result of the AUA process. Subsequently, all counties and MPOs affected by the HUA boundary changes had been asked to review their roads on August 13, 2013 and October 16, 2013, respectively. Figure 1.3 illustrates the basic steps required in the functional classification change request process.
Figure 1.3: WSDOT Functional Classification Request Flow Chart.

16
The functional classification process was scheduled to occur from July 3, 2013 to December 31, 2013 where arterial or collector changes in classification were to be submitted to WSDOT for approval and input into WSDOT systems.
WSDOT released the Guidelines for Amending Functional Classification in Washington State document in October 2013 to assist state authorities in the functional classification process. This document builds upon the Highway Functional Classification: Concepts, Criteria and Procedures,
2013 Edition by providing additional details and clarification to the methods and considerations involved in the process. This comprehensive guidance document explains the critical concepts and criteria while also providing some real-world examples of applying the functional classification methodology throughout the procedure. Some key changes covered in the Guidelines for Amending
Functional Classification in Washington State document includes: Upgrading the functional classification of rural/urban should predominantly be driven by
an actual change in function, as opposed to the location of an urban/rural boundary. All available classification categories now exist in both urban and rural areas, rather than
different codes systems for rural and urban areas that existed in the previous Highway Performance Monitoring System (HPMA).
For Washington State, the Functional Class (FC) numbering system is clarified by the FHWA by including additional subdivisions to ensure the symmetry in the categories for urban and rural classifications: Urban Collector subdivision included in Major and Minor Collector; Rural Other Principal Arterial subdivision into Other Freeway/Expressway and Other Principal Arterial.
The functional classification concepts are discussed to outline the role that the roadway segment plays in accommodating traffic flow in the network. Among the considerations that are referenced in in the Guidelines for Amending Functional Classification in Washington State, roadway access and mobility, efficiency of travel, collectors, access points, speed limit, route spacing, usage in terms of AADT volumes and Vehicle Miles of Travel (VMT), number of travel lanes, regional and statewide significance, and system continuity. The criteria that govern functional classification are presented in the different types of roadway functional class:
Interstates – the highest classification of arterials offering high levels of mobility. Other Freeways and Expressways – similar to interstates, but with separated directional
travel lanes, limited on- and off-ramp locations, and very limited at-grade intersections. Other Principal Arterials – provides high degree of mobility while also directly serving
abutting land uses in major centers of metropolitan areas. Minor Arterials – offers connectivity to higher arterial systems while also providing intra-
community continuity; typically provides high overall travel speeds in rural areas. Major and Minor Collectors – in general, major collector routes are longer in length with
lower connecting driveway densities, higher speed limits, greater space intervals, higher AADT, and more travel lanes than minor collectors.
Local Roads – accounts for the greatest mileage of all roadways; are not intended for long distance travel aside, from the origin/destination terminal of a trip, because of direct access to abutting land.

17
The decision process for assigning functional classifications stems from the characterization of the travel service provided by the roadway. The overall decision process in the functional classification system, as shown in the Guidelines for Amending Functional Classification in Washington State, is displayed in Figure 1.4.
Figure 1.4: Federal Functional Classification Decision Tree (FHWA).
It is important to note the emphasis on roadway function and service over the urban/rural distinction. While land development patterns are considered in the peripheral of the functional classification process, the determination should be explicitly based on actual functional criteria rather than the location of the roadway within an urban or rural context. On December 31, 2013 WSDOT submitted the boundaries and functional classification changes to the FHWA for approval, with the resulting data to be reported by June 15, 2014.
The methodology employed by WSDOT and FHWA incorporates various elements in the determination of roadway functional class. The many concepts and considerations in the evaluation process make the task of assigning functional classifications complex. If the functional classifications were to be limited to key elements, the task of assigning functional classifications will become simplified. This report will present two methods of assigning functional class: by population and by AADT. The motivation of isolating functional classifications to a single qualifier is two-fold: 1) to demonstrate a simplistic, efficient and effective methodology for assigning functional class and 2) illustrate the impact that functional classifications may have on safety modeling with the two methods of functional class determination. The ramifications of such a method would have wide ranging policy implications concerning WSDOT and FHWA functional class determination. That is, if this demonstration of assigning functional class proves to be both efficient and effective, then the various planning organizations and governing bodies may be able to consolidate their efforts to focus on the single-determining factor of functional class assignment. This would essentially streamline the request and review process that local, MPO, regional, and

18
state agencies must undergo in order to classify/reclassify roadway functional class to satisfy the directives set forth by the FHWA.
1.3 Organization of Report The report is organized in the following manner: Data Description – the four data sources of accident, roadway geometrics, AADT, and
functional class will be described in their source formats as they were obtained from WSDOT. The final database, expressed in the format of homogeneous roadway segments, will be explained and the parameters within the dataset will be presented.
Functional Classification (Centerline Miles) – geographical classifications of Rural, Small Urban, Small Urbanized, Large Urbanized, and Metropolitan will be described and the manner in which they are assigned according to population and AADT based metrics will be introduced. The method for validating the functional class centerline miles with the WS Highway Log centerline miles will be discussed. Comparison tables between the population and AADT based methods will be presented in several matrices in units of centerline miles.
Functional Classification (Segments) – the population and AADT comparison matrices will be expressed in counts of homogeneous roadway segments based on WSDOT’s definition of function class: Interstate, Principal Arterial, Minor Arterial, and Collector roadways. The matrices will evaluate segments of all functional class types as well as each functional class individually. The chapter will conclude by examining the comparison matrices for all Non-Interstate related homogeneous roadway segments.
Crash Summary – the report will conclude with crash summaries being shown for the crash descriptors of total crash count, impact location, collision severity, number of vehicles involved, and collision type. The tables will be presented in the first section on the basis of roadway functional class, followed by roadway geographic class in the second section. The functional classification tables will show the four functional class types disaggregated by Urban and Rural area. The geographic classification crash tables will compare and contrast the differences in the crash counts between the AADT and population based methods of assignment.
19
2.0 Data Description
All data has been provided by or obtained from WSDOT sources. The crash data analysis centers on the accident records for three years of raw crash data, 2010 to 2012, for all highways in Washington State. Roadway geometric data includes information pertaining to horizontal and vertical alignment, as well as lane and roadway and shoulder configurations. AADT information was extracted from the ArcGIS metadata files downloaded from WSDOT’s GeoData Distribution Catalog webpage; the final crash database utilizes the AADT obtained from Traffic Section counts. Similarly, State Route Functional Class data was also extracted from the ArcGIS metadata file from the same GeoData webpage. This data file provides both the federal functional class description and the state functional class description on a segmentation basis. Both the AADT counts and the State Route Functional Class data were cross-referenced with Washington State Highway Logs to account for and ensure consistency across all recorded highway segments. These four sources of data have been combined and integrated to create a homogeneous segments crash database segmented according to roadway geometric features. Of particular interest with the final crash database is the manner of assigning functional class designations by AADT and population counts. This chapter will describe the source data obtained from WSDOT, introduce the AADT and population based functional classification assignments, and will conclude with presentation of the complete three-year crash database.
2.1 Source Accident Data The accident data, which is the most extensive of all WSDOT provided data, is presented in
one single dataset that encompasses years 2010-2012. The accident data was requested from the WSDOT Transportation Data and GIS Office (TDGO), formally known as STCDO. This dataset includes 794,914 recorded observations for the 2010-2012 time frame with 210 columns. The extensive nature of the accident data encompasses information pertaining to collision identification, date and time, locational data, facility type, collision specific information, driver and passenger information, environmental conditions, and vehicle description. A portion of the crash descriptors refer to internal codes used by WSDOT and other agencies involved with crash investigation, however, most of the parameters thoroughly describe related factors that may have contributed or influenced the accident. This section will focus on the most pertinent crash related parameters while also briefly describe the general nature of the data recorded in the WSDOT source accident data. Table 2.1 on the subsequent pages lists all of the available parameters, in order of accident record, catalogued in the WSDOT source accident dataset.

20
Table 2.1: WSDOT Source Accident Dataset Parameters.
Parameter Collision Report Number City Secondary Trafficway 1 State Reportable Indicator City Secondary Trafficway 2 Intentional State Route ID Legal Intervention State Route Mile Post Medically Caused State Route Mile Post Ahead_Back Indicator
County Name State Route Accumulated Route Milepost or ARM
City Name State Route Number Collision Report Type State Route Related Roadway Type Date State Route Related Roadway Qualifier Year State Route History_Suspense Indicator Yearmo State Route Region Name Month Name State Route_State Functional Class Code Month Number State Route Urban Rural Day Of Week State Route Urban Rural Code Quarter Number State Route Federal Functional Class Name Full Time State Route Federal Functional Class Number
Full Time 24 State Route Vehicle 1 Compass Direction Description
Hour 24 State Route Vehicle 1 Compass Direction Code
Number Of Fatalities State Route Vehicle 1 Movement Description Number Of Injuries State Route Vehicle 1 Movement Code
Number Of Pedal Cyclists Involved State Route Vehicle 1 Milepost Direction Description
Number Of Pedestrians Involved State Route Vehicle 1 Milepost Direction Code
Number Of Motor Vehicles Involved State Route Diagram Collision Type Description
City Primary Trafficway State Route Diagram Collision Type Code
City Block Number State Route Vehicle 2 Compass Direction Description
City Intersecting Trafficway State Route Vehicle 2 Compass Direction Code
City Distance From Reference Point State Route Vehicle 2 Movement Description City Reference Point Miles_Feet Indicator State Route Vehicle 2 Movement Code City Compass Direction From Reference Point
State Route Vehicle 2 Milepost Direction Description
City Reference Point Name State Route Vehicle 2 Milepost Direction Code

21
Table 2.1 (continued): WSDOT Source Accident Dataset Parameters.
Parameter First Impact Location__Effective Date 1_1_10 for City_County and Misc Traf Most Severe Sobriety Type Code
First Impact Location Code__Effective Date 1_1_10 for City_County and Misc Traf First Collision Type
Second Impact Location__Effective Date 1_1_10 for City_County and Misc Traf First Collision Type Code
Second Impact Position Code__Effective Date 1_1/_10 for City_County and Misc Traf First Object Struck
County Road Number First Object Struck Code County Road Milepost Second Collision Type County Road Mile Post Ahead_Back Indicator Second Collision Type Code
County_Intersecting County Road Number Second Object Struck County_Intersecting County Road Milepost Second Object Struck Code County_Intersecting County Road Mile Post Ahead_Back Indicator Junction Relationship
County_Federal Functional Class Name Junction Relationship Code Miscellaneous Trafficway Type Weather Miscellaneous Trafficway Primary Trafficway Weather Code
Miscellaneous Trafficway Block Number Roadway Surface Condition Miscellaneous Trafficway Intersecting Trafficway Roadway Surface Condition Code
Miscellaneous Trafficway Distance From Reference Point Lighting Condition
Miscellaneous Trafficway Reference Point Miles_Feet Indicator Lighting Condition Code
Miscellaneous Trafficway Compass Direction Location Characteristics Miscellaneous Trafficway Reference Name Location Characteristics Code Miscellaneous Trafficway Number Roadway Characteristic Miscellaneous Trafficway Mile Post Roadway Characteristic Code Miscellaneous Trafficway Secondary Trafficway 1 Workzone
Miscellaneous Trafficway Secondary Trafficway 2 Workzone Code
Most Severe Injury Type Work Zone Construction Type Description Most Severe Injury Type Code Working Vehicle Ownership Desc Collision Severity Working Vehicle Ownership Code Collision Severity Code Investigative Agency Most Severe Sobriety Type Investigative Agency Code

22
Table 2.1 (continued): WSDOT Source Accident Dataset Parameters.
Parameter Ori # Contributing Circumstance 3 Reporting Agency Long Name Contributing Circumstance Code 3 Reporting Agency Short Name MV Driver Miscellaneous Action 1 Hazardous Material MV Driver Miscellaneous Action Code 1 Hazardous Material Code MV Driver Miscellaneous Action 2 Fire MV Driver Miscellaneous Action Code 2 Stolen MV Driver Miscellaneous Action 3 Hit And Run MV Driver Miscellaneous Action Code 3 Unit Number Vehicle Type Unit Type Description Vehicle Type Code Damage Threshold Met Indicator Towed Indicator Involved Person Type Government Owned Indicator Age Vehicle Make Gender Vehicle Model Air Bag Type Vehicle Style Ejection Status Vehicle Year Restraining System Type Traffic Control Type Description Helmet Use Posted Speed Limit Injury Type Roadway Type Description Seat Position Roadway Type Code Sobriety Level Vehicle Classification Alcohol Test Result Vehicle Use Dre Assessment Description 1 Registered State Dre Assessment Code 1 Vehicle Action 1 Dre Assessment Description 2 Vehicle Condition 1 Dre Assessment Code 2 Vehicle Condition Code 1 Liability Insurance Vehicle Condition 2 Unlicensed Driver Vehicle Condition Code 2 On Duty Indicator Vehicle Condition 3 Pedestrian_Pedalcyclist Clothing Visibility Type Vehicle Condition Code 3
Pedestrian Pedacyclist Was Using Sequence Of Event 1 Pedestrian Pedacyclist Type Sequence Of Event Code 1 Pedacyclist Actions Sequence Of Event 2 Pedestrian Actions Sequence Of Event Code 2 Contributing Circumstance 1 Sequence Of Event 3 Contributing Circumstance Code 1 Sequence Of Event Code 3 Contributing Circumstance 2 Sequence Of Event 4 Contributing Circumstance Code 2 Sequence Of Event Code 4

23
Table 2.1 (continued): WSDOT Source Accident Dataset Parameters.
Parameter Compass Direction From Gvwr Compass Direction To Hazardous Material Name Commercial Carrier Address Interstate Intrastate Commercial Carrier City Name Number Of Axles Commercial Carrier State Code Placard Number Commercial Carrier Zip Code Placard Suffix Type Code Commercial Vehicle Cargo Body Type Usdot Number Commercial Vehicle Class State Plane X Commercial Vehicle Name Source State Plane Y
The WSDOT identification parameters are based on unique identifiers assigned to each crash
observation, reflected by such descriptors as: Collision Report Number, State Reportable Indicator, and Collision Report Type. The Collision Report Number serves as the identification number to distinguish each observation. As such, repeated Collision Report Numbers corresponds to multiple persons or vehicles involved in a single crash. Additional information related to the type of Collision Report is described in location-related identifiers such as County and City name. All observations in the three-year crash dataset are listed as having Collision Report type of City Street, County Road, Miscellaneous Trafficway, or State Route.
Date and Time information listed for each observation is extensive in that the date and time descriptors are expressed in various ways. For example, the Date of the accident is also further described by separate columns such as Month, Day of Week, and Quarter Number, which is more indicative of the time of year to imply seasonal considerations.
Location related information is of particular importance for matters related to assigning crash counts to the correct corresponding roadway segment within the proper milepost limits. Each recorded crash is assigned milepost markers and route identifiers. The milepost parameters include State Route Mile Post, State Route Mile Post Ahead/Back Indicator, and State Route ARM. In relation to the final crash database, the State Route ARM is the basis that the segments are disaggregated. Additionally, XY coordinate information is also available for some crash observations that provide a point location for the accident.
Roadway facility type data is expressed in attributes that describe the roadway or refer to the classification of the roadway where the accident occurred. State Route Related Roadway Type (RRT) and State Route Related Roadway Qualifier (RRQ) classify the roadway facility based on the identifying acronyms established by WSDOT. Perhaps most relevant for the purposes of this study, the functional class codes that describe the roadway are listed in the columns for State Route State Functional Class Code, State Route Urban Rural, State Route Federal Functional Class Name, and State Route Federal Functional Class Number. The State Functional Class Code consists of a two-character identification code with the prefix of R or U signifying rural or urban arterial classification. The numerical value associated with the R/U prefix is predicated on the classification code consistent with WSDOT and FHWA guidelines. The Urban Rural column simply lists whether the facility is considered as an urban or rural arterial, while the Federal Functional Class Name uses the FHWA standards for naming the facility (see FHWA Directive 23 CFR 470).
24
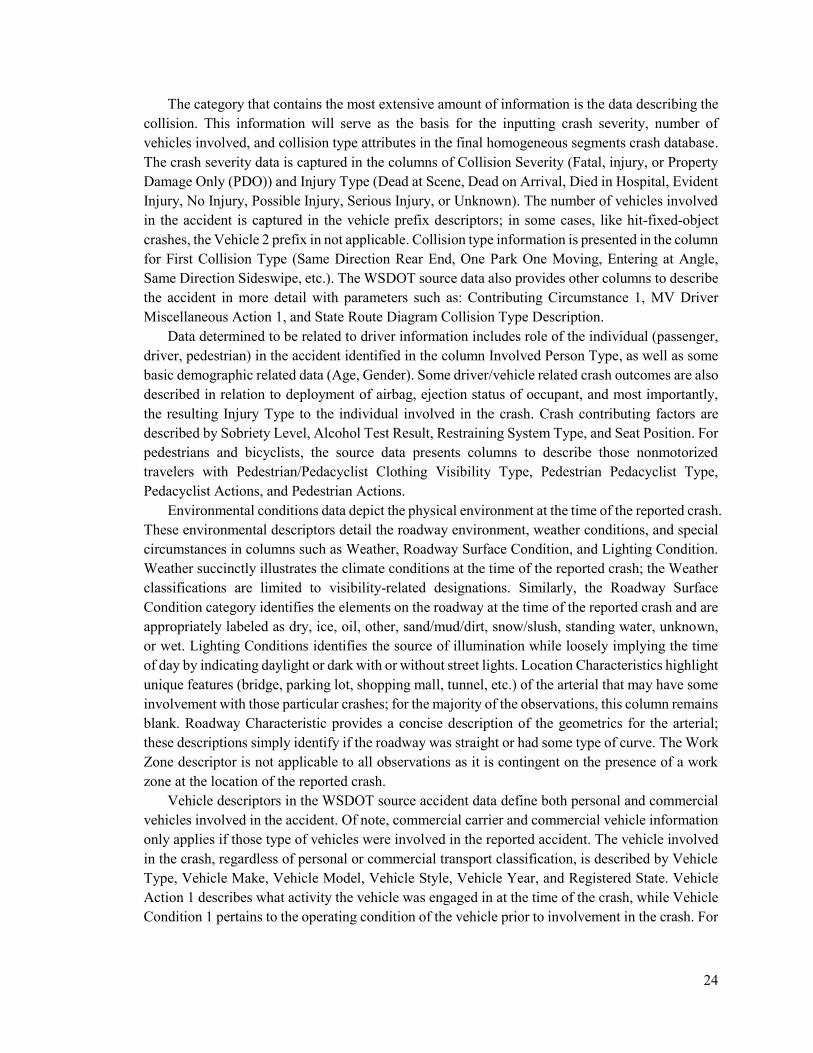
The category that contains the most extensive amount of information is the data describing the collision. This information will serve as the basis for the inputting crash severity, number of vehicles involved, and collision type attributes in the final homogeneous segments crash database. The crash severity data is captured in the columns of Collision Severity (Fatal, injury, or Property Damage Only (PDO)) and Injury Type (Dead at Scene, Dead on Arrival, Died in Hospital, Evident Injury, No Injury, Possible Injury, Serious Injury, or Unknown). The number of vehicles involved in the accident is captured in the vehicle prefix descriptors; in some cases, like hit-fixed-object crashes, the Vehicle 2 prefix in not applicable. Collision type information is presented in the column for First Collision Type (Same Direction Rear End, One Park One Moving, Entering at Angle, Same Direction Sideswipe, etc.). The WSDOT source data also provides other columns to describe the accident in more detail with parameters such as: Contributing Circumstance 1, MV Driver Miscellaneous Action 1, and State Route Diagram Collision Type Description.
Data determined to be related to driver information includes role of the individual (passenger, driver, pedestrian) in the accident identified in the column Involved Person Type, as well as some basic demographic related data (Age, Gender). Some driver/vehicle related crash outcomes are also described in relation to deployment of airbag, ejection status of occupant, and most importantly, the resulting Injury Type to the individual involved in the crash. Crash contributing factors are described by Sobriety Level, Alcohol Test Result, Restraining System Type, and Seat Position. For pedestrians and bicyclists, the source data presents columns to describe those nonmotorized travelers with Pedestrian/Pedacyclist Clothing Visibility Type, Pedestrian Pedacyclist Type, Pedacyclist Actions, and Pedestrian Actions.
Environmental conditions data depict the physical environment at the time of the reported crash. These environmental descriptors detail the roadway environment, weather conditions, and special circumstances in columns such as Weather, Roadway Surface Condition, and Lighting Condition. Weather succinctly illustrates the climate conditions at the time of the reported crash; the Weather classifications are limited to visibility-related designations. Similarly, the Roadway Surface Condition category identifies the elements on the roadway at the time of the reported crash and are appropriately labeled as dry, ice, oil, other, sand/mud/dirt, snow/slush, standing water, unknown, or wet. Lighting Conditions identifies the source of illumination while loosely implying the time of day by indicating daylight or dark with or without street lights. Location Characteristics highlight unique features (bridge, parking lot, shopping mall, tunnel, etc.) of the arterial that may have some involvement with those particular crashes; for the majority of the observations, this column remains blank. Roadway Characteristic provides a concise description of the geometrics for the arterial; these descriptions simply identify if the roadway was straight or had some type of curve. The Work Zone descriptor is not applicable to all observations as it is contingent on the presence of a work zone at the location of the reported crash.
Vehicle descriptors in the WSDOT source accident data define both personal and commercial vehicles involved in the accident. Of note, commercial carrier and commercial vehicle information only applies if those type of vehicles were involved in the reported accident. The vehicle involved in the crash, regardless of personal or commercial transport classification, is described by Vehicle Type, Vehicle Make, Vehicle Model, Vehicle Style, Vehicle Year, and Registered State. Vehicle Action 1 describes what activity the vehicle was engaged in at the time of the crash, while Vehicle Condition 1 pertains to the operating condition of the vehicle prior to involvement in the crash. For

25
instance, if the vehicle’s headlights were not in operating condition prior to the crash, it may be a contributing factor to causing the accident.
2.2 Source Roadway Geometrics Data The WSDOT TDGO provided the roadway data for horizontal alignment, vertical alignment,
number of lanes and roadway width, and shoulder width information. These files compile the geometric data for 2010 and 2011; the 2012 geometric data utilized the same information as 2011 since 2012 geometric data was unavailable at the time of request. The roadway geometric data will be included in the complete crash database that contains elements of horizontal and vertical alignment, number of lanes and roadway width, and shoulder width.
The WSDOT horizontal alignment data lists the main components of each horizontal curve captured in 19 columns. All of the horizontal curves listed progress in the increasing mile post direction expressed in segments by mile post and includes 17,769 observations for the 2010 dataset, and 17,870 observations for 2011, an increase of 101 additional curves in a two year time span. The horizontal curve elements included in this dataset are listed in Table 2.2. Table 2.2: WSDOT Horizontal Alignment Data.
Horizontal Alignment Attribute Definition LRS_Date Date input into Linear Referencing System SRID State Route ID SR State Route RRT Related Route Type RRQ Related Route Qualifier BegARM Beginning Accumulated Route Mileage EndARM Ending Accumulated Route Mileage BegMP Beginning Mile Post BegAB Beginning Mile Post Ahead/Back EndMP Ending Mile Post EndAB Ending Mile Post Ahead/Back HorizontalCurvePointOfTangencyArm Horizontal Curve PT Accumulated Route Mileage HorizontalCurvePointOfCurvatureArm Horizontal Curve PC Accumulated Route Mileage HorizontalCurveType Horizontal Curve or Angle HorizontalCurveRadius Radius of Curve (R) HorizontalCurveMaximum(Super)Elevation Max Super Elevation (e) HorizontalCurveLength Length of Curve (L) in feet HorizontalCurveDirection Curve Left or Curve Right HorizontalCurveCentralAngle Angle of Deflection (∆) in degrees
The horizontal curve data is expressed on a segment basis according to accumulated route
mileage (ARM) markers. The addition of 101 observations between 2010 and 2011 is reflected in the difference among average values for horizontal alignment characteristics between 2010 and 2011, as shown in Table 2.3 on the next page.

26
Table 2.3: Average WSDOT Horizontal Alignment Values for 2010 and 2011.
Year 2010 2011 HorizontalCurvePointOfTangencyArm 69.79 69.42 HorizontalCurvePointOfCurvatureArm 69.68 69.30 HorizontalCurveRadius 2265.28 2274.17 HorizontalCurveMaximum(Super)Elevation 0.01 0.01 HorizontalCurveLength 585.43 584.53 HorizontalCurveCentralAngle 2609.74 2607.78
Between the two databases, the maximum values are consistent from 2010 to 2011 and report
the same locations. The maximum curve radius identified is designed at 70,000 feet between ARM 67.02 and 67.32 along SR 82. The maximum super elevation of 0.2 is located along SR 3 between ARM 53.19 and 53.48. The greatest curve length of 12,683 feet is located between ARM 104.63 and 107.03 on SR 82. The largest central angle is located on a horizontal curve that spans from ARM 0.08 to 0.22 on SR 167.
The vertical alignment data includes all pertinent vertical curvature information for all State Routes described in 23 columns. For 2010, there are 34,260 recorded vertical curves while 2011 maintains 34,426 observations, an increase of 226 additional vertical curves over the course of two years. This WSDOT provided vertical alignment data uses different nomenclature to reference all vertical curve attributes to mile post markers. For instance, instead of using the definition of Vertical Point of Curvature (VPC), the raw data references the Beginning Vertical Curve Accumulated Route Mileage. A description of the WSDOT vertical alignment data is displayed in Table 2.4 on the following page.

27
Table 2.4: WSDOT Vertical Alignment Data.
Vertical Alignment Attribute Definition LRS_Date Date input into Linear Referencing System SRID State Route ID State Route Number State Route Related Route Type Related Route Type Code Related Route Qualifier Related Route Qualifier Code Begin ARM Beginning Accumulated Route Mileage End ARM Ending Accumulated Route Mileage Begin SRMP Beginning State Route Mile Post Begin AB Beginning Mile Post Ahead/Back End SRMP Ending State Route Mile Post End AB Ending Mile Post Ahead/Back Begin SRMP2 Beginning State Route Mile Post (Ahead/Back) End SRMP2 Ending State Route Mile Post (Ahead/Back) Related Roadway Type Description RRT Definition
State Route Description State Route and Cross Street RRT_RRQ RRQ Definition Vertical Curve Bvc Arm Beginning Vertical Curve Accumulated Route Mileage Vertical Curve Vpi Arm Vertical Point of Intersection Accumulated Route Mileage Vertical Curve Evc Arm Ending Vertical Curve Accumulated Route Mileage Vertical Curve Type Crest or Sag Curve Vertical Curve Length Length of Curve (ft) Vertical Curve Percent Grade Ahead Grade (%) ahead of Curve
Vertical Curve Percent Grade Back Grade (%) back of Curve
Although the recorded number of vertical curves increases by 226 from 2010 to 2011, there is
no calculated difference among the average values of all observations for vertical curve length and vertical curve percent grade ahead or back between the two years (315 feet, 0, and 0 respectively). The maximum recorded value for vertical curve length is 6,700 feet located along SR 82 between ARM 106.24 and 107.51. The steepest vertical curve percent grade ahead is 16.13% along an Angle Point Curve at ARM 28.65 of SR 503; similarly, the steepest vertical curve percent grade back is located at ARM 28.66 of the same route. These maximum values are found at the same locations for the 2010 and 2011 datasets.
The WSDOT data for the number of lanes and roadway width information differentiates between the increasing and decreasing mile post directions for the State Routes. The 2010 dataset contains 8,519 observations while the 2011 dataset lists 8,549 rows, and increase of 30 observations over the period of two years. The WSDOT data captured in the 16 columns describing number of lanes and roadway information is listed in Table 2.5 on the next page.
28
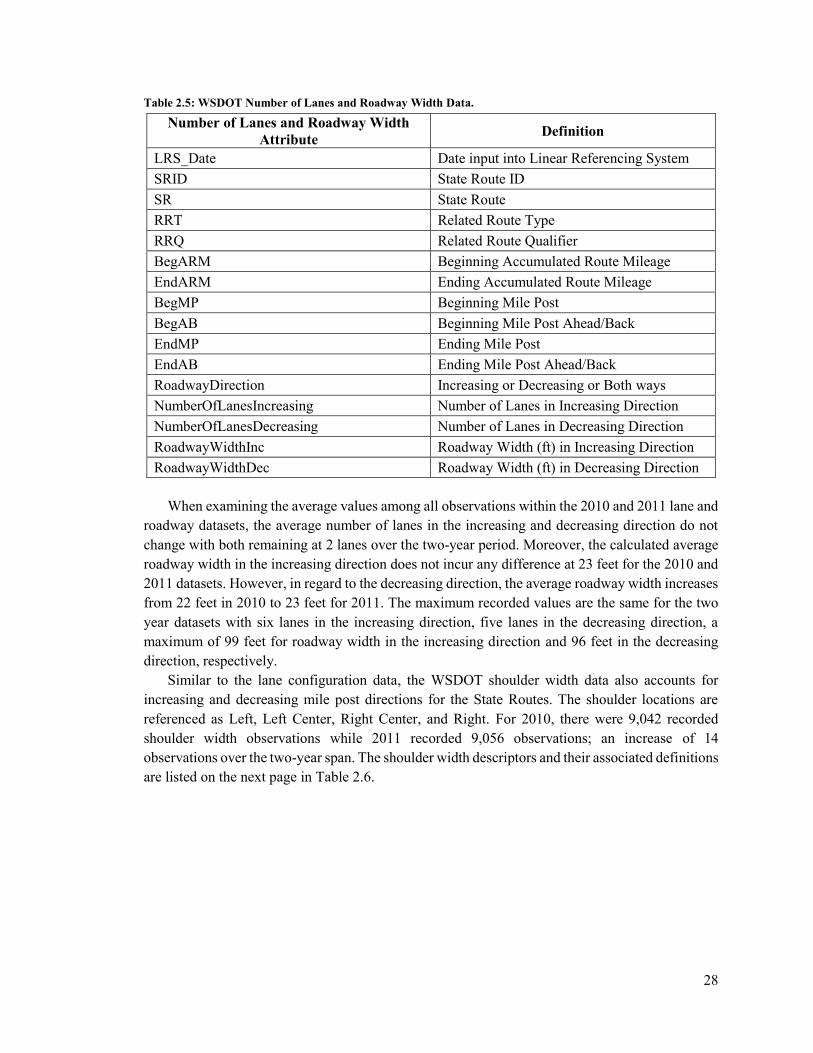
Table 2.5: WSDOT Number of Lanes and Roadway Width Data.
Number of Lanes and Roadway Width Attribute Definition
LRS_Date Date input into Linear Referencing System SRID State Route ID SR State Route RRT Related Route Type RRQ Related Route Qualifier BegARM Beginning Accumulated Route Mileage EndARM Ending Accumulated Route Mileage BegMP Beginning Mile Post BegAB Beginning Mile Post Ahead/Back EndMP Ending Mile Post EndAB Ending Mile Post Ahead/Back RoadwayDirection Increasing or Decreasing or Both ways NumberOfLanesIncreasing Number of Lanes in Increasing Direction NumberOfLanesDecreasing Number of Lanes in Decreasing Direction RoadwayWidthInc Roadway Width (ft) in Increasing Direction RoadwayWidthDec Roadway Width (ft) in Decreasing Direction
When examining the average values among all observations within the 2010 and 2011 lane and
roadway datasets, the average number of lanes in the increasing and decreasing direction do not change with both remaining at 2 lanes over the two-year period. Moreover, the calculated average roadway width in the increasing direction does not incur any difference at 23 feet for the 2010 and 2011 datasets. However, in regard to the decreasing direction, the average roadway width increases from 22 feet in 2010 to 23 feet for 2011. The maximum recorded values are the same for the two year datasets with six lanes in the increasing direction, five lanes in the decreasing direction, a maximum of 99 feet for roadway width in the increasing direction and 96 feet in the decreasing direction, respectively.
Similar to the lane configuration data, the WSDOT shoulder width data also accounts for increasing and decreasing mile post directions for the State Routes. The shoulder locations are referenced as Left, Left Center, Right Center, and Right. For 2010, there were 9,042 recorded shoulder width observations while 2011 recorded 9,056 observations; an increase of 14 observations over the two-year span. The shoulder width descriptors and their associated definitions are listed on the next page in Table 2.6.

29
Table 2.6: WSDOT Shoulder Width Data.
Shoulder Widths Attribute Definition LRS_Date Date input into Linear Referencing System SRID State Route ID SR State Route RRT Related Route Type RRQ Related Route Qualifier BegARM Beginning Accumulated Route Mileage EndARM Ending Accumulated Route Mileage BegMP Beginning Mile Post BegAB Beginning Mile Post Ahead/Back EndMP Ending Mile Post EndAB Ending Mile Post Ahead/Back RoadwayDirection Increasing or Decreasing or Bothways ShoulderWidthLeft Shoulder Width (ft) of outer portion of Decreasing Direction ShoulderWidthLeftCenter Shoulder Width (ft) of median side of Decreasing Direction ShoulderWidthRightCenter Shoulder Width (ft) of median side of Increasing Direction ShoulderWidthRight Shoulder Width (ft) of outer portion of Increasing Direction
There exists no calculated difference between the average and maximum recorded shoulder
widths values for the 2010 and 2011 datasets. The average shoulder width left and shoulder width right is calculated to be 5 feet, while the average shoulder width left center and right center remains at 1 foot. A maximum of 37 feet is the distance of the left shoulder width, while the right shoulder width maximum value is 40 feet. The greatest shoulder width for the left center and right center is 20 and 36 feet respectively.
2.3 Source AADT Data The WSDOT GeoData Distribution Catalog webpage offers publically available data for
download organized by transportation features, political and administrative features, geographic reference data, and environmental features. This downloadable data is provided in the form of ESRI shapefiles, which also includes the metadata files that accompany the shapefile information. Under the transportation features category, the Traffic Count Data file was downloaded from the GeoData Catalog webpage. Since this study examines highway crashes on a segmentation basis, the TPT Traffic Sections data was selected for download as opposed to the TPT Traffic Counts file which provides count information at specific point locations. The files selected for download include the TPT Traffic Sections data for years 2010, 2011, and 2012. The metadata files were extracted via ArcGIS and report the following information shown in Table 2.7.

30
Table 2.7: WSDOT TPT Traffic Sections Data.
AADT Attribute Definition FID Internal Feature Number (sequential) Shape * Feature Geometry OBJECTID Internal Feature Number (sequential) SRID State Route Identifier Begin_ARM Beginning Accumulated Route Mileage End_ARM Ending Accumulated Route Mileage Location Milepost Count Locations and Ahead/Back indicator Year_20** WSDOT calculated AADT for specified year LOC_ERROR Error (if any) produced in LRS at time of input RteType Route Type: IS (Interstate), SR (State Route), US (United States) Shape_Leng Shape Length (coordinate defining measure)
The WSDOT TPT Traffic Sections data contains 5,388 counts for year 2010, 5,290 counts for
year 2011, and 5,236 counts for year 2012. From this source data, the AADT counts will be input into the 2010-2012 crash database according to the segments defined by the mile post locations. The varying number of segments for each year does not impact the AADT inputs into the final crash database because the homogeneous segments are more finite in length. The homogeneous segments captured within the WSDOT TPT Traffic Sections data are input with the associated AADT values reported for those segment milepost limits.
2.4 Source Functional Classification Data Also from the WSDOT GeoData Distribution Catalog webpage, the Functional Class, State
Routes file under the transportation features category was downloaded for inclusion into the final crash database. The functional class observations were input by WSDOT based on the procedures previously explained in Section 1.2 WSDOT Functional Classification Methodology. Following the same process as the AADT data, the Functional Class, State Routes metadata file was extracted through ArcGIS to report the following information displayed on the following page in Table 2.8:

31
Table 2.8: WSDOT Functional Class State Routes Data.
Functional Class Attribute Definition OBJECTID * Internal Feature Number (sequential) Shape * Feature Geometry LRS_Date Date input into Linear Referencing System BegARM Beginning Accumulated Route Mileage EndARM Ending Accumulated Route Mileage BegMP Beginning State Route Milepost BegAB Beginning State Route Milepost Ahead or Back EndMP Ending State Route Milepost EndAB Ending State Route Milepost Ahead or Back Direction Increasing or Decreasing Milepost direction FederalFunctionalClassCode Federal Highway Administration Numerical Code FederalFunctionalClassDesc Federal Highway Administration Code Definition StateFunctionalClassCode WSDOT Functional Class Code (Alphanumeric) StateFunctionalClassDesc WSDOT Functional Class Code Definition LOC_ERROR Error (if any) produced in LRS at time of input RouteID WSDOT Route Identifier StateRouteNumber Washington State Route Number RelRouteType State Route Related Roadway Type RelRouteQual State Route Related Roadway Qualifier Shape.STLength() Shape Length (coordinate defining measure) Shape_Length Shape Length (coordinate defining measure)
The available WSDOT Functional Class State Routes downloadable data only presented the
functional class information for 2012; the 2010 and 2011 was unavailable for download on the GeoData Distribution Catalog website. The assigned functional class categories are shown on a segment basis according to accumulate route mileage and state route milepost markers. The 2012 dataset has 3,956 observations that show both the federal functional class designation as well as the state functional class designation for each stretch of roadway. Like the AADT data, the homogeneous segments captured within the WSDOT Functional Class State Route segments are input with the associated functional classes reported for those segment milepost limits.
The federal and state functional class designations from this dataset have been assigned according to standards and procedures established by the Federal Highway Administration and WSDOT. The homogenous segments crash database will show how the functional class designations will differ segment to segment if the designations were based on AADT and population thresholds. When assigning functional class designations by AADT and population counts, few changes in functional class labels were observed across the three year period of 2010 to 2012 for any individual segment. This would indicate that the federal and state functional class designations did not considerably change across the milepost segments within the WSDOT Functional Class State Routes downloadable data from 2010 to 2012.

32
2.5 Homogeneous Segments Crash Database 2010-2012 The development of the homogeneous segments crash database incorporates accident
information, roadway geometrics, AADT counts, and functional class. The manner in which the final database was established began by first determining the segment lengths. The roadway segments were defined as segments that maintain consistency in roadway characteristics for the length of a particular stretch of roadway, with a new segment being defined when any of the roadway characteristics change. The roadway characteristics that determine the segmentation process are the roadway geometrics which include the WSDOT source roadway geometrics data described in Section 2.2: horizontal alignment, vertical alignment, number of lanes and roadway width, and shoulder width. The shortest segment length that maintains consistent roadway geometrics measures 0.009 miles in length. The total number of observations for the three year period of 2010 to 2012 is 323,085 segments of homogenous roadway, with 107,695 segments for each year.
A total of 97 parameters are captured in the database which covers roadway geometrics, crash type, accident severity, AADT counts, and functional class. The data and information was pulled from the sourced WSDOT data and integrated into the homogeneous roadway segment. The observations from the source data were input into the homogenous roadway segment format based on milepost markers recorded in the source WSDOT data. The WSDOT source accident data was input as counts or number of occurrences that occurred on any specific homogeneous roadway segment for each of the 2010 to 2012 crash years. The manner of accident tabulation for any particular roadway segment was determined by the recorded milepost location from the crash observations. The reported crashes were assigned to its corresponding homogeneous segment if the milepost location fell within the homogeneous segment milepost limits. These counts were accumulated for total crash count, impact location, collision severity, number of vehicles involved, and collision type on a segment-by-segment basis.
As described earlier, the roadway geometric data served as the basis for segmentation when creating the homogeneous roadway segments crash database. Not all segments contain complete roadway geometric information; these cells with omitted geometric information within the dataset were populated with the value -99 to signify missing data. Additionally, roadway geometric information was unavailable for year 2012; therefore, the roadway geometric information from 2011 was used as the basis for 2012. The segmentation process for homogeneous segments was standardized across the three year period; that is to say, the limits and attributes for the homogeneous segments from 2010 are the same for 2011 and 2012.
Section AADT information was used from the Annual Average Daily Traffic volumes along the state highway system in the WSDOT geospatial database, and matched to each segment according to milepost. Each homogenous segment was then classified based on one of five geographic classes: Rural, Small Urban, Small Urbanized, Large Urbanized, and Metropolitan. It was observed that areas designated as Rural did not always have low AADT levels and not all Metropolitan segments displayed high levels of AADT. In order to obtain finer resolution on the five geographical classes and to compare the definitions at the segment level, two sets of classifications were made based on section AADT and census population data.
Table 2.9 on the following pages lists the parameters in the homogenous roadway segments database with a brief description for each one.

33
Table 2.9: Homogeneous Roadway Segments Database Parameters.
Parameter Description SR State Route BegARM Beginning Accumulated Route Mileage EndARM Ending Accumulated Route Mileage Year Crash Year NumberOfLanesIncreasing Number of Lanes in Increasing Direction NumberOfLanesDecreasing Number of Lanes in Decreasing Direction RoadwayWidthInc Roadway Width (ft) in Increasing Direction RoadwayWidthDec Roadway Width (ft) in Decreasing Direction
ShoulderWidthLeft Shoulder Width (ft) of outer portion of Decreasing Direction
ShoulderWidthLeftCenter Shoulder Width (ft) of median side of Decreasing Direction
ShoulderWidthRightCenter Shoulder Width (ft) of median side of Increasing Direction
ShoulderWidthRight Shoulder Width (ft) of outer portion of Increasing Direction
HorizontalCurvePointOfTangencyArm Horizontal Curve PT Accumulated Route Mileage
HorizontalCurvePointOfCurvatureArm Horizontal Curve PC Accumulated Route Mileage
HorizontalCurveRadius Radius of Curve (R) HorizontalCurveMaximum(Super)Elevation Max Super Elevation (e) HorizontalCurveLength Length of Curve (L) in feet HorizontalCurveCentralAngle Angle of Deflection (∆) in degrees
Vertical Curve Bvc Arm Beginning Vertical Curve Accumulated Route Mileage
Vertical Curve Vpi Arm Vertical Point of Intersection Accumulated Route Mileage
Vertical Curve Evc Arm Ending Vertical Curve Accumulated Route Mileage
Vertical Curve Length Length of Curve (ft) Vertical Curve Percent Grade Ahead Grade (%) ahead of Curve Vertical Curve Percent Grade Back Grade (%) back of Curve
totalacc total count of roadside, roadway, and other location crashes in segment
rdside count of roadside crashes in segment rdway count of roadway crashes in segment othloc count of other location crashes in segment
pdo count of reported Property Damage Only from crashes in segment

34
Table 2.9 (continued): Homogeneous Roadway Segments Database Parameters.
Parameter Description pinj count of reported Possible Injury from crashes in segment evi count of reported Evident Injury from crashes in segment sinj count of reported Serious Injury from crashes in segment fatal count of reported Fatal from crashes in segment unknown count of reported Unknown Injury from crashes in segment hiinj count of crashes in segment reporting more than one injury justinj count of crashes in segment reporting one injury loinj count of crashes in segment reporting no injuries veh1 count of crashes in segment involving 1 vehicle veh2 count of crashes in segment involving 2 vehicles veh3 count of crashes in segment involving 3 vehicles veh4 count of crashes in segment involving 4 vehicles veh5 count of crashes in segment involving 5 vehicles othveh count of crashes in segment involving more than 5 vehicles rend count of Rear End type crashes in segment trend count of Turning Rear End type crashes in segment sdirtsw count of Same Direction Turning Sideswipe type crashes in segment sdirsw count of Same Direction Sideswipe type crashes in segment sdirt count of Same Direction Turning type crashes in segment sdiroth count of Same Direction Others type crashes in segment headon count of Head On type crashes in segment odirsw count of Opposite Direction Sideswipe type crashes in segment odirt count of Opposite Direction Turning type crashes in segment fobj count of Fixed Object type crashes in segment eang count of Entering At Angle type crashes in segment oturn count of Overturned type crashes in segment animal count of Animal type crashes in segment bicycle count of Bicycle type crashes in segment ped count of Pedestrian type crashes in segment oneparkonemoving count of One Parked, One Moving type crashes in segment entlvdr count of Entering/Leaving Driveway type crashes in segment other count of crashes classified as Other in segment nostate count of crashes classified as Not Stated in segment StateFunctionalClass Rural or Urban class indicator FederalFunctionalClass Federal Functional Class including 'Other Principal Arterial' Functional class(4level)
Federal Functional Class 'Other Principal Arterial' captured in 'Principal Arterial'
Interstate indicator for Interstate Functional Class type Other Freeway/Expressway indicator for Other Freeway/Expressway Functional Class type

35
Table 2.9 (continued): Homogeneous Roadway Segments Database Parameters.
Parameter Description Other Principal Arterial indicator for Other Principal Arterial Functional Class type Minor Arterial indicator for Minor Arterial Functional Class type Major Collector indicator for Major Collector Functional Class type AADT WSDOT calculated AADT for specified year Functional Class_AADT based AADT based Geographic Classification
Functional Class_Population based Population based Geographic Classification
Rural Rural indicator for Rural AADT class and Rural population class
Small Urban Rural indicator for Small Urban AADT class and Rural population class
Small Urbanized Rural indicator for Small Urbanized AADT class and Rural population class
Large Urbanized Rural indicator for Large Urbanized AADT class and Rural population class
Metropolitan Rural indicator for Metropolitan AADT class and Rural population class
Rural Small Urban indicator for Rural AADT class and Small Urban population class
Small Urban Small Urban indicator for Small Urban AADT class and Small Urban population class
Small Urbanized Small Urban
indicator for Small Urbanized AADT class and Small Urban population class
Large Urbanized Small Urban
indicator for Large Urbanized AADT class and Small Urban population class
Metropolitan Small Urban indicator for Metropolitan AADT class and Small Urban population class
Rural Small Urbanized indicator for Rural AADT class and Small Urbanized population class
Small Urban Small Urbanized
indicator for Small Urban AADT class and Small Urbanized population class
Small Urbanized Small Urbanized
indicator for Small Urbanized AADT class and Small Urbanized population class
Large Urbanized Small Urbanized
indicator for Large Urbanized AADT class and Small Urbanized population class
Metropolitan Small Urbanized
indicator for Metropolitan AADT class and Small Urbanized population class
Rural Large Urbanized indicator for Rural AADT class and Large Urbanized population class
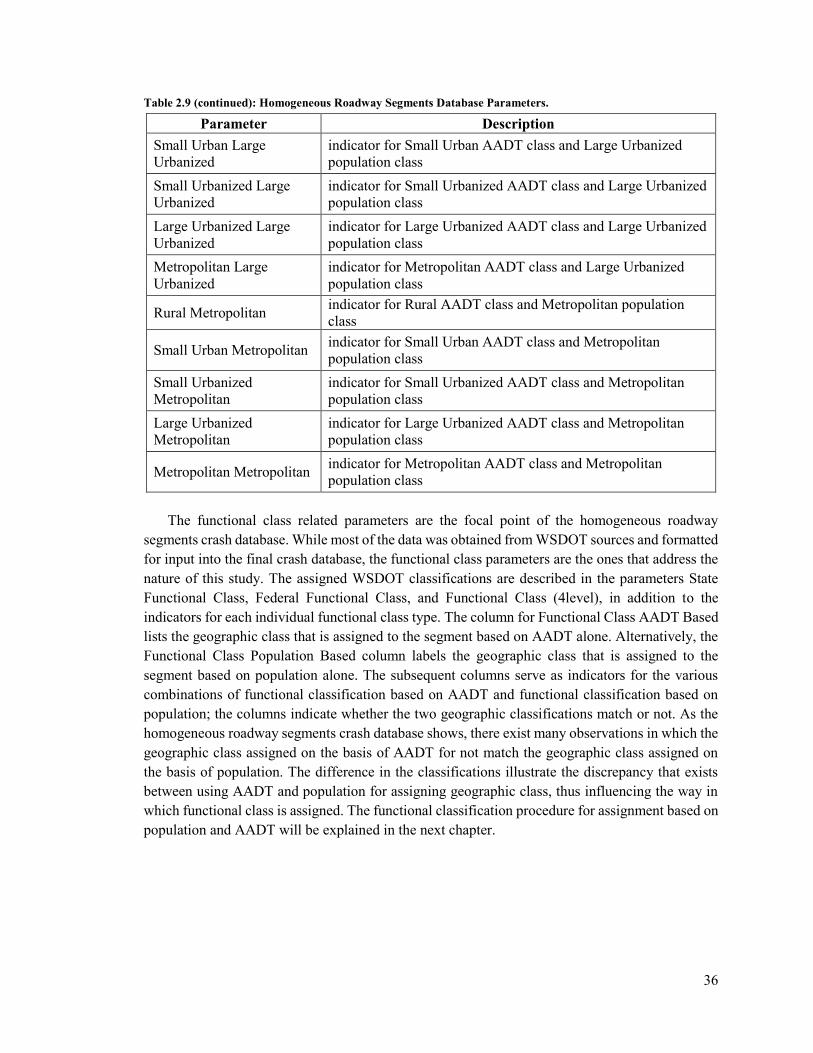
36
Table 2.9 (continued): Homogeneous Roadway Segments Database Parameters.
Parameter Description Small Urban Large Urbanized
indicator for Small Urban AADT class and Large Urbanized population class
Small Urbanized Large Urbanized
indicator for Small Urbanized AADT class and Large Urbanized population class
Large Urbanized Large Urbanized
indicator for Large Urbanized AADT class and Large Urbanized population class
Metropolitan Large Urbanized
indicator for Metropolitan AADT class and Large Urbanized population class
Rural Metropolitan indicator for Rural AADT class and Metropolitan population class
Small Urban Metropolitan indicator for Small Urban AADT class and Metropolitan population class
Small Urbanized Metropolitan
indicator for Small Urbanized AADT class and Metropolitan population class
Large Urbanized Metropolitan
indicator for Large Urbanized AADT class and Metropolitan population class
Metropolitan Metropolitan indicator for Metropolitan AADT class and Metropolitan population class
The functional class related parameters are the focal point of the homogeneous roadway
segments crash database. While most of the data was obtained from WSDOT sources and formatted for input into the final crash database, the functional class parameters are the ones that address the nature of this study. The assigned WSDOT classifications are described in the parameters State Functional Class, Federal Functional Class, and Functional Class (4level), in addition to the indicators for each individual functional class type. The column for Functional Class AADT Based lists the geographic class that is assigned to the segment based on AADT alone. Alternatively, the Functional Class Population Based column labels the geographic class that is assigned to the segment based on population alone. The subsequent columns serve as indicators for the various combinations of functional classification based on AADT and functional classification based on population; the columns indicate whether the two geographic classifications match or not. As the homogeneous roadway segments crash database shows, there exist many observations in which the geographic class assigned on the basis of AADT for not match the geographic class assigned on the basis of population. The difference in the classifications illustrate the discrepancy that exists between using AADT and population for assigning geographic class, thus influencing the way in which functional class is assigned. The functional classification procedure for assignment based on population and AADT will be explained in the next chapter.

37
3.0 Functional Classification (Centerline Miles)
Section 1.2 discussed the procedure and protocol that WSDOT, in conjunction with the FHWA, follows in assigning functional classifications to roadway segments, and concludes by mentioning the process of assigning functional class by population and AADT. This chapter will introduce the process in which functional classifications were assigned by population and AADT counts. The two methods of assigning functional class are applied to the homogeneous segments crash database in which functional and geographic classifications are input into each observation. This chapter will begin by describing the procedures and conditions applying the geographical classifications of Rural, Small Urban, Small Urbanized, Large Urbanized, and Metropolitan, using the population and AADT criteria. The last section will discuss the validation process using the WSDOT Highway Logs, followed by comparisons between the population based and AADT based geographic and functional classifications in terms of centerline miles.
3.1 Population Based Geographic Type Classification The source crash data provided by WSDOT was found to contain information on segment
location by city and county. Census data was obtained for years 2010 to 2012 from the United States Census Bureau – U.S. Department of Commerce. The census data was found to contain population information at both county and city levels. This data was matched to the location information in the source data to obtain the area populations for each segment’s location. Area names for several sections of roadway, predominantly in rural areas were absent in the source data. In order to assign them with a population estimate, WSDOT SRweb, and Geoportal were utilized to ascertain their area type or physical boundary. Segments for which area names were available were assigned a population count based on the census information available. This information was then used to categorize the segments into one of the five geographic classes, based on the following population criteria:
Rural: < 5,000 Small Urban: 5,000 – 49,999 Small Urbanized: 50,000 – 199,999 Large Urbanized: 200,000 – 499,999 Metropolitan: > 500,000
3.2 AADT Based Geographic Type Classification The source crash data obtained from WSDOT was found to classify the available routes within
four functional classes: Principal Arterials, Minor Arterials, Collectors, and Interstates. The federal classifications for the same routes included an additional class with a distinction made between freeways/expressways and other principal arterials. To avoid repeated observations of freeway segments as Principal Arterials, the federal classifications were matched to the homogenous segments and all five federal classifications for functional class were included in this part of the study. Ranges were obtained from the FHWA guidelines to set the capacity levels for each

38
functional class within each of the five geographical classes. The upper limits for Small Urban levels of AADT were also obtained from the FHWA guidelines and were used as a baseline to compute ranges of AADT for the higher order geographical classes, using volume to capacity ratios and the average number of lanes for each functional class. Table 3.1 shows the resulting ranges of AADT for each of the classes. Table 3.1: AADT Ranges for Functional and Geographic Class.
Functional Class/
Geographic Class
Factors Interstate Other
Freeways/ Expressways
Other Principal Arterials
Minor Arterials
Major & Minor
Collectors
Metropolitan
Capacity 2,400 2,300 1,900 1,700 1,400 V/C ratio 0.8 0.8 0.83 0.8 0.7 Lane 8 6 4 2 2 Boundary 153,600 110,400 63,080 27,200 19,600
Large Urbanized
Capacity 2,200 2,100 1,700 1,400 1,200 V/C ratio 0.8 0.8 0.83 0.8 0.65 Lane 6 6 4 2 2 Boundary 105,600 100,800 56,440 22,400 15,600
Small Urbanized
Capacity 2,000 1,800 1,500 1,200 1,000 V/C ratio 0.6 0.6 0.65 0.65 0.6 Lane 6 4 4 2 2 Boundary 72,000 43,200 39,000 15,600 12,000
Small Urban Boundary 12,000 4,000 2,000 1,500 1,100 The ‘boundary’ values form an upper limit for the AADT range for each functional class within each geographic class; the Rural classification (not listed in the table) would be considered as anything less than Small Urban. These ranges were then matched to the AADTs for each homogenous segment to obtain the AADT based geographic classifications.
3.3 Highway Log Centerline Miles Validation In checking the length of each route using the ARMs for each homogenous segment in the
dataset, it was found that the total ARM lengths resulted in a figure about 300 miles in excess of the WSDOT highway log lengths. It was observed that the highway log ARMs were consistent with the homogenous segment ARMs and further investigation showed that the differences in length were in specific segments of routes that overlapped each other. These differences between ARM lengths and highway log lengths were matched to the overlapping segments, as a means of avoiding double counting the lengths while testing data consistency. One example of such a location is State Route 12, where the ARM length totals at 430.779 miles, while the highway log length is 106.38 miles less at 324.51 miles. It was found that SR12 overlapped with I-5 and I-82. After accounting for these overlaps, the homogenous segment data resulted in a total system mileage of 6,867.683 miles, which was found to be within acceptable limits of the WSDOT highway log total system length of 6,951.34 miles. Thus, the homogenous segment data was

39
assembled based on specific criteria as a means of testing and ensuring its validity. A summary of the number of centerline mainline only miles based on 2010 ARM for principal arterial, minor arterial, and collector roadways is provided in Table 3.2, based on the homogeneous segments database. Table 3.2: Functional Class Centerline Miles by Lane Configuration.
Number of Lanes 2-Lane Multi-Lane One-way Principal Arterial 1,918.87 780.191 18.318 Minor Arterial 1,783.85 99.374 1.49 Collector 1,378.87 26.857 3.451 Total 5,081.59 906.422 23.259
Together, these three functional classes account for 6,011.267 miles of the 6,867.683 miles
available. Principal arterials were found to comprise a total of 2,717.377 miles, of which 1,918.868 miles were 2-lane roadways, 780.191 were multi-lane roadways, and 18.318 miles being one-way. Of the 1,884.716 minor arterial miles, 1,783.852 miles were found to be 2-lane roadways, 99.374 miles were found to be multi-lane roadways with the remaining being one-ways. Similarly, collectors were found to be a total of 1,409.174 centerline miles, of which 1,378.866 miles were 2-lane roadways.
The functional classification of the homogenous segments using section AADT data and census population counts has been expressed in cumulative centerline miles. A segment wise comparison between the two classifications was made to show the similarities and differences in the resulting five geographical classifications from 2010 until 2012. Tables 3.3 and 3.4 show the summary of this comparison for 2010. Table 3.3: Population Based Functional Class Centerline Miles by Geographic Classification.
Population Based Rural Small Urban
Small Urbanized
Large Urbanized Metropolitan
Principal Arterial 1,935.036 521.684 190.364 36.095 34.198 Minor Arterial 1,701.500 131.176 49.616 2.424 0.000
Collector 1,344.655 49.208 11.672 3.639 0.000 Total 4,981.191 702.068 251.652 42.158 34.198
Table 3.4: AADT Based Functional Class Centerline Miles by Geographic Classification.
AADT Based Rural Small Urban
Small Urbanized
Large Urbanized Metropolitan
Principal Arterial 453.379 2,112.08 138.105 7.543 6.270 Minor Arterial 716.077 1,052.298 65.598 13.994 36.749
Collector 652.946 685.351 7.989 26.742 36.146 Total 1,822.402 3,849.729 211.692 48.279 79.165
The largest differences were observed in the total centerline miles that fell under the Rural and Small Urban definitions. The population based classification resulted in 4,981.191 Rural centerline miles of roadway, while based on AADT, only 1,822.402 miles would fall under a Rural definition.

40
Similarly, Small Urban areas had a total of 702.068 centerline miles of roadway when classified by population, but 3,849.729 miles when described by AADT. Thus, segments that were being classified as falling within Rural areas were observing traffic volumes that would be expected in higher order geographic areas, something that was observed for Principal Arterials, Minor Arterials, and Collectors alike. These observations taken together suggest that a classification based solely on the population of the area that a segment falls within does not necessarily hold true based on the traffic volumes being observed along the segments.
Table 3.5 displays the centerline miles of roadway for each of the five geographic classifications based on section AADT data and census population information for Principal Arterials, Minor Arterials, and Collectors. The rows contain the centerline miles based on AADT while the columns show the centerline miles based on population and each cell shows the intersection of the respective geographic types. Thus, the diagonal entries show the number of miles where the classifications based on AADT and population matched, while the off-diagonal cells show the number of miles where the AADT classifications did not match with the population based classifications. Table 3.5: Matrix of 2010 Population Based and AADT Based Functional Class Centerline Miles.
Population Basis
Rural Small Urban
Small Urbanized
Large Urbanized Metropolitan
AA
DT
Bas
is
Rural 1,742.492 51.43 26.355 2.125 0.000 Small Urban 3,104.596 546.797 147.378 114.694 15.468 Small Urbanized 70.864 66.299 54.256 4.562 15.672
Large Urbanized 26.721 8.326 12.903 0.000 0.329
Metropolitan 1,742.492 51.43 26.355 2.125 0.000 Of the 6,011.774 centerline miles of Principal Arterials, Minor Arterials and Collector roadways, the diagonal entries totaled to 2,343.545; only 38.983% of the geographic classifications by population corresponded to the classification based on observed AADT. The 3,108.709 miles that were classified as being within Rural areas based on population would fall under a Small Urban classification based on AADT. Similarly, 66.299 miles classified as being in Small Urban areas based on population would actually be considered as Small Urbanized based on AADT. These differences in geographical classification were less pronounced at the Large Urbanized and Metropolitan levels with the largest observed difference being 34.652 miles of roadway that were classified as being Large Urbanized based on population, but had small enough daily traffic volumes to be categorized as Small Urban by AADT.
Table 3.6 visualizes the percentage of the miles for each geographical definition type against the total system centerline miles of 6,011.267 for Principal Arterials, Minor Arterials and Collectors. The color scale employed in this table progresses in values from low to high with their corresponding color of green to red, with red signifying the highest percentage.

41
Table 3.6: Matrix of 2010 Population Based and AADT Based Functional Class Centerline Miles by Percent.
Population Basis
Rural Small Urban
Small Urbanized
Large Urbanized Metropolitan
AA
DT
Bas
is
Rural 28.99% 0.86% 0.44% 0.04% 0.00% Small Urban 51.65% 9.10% 2.45% 1.91% 0.26% Small Urbanized 1.18% 1.10% 0.90% 0.08% 0.26%
Large Urbanized 0.44% 0.14% 0.21% 0.00% 0.01%
Metropolitan 28.99% 0.86% 0.44% 0.04% 0.00% As before, 90.65% of the total centerline miles fell within the Rural and Small Urban classifications. Approximately 80.69% of the total miles were classified as being Rural by population, only 28.98% of the centerline miles saw AADT classifications that correspond with a Rural area. The remaining 51.71% had annual daily traffic volumes that would be classified as being Small Urban. Another notable observation is that none of the Principal Arterial, Minor Arterial or Collector roadway miles that were classified as being Metropolitan or Large Urbanized by population actually fell within the corresponding categories based on AADT. This could be a result of either no corresponding segments, or perhaps an effect of low Metropolitan miles in comparison to Rural and Small Urban miles. This large difference in the total number of miles for each category could lead to a percentage of the total that is very close to zero. Additionally, 0.58% of Large Urbanized and 0.26% of Metropolitan areas by population were observed to have AADTs in the Small Urban ranges. Conversely, 0.61% of the Rural areas and 0.49% of the Small Urban areas by population were found to have Metropolitan levels of daily traffic volumes.
4.0 Functional Classification (Segments)
The centerline mileage matrices comparing population based and AADT based functional classes presented in Section 3.3, are presented in this chapter in counts of homogeneous segments. A total of 107,695 homogeneous roadway segments are account for each individual year of crash data. The functional classification matrices of AADT and population based measures will first be presented for all functional class segment types. The segment matrices will be further evaluated by presenting the comparison matrices for each specific WSDOT defined functional class: Interstate, Principal Arterial, Minor Arterial, Collector, and Non-Interstate segments.
All 107,695 homogeneous roadway segments for years 2010, 2011, and 2012 are shown in comparison matrices in Tables 4.1, 4.2, and 4.3. As with the centerline miles comparison tables, the rows represent the classifications based on AADT while the columns represent the classifications based on population, with each cell showing the intersection of the respective geographical classifications expressed in number of homogenous segments. The cells along the diagonal of the tables depict segments where the two types of classifications remained consistent with each other. The off-diagonal cells show segments that were classified as being of a certain geographical type by population but differences in AADTs resulted in differences in classification.
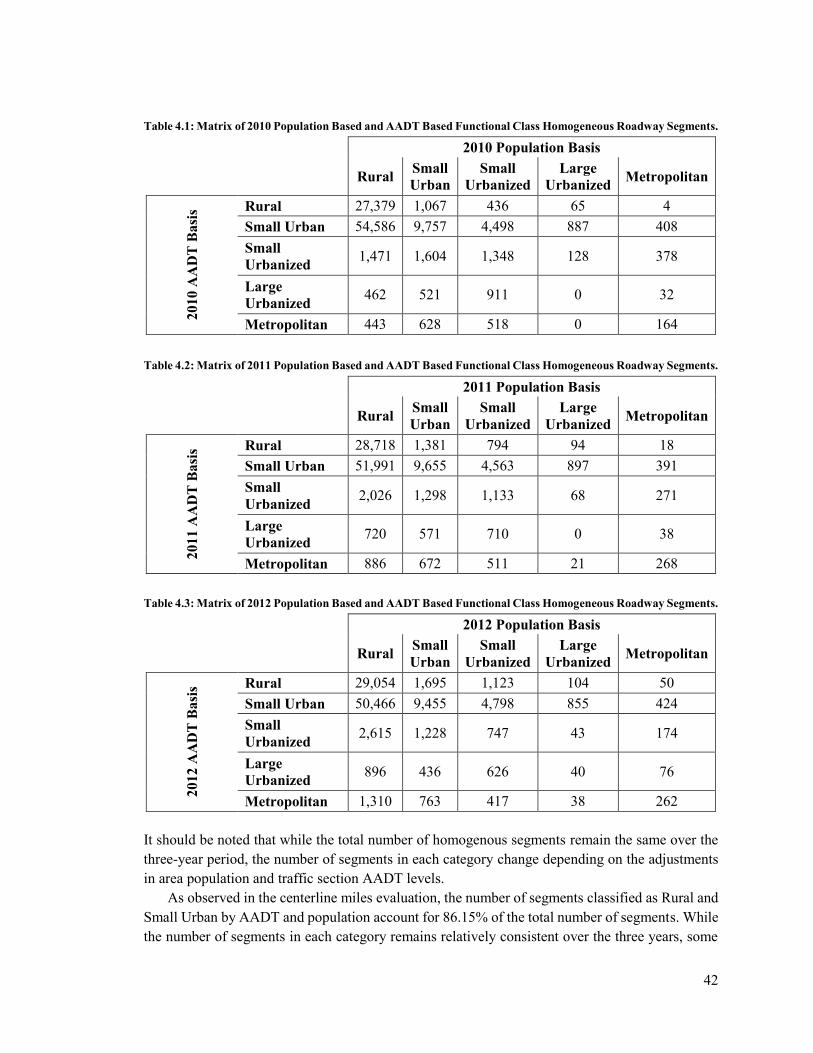
42
Table 4.1: Matrix of 2010 Population Based and AADT Based Functional Class Homogeneous Roadway Segments.
2010 Population Basis
Rural Small Urban
Small Urbanized
Large Urbanized Metropolitan
2010
AA
DT
Bas
is Rural 27,379 1,067 436 65 4
Small Urban 54,586 9,757 4,498 887 408 Small Urbanized 1,471 1,604 1,348 128 378
Large Urbanized 462 521 911 0 32
Metropolitan 443 628 518 0 164 Table 4.2: Matrix of 2011 Population Based and AADT Based Functional Class Homogeneous Roadway Segments.
2011 Population Basis
Rural Small Urban
Small Urbanized
Large Urbanized Metropolitan
2011
AA
DT
Bas
is Rural 28,718 1,381 794 94 18
Small Urban 51,991 9,655 4,563 897 391 Small Urbanized 2,026 1,298 1,133 68 271
Large Urbanized 720 571 710 0 38
Metropolitan 886 672 511 21 268 Table 4.3: Matrix of 2012 Population Based and AADT Based Functional Class Homogeneous Roadway Segments.
2012 Population Basis
Rural Small Urban
Small Urbanized
Large Urbanized Metropolitan
2012
AA
DT
Bas
is Rural 29,054 1,695 1,123 104 50
Small Urban 50,466 9,455 4,798 855 424 Small Urbanized 2,615 1,228 747 43 174
Large Urbanized 896 436 626 40 76
Metropolitan 1,310 763 417 38 262 It should be noted that while the total number of homogenous segments remain the same over the three-year period, the number of segments in each category change depending on the adjustments in area population and traffic section AADT levels.
As observed in the centerline miles evaluation, the number of segments classified as Rural and Small Urban by AADT and population account for 86.15% of the total number of segments. While the number of segments in each category remains relatively consistent over the three years, some

43
interesting observations could be made when aggregating some of the data. The number of segments classified as being Rural based on both population and AADT increased by 6% from 27,379 in 2010 to 29,054 in 2012. Conversely, the number of segments classified as being Rural based on population, but with Small Urban AADT levels, reduced by 7.55% from 54,586 in 2010 to 50,466 in 2012. The number of Rural segments by population that saw Metropolitan levels of traffic flow increased nearly threefold from 443 segments in 2010 to 1,310 segments in 2012. An increasing trend was also observed in the segments classified as Metropolitan by both measures wherein the number of homogenous segments increased from 164 in 2010 to 268 in 2011, and remained consistent through 2012. The largest changes were observed in the number of segments that fell within the Rural, Large Urbanized and Metropolitan classifications. The subsequent sections of this chapter will isolate the functional classifications of Interstates, Principal Arterials (Freeway/Expressway + Other Principal Arterial), Minor Arterials, and Collector roads to show the segment distribution among the geographic classifications.
4.1 Interstate Segments The summary for all 7,459 homogenous Interstate segments is shown in Tables 4.4, 4.5, and
4.6. The greatest difference observed from 2010 to 2012 were in the number of segments classified as Small Urbanized by population and Rural by AADT levels, an increase from 51 homogenous segments in 2010 to 247 in 2012. Table 4.4: Matrix of 2010 Population Based and AADT Based Functional Class Homogeneous Interstate Segments.
2010 Population Basis
Rural Small Urban
Small Urbanized
Large Urbanized Metropolitan
2010
AA
DT
Bas
is Rural 211 37 51 0 4
Small Urban 3,500 803 307 187 66 Small Urbanized 255 211 194 0 0
Large Urbanized 143 337 604 0 11
Metropolitan 2 235 208 0 93 Table 4.5: Matrix of 2011 Population Based and AADT Based Functional Class Homogeneous Interstate Segments.
2011 Population Basis
Rural Small Urban
Small Urbanized
Large Urbanized Metropolitan
2011
AA
DT
Bas
is Rural 243 38 143 0 18 Small Urban 3,322 901 363 187 52 Small Urbanized 317 139 110 0 0
Large Urbanized 192 298 520 0 6
Metropolitan 37 247 228 0 98

44
Table 4.6: Matrix of 2012 Population Based and AADT Based Functional Class Homogeneous Interstate Segments.
2012 Population Basis
Rural Small Urban
Small Urbanized
Large Urbanized Metropolitan
2012
AA
DT
Bas
is Rural 274 40 247 10 35
Small Urban 3,269 962 380 177 35 Small Urbanized 201 159 85 0 0
Large Urbanized 274 224 487 0 15
Metropolitan 93 238 165 0 89 The total number of segments within each geographical classification by population remained the same over the three year span. Therefore, the differences observed in the number of corresponding segments by AADT are a result of the variations in AADT over the three year period. The number of homogenous segments that were classified as having Metropolitan, Small Urban and Large Urbanized levels of AADT showed the least amount of variation going from 2010 to 2012, while the number of segments with Rural levels of daily vehicular flow increased by 100% from 303 segments in 2010 to 606 segments in 2012. On the other hand, the number of segments with Small Urbanized levels of AADT reduced from 660 segments in 2010 by 14.24% from 2010 to 2011 and further reduced by 21.38% from 2011 to 2012, an overall reduction of 215 homogenous segments. The number of Interstate segments falling within areas of Rural definitions by population was unsurprisingly a significant portion of the total segments at 4,111. But under the AADT definition, this number was found to drop significantly to 442 segments in 2011, while the number of Small Urban Interstate segments increased from 1623 based on population, to 4825 segments in 2011 based on AADT. Similar increases were observed in the number of Large Urbanized and Metropolitan segments with an increase from 187 population based segments to 1,016 AADT based segments, and 174 population based segments to 610 AADT based segments respectively in 2011.
4.2 Principal Arterial (Freeway/Expressway + Other
Principal Arterial) Segments By definition, WSDOT characterizes the functional classification of Principal Arterials as a
combination of Freeway/Expressway and Other Principal Arterials type functional classes. Tables 4.7, 4.8, and 4.9 depict the matrix comparisons of the 42,046 homogenous segments that fall within this category between the population based and AADT based classifications.
Similar to the Interstate segments, the total number of homogenous Principal Arterial segments
remained the same over the three-year period at 42,046 segments. The number of segments with Rural levels of AADT increased by 1,688 segments from 6,091 in 2010 to 7,779 in 2012. The total number of Rural segments by the population definition of geographical area was found to be 27,735 while under the AADT classification this number was found to be significantly smaller at 6,967 segments in 2011.

45
Table 4.7: Matrix of 2010 Population Based and AADT Based Functional Class Homogeneous Principal Arterial Segments.
2010 Population Basis
Rural Small Urban
Small Urbanized
Large Urbanized Metropolitan
2010
AA
DT
Bas
is Rural 5,485 341 200 65 0
Small Urban 21,716 6,716 3,407 531 342 Small Urbanized 531 968 909 100 378
Large Urbanized 3 27 106 0 21
Metropolitan 0 26 103 0 71 Table 4.8: Matrix of 2011 Population Based and AADT Based Functional Class Homogeneous Principal Arterial Segments.
2011 Population Basis
Rural Small Urban
Small Urbanized
Large Urbanized Metropolitan
2011
AA
DT
Bas
is Rural 5,892 528 453 94 0
Small Urban 21,145 6,686 3,388 543 339 Small Urbanized 692 786 773 59 271
Large Urbanized 4 35 25 0 32
Metropolitan 2 43 86 0 170 Table 4.9: Matrix of 2012 Population Based and AADT Based Functional Class Homogeneous Principal Arterial Segments.
2012 Population Basis
Rural Small Urban
Small Urbanized
Large Urbanized Metropolitan
2012
AA
DT
Bas
is Rural 6,183 826 661 94 15
Small Urban 20,557 6,422 3,554 586 389 Small Urbanized 964 665 439 16 174
Large Urbanized 13 61 13 0 61
Metropolitan 18 104 58 0 173 The difference between the two classifications was also observed in the other geographic classifications, but the most significant difference was observed for the Small Urban classification whereas the population based definition resulted in 8,078 segments while the daily traffic volumes based definition had 32,101 segments in 2011. Approximately 76% of the segments in the Principal

46
Arterial functional classification were observed to have Small Urban levels of AADT over the three-year study period.
4.3 Minor Arterial Segments A total of 32,024 segments comprise the number of homogeneous segments identified with the
Minor Arterial classification. Tables 4.10, 4.11, and 4.12 represent the population based and AADT based comparison matrices of the Minor Arterial segments for 2010, 2011, and 2012. Table 4.10: Matrix of 2010 Population Based and AADT Based Functional Class Homogeneous Minor Arterial Segments.
2010 Population Basis
Rural Small Urban
Small Urbanized
Large Urbanized Metropolitan
2010
AA
DT
Bas
is Rural 9,556 149 148 0 0
Small Urban 17,146 1,966 562 68 0 Small Urbanized 617 422 245 28 0
Large Urbanized 103 102 201 0 0
Metropolitan 218 295 198 0 0 Table 4.11: Matrix of 2011 Population Based and AADT Based Functional Class Homogeneous Minor Arterial Segments.
2011 Population Basis
Rural Small Urban
Small Urbanized
Large Urbanized Metropolitan
2011
AA
DT
Bas
is Rural 10,244 357 161 0 0
Small Urban 15,863 1,757 616 66 0 Small Urbanized 758 333 249 9 0
Large Urbanized 262 130 140 0 0
Metropolitan 513 357 188 21 0 Consistent with the Interstate and Principal Arterials, the number of Rural segments based on population was found to reduce significantly from 27,640 compared to 10,762 segments based on AADT in 2011. The number of Small Urban segments by population showed an increase from 2,934 compared to the 18,302 AADT based segments in 2011. Another significant observation from the summary is that under the Minor Arterial functional class, there are zero segments that fall within a Metropolitan geographic definition based on population. On the contrary, the AADT based definition suggests that between 711 and 1,417 Minor Arterial segments demonstrated Metropolitan levels of daily traffic volumes over the three-year period.

47
Table 4.12: Matrix of 2012 Population Based and AADT Based Functional Class Homogeneous Minor Arterial Segments.
2012 Population Basis
Rural Small Urban
Small Urbanized
Large Urbanized Metropolitan
2012
AA
DT
Bas
is Rural 10,451 465 209 0 0
Small Urban 14,923 1,651 637 27 0 Small Urbanized 1,116 361 197 0 0
Large Urbanized 346 74 119 31 0
Metropolitan 804 383 192 38 0
4.4 Collector Segments A total count of 26,166 homogeneous roadway segments has been identified as the Collector
type functional class for years 2010, 2011, and 2012. Tables 4.13, 4.14, and 4.15 show the matrices for the population based and AADT based comparisons for the Collector functional class types from 2010 to 2012. Table 4.13: Matrix of 2010 Population Based and AADT Based Functional Class Homogeneous Collector Segments.
2010 Population Basis
Rural Small Urban
Small Urbanized
Large Urbanized Metropolitan
2010
AA
DT
Bas
is Rural 12,127 540 37 0 0
Small Urban 12,224 272 222 101 0 Small Urbanized 68 3 0 0 0
Large Urbanized 213 55 0 0 0
Metropolitan 223 72 9 0 0 Table 4.14: Matrix of 2011 Population Based and AADT Based Functional Class Homogeneous Collector Segments.
2011 Population Basis
Rural Small Urban
Small Urbanized
Large Urbanized Metropolitan
2011
AA
DT
Bas
is Rural 12339 458 37 0 0
Small Urban 11661 311 196 101 0 Small Urbanized 259 40 1 0 0
Large Urbanized 262 108 25 0 0
Metropolitan 334 25 9 0 0

48
Table 4.15: Matrix of 2012 Population Based and AADT Based Functional Class Homogeneous Collector Segments.
2012 Population Basis
Rural Small Urban
Small Urbanized
Large Urbanized Metropolitan
2012
AA
DT
Bas
is Rural 12146 364 6 0 0
Small Urban 11717 420 227 65 0 Small Urbanized 334 43 26 27 0
Large Urbanized 263 77 7 9 0
Metropolitan 395 38 2 0 0 Like the Minor Arterial segment analysis, 24,855 Collector segments classified by population were reduced to 12,834 segments when based on AADT criteria in 2011. Similarly, the number of Small Urban segments were found to increase from 942 population based segments to 12,269 AADT based segments in 2011. Based on population, the Collectors contain zero Metropolitan segments while the AADTs over the same three year span of this study indicate between 304 and 435 Metropolitan level segments.
4.5 Non-Interstate Segments (Collector + Minor Arterial +
Principal Arterial) When excluding Interstate segments, the total count of homogeneous roadway segments is
100,236 Non-Interstate segments for 2010, 2011, and 2012. The Non-Interstate segments classification includes Principal Arterial (Freeway/Expressway + Other Principal Arterial), Minor Arterial, and Collector segments. Tables 4.16, 4.17, and 4.18 represent the matrices for the population based and AADT based comparisons for the Non-Interstate functional classification for 2010, 2011, and 2012. Table 4.16: Matrix of 2010 Population Based and AADT Based Functional Class Homogeneous Non-Interstate Segments.
2010 Population Basis
Rural Small Urban
Small Urbanized
Large Urbanized Metropolitan
2010
AA
DT
Bas
is Rural 27,168 1,030 385 65 0
Small Urban 51,086 8,954 4,191 700 342 Small Urbanized 1,216 1,393 1,154 128 378
Large Urbanized 319 184 307 0 21
Metropolitan 441 393 310 0 71
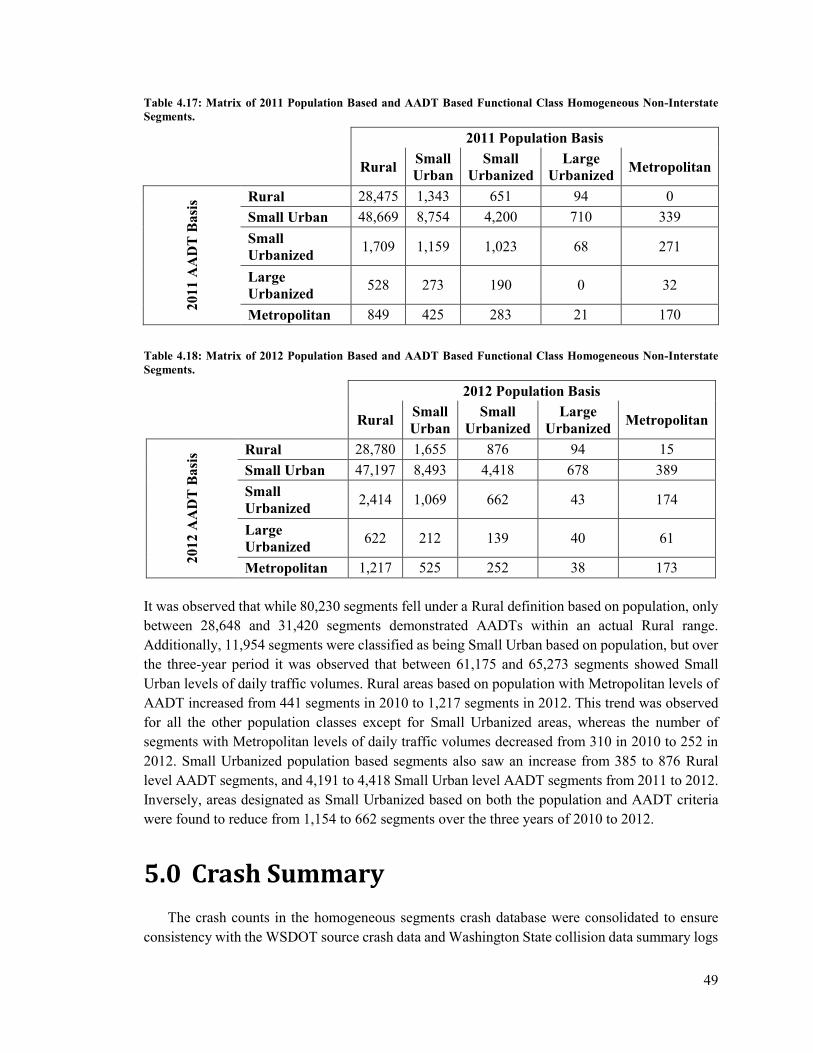
49
Table 4.17: Matrix of 2011 Population Based and AADT Based Functional Class Homogeneous Non-Interstate Segments.
2011 Population Basis
Rural Small Urban
Small Urbanized
Large Urbanized Metropolitan
2011
AA
DT
Bas
is Rural 28,475 1,343 651 94 0
Small Urban 48,669 8,754 4,200 710 339 Small Urbanized 1,709 1,159 1,023 68 271
Large Urbanized 528 273 190 0 32
Metropolitan 849 425 283 21 170 Table 4.18: Matrix of 2012 Population Based and AADT Based Functional Class Homogeneous Non-Interstate Segments.
2012 Population Basis
Rural Small Urban
Small Urbanized
Large Urbanized Metropolitan
2012
AA
DT
Bas
is Rural 28,780 1,655 876 94 15
Small Urban 47,197 8,493 4,418 678 389 Small Urbanized 2,414 1,069 662 43 174
Large Urbanized 622 212 139 40 61
Metropolitan 1,217 525 252 38 173 It was observed that while 80,230 segments fell under a Rural definition based on population, only between 28,648 and 31,420 segments demonstrated AADTs within an actual Rural range. Additionally, 11,954 segments were classified as being Small Urban based on population, but over the three-year period it was observed that between 61,175 and 65,273 segments showed Small Urban levels of daily traffic volumes. Rural areas based on population with Metropolitan levels of AADT increased from 441 segments in 2010 to 1,217 segments in 2012. This trend was observed for all the other population classes except for Small Urbanized areas, whereas the number of segments with Metropolitan levels of daily traffic volumes decreased from 310 in 2010 to 252 in 2012. Small Urbanized population based segments also saw an increase from 385 to 876 Rural level AADT segments, and 4,191 to 4,418 Small Urban level AADT segments from 2011 to 2012. Inversely, areas designated as Small Urbanized based on both the population and AADT criteria were found to reduce from 1,154 to 662 segments over the three years of 2010 to 2012.
5.0 Crash Summary
The crash counts in the homogeneous segments crash database were consolidated to ensure consistency with the WSDOT source crash data and Washington State collision data summary logs
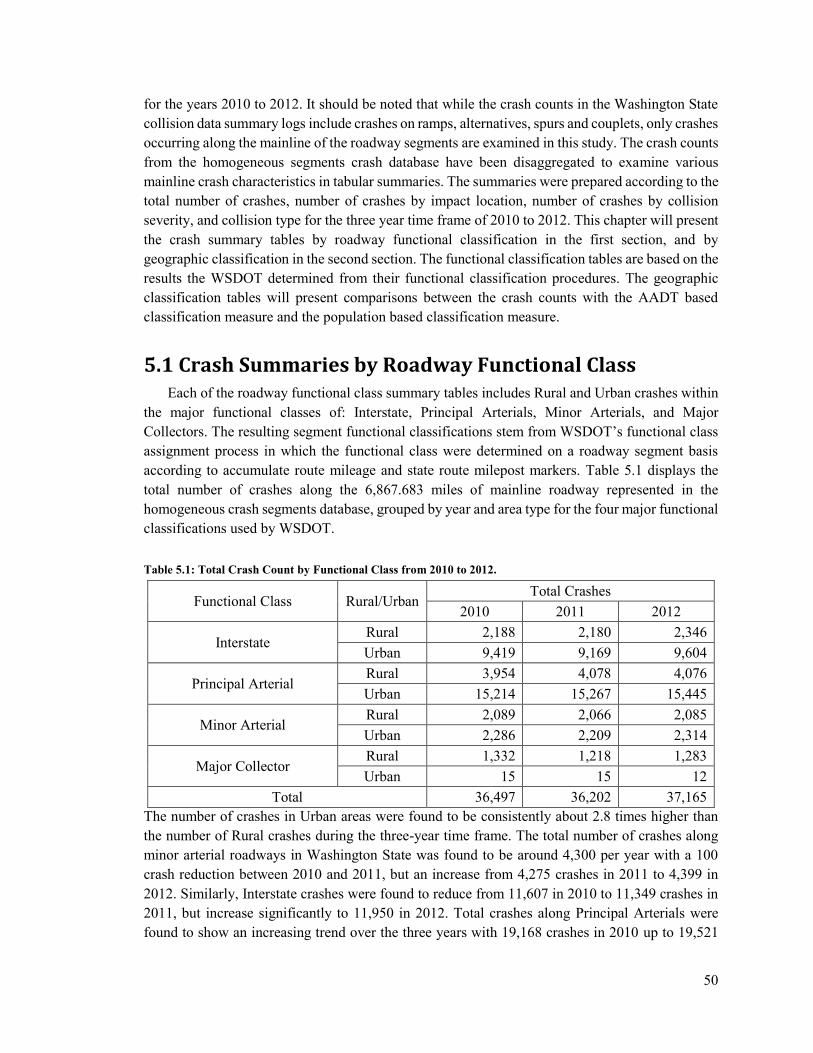
50
for the years 2010 to 2012. It should be noted that while the crash counts in the Washington State collision data summary logs include crashes on ramps, alternatives, spurs and couplets, only crashes occurring along the mainline of the roadway segments are examined in this study. The crash counts from the homogeneous segments crash database have been disaggregated to examine various mainline crash characteristics in tabular summaries. The summaries were prepared according to the total number of crashes, number of crashes by impact location, number of crashes by collision severity, and collision type for the three year time frame of 2010 to 2012. This chapter will present the crash summary tables by roadway functional classification in the first section, and by geographic classification in the second section. The functional classification tables are based on the results the WSDOT determined from their functional classification procedures. The geographic classification tables will present comparisons between the crash counts with the AADT based classification measure and the population based classification measure.
5.1 Crash Summaries by Roadway Functional Class Each of the roadway functional class summary tables includes Rural and Urban crashes within
the major functional classes of: Interstate, Principal Arterials, Minor Arterials, and Major Collectors. The resulting segment functional classifications stem from WSDOT’s functional class assignment process in which the functional class were determined on a roadway segment basis according to accumulate route mileage and state route milepost markers. Table 5.1 displays the total number of crashes along the 6,867.683 miles of mainline roadway represented in the homogeneous crash segments database, grouped by year and area type for the four major functional classifications used by WSDOT. Table 5.1: Total Crash Count by Functional Class from 2010 to 2012.
Functional Class Rural/Urban Total Crashes
2010 2011 2012
Interstate Rural 2,188 2,180 2,346 Urban 9,419 9,169 9,604
Principal Arterial Rural 3,954 4,078 4,076 Urban 15,214 15,267 15,445
Minor Arterial Rural 2,089 2,066 2,085 Urban 2,286 2,209 2,314
Major Collector Rural 1,332 1,218 1,283 Urban 15 15 12
Total 36,497 36,202 37,165 The number of crashes in Urban areas were found to be consistently about 2.8 times higher than the number of Rural crashes during the three-year time frame. The total number of crashes along minor arterial roadways in Washington State was found to be around 4,300 per year with a 100 crash reduction between 2010 and 2011, but an increase from 4,275 crashes in 2011 to 4,399 in 2012. Similarly, Interstate crashes were found to reduce from 11,607 in 2010 to 11,349 crashes in 2011, but increase significantly to 11,950 in 2012. Total crashes along Principal Arterials were found to show an increasing trend over the three years with 19,168 crashes in 2010 up to 19,521
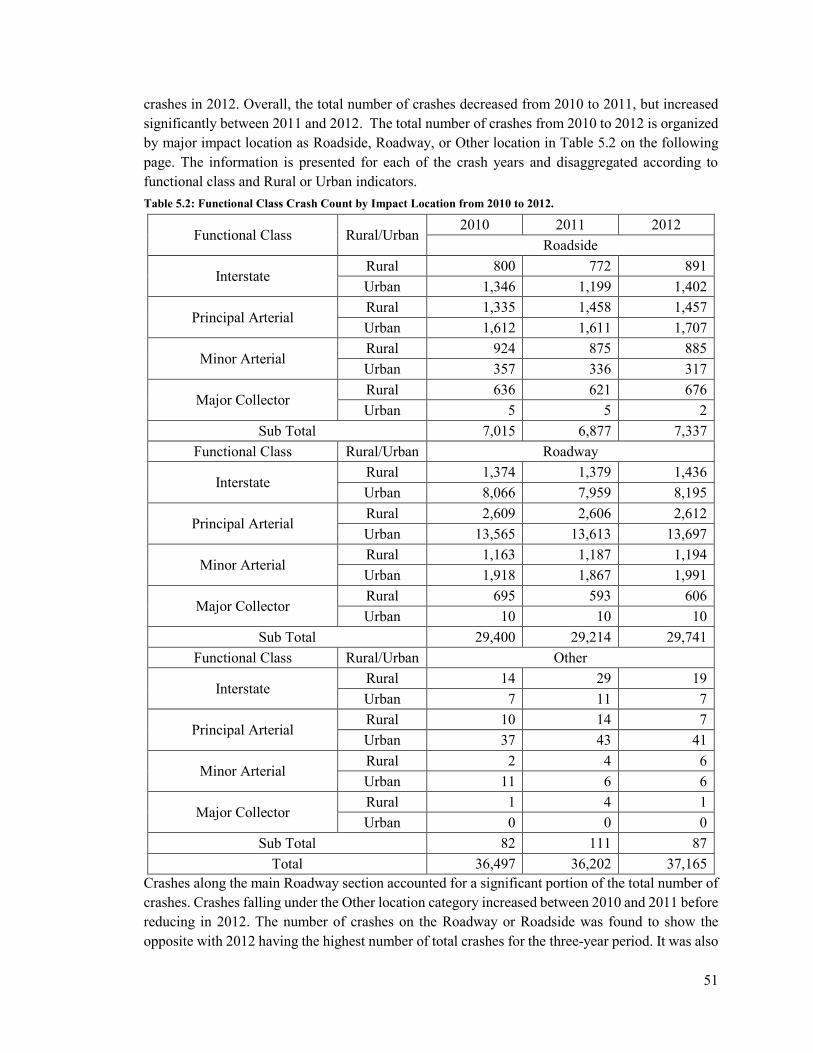
51
crashes in 2012. Overall, the total number of crashes decreased from 2010 to 2011, but increased significantly between 2011 and 2012. The total number of crashes from 2010 to 2012 is organized by major impact location as Roadside, Roadway, or Other location in Table 5.2 on the following page. The information is presented for each of the crash years and disaggregated according to functional class and Rural or Urban indicators. Table 5.2: Functional Class Crash Count by Impact Location from 2010 to 2012.
Functional Class Rural/Urban 2010 2011 2012
Roadside
Interstate Rural 800 772 891 Urban 1,346 1,199 1,402
Principal Arterial Rural 1,335 1,458 1,457 Urban 1,612 1,611 1,707
Minor Arterial Rural 924 875 885 Urban 357 336 317
Major Collector Rural 636 621 676 Urban 5 5 2
Sub Total 7,015 6,877 7,337 Functional Class Rural/Urban Roadway
Interstate Rural 1,374 1,379 1,436 Urban 8,066 7,959 8,195
Principal Arterial Rural 2,609 2,606 2,612 Urban 13,565 13,613 13,697
Minor Arterial Rural 1,163 1,187 1,194 Urban 1,918 1,867 1,991
Major Collector Rural 695 593 606 Urban 10 10 10
Sub Total 29,400 29,214 29,741 Functional Class Rural/Urban Other
Interstate Rural 14 29 19 Urban 7 11 7
Principal Arterial Rural 10 14 7 Urban 37 43 41
Minor Arterial Rural 2 4 6 Urban 11 6 6
Major Collector Rural 1 4 1 Urban 0 0 0
Sub Total 82 111 87 Total 36,497 36,202 37,165
Crashes along the main Roadway section accounted for a significant portion of the total number of crashes. Crashes falling under the Other location category increased between 2010 and 2011 before reducing in 2012. The number of crashes on the Roadway or Roadside was found to show the opposite with 2012 having the highest number of total crashes for the three-year period. It was also
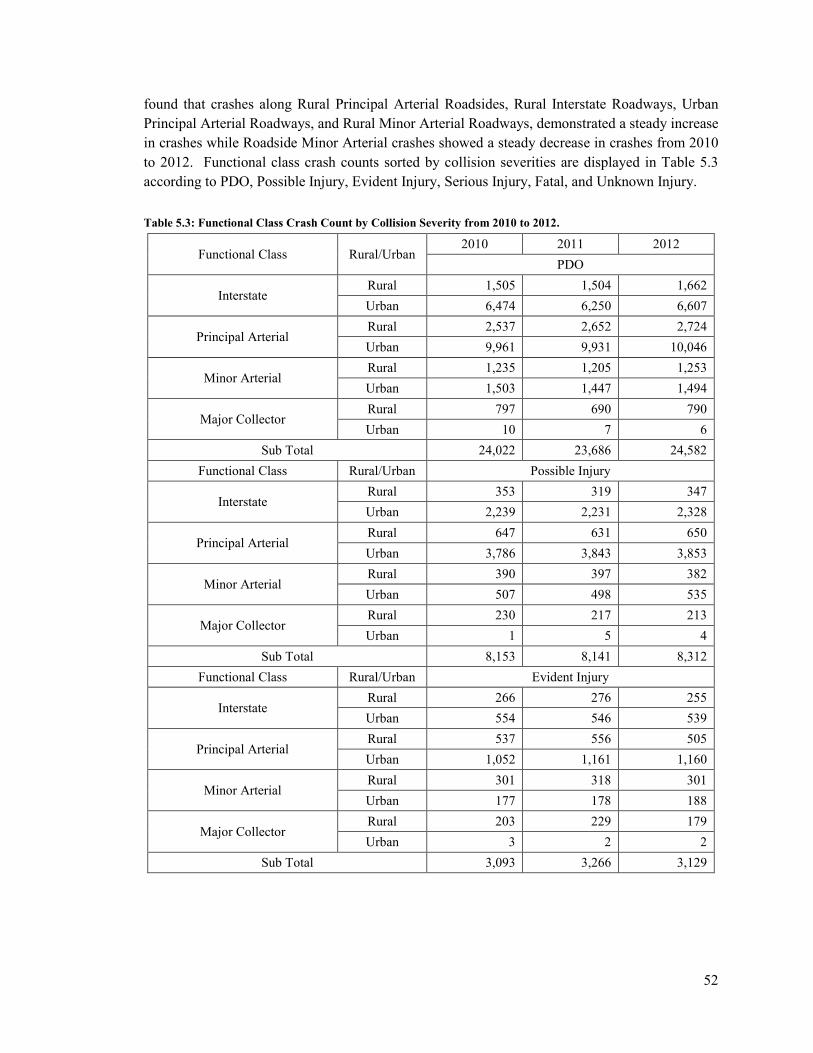
52
found that crashes along Rural Principal Arterial Roadsides, Rural Interstate Roadways, Urban Principal Arterial Roadways, and Rural Minor Arterial Roadways, demonstrated a steady increase in crashes while Roadside Minor Arterial crashes showed a steady decrease in crashes from 2010 to 2012. Functional class crash counts sorted by collision severities are displayed in Table 5.3 according to PDO, Possible Injury, Evident Injury, Serious Injury, Fatal, and Unknown Injury. Table 5.3: Functional Class Crash Count by Collision Severity from 2010 to 2012.
Functional Class Rural/Urban 2010 2011 2012
PDO
Interstate Rural 1,505 1,504 1,662 Urban 6,474 6,250 6,607
Principal Arterial Rural 2,537 2,652 2,724 Urban 9,961 9,931 10,046
Minor Arterial Rural 1,235 1,205 1,253 Urban 1,503 1,447 1,494
Major Collector Rural 797 690 790 Urban 10 7 6
Sub Total 24,022 23,686 24,582 Functional Class Rural/Urban Possible Injury
Interstate Rural 353 319 347 Urban 2,239 2,231 2,328
Principal Arterial Rural 647 631 650 Urban 3,786 3,843 3,853
Minor Arterial Rural 390 397 382 Urban 507 498 535
Major Collector Rural 230 217 213 Urban 1 5 4
Sub Total 8,153 8,141 8,312 Functional Class Rural/Urban Evident Injury
Interstate Rural 266 276 255 Urban 554 546 539
Principal Arterial Rural 537 556 505 Urban 1,052 1,161 1,160
Minor Arterial Rural 301 318 301 Urban 177 178 188
Major Collector Rural 203 229 179 Urban 3 2 2
Sub Total 3,093 3,266 3,129

53
Table 5.3 (continued): Functional Class Crash Count by Collision Severity from 2010 to 2012.
Functional Class Rural/Urban 2010 2011 2012
Serious Injury
Interstate Rural 38 39 40 Urban 87 79 73
Principal Arterial Rural 138 136 95 Urban 254 179 184
Minor Arterial Rural 97 83 70 Urban 40 50 53
Major Collector Rural 54 47 54 Urban 1 0 0
Sub Total 709 613 569 Functional Class Rural/Urban Fatal
Interstate Rural 14 24 17 Urban 19 25 18
Principal Arterial Rural 52 48 44 Urban 43 39 51
Minor Arterial Rural 39 30 31 Urban 14 14 6
Major Collector Rural 13 9 13 Urban 0 1 0
Sub Total 194 190 180 Functional Class Rural/Urban Unknown
Interstate Rural 12 18 25 Urban 46 38 39
Principal Arterial Rural 43 55 58 Urban 118 114 151
Minor Arterial Rural 27 33 48 Urban 45 22 38
Major Collector Rural 35 26 34 Urban 0 0 0
Sub Total 326 306 393 Total 36,497 36,202 37,165
PDO type crashes were found to be significantly higher in number than the other crash severity types with 2012 having the highest number of the three years. Fatalities were found to have the least number of overall crashes, displaying an apparent decreasing trend, with the exception of Urban Principal Arterial Fatalities which were found to be significantly higher in 2012 compared to 2010.
The functional class crash count by number of vehicles involved is presented on the next two pages in Table 5.4 ranging from one vehicle involved (Veh1) to more than six vehicles involved (≥Veh6).
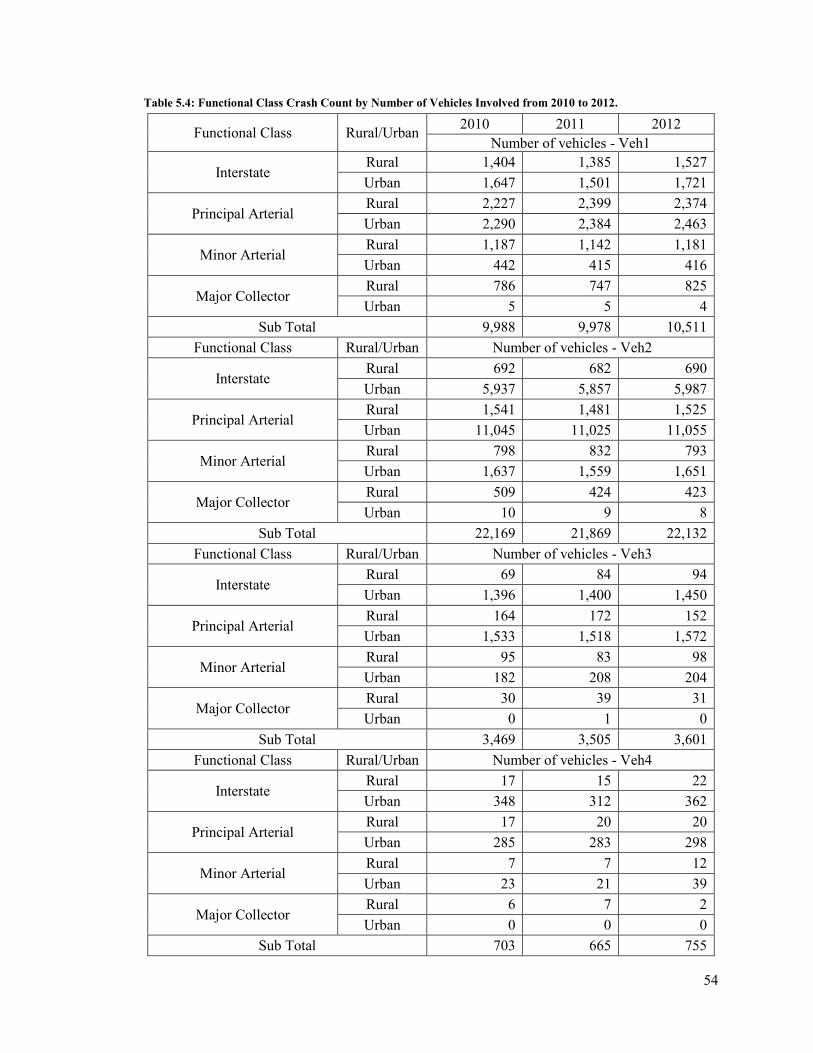
54
Table 5.4: Functional Class Crash Count by Number of Vehicles Involved from 2010 to 2012.
Functional Class Rural/Urban 2010 2011 2012 Number of vehicles - Veh1
Interstate Rural 1,404 1,385 1,527 Urban 1,647 1,501 1,721
Principal Arterial Rural 2,227 2,399 2,374 Urban 2,290 2,384 2,463
Minor Arterial Rural 1,187 1,142 1,181 Urban 442 415 416
Major Collector Rural 786 747 825 Urban 5 5 4
Sub Total 9,988 9,978 10,511 Functional Class Rural/Urban Number of vehicles - Veh2
Interstate Rural 692 682 690 Urban 5,937 5,857 5,987
Principal Arterial Rural 1,541 1,481 1,525 Urban 11,045 11,025 11,055
Minor Arterial Rural 798 832 793 Urban 1,637 1,559 1,651
Major Collector Rural 509 424 423 Urban 10 9 8
Sub Total 22,169 21,869 22,132 Functional Class Rural/Urban Number of vehicles - Veh3
Interstate Rural 69 84 94 Urban 1,396 1,400 1,450
Principal Arterial Rural 164 172 152 Urban 1,533 1,518 1,572
Minor Arterial Rural 95 83 98 Urban 182 208 204
Major Collector Rural 30 39 31 Urban 0 1 0
Sub Total 3,469 3,505 3,601 Functional Class Rural/Urban Number of vehicles - Veh4
Interstate Rural 17 15 22 Urban 348 312 362
Principal Arterial Rural 17 20 20 Urban 285 283 298
Minor Arterial Rural 7 7 12 Urban 23 21 39
Major Collector Rural 6 7 2 Urban 0 0 0
Sub Total 703 665 755
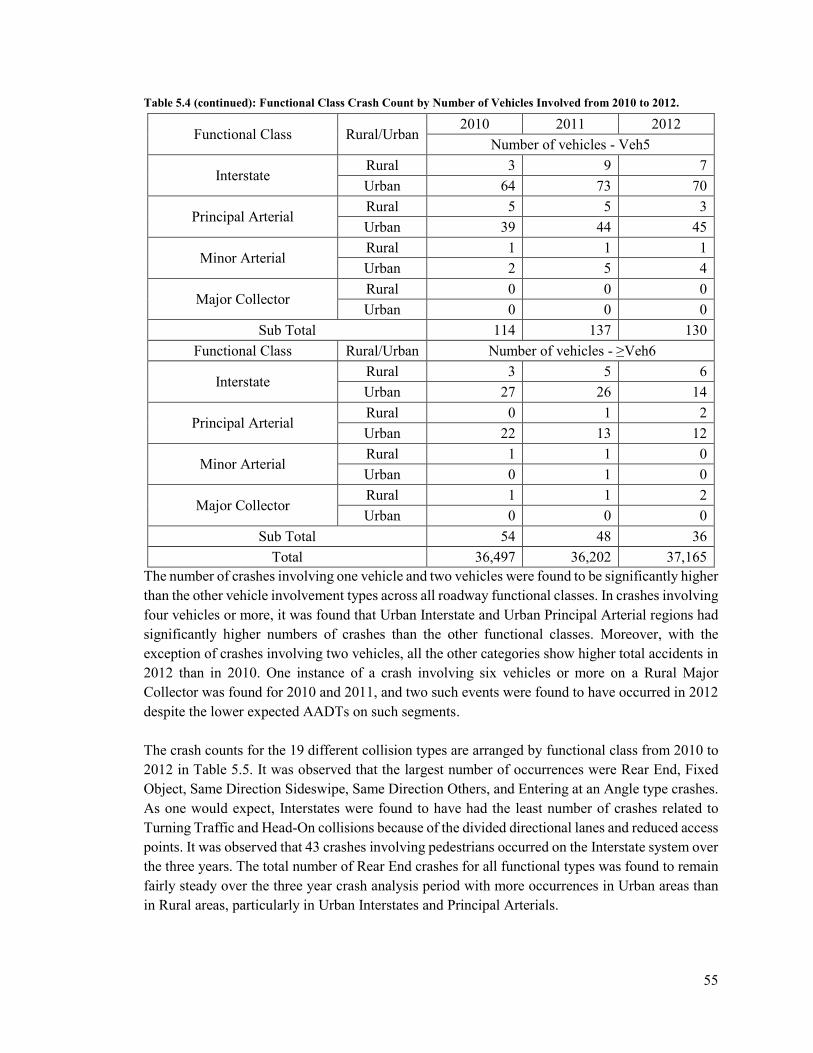
55
Table 5.4 (continued): Functional Class Crash Count by Number of Vehicles Involved from 2010 to 2012.
Functional Class Rural/Urban 2010 2011 2012
Number of vehicles - Veh5
Interstate Rural 3 9 7 Urban 64 73 70
Principal Arterial Rural 5 5 3 Urban 39 44 45
Minor Arterial Rural 1 1 1 Urban 2 5 4
Major Collector Rural 0 0 0 Urban 0 0 0
Sub Total 114 137 130 Functional Class Rural/Urban Number of vehicles - ≥Veh6
Interstate Rural 3 5 6 Urban 27 26 14
Principal Arterial Rural 0 1 2 Urban 22 13 12
Minor Arterial Rural 1 1 0 Urban 0 1 0
Major Collector Rural 1 1 2 Urban 0 0 0
Sub Total 54 48 36 Total 36,497 36,202 37,165
The number of crashes involving one vehicle and two vehicles were found to be significantly higher than the other vehicle involvement types across all roadway functional classes. In crashes involving four vehicles or more, it was found that Urban Interstate and Urban Principal Arterial regions had significantly higher numbers of crashes than the other functional classes. Moreover, with the exception of crashes involving two vehicles, all the other categories show higher total accidents in 2012 than in 2010. One instance of a crash involving six vehicles or more on a Rural Major Collector was found for 2010 and 2011, and two such events were found to have occurred in 2012 despite the lower expected AADTs on such segments. The crash counts for the 19 different collision types are arranged by functional class from 2010 to 2012 in Table 5.5. It was observed that the largest number of occurrences were Rear End, Fixed Object, Same Direction Sideswipe, Same Direction Others, and Entering at an Angle type crashes. As one would expect, Interstates were found to have had the least number of crashes related to Turning Traffic and Head-On collisions because of the divided directional lanes and reduced access points. It was observed that 43 crashes involving pedestrians occurred on the Interstate system over the three years. The total number of Rear End crashes for all functional types was found to remain fairly steady over the three year crash analysis period with more occurrences in Urban areas than in Rural areas, particularly in Urban Interstates and Principal Arterials.
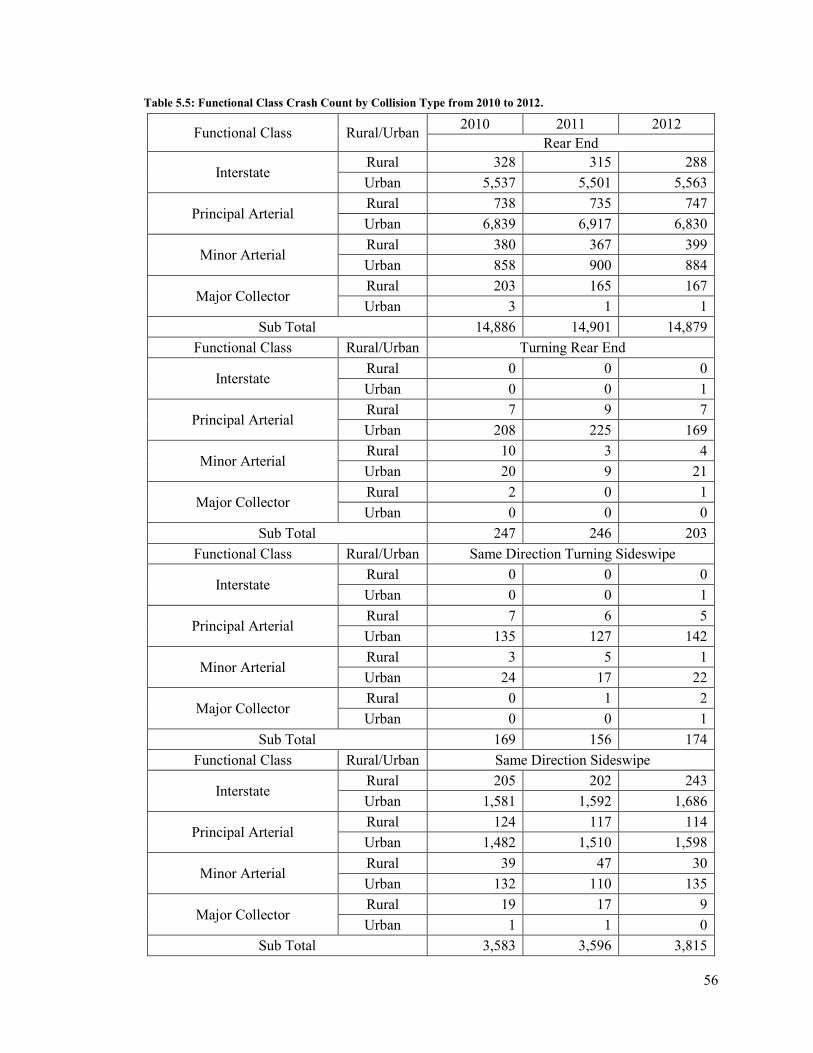
56
Table 5.5: Functional Class Crash Count by Collision Type from 2010 to 2012.
Functional Class Rural/Urban 2010 2011 2012 Rear End
Interstate Rural 328 315 288 Urban 5,537 5,501 5,563
Principal Arterial Rural 738 735 747 Urban 6,839 6,917 6,830
Minor Arterial Rural 380 367 399 Urban 858 900 884
Major Collector Rural 203 165 167 Urban 3 1 1
Sub Total 14,886 14,901 14,879 Functional Class Rural/Urban Turning Rear End
Interstate Rural 0 0 0 Urban 0 0 1
Principal Arterial Rural 7 9 7 Urban 208 225 169
Minor Arterial Rural 10 3 4 Urban 20 9 21
Major Collector Rural 2 0 1 Urban 0 0 0
Sub Total 247 246 203 Functional Class Rural/Urban Same Direction Turning Sideswipe
Interstate Rural 0 0 0 Urban 0 0 1
Principal Arterial Rural 7 6 5 Urban 135 127 142
Minor Arterial Rural 3 5 1 Urban 24 17 22
Major Collector Rural 0 1 2 Urban 0 0 1
Sub Total 169 156 174 Functional Class Rural/Urban Same Direction Sideswipe
Interstate Rural 205 202 243 Urban 1,581 1,592 1,686
Principal Arterial Rural 124 117 114 Urban 1,482 1,510 1,598
Minor Arterial Rural 39 47 30 Urban 132 110 135
Major Collector Rural 19 17 9 Urban 1 1 0
Sub Total 3,583 3,596 3,815

57
Table 5.5 (continued): Functional Class Crash Count by Collision Type from 2010 to 2012.
Functional Class Rural/Urban 2010 2011 2012 Same Direction Turning
Interstate Rural 2 1 2 Urban 0 0 1
Principal Arterial Rural 104 88 91 Urban 289 295 342
Minor Arterial Rural 59 59 66 Urban 72 80 67
Major Collector Rural 35 30 41 Urban 1 1 1
Sub Total 562 554 611 Functional Class Rural/Urban Same Direction Others
Interstate Rural 136 156 154 Urban 398 349 416
Principal Arterial Rural 80 71 86 Urban 372 360 374
Minor Arterial Rural 25 37 33 Urban 37 48 52
Major Collector Rural 16 14 18 Urban 0 0 0
Sub Total 1,064 1,035 1,133 Functional Class Rural/Urban Head On
Interstate Rural 3 2 5 Urban 2 7 6
Principal Arterial Rural 36 41 33 Urban 50 43 69
Minor Arterial Rural 23 19 20 Urban 14 14 19
Major Collector Rural 10 13 18 Urban 1 2 0
Sub Total 139 141 170 Functional Class Rural/Urban Opposite Direction Sideswipe
Interstate Rural 1 3 3 Urban 4 4 4
Principal Arterial Rural 51 58 42 Urban 71 56 63
Minor Arterial Rural 34 48 25 Urban 26 22 23
Major Collector Rural 28 25 27 Urban 0 1 0
Sub Total 215 217 187

58
Table 5.5 (continued): Functional Class Crash Count by Collision Type from 2010 to 2012.
Functional Class Rural/Urban 2010 2011 2012 Opposite Direction Turning
Interstate Rural 0 0 0 Urban 1 0 0
Principal Arterial Rural 78 84 106 Urban 1,047 1,047 1,008
Minor Arterial Rural 60 62 52 Urban 186 145 163
Major Collector Rural 38 34 25 Urban 0 1 0
Sub Total 1,410 1,373 1,354 Functional Class Rural/Urban Fixed Object
Interstate Rural 874 864 968 Urban 1,433 1,240 1,467
Principal Arterial Rural 1,179 1,334 1,316 Urban 1,652 1,656 1,732
Minor Arterial Rural 751 723 733 Urban 320 297 287
Major Collector Rural 546 529 560 Urban 5 4 2
Sub Total 6,760 6,647 7,065 Functional Class Rural/Urban Entering At Angle
Interstate Rural 0 0 1 Urban 0 2 2
Principal Arterial Rural 341 287 290 Urban 2,080 1,970 2,020
Minor Arterial Rural 194 185 194 Urban 412 392 461
Major Collector Rural 139 112 101 Urban 4 2 5
Sub Total 3,170 2,950 3,074 Functional Class Rural/Urban Overturned
Interstate Rural 275 233 259 Urban 174 139 138
Principal Arterial Rural 257 269 262 Urban 180 192 176
Minor Arterial Rural 190 173 164 Urban 34 34 31
Major Collector Rural 102 98 121 Urban 0 1 0
Sub Total 1,212 1,139 1,151

59
Table 5.5 (continued): Functional Class Crash Count by Collision Type from 2010 to 2012.
Functional Class Rural/Urban 2010 2011 2012 Animal
Interstate Rural 184 198 226 Urban 67 86 77
Principal Arterial Rural 655 703 708 Urban 110 136 145
Minor Arterial Rural 186 200 228 Urban 37 22 26
Major Collector Rural 110 83 111 Urban 0 0 1
Sub Total 1,349 1,428 1,522 Functional Class Rural/Urban Bicycle
Interstate Rural 20 2 0 Urban 4 1 0
Principal Arterial Rural 39 8 13 Urban 16 140 130
Minor Arterial Rural 32 14 10 Urban 4 26 21
Major Collector Rural 19 6 5 Urban 0 0 0
Sub Total 134 197 179 Functional Class Rural/Urban Pedestrian
Interstate Rural 2 2 2 Urban 10 16 11
Principal Arterial Rural 25 21 14 Urban 237 247 271
Minor Arterial Rural 12 10 18 Urban 28 35 41
Major Collector Rural 3 11 10 Urban 0 0 0
Sub Total 317 342 367 Functional Class Rural/Urban One Parked, One Moving
Interstate Rural 33 35 31 Urban 33 39 33
Principal Arterial Rural 34 31 28 Urban 87 80 96
Minor Arterial Rural 19 19 21 Urban 25 20 21
Major Collector Rural 13 20 15 Urban 0 0 0
Sub Total 244 244 245

60
Table 5.5 (continued): Functional Class Crash Count by Collision Type from 2010 to 2012.
Functional Class Rural/Urban 2010 2011 2012
Entering/Leaving Driveway
Interstate Rural 5 2 3 Urban 3 3 4
Principal Arterial Rural 10 8 10 Urban 20 23 25
Minor Arterial Rural 6 5 2 Urban 6 6 3
Major Collector Rural 6 8 10 Urban 0 0 0
Sub Total 56 55 57 Functional Class Rural/Urban Other
Interstate Rural 120 164 160 Urban 171 188 193
Principal Arterial Rural 189 208 204 Urban 338 243 253
Minor Arterial Rural 66 90 84 Urban 51 32 37
Major Collector Rural 42 51 42 Urban 0 1 1
Sub Total 977 977 974 Functional Class Rural/Urban Not Stated
Interstate Rural 0 1 1 Urban 1 2 1
Principal Arterial Rural 0 0 0 Urban 1 0 2
Minor Arterial Rural 0 0 1 Urban 0 0 0
Major Collector Rural 1 1 0 Urban 0 0 0
Sub Total 3 4 5 Total 36,497 36,202 37,165
Reduced access to interstate facilities led to nearly zero Turning Rear End and Same Direction Turning Sideswipe type crashes, the only exceptions being one incident each on an Urban Interstate reported in 2012. Urban Principal Arterials accounted for a significant number of the Turning Rear End type collisions on the network with 208, 225, and 169 crashes in 2010, 2011, and 2012. Same Direction Sideswipe crashes were found to follow an increasing trend going from 3,583 crashes in 2010 to 3,596 crashes in 2011 to 219 crashes in 2012. This trend was consistent within the Urban Interstate and Principal Arterial functional classes, while Rural Principal Arterials demonstrated a reduction from 124 crashes in 2010 to 114 in 2012.

61
Same Direction Turning type crashes decreased from 562 in 2010 to 554 in 2011, but increased to 611 in 2012. While Rural Principal Arterials decreased over the three year span, Urban Principal Arterial Same Direction Turning type crashes increased from 289 in 2010 to 342 in 2012. The number of Head-On crashes was also found to increase from 139 in 2010 to 170 in 2012, while the number of Opposite Direction Sideswipes was found to be 215 in 2010 lowering to 187 in 2012. Opposite Direction Turning type collisions were observed to decrease with 1,410 crashes in 2010 to 1,354 crashes in 2012, with over a third of the incidents occurring on Urban Principal Arterials. Collisions involving Fixed Objects were found to decrease from 2010 to 2011, but increase to 7,065 incidents in 2012, with Principal Arterials accounting for nearly half of the yearly total.
Another consideration in this analysis was the impact pedestrians and bicyclists had on crashes within the major roadway functional classes. It was found that over the three year period, 27 collisions involving bicyclists occurred on the interstate system, 22 of which occurred on Rural Interstates. Of these bicyclist collisions, 24 occurred in 2010 with zero incidents in 2012. Principal Arterials were found to have the highest number of bicyclist related crashes, with Rural regions decreasing from 39 crashes in 2010 to 13 in 2012. Conversely, Urban Arterials increased from 16 bicycle related crashes in 2010 to 140 in 2011 and 130 in 2012. Rural Minor Arterials and Major Collectors showed a decrease over the three year period, while Urban Minor Arterials increased by nearly five times from 2010 to 2012. Overall, bicycle related crashes were found to increase from 134 in 2010, to 197 in 2011, before reducing by 18 crashes reported in 2012.
Collisions involving pedestrians was found to exhibit an increasing trend over the three years with 317, 342, and 367 crashes respectively from 2010 to 2012. A total of 43 crashes over the three year period involved pedestrians on Interstates, of which 37 were found to have occurred in Urban areas. Crashes involving pedestrians on Rural Principal Arterials were found to decrease from 25 in 2010 to 14 in 2012. Urban Principal Arterials in contrast, while not only accounting for about 70% of the total pedestrian related crashes, also increased from 237 in 2010 to 271 in 2012. To a lesser extent, a similar trend was also observed in Urban Minor Arterials with 28 crashes in 2010 increasing to 41 in 2012.
5.2 Crash Summaries by Geographic Class The next series of tables arranges the crash counts according to geographic class beginning
with the total counts for all 6,867.683 miles of mainline roadway in Washington State. The crash counts were arranged based on geographic regions classified by segment AADT and regional census population data. The crash count tables are presented by impact location, collision severities, number of vehicles involved, and collision types. The tables aggregated by geographic class compare the measures of both the section AADT based classification results and the population based results. A large number of segments on the system fall within Small Urbanized, Small Urban or Rural definition when based on population. These segments are not isolated on the network and areas with low population levels could contain segments with very high AADT levels. Incident geographical area type was found to vary depending on the population and AADT of the respective segments on the system.
Table 5.6 shows the comparison of the total crash counts for the AADT and population based geographic class according to: Metropolitan, Large Urbanized, Small Urbanized, Small Urban, and Rural. The population based geographic classification shows that the number of accidents in
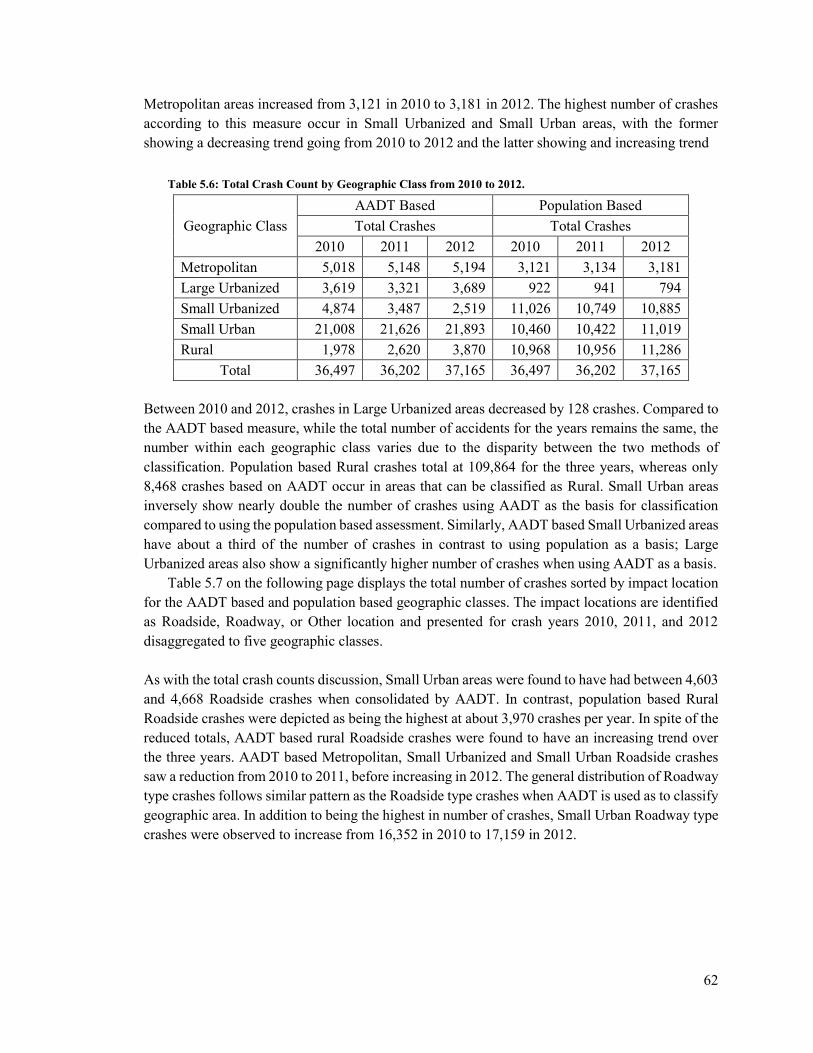
62
Metropolitan areas increased from 3,121 in 2010 to 3,181 in 2012. The highest number of crashes according to this measure occur in Small Urbanized and Small Urban areas, with the former showing a decreasing trend going from 2010 to 2012 and the latter showing and increasing trend
Table 5.6: Total Crash Count by Geographic Class from 2010 to 2012.
Geographic Class AADT Based Population Based Total Crashes Total Crashes
2010 2011 2012 2010 2011 2012 Metropolitan 5,018 5,148 5,194 3,121 3,134 3,181 Large Urbanized 3,619 3,321 3,689 922 941 794 Small Urbanized 4,874 3,487 2,519 11,026 10,749 10,885 Small Urban 21,008 21,626 21,893 10,460 10,422 11,019 Rural 1,978 2,620 3,870 10,968 10,956 11,286
Total 36,497 36,202 37,165 36,497 36,202 37,165 Between 2010 and 2012, crashes in Large Urbanized areas decreased by 128 crashes. Compared to the AADT based measure, while the total number of accidents for the years remains the same, the number within each geographic class varies due to the disparity between the two methods of classification. Population based Rural crashes total at 109,864 for the three years, whereas only 8,468 crashes based on AADT occur in areas that can be classified as Rural. Small Urban areas inversely show nearly double the number of crashes using AADT as the basis for classification compared to using the population based assessment. Similarly, AADT based Small Urbanized areas have about a third of the number of crashes in contrast to using population as a basis; Large Urbanized areas also show a significantly higher number of crashes when using AADT as a basis.
Table 5.7 on the following page displays the total number of crashes sorted by impact location for the AADT based and population based geographic classes. The impact locations are identified as Roadside, Roadway, or Other location and presented for crash years 2010, 2011, and 2012 disaggregated to five geographic classes. As with the total crash counts discussion, Small Urban areas were found to have had between 4,603 and 4,668 Roadside crashes when consolidated by AADT. In contrast, population based Rural Roadside crashes were depicted as being the highest at about 3,970 crashes per year. In spite of the reduced totals, AADT based rural Roadside crashes were found to have an increasing trend over the three years. AADT based Metropolitan, Small Urbanized and Small Urban Roadside crashes saw a reduction from 2010 to 2011, before increasing in 2012. The general distribution of Roadway type crashes follows similar pattern as the Roadside type crashes when AADT is used as to classify geographic area. In addition to being the highest in number of crashes, Small Urban Roadway type crashes were observed to increase from 16,352 in 2010 to 17,159 in 2012.

63
Table 5.7: Geographic Class Crash Count by Impact Location from 2010 to 2012.
Geographic Class AADT Based Population Based
2010 2011 2012 2010 2011 2012 Roadside
Metropolitan 573 625 661 364 343 405 Large Urbanized 444 394 517 124 128 110 Small Urbanized 719 600 516 1,260 1,223 1,275 Small Urban 4,603 4,469 4,668 1,354 1,308 1,427 Rural 676 789 975 3,913 3,875 4,120
Sub Total 7,015 6,877 7,337 7,015 6,877 7,337 Geographic Class Roadway Metropolitan 4,437 4,516 4,523 2,751 2,787 2,775 Large Urbanized 3,169 2,922 3,168 792 805 680 Small Urbanized 4,143 2,871 2,000 9,750 9,506 9,595 Small Urban 16,352 17,086 17,159 9,080 9,093 9,565 Rural 1,299 1,819 2,891 7,027 7,023 7,126
Sub Total 29,400 29,214 29,741 29,400 29,214 29,741 Geographic Class Other Metropolitan 8 7 10 6 4 1 Large Urbanized 6 5 4 6 8 4 Small Urbanized 12 16 3 16 20 15 Small Urban 53 71 66 26 21 27 Rural 3 12 4 28 58 40
Sub Total 82 111 87 82 111 87 Total 36,497 36,202 37,165 36,497 36,202 37,165
Crash counts by geographic class are grouped by collision severities in Table 5.8 presented in the next page. The collision severity categories are listed as: PDO, Possible Injury, Evident Injury, Serious Injury, Fatal, and Unknown Injury. In regard to crash severities, PDO crashes were found to vary between 2,051 and 2,064 crashes over the 3-year period when classified on the population base, a range that increases to 3,417 to 3,563 crashes based on AADT. Similarly, AADT based Large Urbanized and Small Urban PDO crashes were found to be significantly higher than the corresponding population based counts. PDO crash locations that were classified as Small Urbanized and Rural based on population reduced greatly when examined on the AADT basis. Possible Injury crashes followed a similar relationship as demonstrated by the PDOs, with AADT based Small Urban crashes increasing over the 3-year period. AADT based Evident Injury crashes in Metropolitan areas were found to increase from 241 in 2010 to 307 in 2012, while in Small Urbanized areas they were found to decrease over the same period. AADT based Serious Injury crashes in Small Urbanized and Small Urban areas were exhibited a decreasing trend and Rural areas, while being fewer in number compared to the population based classification, showed an increase in number of crashes in 2012 over 2010. Consolidating crashes based on population would suggest that crashes in Rural areas result in the most fatalities on the system, but when classified based on AADT this number was found to indicate Small Urban areas as being more susceptible.

64
Table 5.8: Geographic Class Crash Count by Collision Severity from 2010 to 2012.
Geographic Class AADT Based Population Based
2010 2011 2012 2010 2011 2012 PDO
Metropolitan 3,417 3,432 3,563 2,051 2,069 2,064 Large Urbanized 2,440 2,230 2,412 550 565 470 Small Urbanized 3,208 2,265 1,646 7,366 7,091 7,210 Small Urban 13,657 14,102 14,398 7,064 7,013 7,443 Rural 1,300 1,657 2,563 6,991 6,948 7,395
Sub Total 24,022 23,686 24,582 24,022 23,686 24,582 Geographic Class Possible Injury Metropolitan 1,271 1,316 1,238 834 827 863 Large Urbanized 899 798 993 262 248 204 Small Urbanized 1,181 866 598 2,708 2,751 2,802 Small Urban 4,471 4,659 4,715 2,367 2,369 2,480 Rural 331 502 768 1,982 1,946 1,963
Sub Total 8,153 8,141 8,312 8,153 8,141 8,312 Geographic Class Evident Injury Metropolitan 241 309 307 167 196 205 Large Urbanized 220 222 228 85 104 92 Small Urbanized 360 272 189 699 700 682 Small Urban 2,034 2,135 2,038 745 782 791 Rural 238 328 367 1,397 1,484 1,359
Sub Total 3,093 3,266 3,129 3,093 3,266 3,129 Geographic Class Serious Injury Metropolitan 58 47 52 52 22 34 Large Urbanized 32 39 34 13 10 12 Small Urbanized 79 51 45 141 119 91 Small Urban 478 400 347 148 140 157 Rural 62 76 91 355 322 275
Sub Total 709 613 569 709 613 569 Geographic Class Fatal Metropolitan 10 18 8 6 7 5 Large Urbanized 10 12 7 3 3 3 Small Urbanized 18 11 12 29 29 25 Small Urban 137 130 129 40 26 36 Rural 19 19 24 116 125 111
Sub Total 194 190 180 194 190 180 Geographic Class Unknown Metropolitan 21 26 26 11 13 10 Large Urbanized 18 20 15 9 11 13 Small Urbanized 28 22 29 83 59 75 Small Urban 231 200 266 96 92 112 Rural 28 38 57 127 131 183
Sub Total 326 306 393 326 306 393 Total 36,497 36,202 37,165 36,497 36,202 37,165

65
Geographic class crash counts disaggregated by number of vehicles involved is shown on the following page in Table 5.9. The categories for number of vehicles ranges from one vehicle involved (Veh1) to more than six vehicles involved (≥Veh6).
Table 5.9: Geographic Class Crash Count by Number of Vehicles Involved from 2010 to 2012.
Geographic Class AADT Based Population Based
2010 2011 2012 2010 2011 2012 Number of vehicles - Veh1
Metropolitan 633 744 823 401 400 451 Large Urbanized 531 522 630 203 189 182 Small Urbanized 1,003 817 700 1,592 1,563 1,616 Small Urban 6,840 6,744 6,924 1,928 1,948 2,086 Rural 981 1,151 1,434 5,864 5,878 6,176
Sub Total 9,988 9,978 10,511 9,988 9,978 10,511 Geographic Class Number of vehicles - Veh2
Metropolitan 3,414 3,406 3,382 2,072 2,094 2,115 Large Urbanized 2,361 2,174 2,319 596 617 509 Small Urbanized 3,180 2,186 1,487 7,743 7,542 7,543 Small Urban 12,324 12,839 12,878 7,285 7,197 7,540 Rural 890 1,264 2,066 4,473 4,419 4,425
Sub Total 22,169 21,869 22,132 22,169 21,869 22,132 Geographic Class Number of vehicles - Veh3
Metropolitan 751 763 744 502 484 470 Large Urbanized 563 496 576 100 104 83 Small Urbanized 526 387 256 1,311 1,315 1,375 Small Urban 1,538 1,696 1,734 1,021 1,049 1,111 Rural 91 163 291 535 553 562
Sub Total 3,469 3,505 3,601 3,469 3,505 3,601 Geographic Class Number of vehicles - Veh4
Metropolitan 171 184 200 112 123 117 Large Urbanized 139 93 132 21 26 19 Small Urbanized 126 71 68 304 252 291 Small Urban 253 280 289 192 189 233 Rural 14 37 66 74 75 95
Sub Total 703 665 755 703 665 755 Geographic Class Number of vehicles - Veh5
Metropolitan 34 39 41 25 27 23 Large Urbanized 19 24 25 2 2 1 Small Urbanized 22 21 4 50 58 48 Small Urban 38 49 49 23 28 41 Rural 1 4 11 14 22 17
Sub Total 114 137 130 114 137 130 Geographic Class Number of vehicles - ≥Veh6
Metropolitan 15 12 4 9 6 5 Large Urbanized 6 12 7 0 3 0 Small Urbanized 17 5 4 26 19 12 Small Urban 15 18 19 11 11 8 Rural 1 1 2 8 9 11
Sub Total 54 48 36 54 48 36 Total 36,497 36,202 37,165 36,497 36,202 37,165

66
For crashes involving one or two vehicles, the population based definition suggests Rural areas having the most occurrences; when based on AADT, the counts shift towards Small Urban areas. The number of single vehicle crashes in Small Urban areas dips from 2010 to 2011, and increases in 2012, while the number of two vehicle crashes shows an increasing trend. The number of Rural two vehicle crashes increases when based on AADT, but the total crash counts are much lower when compared to the population based classification. Three vehicle crashes in areas with Small Urban levels of AADT were found to be much higher than those in areas of Rural AADT. Crashes involving four vehicles were observed to increase in areas with Metropolitan, Small Urban, and Rural levels of AADT, whereas Small Urbanized levels of AADT decreased over the three-year period. Population based measures would indicate that there were 28 crashes in Rural areas involving six vehicles or more, but when AADT is taken into account this number dropped to four crashes over the three-year span. It was found that while many of the crashes were recorded as having occurred in Rural areas based on segment area population, these numbers changed because of the AADT based geographical classifications reported on the segments. Table 5.10 on the following pages will present the crash counts for the 19 different collision types arranged by geographic class from 2010 to 2012 for the AADT and population based measures. Rear End crashes were counted at their highest numbers in segments with Small Urban levels of AADT, with an increase in counts from 2010 to 2012 for both AADT levels with Small Urban and Rural levels. The number of Rear End crashes in areas with Large Urbanized levels of AADT was found to be in the range of 2,108 to 2,229 crashes, substantially higher than the numbers within Large Urbanized populated areas. Similarly, Turning Rear End, Same Direction Turning Sideswipe, and Same Direction Sideswipe type crashes were found to occur more frequently in areas with Small Urban levels of AADT, the latter two demonstrating an increase over the three year period. Same Direction Sideswipe crashes were observed to decrease for segments with Small Urbanized levels of AADT. Head-On collisions were at their highest counts in Small Urban levels of AADT while Rural and Small Urbanized levels of AADT showed an increase from 2010 to 2012. Opposite Direction Sideswipe crashes have the greatest counts at Small Urbanized AADT levels or lower with Small Urban and Small Urbanized levels of AADT indicating a decrease in crash counts over the three years. Opposite Direction Turning type crashes were significantly higher in areas with Small Urban levels of AADT, but Rural and Large Urbanized appeared to increase. As with the previous crash types, Small Urban levels of AADT accounted for more Fixed Object, Overturned, Entering/Leaving Driveway, and Entering at an Angle crashes than the other geographic class. The population based classification would suggest that Rural areas experienced the highest number of bicycle related crashes. Based on AADT, Rural bicycle crashes reduced to 45 crashes over the three-year period. Alternatively, areas with Small Urban levels of AADT were found to have had 386 crashes with an increase in crash counts over the same period. A similar observation was made with respect to crashes involving pedestrians, with increasing crash counts for all geographic classes with the exception of areas with the Small Urbanized class.

67
Table 5.10: Geographic Class Crash Count by Collision Type from 2010 to 2012.
Geographic Class AADT Based Population Based
2010 2011 2012 2010 2011 2012 Rear End
Metropolitan 2,982 2,974 2,951 1,774 1,815 1,771 Large Urbanized 2,229 2,003 2,108 380 417 324 Small Urbanized 2,343 1,636 1,013 5,710 5,588 5,602 Small Urban 6,881 7,515 7,548 4,669 4,718 4,829 Rural 451 773 1,259 2,353 2,363 2,353
Sub Total 14,886 14,901 14,879 14,886 14,901 14,879 Geographic Class Turning Rear End Metropolitan 9 9 2 10 2 4 Large Urbanized 1 5 5 2 3 1 Small Urbanized 60 16 21 95 106 74 Small Urban 168 206 155 113 107 99 Rural 9 10 20 27 28 25
Sub Total 247 246 203 247 246 203 Geographic Class Same Direction Turning Sideswipe Metropolitan 9 7 9 13 11 10 Large Urbanized 3 3 6 12 4 4 Small Urbanized 22 7 10 49 53 58 Small Urban 122 132 135 75 70 85 Rural 13 7 14 20 18 17
Sub Total 169 156 174 169 156 174 Geographic Class Same Direction Sideswipe Metropolitan 865 817 842 484 474 533 Large Urbanized 507 492 563 75 99 75 Small Urbanized 563 377 269 1,457 1,415 1,518 Small Urban 1,506 1,733 1,762 1,031 1,076 1,152 Rural 142 177 379 536 532 537
Sub Total 3,583 3,596 3,815 3,583 3,596 3,815 Geographic Class Same Direction Turning Metropolitan 17 43 37 24 39 25 Large Urbanized 20 9 16 21 18 15 Small Urbanized 49 42 40 117 125 128 Small Urban 436 419 444 207 189 226 Rural 40 41 74 193 183 217
Sub Total 562 554 611 562 554 611

68
Table 5.10 (continued): Geographic Class Crash Count by Collision Type from 2010 to 2012.
Geographic Class AADT Based Population Based
2010 2011 2012 2010 2011 2012 Same Direction Others
Metropolitan 204 204 179 89 99 89 Large Urbanized 118 92 152 29 20 17 Small Urbanized 141 111 79 356 309 345 Small Urban 569 561 622 292 288 345 Rural 32 67 101 298 319 337
Sub Total 1,064 1,035 1,133 1,064 1,035 1,133 Geographic Class Head On Metropolitan 3 6 13 2 1 9 Large Urbanized 2 5 4 1 3 5 Small Urbanized 11 12 18 22 20 25 Small Urban 114 101 117 40 37 44 Rural 9 17 18 74 80 87
Sub Total 139 141 170 139 141 170 Geographic Class Opposite Direction Sideswipe Metropolitan 11 6 6 7 6 3 Large Urbanized 3 10 3 0 0 1 Small Urbanized 22 15 12 32 27 27 Small Urban 161 148 132 51 48 47 Rural 18 38 34 125 136 109
Sub Total 215 217 187 215 217 187 Geographic Class Opposite Direction Sideswipe Metropolitan 68 75 61 118 119 103 Large Urbanized 37 41 48 52 46 52 Small Urbanized 180 106 87 442 435 386 Small Urban 1,071 1,094 1,056 556 538 579 Rural 54 57 102 242 235 234
Sub Total 1,410 1,373 1,354 1,410 1,373 1,354 Geographic Class Fixed Object Metropolitan 578 609 688 356 320 388 Large Urbanized 466 427 507 147 143 124 Small Urbanized 762 646 529 1,272 1,222 1,273 Small Urban 4,350 4,278 4,474 1,396 1,343 1,466 Rural 604 687 867 3,589 3,619 3,814
Sub Total 6,760 6,647 7,065 6,760 6,647 7,065

69
Table 5.10 (continued): Geographic Class Crash Count by Collision Type from 2010 to 2012.
Geographic Class AADT Based Population Based
2010 2011 2012 2010 2011 2012 Entering At Angle
Metropolitan 111 144 169 120 108 113 Large Urbanized 74 69 70 118 119 100 Small Urbanized 346 242 184 946 877 893 Small Urban 2,465 2,299 2,320 1,183 1,132 1,239 Rural 174 196 331 803 714 729
Sub Total 3,170 2,950 3,074 3,170 2,950 3,074 Geographic Class Overturned Metropolitan 51 67 61 25 26 21 Large Urbanized 51 47 60 11 9 7 Small Urbanized 89 62 51 141 138 132 Small Urban 858 795 783 182 169 151 Rural 163 168 196 853 797 840
Sub Total 1,212 1,139 1,151 1,212 1,139 1,151 Geographic Class Animal Metropolitan 8 16 33 2 2 0 Large Urbanized 25 34 28 14 13 5 Small Urbanized 52 57 74 33 53 48 Small Urban 1,093 1,095 1,097 161 194 220 Rural 171 226 290 1,139 1,166 1,249
Sub Total 1,349 1,428 1,522 1,349 1,428 1,522 Geographic Class Bicycle Metropolitan 1 14 12 0 19 15 Large Urbanized 2 2 6 2 9 13 Small Urbanized 6 23 13 2 62 53 Small Urban 105 141 140 9 74 67 Rural 20 17 8 121 33 31
Sub Total 134 197 179 134 197 179 Geographic Class Pedestrian Metropolitan 11 35 25 40 39 43 Large Urbanized 7 6 25 17 11 31 Small Urbanized 66 35 27 102 112 103 Small Urban 221 250 264 106 122 133 Rural 12 16 26 52 58 57
Sub Total 317 342 367 317 342 367

70
Table 5.10 (continued): Geographic Class Crash Count by Collision Type from 2010 to 2012.
Geographic Class AADT Based Population Based
2010 2011 2012 2010 2011 2012 One Parked, One Moving
Metropolitan 20 31 23 15 20 24 Large Urbanized 13 8 23 4 2 3 Small Urbanized 31 32 29 37 35 40 Small Urban 168 144 144 88 78 83 Rural 12 29 26 100 109 95
Sub Total 244 244 245 244 244 245 Geographic Class Entering/Leaving Driveway Metropolitan 2 3 8 6 2 4 Large Urbanized 1 1 2 1 1 0 Small Urbanized 5 4 1 4 8 5 Small Urban 40 42 42 22 24 24 Rural 8 5 4 23 20 24
Sub Total 56 55 57 56 55 57 Geographic Class Other Metropolitan 67 88 74 35 32 26 Large Urbanized 60 66 62 36 24 17 Small Urbanized 126 64 62 208 164 173 Small Urban 678 671 655 279 214 229 Rural 46 88 121 419 543 529
Sub Total 977 977 974 977 977 974 Geographic Class Not Stated Metropolitan 1 0 1 1 0 0 Large Urbanized 0 1 1 0 0 0 Small Urbanized 0 0 0 1 0 2 Small Urban 2 2 3 0 1 1 Rural 0 1 0 1 3 2
Sub Total 3 4 5 3 4 5 Total 36,497 36,202 37,165 36,497 36,202 37,165
6.0 Model Findings We begin with the discussion of results from the population-ADT classification models. This discussion provides a rational basis for evaluating the conventional urban-suburban modeling typology that typically includes three-lane, four-lane, five-lane and six-plus lane SPFs. The reasoning is that the population-ADT classifications are subsumed within the conventional urban-suburban architecture, but not in a neat nested manner. For example, a five-lane urban SPF can contain variables that belong in part to the urban-urban classification, and in part to an urban-rural

71
classification. Due to this potential crossover effect, the heterogeneities extracted from the population-ADT classification are more micro-level than those that will be uncovered in the traditional urban-suburban SPF architecture. The implications are that the random parameter mean and standard deviation in the traditional urban-suburban architecture may not reflect the mean shifts due to the population-ADT effects that drive the underlying sub categories of urban-suburban arterials. Hence, inferences can be too aggregate – and one can miss the opportunity to target locations of safety interest at a more micro level consistent with the population-ADT classifications. Global findings from the population-ADT classification models are based on the following geometric characteristics: Lanes (number of lanes increasing, number of lanes decreasing, roadway width increasing, roadway width decreasing); Shoulders (shoulder width left, shoulder width left center, shoulder width right center, shoulder width right); Vertical alignment (vertical curve BVC arm, vertical curve VPI arm, vertical curve EVC arm, vertical curve length, vertical curve percent grade ahead, vertical curve percent grade back); and Horizontal alignment (horizontal curve point of tangency arm, horizontal curve point of curvature arm, horizontal curve radius, horizontal curve maximum (super) elevation, horizontal curve length, horizontal curve central angle)
Out of the above mentioned 20 significant features, number of lanes, roadway width, shoulder width, point of vertical tangent grade (PVT), vertical curve point of vertical curve grade (PVC) horizontal curve maximum superelevation (e), curve central angle (delta), horizontal curve radius (R) were found to be random parameters. In addition, derived measures such as degree of curve, absolute vertical grade difference (A), and rate of vertical curvature (K) were also found to be random. The majority of the statistically significant effects were geometric. In addition, functional class indicators such as minor arterial indicator were also found to be random. Roadside information was not fully evaluated due to inconsistencies in matching roadside inventories for all homogeneous segments. Nevertheless, the finding of randomness in a substantial number of geometric features merits attention. First, it demonstrates the significant amount of unobserved heterogeneity that is present in the urban-suburban context. There is no particular pattern in the nature of the randomness of parameters across the population-ADT spectrum. In other words, we do not observe a greater degree of randomness (as in numerous random parameters) in the urban-urban context, which one would typically expect due to traffic flow heterogeneities and functional class variations. The heterogeneity of horizontal curvature variables such as degree of curve and radius reflects the fact that driver response to sharpness of curve effects is variable across segments, and that it is not reasonable to constrain the effect of curve degree or radius to a fixed parameter across segments. Likewise, the effect of superelevation is also not expected to be fixed across segments due to the inherent variations in superelevation design and driver reaction with respect to lane position on a superelevated curve. Randomness of superelevation effects in this study turns out to be motivated

72
by the maximum value in a segment. This effect appears to capture the sensitivity of superelevation variation within the curve and associated driver expectations. The randomness of vertical curvature parameters such as rate of vertical curvature and absolute grade difference reflects the variations from segment to segment due to design speed effects. The rate of vertical curvature in particular is a direct measure of design speed application, and it is not reasonable to constrain this effect to be fixed across segments. The absolute grade difference is a parameter that is influenced by the design speed and the length of curve. For the same A value, one can expect a longer curve with a higher design speed, versus a shorter curve with a lower design speed. It is not reasonable to expect the same effect size across these two segment types. The randomness of vertical curve grades (PVC and PVT) is an interesting finding. It appears that the effect of a 3% forward tangent in a segment A would have a different effect size compared to the same magnitude forward tangent in segment B. While this is expected, the context in which this occurs requires further attention. For example, it is not possible to discern with the given data organization whether this is due to within-segment design features alone, or also motivated by prior segment and following segment features. The same reasoning is applied to the interpretation of randomness of the backward tangent as well. The heterogeneity effect, i.e., the random parameter means are smaller compared to the effect of the absolute grade difference by an order of magnitude, but still statistically significant. The discussion above summarizes the findings from the population-ADT classification models. Out of the 24 major categories that were developed, 16 categories yielded sufficient sample sizes so as to enable the estimation of random parameter models. The six categories that did not yield estimable models included with sample size in parentheses: Rural-metropolitan (0); Large urban-large urbanized (0); Large urbanized-small urban (200); Metropolitan-large urbanized (0); Small urbanized-large urbanized (16); Large urbanized-metropolitan (8); Small urbanized-metropolitan (198); and Rural-large urbanized (188) As result, a total of 87 models were estimated for the population-ADT classification SPFs.
6.1 Conclusions and Recommendations Several conclusions arise from the development of the 87 models developed in this study. First and foremost is the treatment of heterogeneity in the form of random parameters in SPF development in the urban-suburban context. Since the majority of parameters that are random are geometric in nature, context appears to play a role that in that the roadside environment is unaccounted for. The treatment of roadside data on a consistent basis and its inclusion in the model

73
database will potentially alleviate some of the ambiguities in the random parameter effects currently attributed to horizontal and vertical curvature. Second, the presence of transition zones in the urban-suburban border areas can also play a role in the generation of unobserved heterogeneity. Land use information is usually a reasonable proxy for capturing this transition effect, in addition to design features such as speed limit change zones, cross sectional change areas and signage control. The addition of such data can provide added resolution to the nature of unobserved heterogeneity and the role it plays in the significance of geometric random parameters. Third, the effect of roadside environment variables such as lighting, curb and sidewalk presence can also play a role in generating unobserved heterogeneities in the geometric parameter effect. Lighting is most likely a factor in segments containing horizontal curves, as well as vertical curves with climbing lanes, transition zones and segments where pedestrian and nonmotorized activity is significant. The addition of lighting data can provide for a richer set of random parameter identifications with more accurate effect sizes attributed to urban-suburban roadway geometry. Roadside geometry is also potentially random if it were included. In the case of roadside geometry an added computational burden arises. Roadside geometry due to its correlation with roadway geometry will motivate the need for random parameter models where parameter correlation cannot be ignored. The correlated parameter models pose the burden of larger parameter dimensionalities and difficulties in interpretation. For example, if a roadside parameter represents a roadside variable that is an indicator, and its correlation with a roadway geometry parameter such as degree of curve is found to be significant, then, we have a potential mix of parameter distributions. This mix of parameter distributions makes the interpretations of parameter effects and their standard deviations difficult. In random parameter models, it is often useful to consider the simpler of mixing distributions, such as normal only distributions. However, given the complexity of the urban-suburban context, this aforementioned simplicity may not be suitable, motivating instead a much more complex modeling typology. The urban-suburban context is therefore a challenging area to gain insights from with respect to targeted geometric treatment; however, this challenge can be mitigated with the addition of consistent roadside geometry data, roadside environment data, and land use data. With respect to modeling architectures, it is worthwhile to consider the mapping of the population-ADT classification SPFs with the conventional urban-suburban architecture in an embedded manner. For example, one can use population-ADT classification data indicators as additional variables in five-lane urban arterial SPF to see if the indicator is random or fixed across segments. Any randomness in the indicator will suggest that the heterogeneity due to multiple population-ADT class effects is significant. As a result, it may be worthwhile to consider further deepening of the five-lane SPF into stratifications along the population-ADT subsets provided that adequate sample sizes allow that differentiation. Another aspect that has not been evaluated in this study is the effect of heterogeneity in means in random parameter models. Heterogeneity in the mean of a geometric parameter can result in mean

74
shifts within stratified subgroups. For example, if it is determined that roadside variables are significant sources of heterogeneity in means, then, one can examine the nature of random parameter means by roadside stratification. This type of analysis also has its computational limitations due to parameter dimensionality. However, careful choice of the roadside stratifications, as well as potential land use and roadside environment stratifications can provide additional insights that can enrich the process of safety location prioritization.
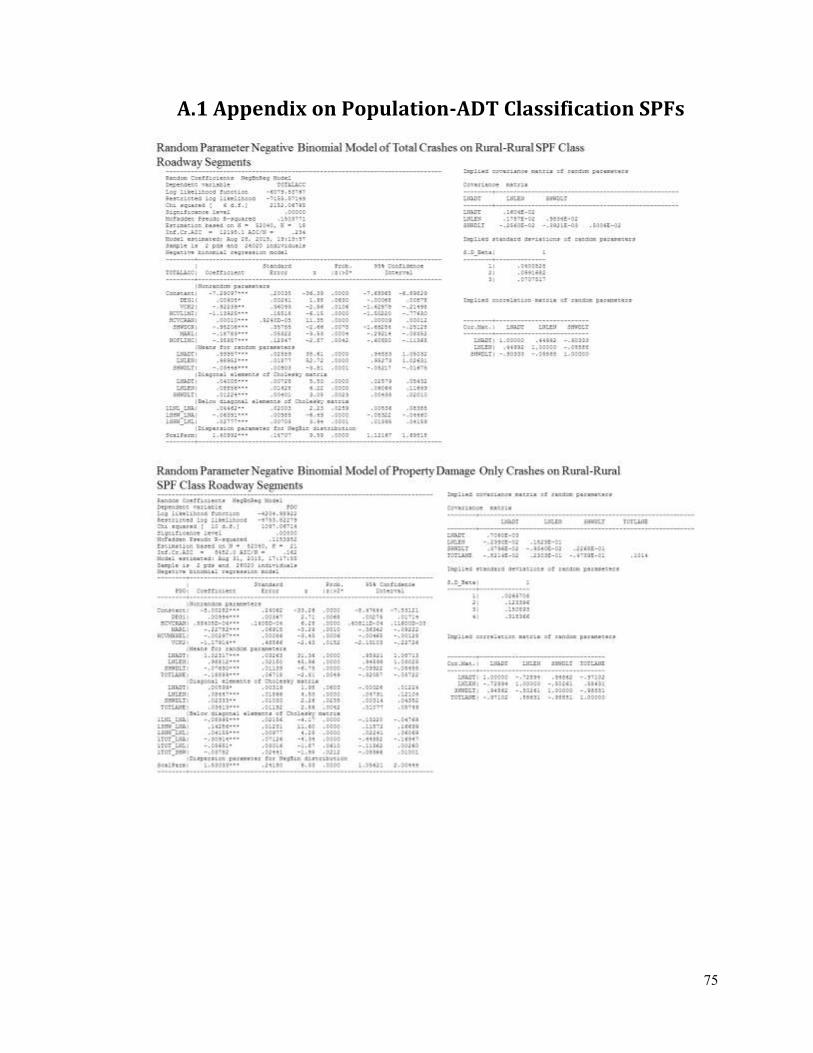
75
A.1 Appendix on Population-ADT Classification SPFs

76

77

78
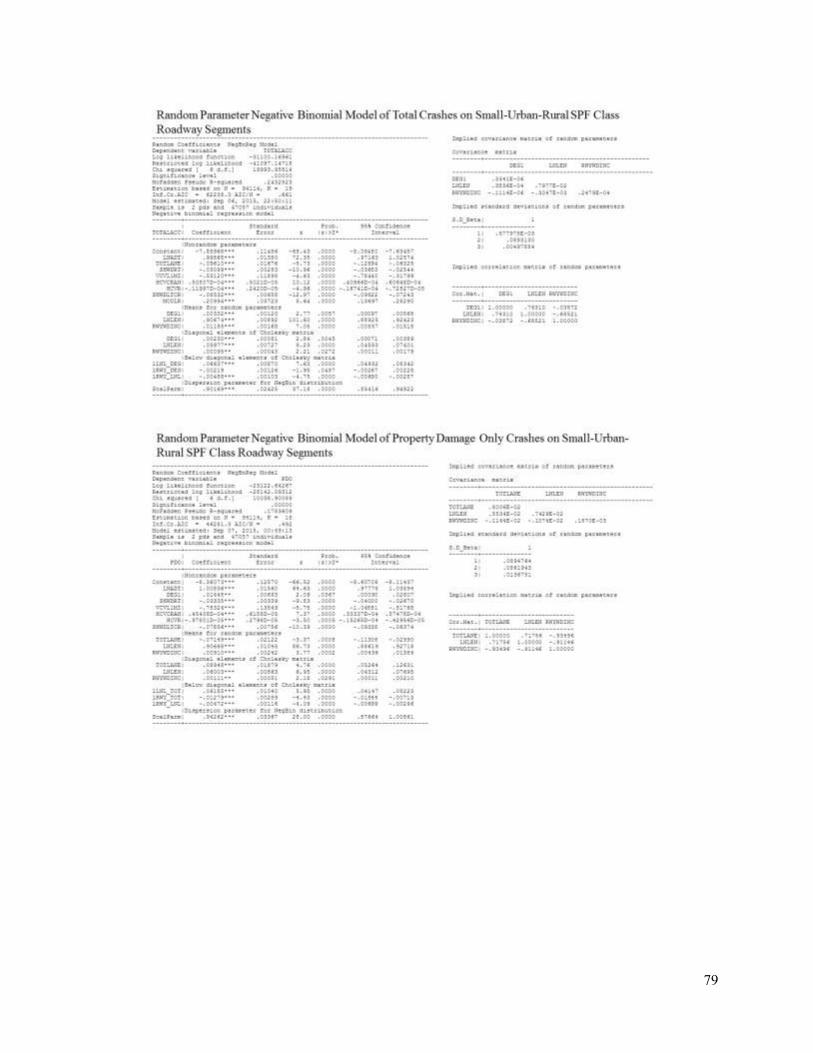
79

80

81

82

83

84

85

86

87
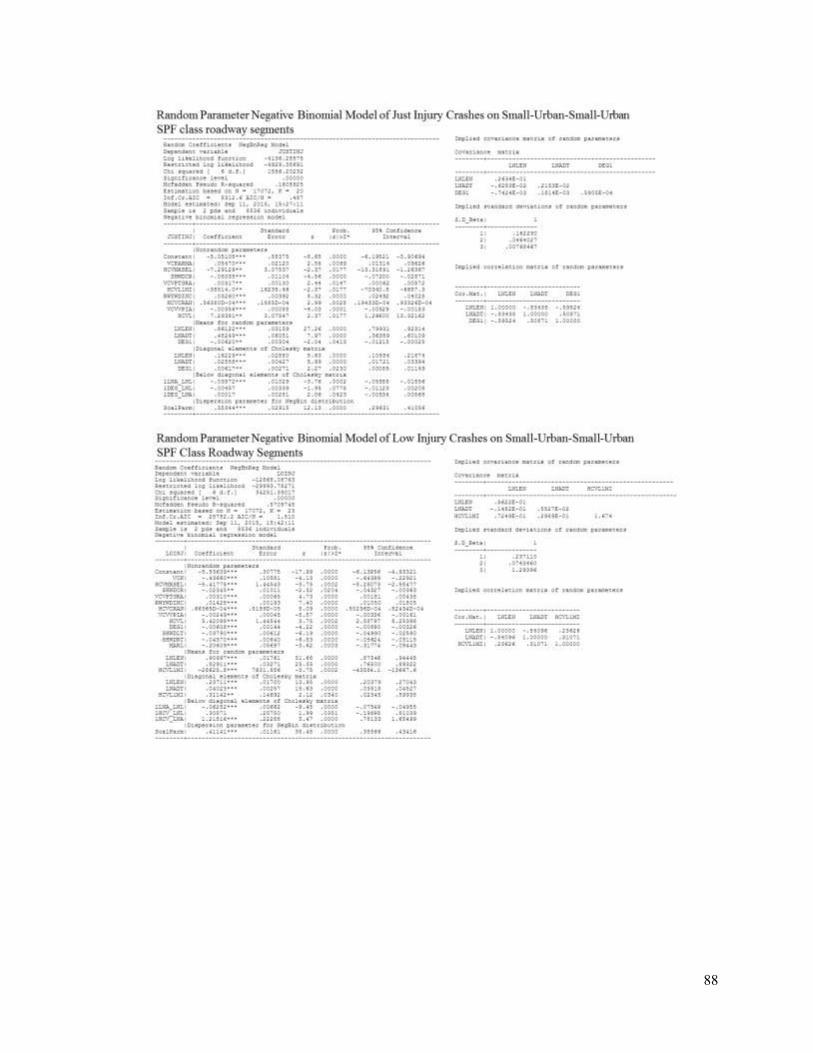
88

89

90

91

92

93

94
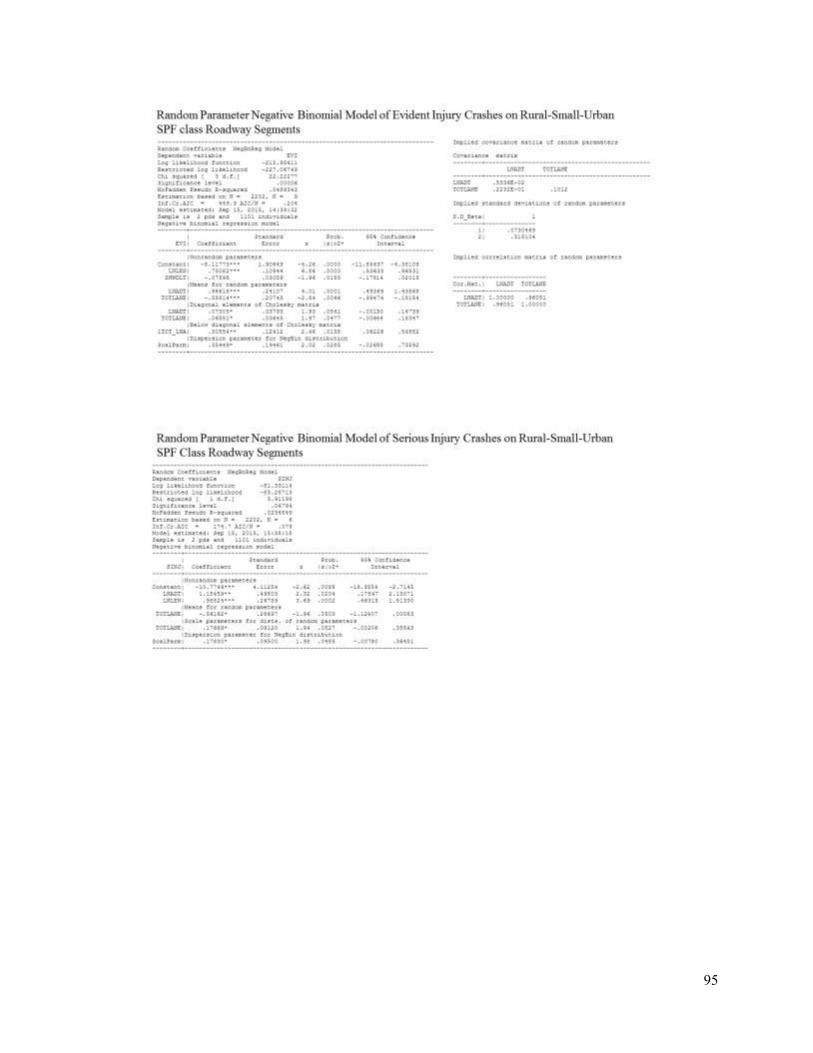
95
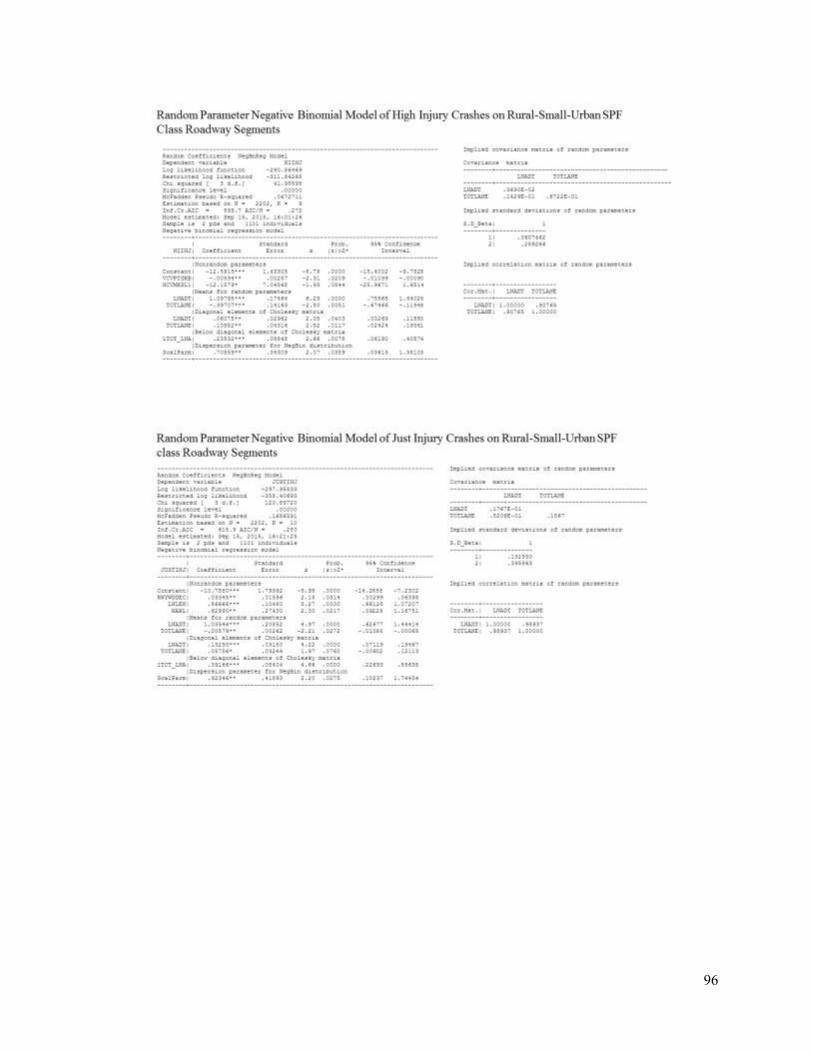
96

97

98
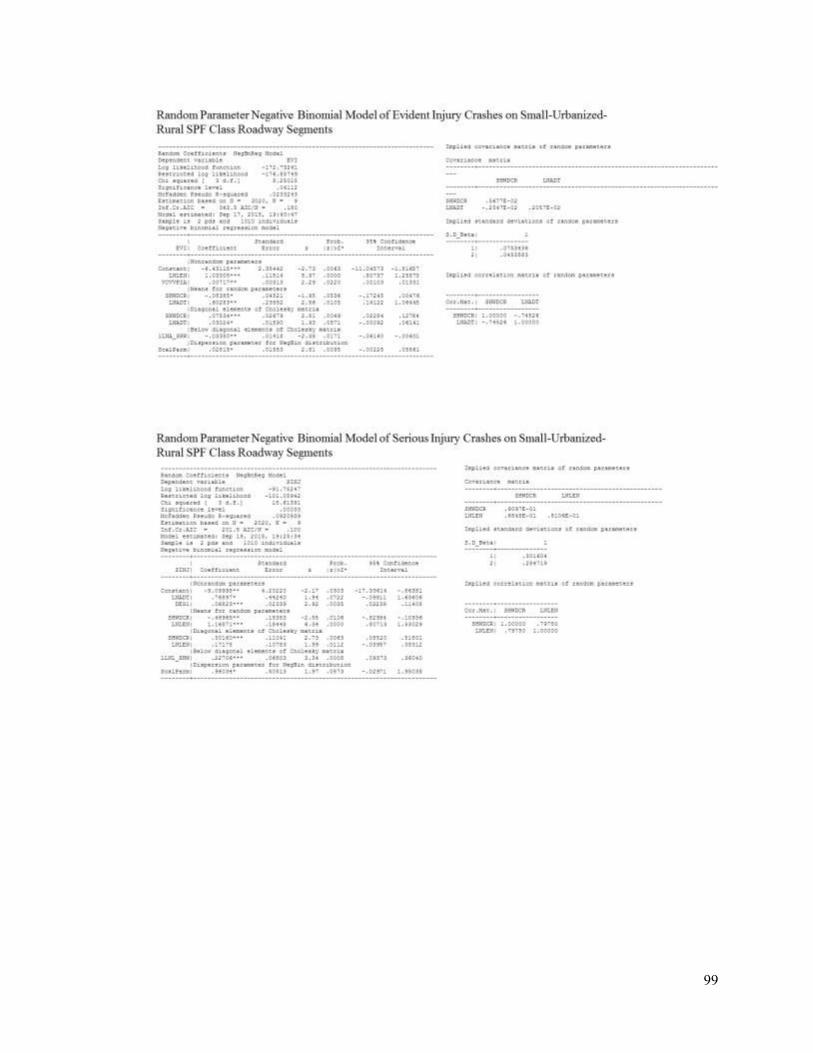
99

100

101
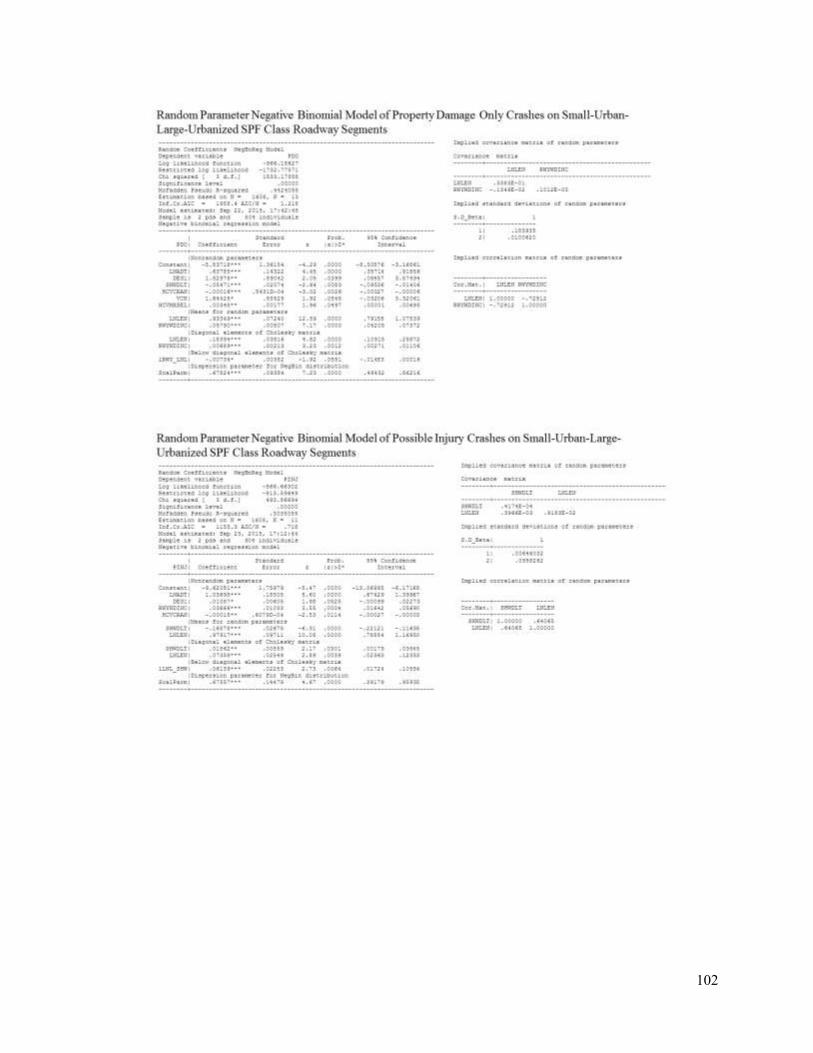
102

103
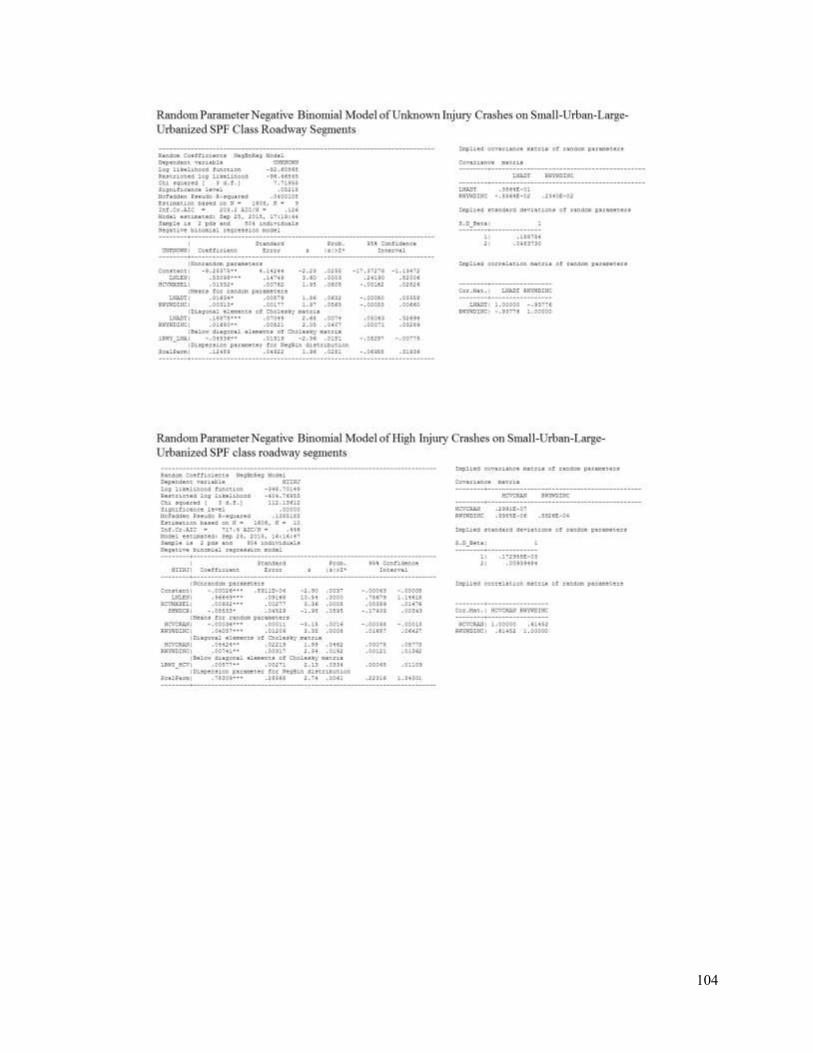
104

105

106

107

108

109

110

111
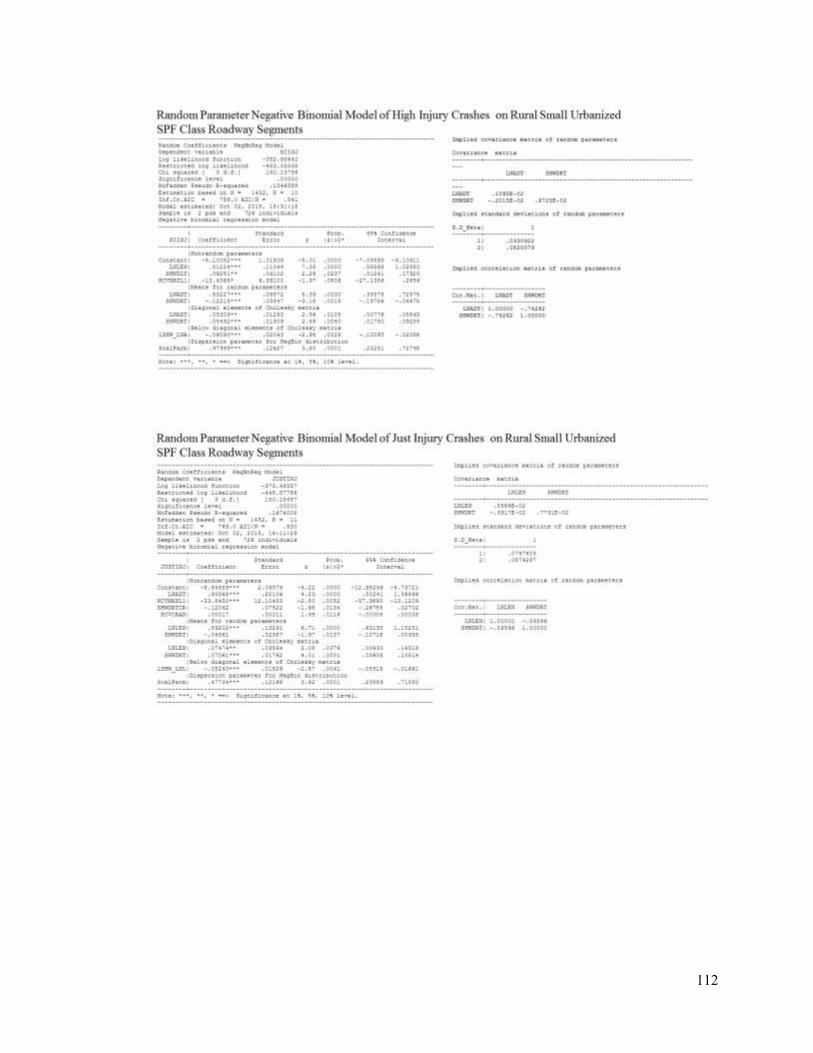
112

113

114

115
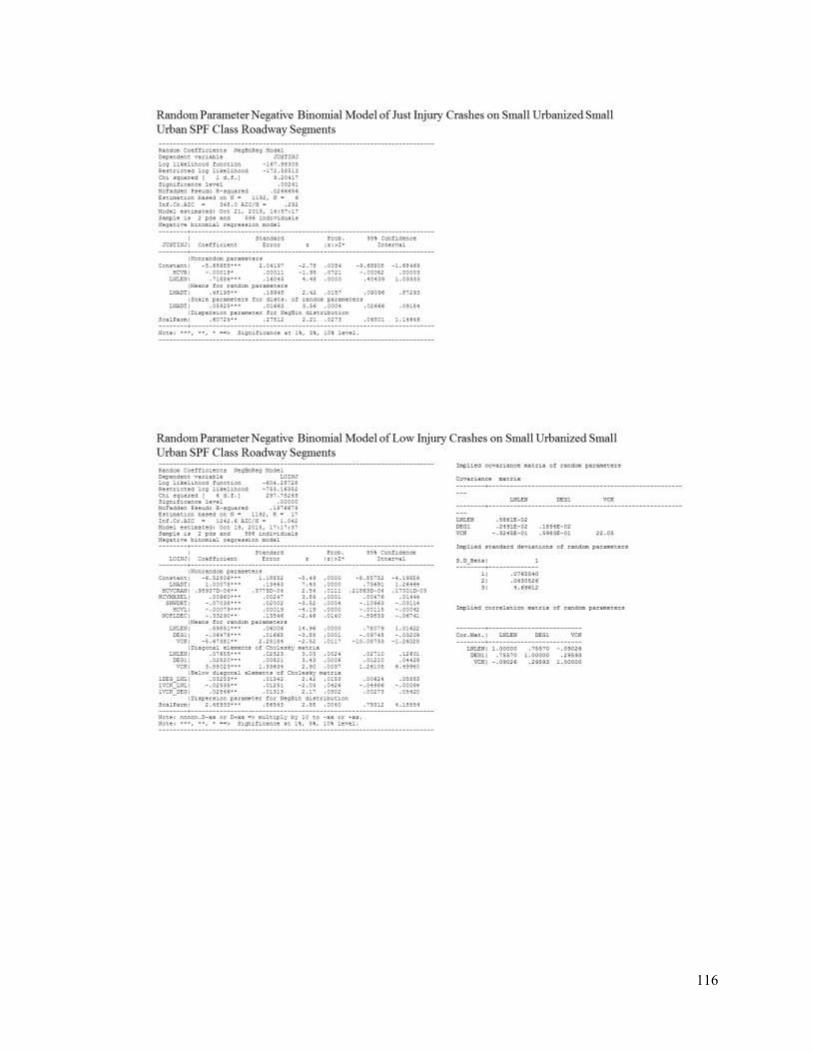
116

117

118
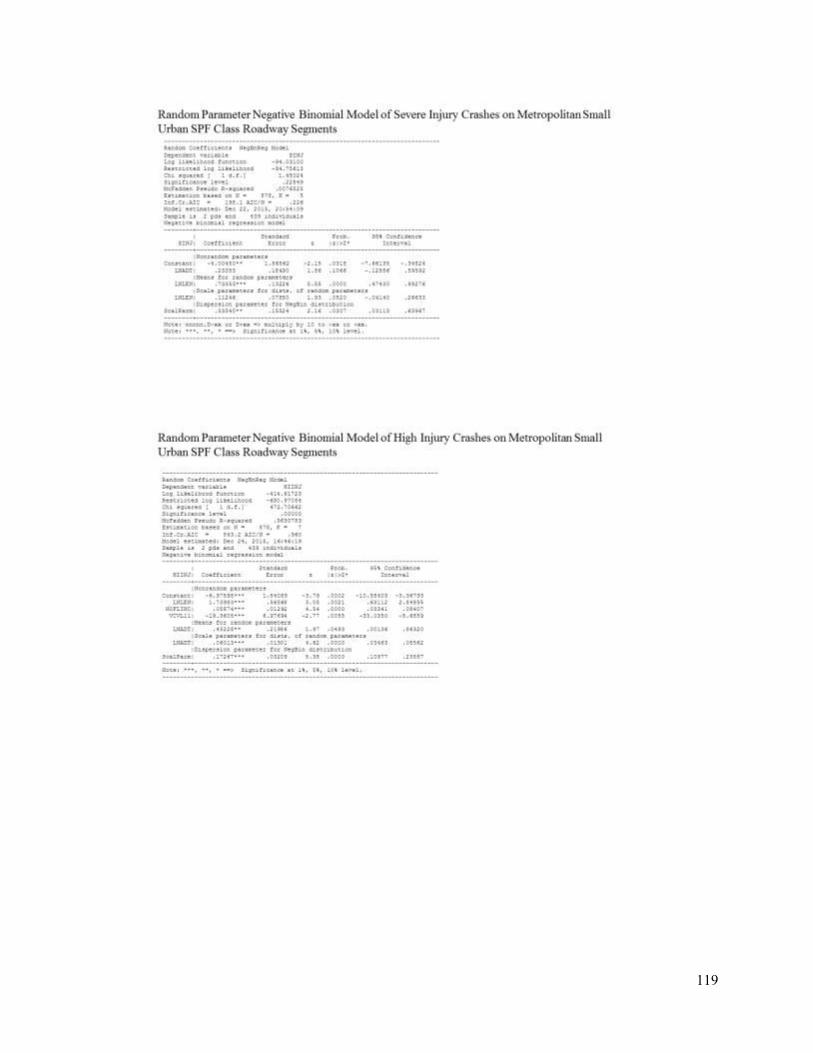
119

120

121
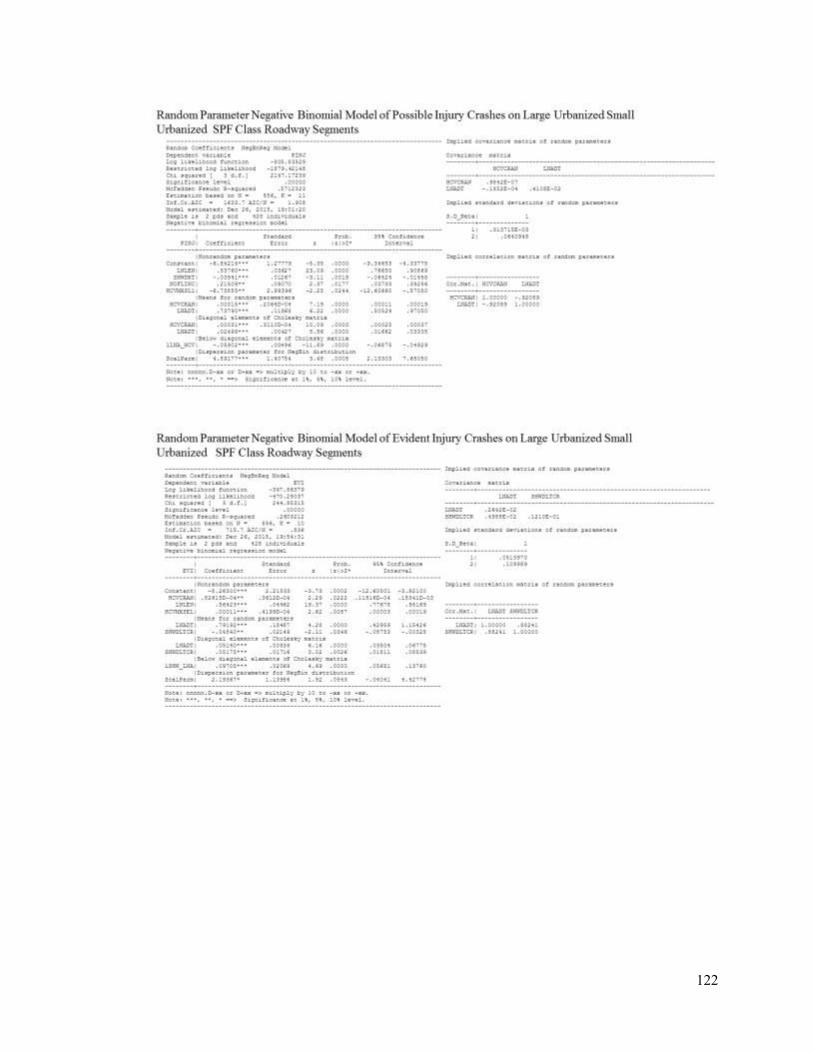
122
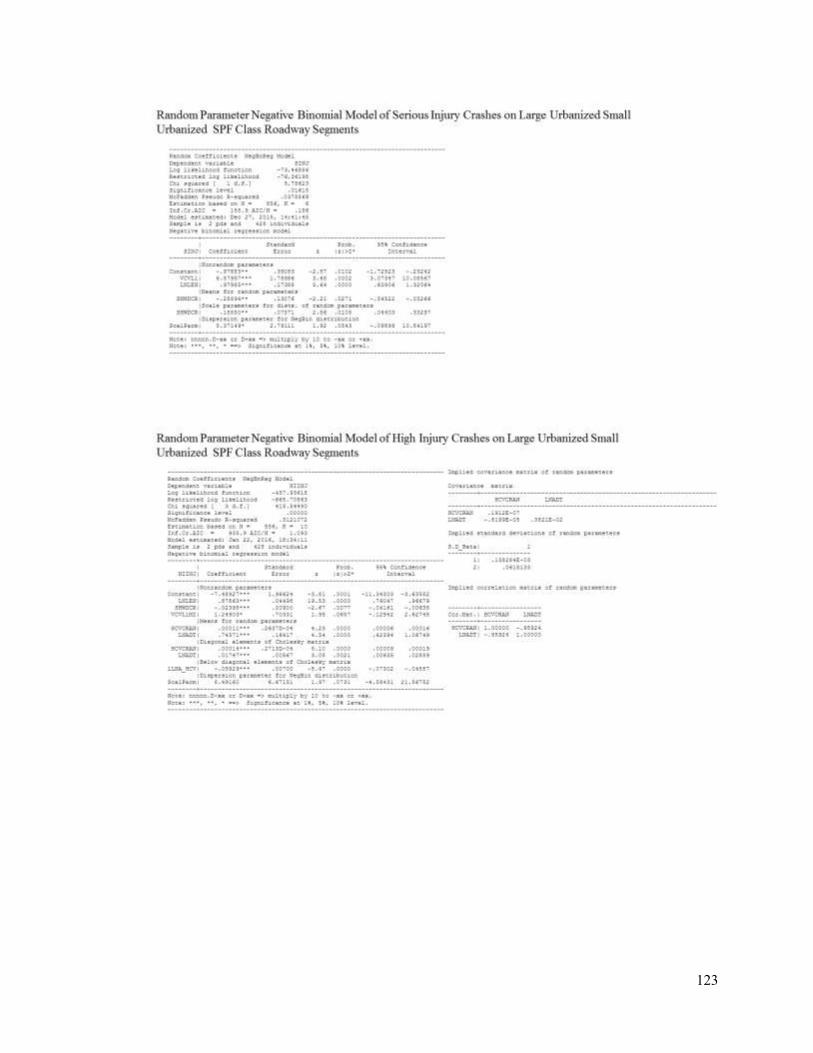
123

124

125
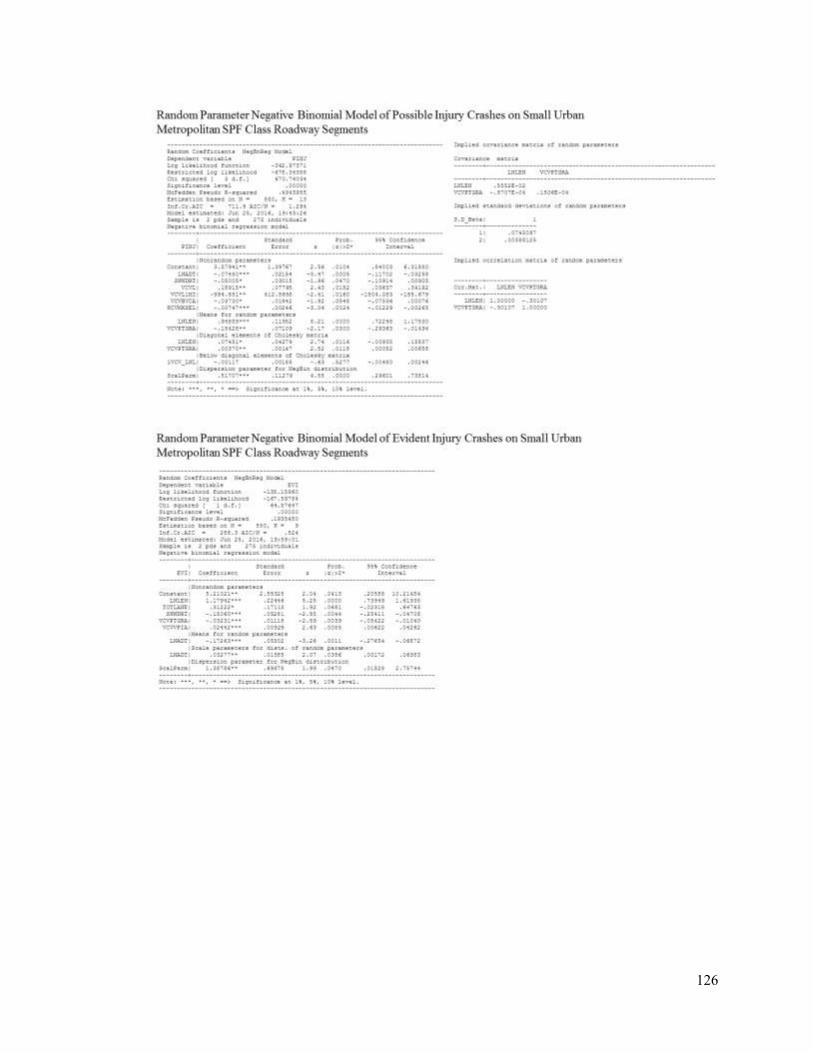
126

127

128

129

130
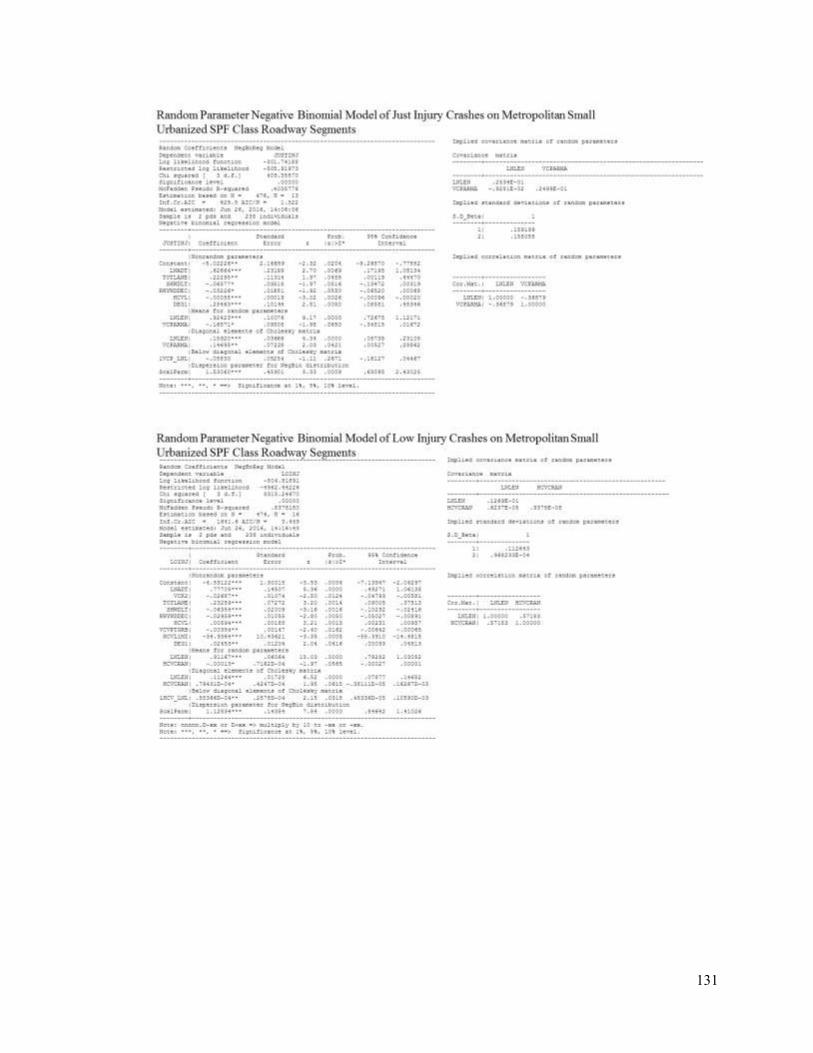
131

132

133

134

135

136
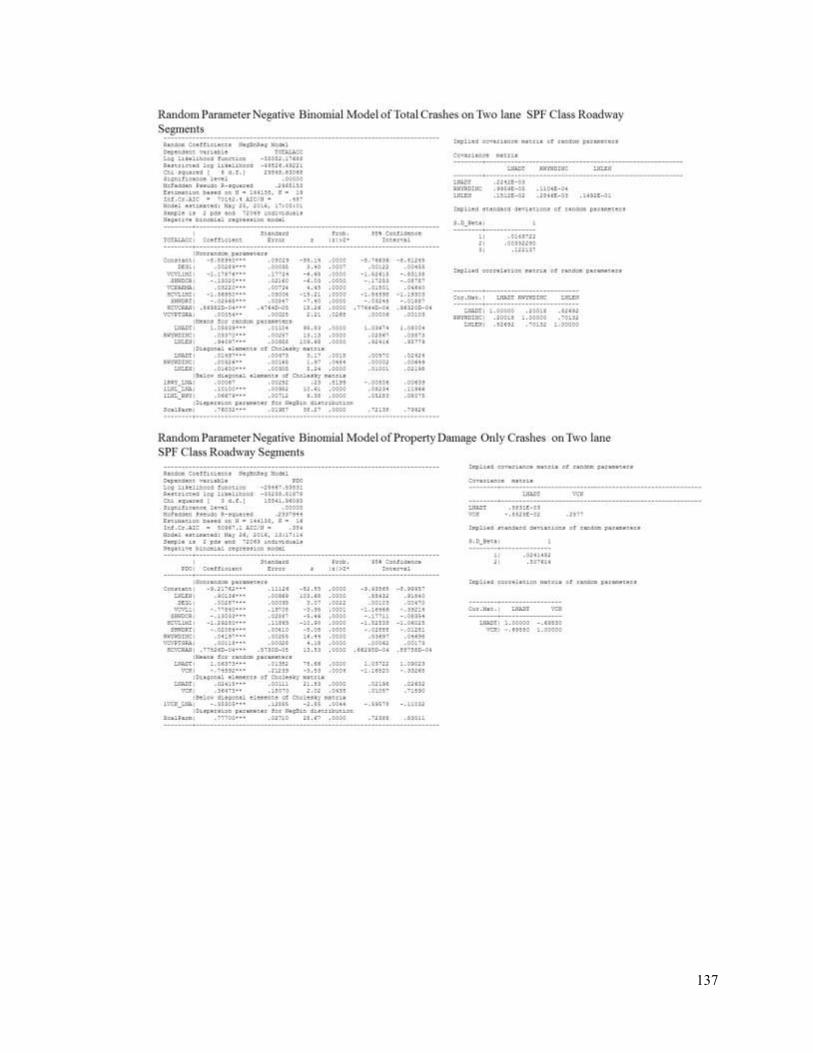
137
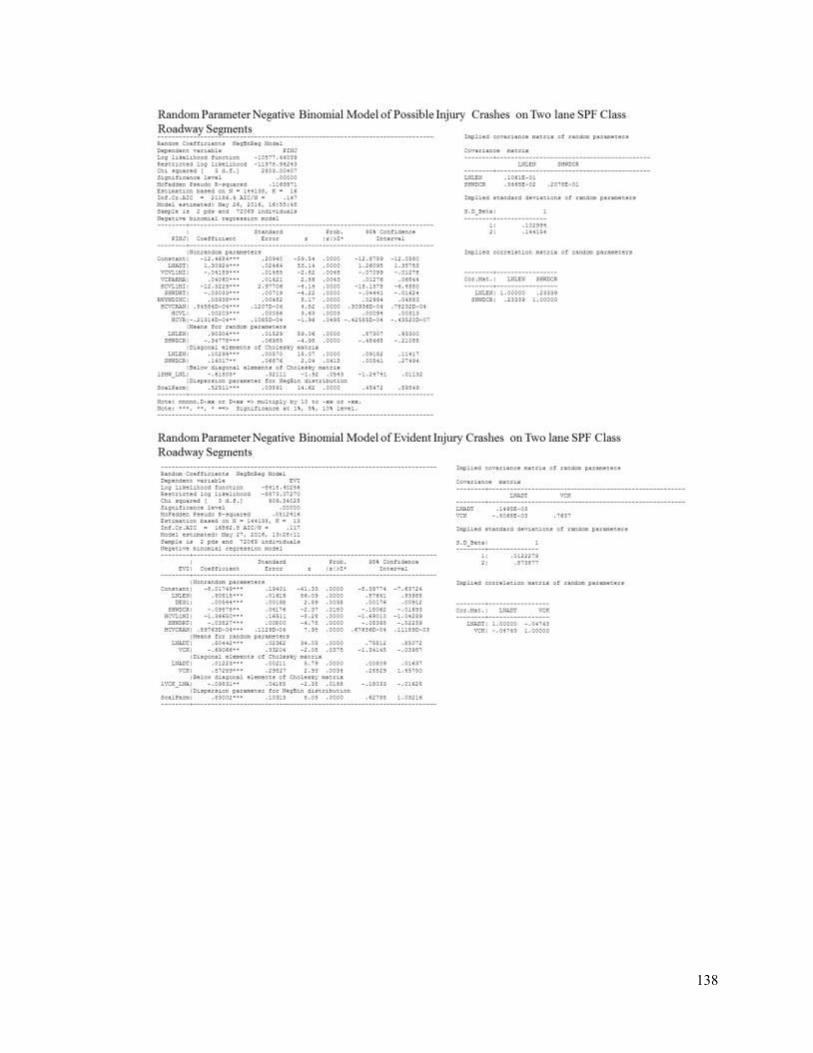
138

139

140
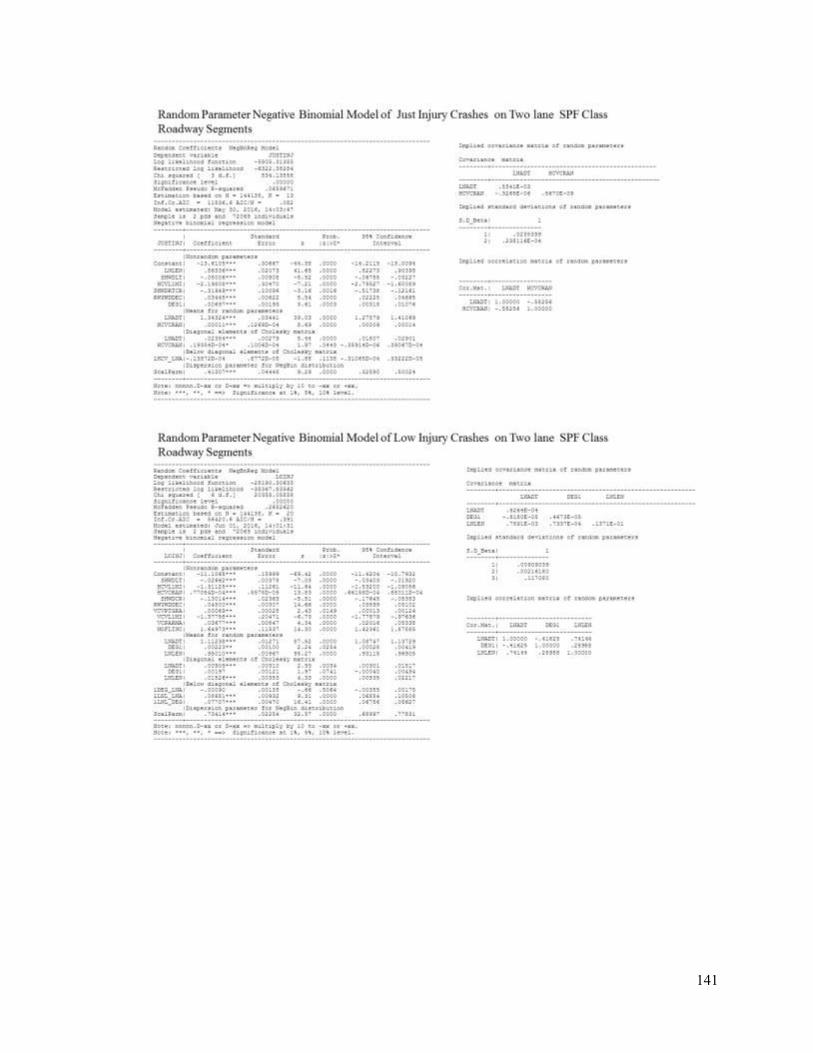
141
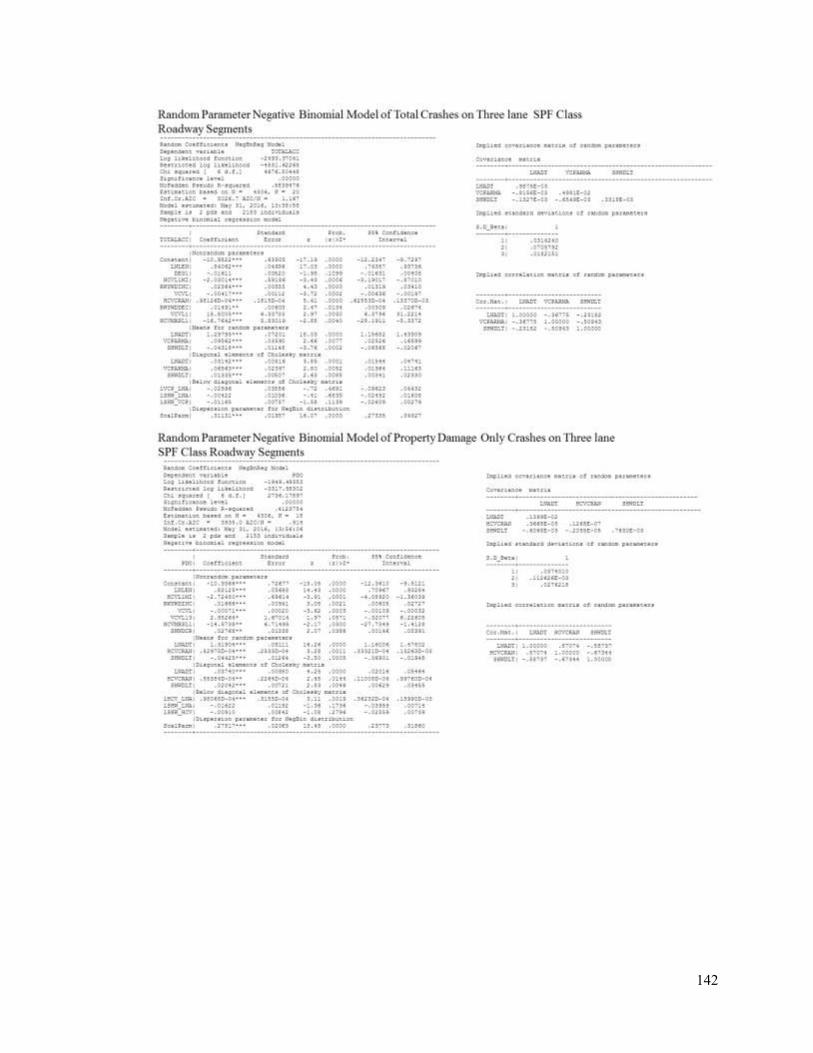
142

143

144

145
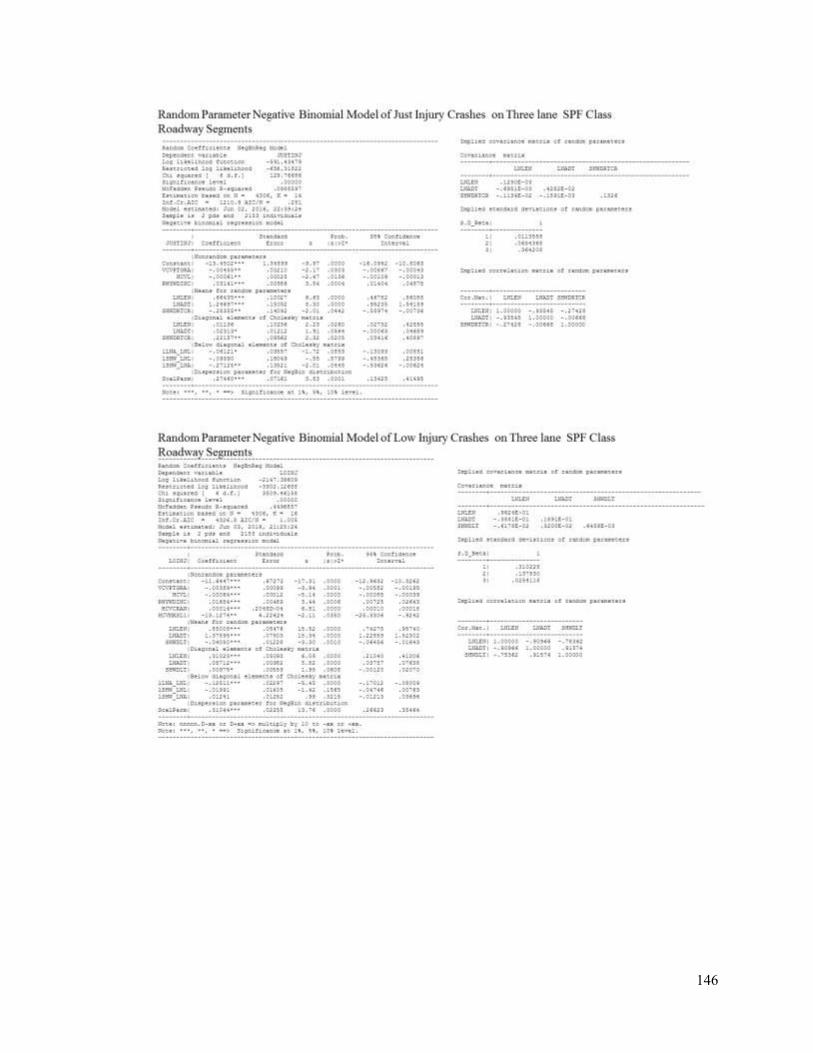
146
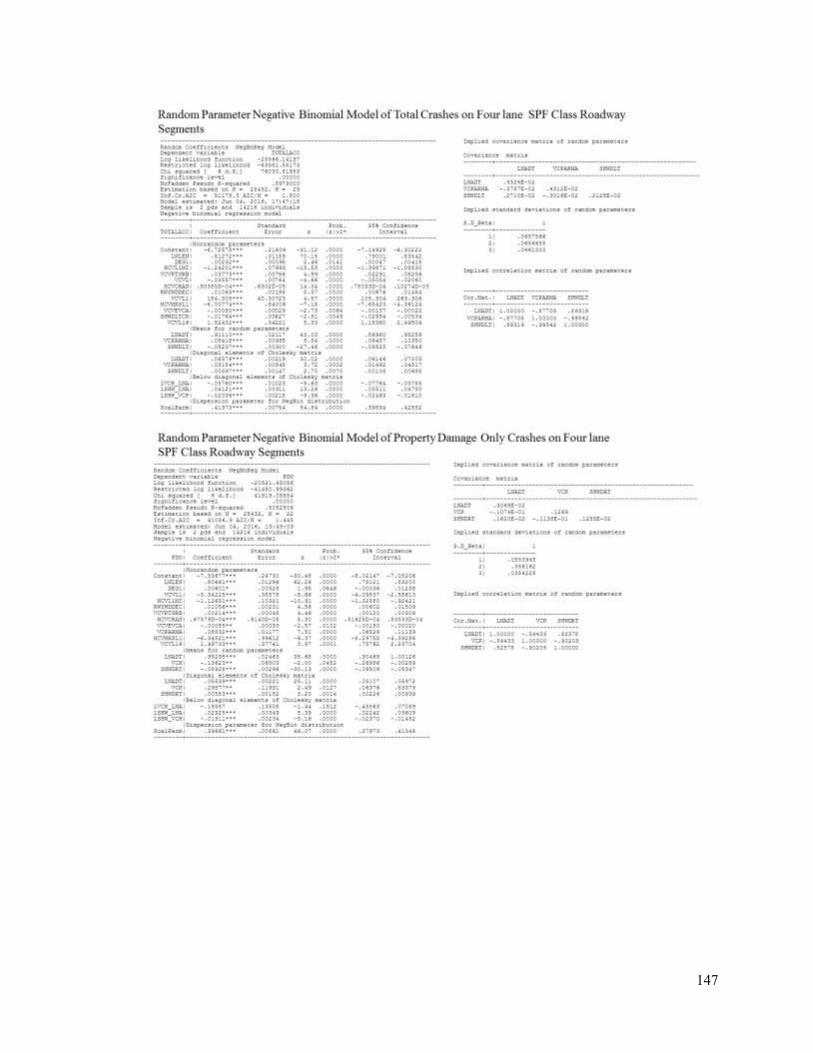
147

148

149
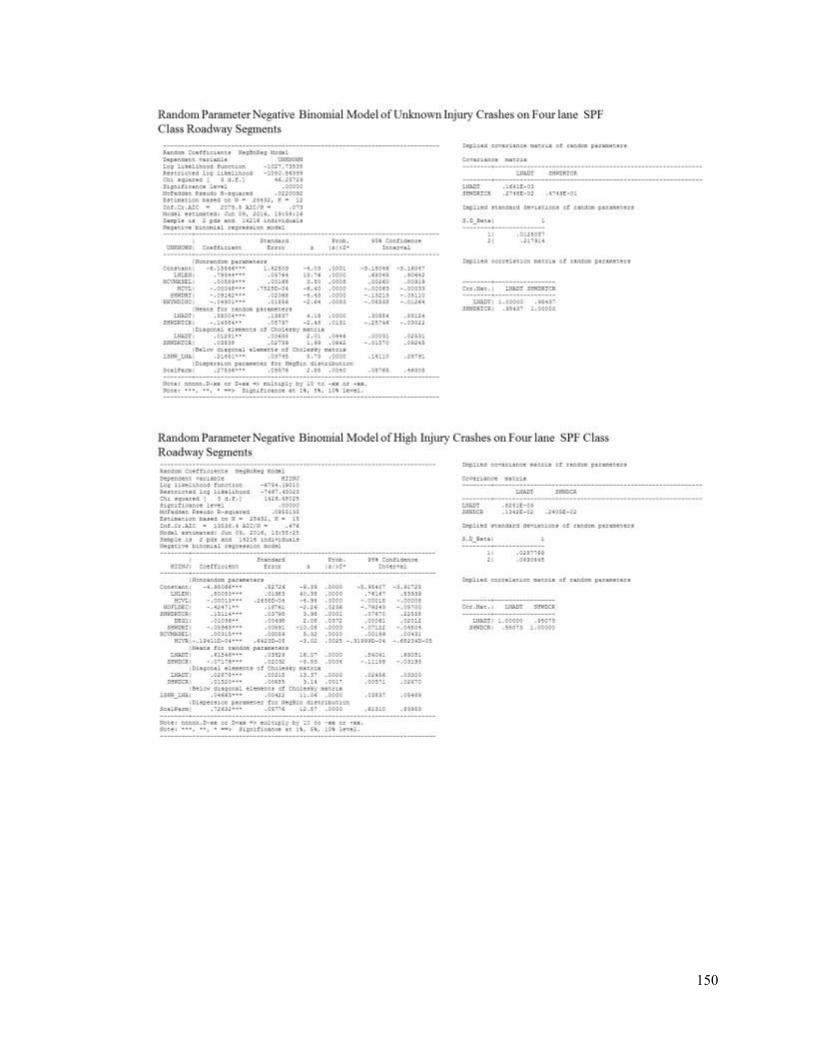
150

151
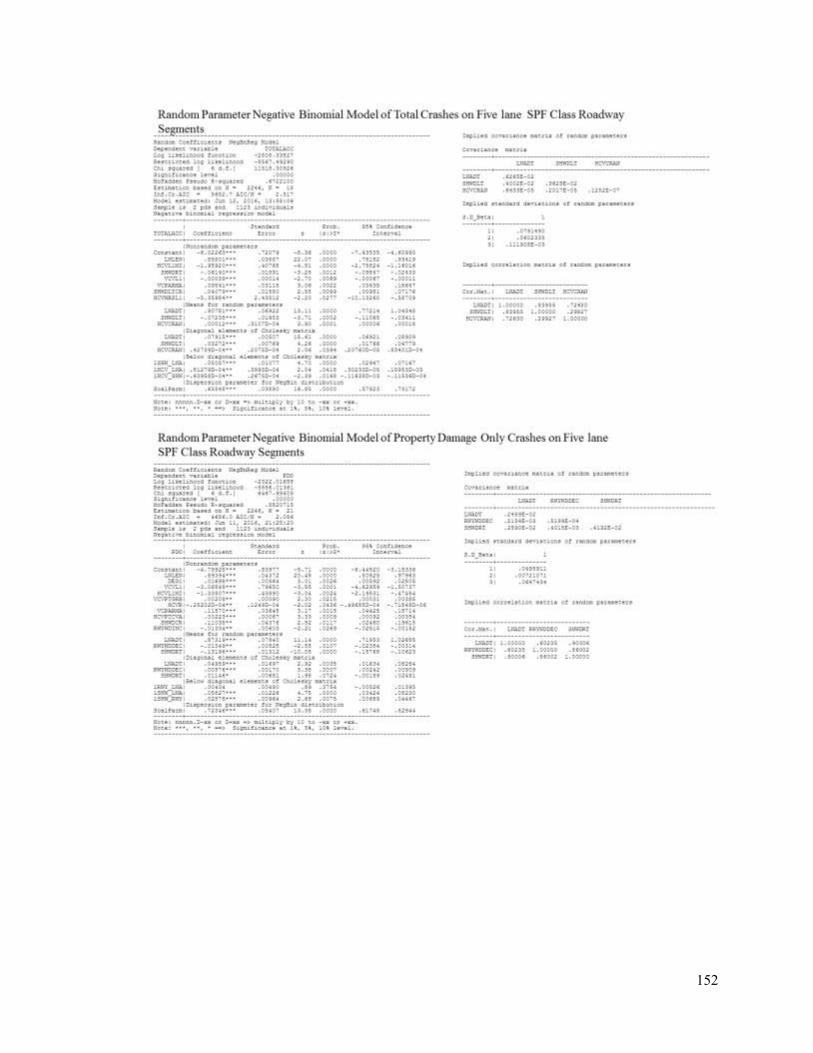
152

153

154

155

156

157

158

159

160

161

162

163

164
Americans with Disabilities Act (ADA) Information: This material can be made available in an alternate format by emailing the Office of Equal Opportunity at [email protected] or by calling toll free, 855-362-4ADA(4232). Persons who are deaf or hard of hearing may make a request by calling the Washington State Relay at 711.
Title VI Statement to Public: It is the Washington State Department of Transportation’s (WSDOT) policy to assure that no person shall, on the grounds of race, color, national origin or sex, as provided by Title VI of the Civil Rights Act of 1964, be excluded from participation in, be denied the benefits of, or be otherwise discriminated against under any of its federally funded programs and activities. Any person who believes his/her Title VI protection has been violated, may file a complaint with WSDOT’s Office of Equal Opportunity (OEO). For additional information regarding Title VI complaint procedures and/or information regarding our non-discrimination obligations, please contact OEO’s Title VI Coordinator at (360) 705-7082.


![· Web viewAlthough [Berridge] was, on the surface, a conventional master of conservative suburban fiction, her work concealed a deep subversiveness. The reader continually finds](https://static.fdocuments.us/doc/165x107/5e7d187c4afd9f356f6ddbd8/web-view-although-berridge-was-on-the-surface-a-conventional-master-of-conservative.jpg)
