Arterial Pressure in CKD5 - ESRD Population Gérard M. London INSERM U970 Paris.
48
Arterial Pressure in CKD5 - ESRD Population Gérard M. London INSERM U970 Paris
-
Upload
rodney-golden -
Category
Documents
-
view
215 -
download
1
Transcript of Arterial Pressure in CKD5 - ESRD Population Gérard M. London INSERM U970 Paris.
Arterial Pressure in CKD5 - ESRD Population
Gérard M. London
INSERM U970
Paris

18-29 30-39 40-49 50-59 60-69 70-79 80+0
70
80
110
130
150
18-29 30-39 40-49 50-59 60-69 70-79 80+0
70
80
110
130
150
0
70
80
110
130
150
0
70
80
110
130
150
DB
P(m
m H
g)SB
P(m
m H
g)D
BP
(mm
Hg)
SBP
(mm
Hg)
DB
P(m
m H
g)SB
P(m
m H
g)D
BP
(mm
Hg)
SBP
(mm
Hg)
Men, Age (y) Women, Age (y)
Non-Hispanic BlackNon-Hispanic BlackNon-Hispanic WhiteNon-Hispanic WhiteMexican AmericanMexican American
Pulse pressurePulse pressure Pulse pressurePulse pressure
SBP & DBP by Age, Ethnicity &Gender (US Population Age 18 Years, NHANES III)
Burt VI, et al. Hypertension.1995;25:305-313.

Evolution of Untreated Systolic and Diastolic BP: The Framingham Heart Study. Adapted from Franklin et al. Circulation 1997;96:308.
160140-159120-139<120
<40 40-49 50-59 60-69 70-79 80+Age (y)
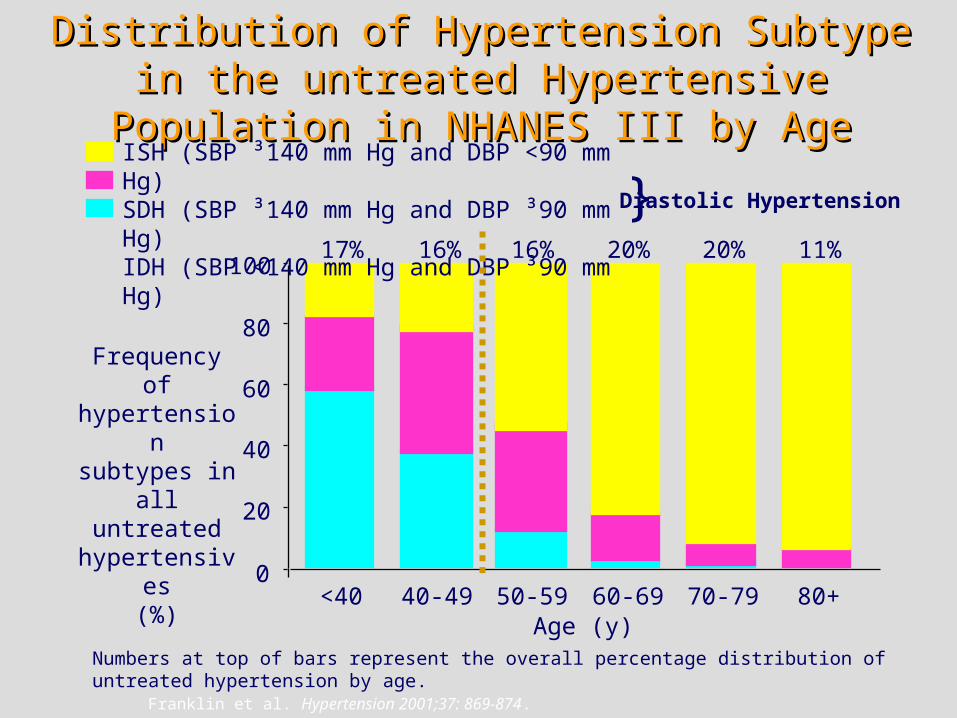
17% 16% 16% 20% 20% 11%
Distribution of Hypertension Subtype in the untreated Distribution of Hypertension Subtype in the untreated Hypertensive Population in NHANES III by AgeHypertensive Population in NHANES III by Age
ISH (SBP ³140 mm Hg and DBP <90 mm Hg) SDH (SBP ³140 mm Hg and DBP ³90 mm Hg)IDH (SBP <140 mm Hg and DBP ³90 mm Hg)
0
20
40
60
80
100
Numbers at top of bars represent the overall percentage distribution of untreated hypertension by age. Franklin et al. Hypertension 2001;37: 869-874.
Frequency of hypertension
subtypes in all untreated
hypertensives (%)
}Diastolic Hypertension
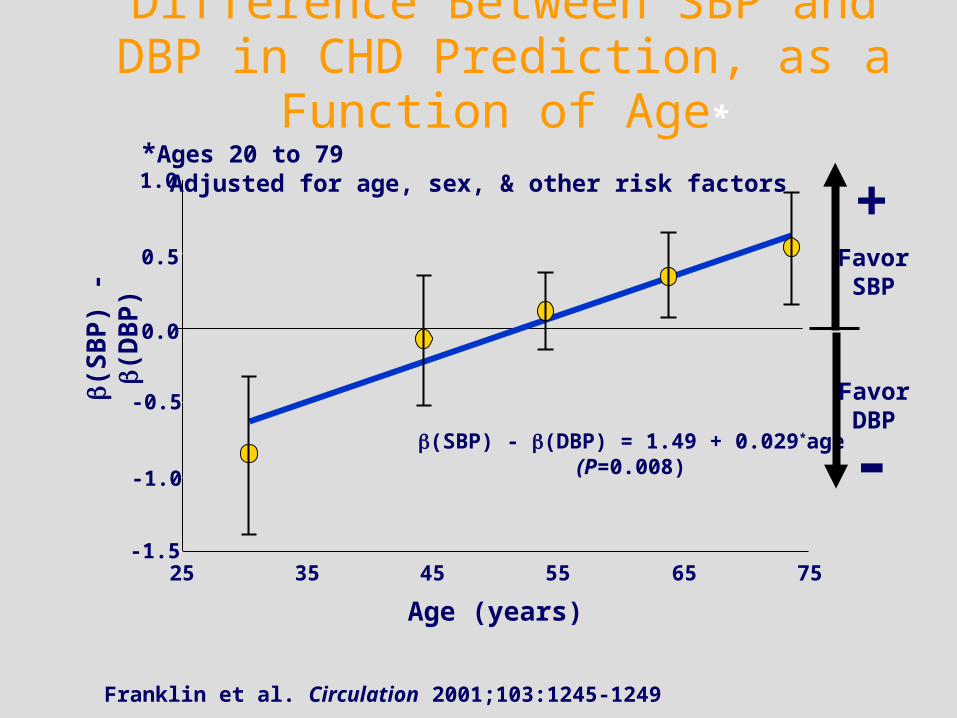
Difference Between SBP and DBP in CHD Prediction, as a Function of Age*
Franklin et al. Circulation 2001;103:1245-1249
Age (years)
1.0
25
(S
BP
) - (
DB
P)
0.5
0.0
-0.5
-1.0
-1.535 45 55 65 75
(SBP) - (DBP) = 1.49 + 0.029*age(P=0.008)
*Ages 20 to 79 Adjusted for age, sex, & other risk factors
Favor SBP
Favor DBP
+
-
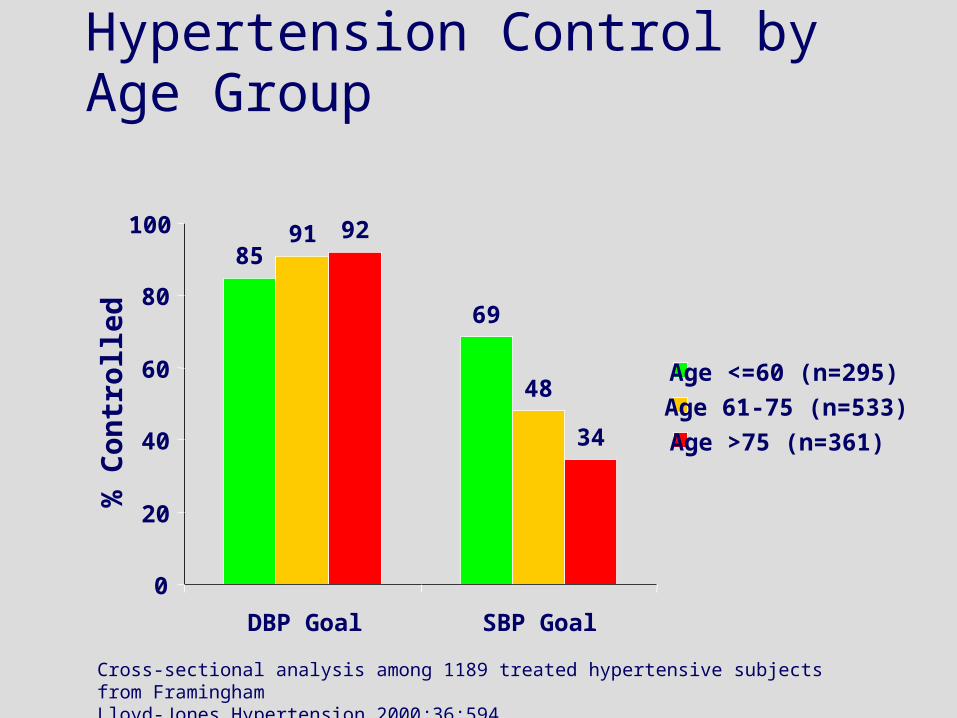
85
69
91
48
92
34
0
20
40
60
80
100
DBP Goal SBP Goal
% C
ontr
olle
d
Age <=60 (n=295)
Age 61-75 (n=533)
Age >75 (n=361)
Hypertension Control by Age Group
Cross-sectional analysis among 1189 treated hypertensive subjects from FraminghamLloyd-Jones Hypertension 2000;36:594

78
68
58
48
38Pu
lse
Pre
ssu
re (
mm
Hg)
135
115
95
75
55
35P
uls
e P
ress
ure
(m
m H
g)
Age (y) Age (y)
30-3
435
-39
40-4
445
-49
50-5
455
-59
60-6
465
-69
70-7
475
-79
80-8
4
30 35 40 45 50 55 60 65 70 75 80
Steep Rise in Pulse Pressure With Increasing Age Data From the Framingham Study
160140-159120-139120
85
Franklin SS et al. Circulation 1997;96:308-315. n=2036
Group Data Individual Data

Franklin SS, et al. Circ. 1999;100:354.
60 70 80 90 100 110
DBP (mm Hg)
0.5
1
1.5
2
2.5
3
SBP 170 mm Hg (P = 0.01)SBP 150 mm Hg (P = 0.02)SBP 130 mm Hg (P = 0.06)
SBP 110 mm Hg (P = 0.03)
CH
D h
azar
d r
atio
Relationship of SBP and DBP to risk for CHD in a dual component model: The Framingham Heart
Study
Mean age = 61 years (range: 50-79), n = 1924
Adjusted for age, sex, and other risk factors
P = probability for coefficients

Cardiovascular Risk Associated with Increasing SBP at Fixed Values of DBP
Two-year risk adjusted for active treatment, sex, age, previous CV complications, and smoking by multiple Cox regression.Staessen, et al. Lancet. 2000;355:865–872.
EWPHE (n = 840)SYST-EUR (n = 4695)SYST-CHINA (n = 2394)
SBP (mm Hg)
2-ye
ar r
isk
of
en
dp
oin
t
240220200180160140120
0.04
0.08
0.12
0.16
0.20
0.24
0.287580859095
DBP(mm Hg)

Blood Pressure and CHD RiskDual BP Component Models
Chi Sq. Hazard Ratio P Value
Model 1SBP 35.6 1.22 (1.15-1.30) <0.001
DBP 5.2 0.86 (0.75-0.98) <0.05
Model 2
DBP 0.7 1.04 (0.94-1.16) NS
PP 35.6 1.22 (1.15-1.30) <0.001
Hazards per 10 mm Hg increment
Adjusted for age, sex, smoking, ECG-LVH, BMI, glucose intolerance,total/HDL cholesterol
Franklin et al. Circulation 1999;100:354

Blood Pressure and Risk for CHD by Age Groups: Results of a Single BP Component† Model
† Adjusted for age, sex, and other risk factors *P<0.1, **P<0.01, ***P<0.001
Franklin SS, et al. Circulation 2001;103:1245-1249.
CH
D H
azar
d R
atio
/10
mm
Hg
(CI)
Age (y)
<50 50-59 600.0
0.4
0.8
1.2
1.6
2.0SBP (10 mm Hg)
DBP (10 mm Hg)
PP (10 mm Hg)
***
***
*** * ***
***
1.0

Rohrscheib MP et al CJASN 2008;3:1407
Evolution of Systolic and Diastolic BP in CKD patients
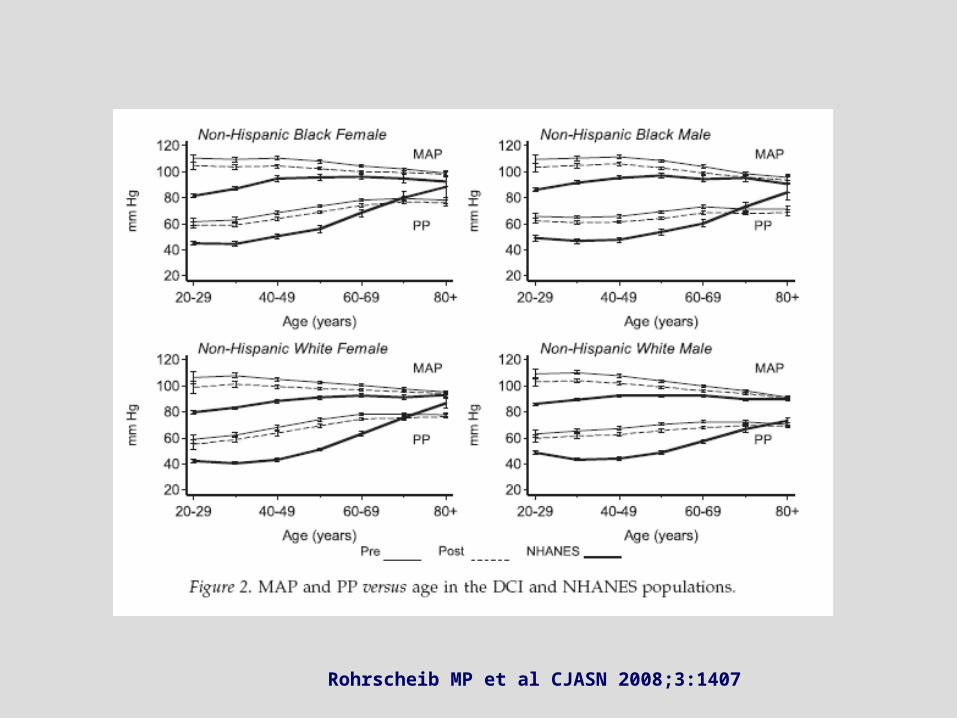
Rohrscheib MP et al CJASN 2008;3:1407
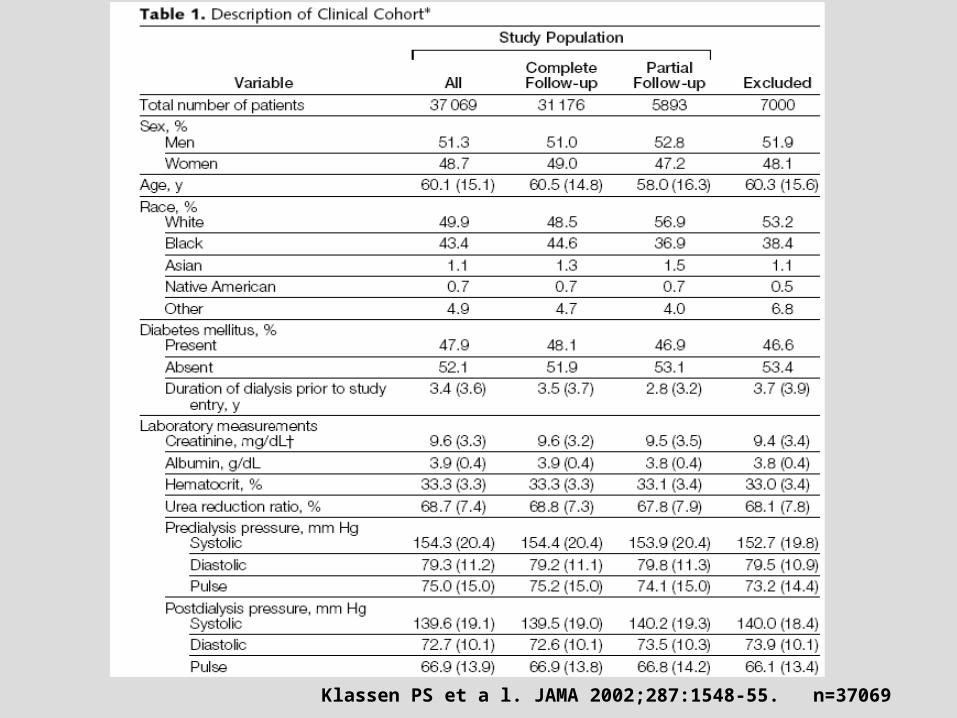
Klassen PS et a l. JAMA 2002;287:1548-55. n=37069
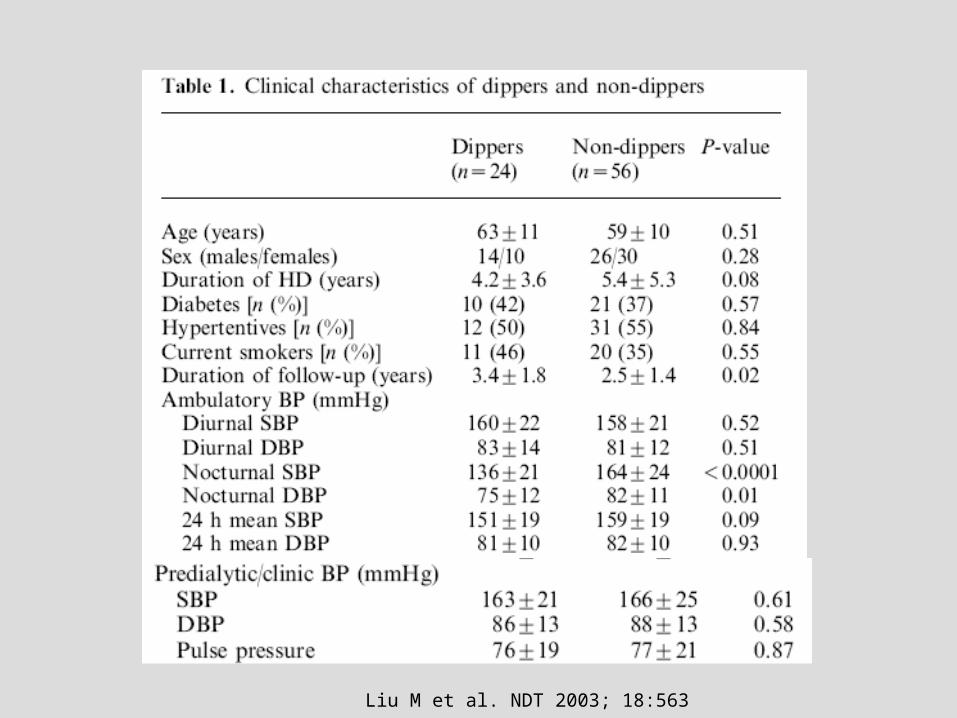
Liu M et al. NDT 2003; 18:563

One Year Mortality for Patients on Hemodialysis predicted by pulse pressure
0
2
4
6
8
10
12
14
16
18
20
20-30 30-40 40-50 50-60 60-70 70-80 80-90 90-100
100-110
>110
Categories of Pulse Pressure (mmHg)
Haz
ard
Rat
io f
or D
eath
Predialysis PP
Postdialysis PP
Adjusted for level of systolic blood pressure
Ref
Klassen et al. JAMA 2002;287:1548-1555
n = 37,069
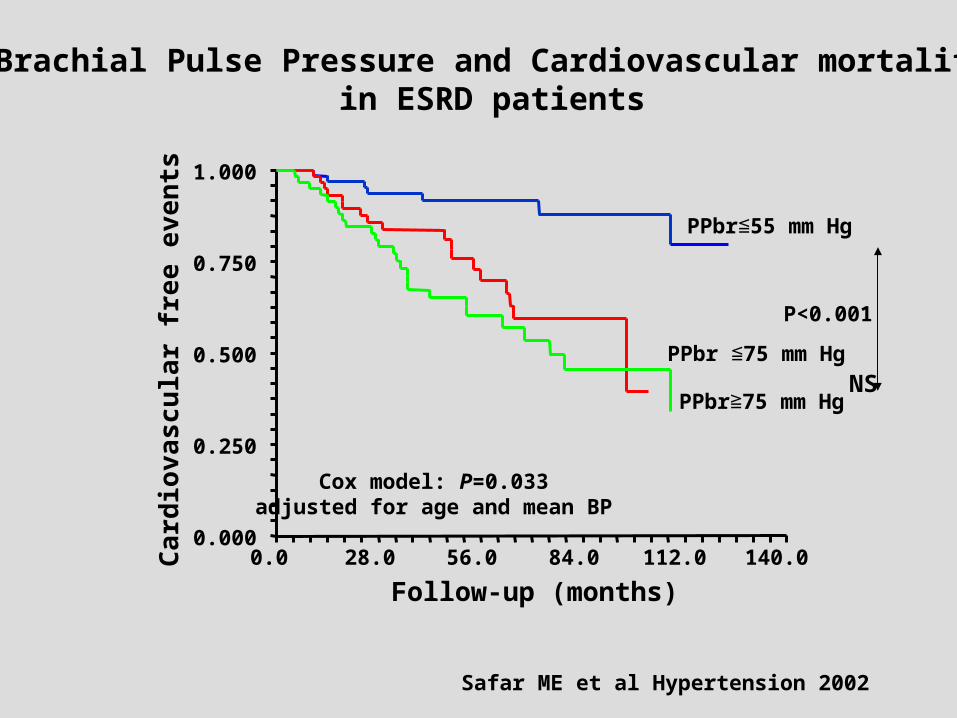
0.000
0.250
0.500
0.750
1.000
0.0 28.0 56.0 84.0 112.0 140.0
Brachial Pulse Pressure and Cardiovascular mortalityin ESRD patients
Follow-up (months)
Car
dio
vasc
ula
r fr
ee e
ven
ts PPbr 55 mm Hg≦
PPbr 75 mm Hg≦
PPbr 75 mm Hg≧
Cox model: P=0.033adjusted for age and mean BP
P<0.001
NS
Safar ME et al Hypertension 2002
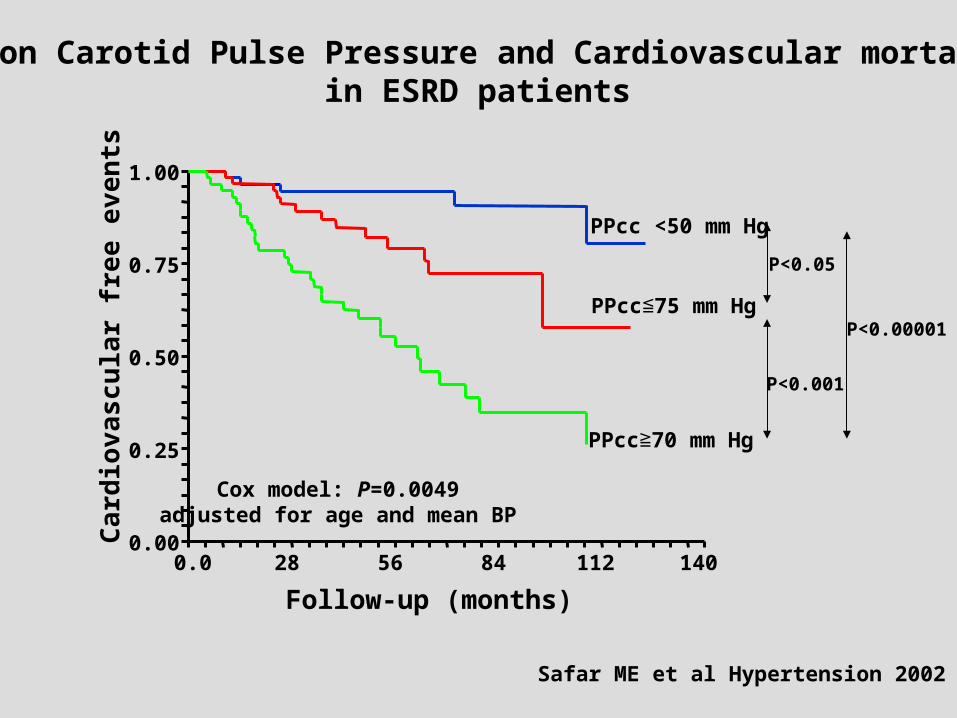
0.00
0.25
0.50
0.75
1.00
0.0 28 56 84 112 140
Common Carotid Pulse Pressure and Cardiovascular mortalityin ESRD patients
Follow-up (months)
Car
dio
vasc
ula
r fr
ee e
ven
ts
Cox model: P=0.0049adjusted for age and mean BP
PPcc <50 mm Hg
PPcc 75 mm Hg≦
PPcc 70 mm Hg≧
P<0.05
P<0.001
P<0.00001
Safar ME et al Hypertension 2002
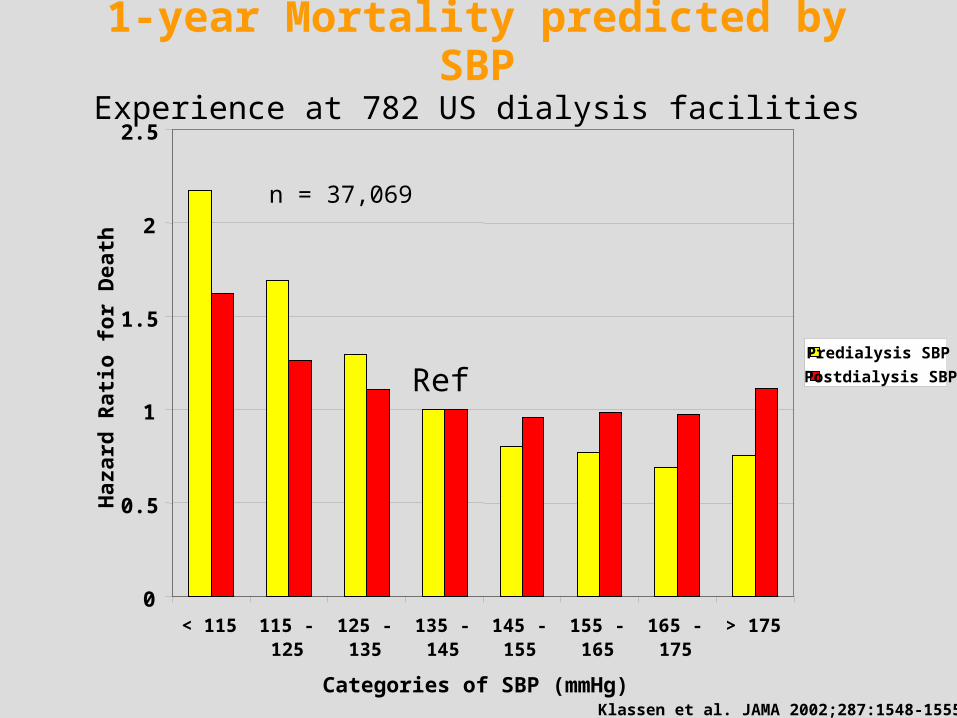
1-year Mortality predicted by SBPExperience at 782 US dialysis facilities
0
0.5
1
1.5
2
2.5
< 115 115 -125
125 -135
135 -145
145 -155
155 -165
165 -175
> 175
Categories of SBP (mmHg)
Haz
ard
Rat
io f
or D
eath
Predialysis SBP
Postdialysis SBPRef
Klassen et al. JAMA 2002;287:1548-1555
n = 37,069
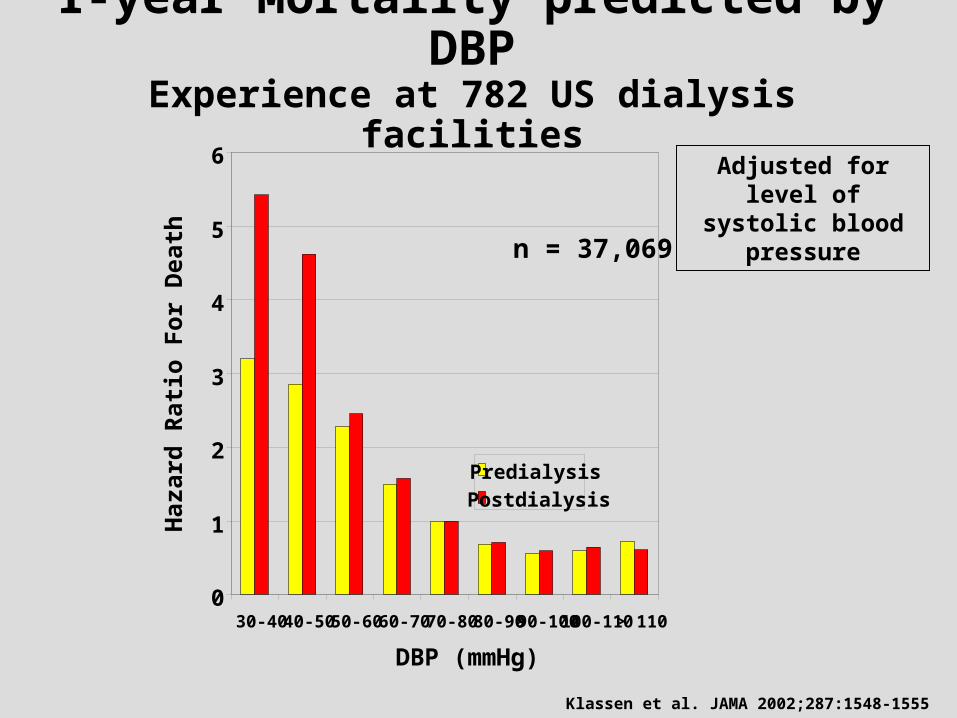
1-year Mortality predicted by DBPExperience at 782 US dialysis facilities
0
1
2
3
4
5
6
30-40 40-50 50-60 60-70 70-80 80-90 90-100100-110> 110
DBP (mmHg)
Predialysis
Postdialysis
Klassen et al. JAMA 2002;287:1548-1555
Adjusted for level of systolic blood pressure
n = 37,069
Haz
ard
Rat
io F
or D
eath
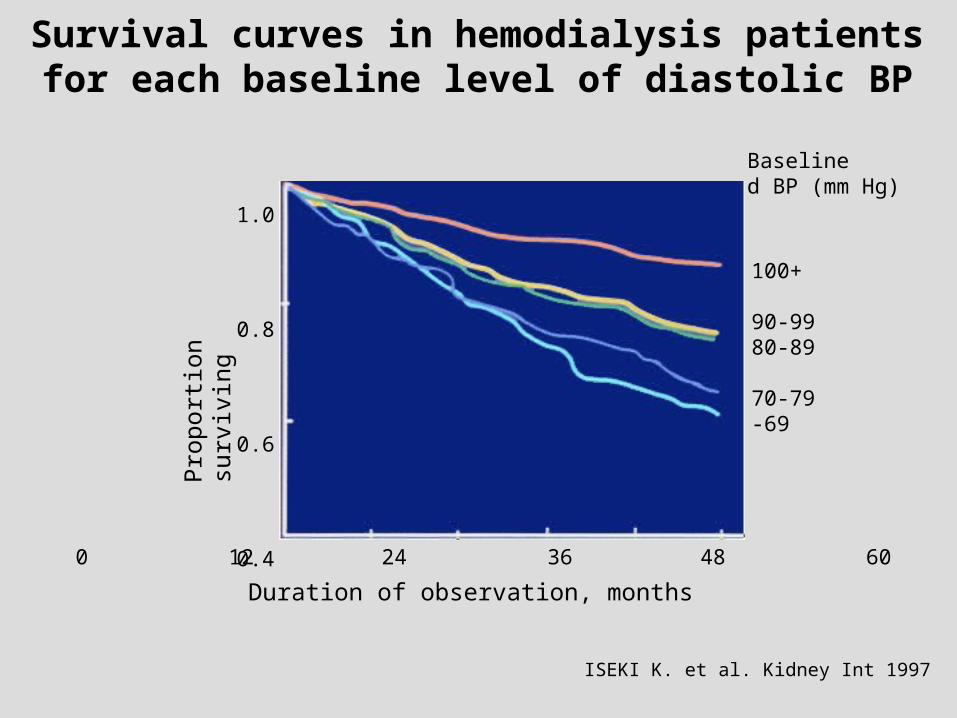
Prop
orti
on s
urvi
ving
Survival curves in hemodialysis patientsfor each baseline level of diastolic BP
ISEKI K. et al. Kidney Int 1997
Duration of observation, months
0 12 24 36 48 60
1.0
0.8
0.6
0.4
100+
90-9980-89
70-79-69
Baselined BP (mm Hg)
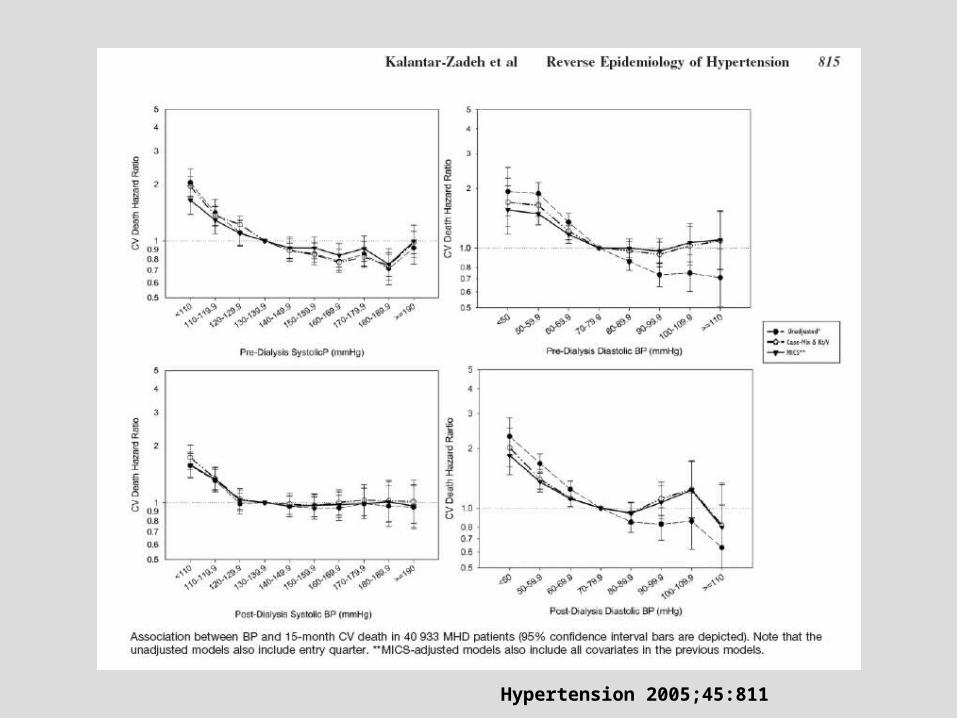
Hypertension 2005;45:811
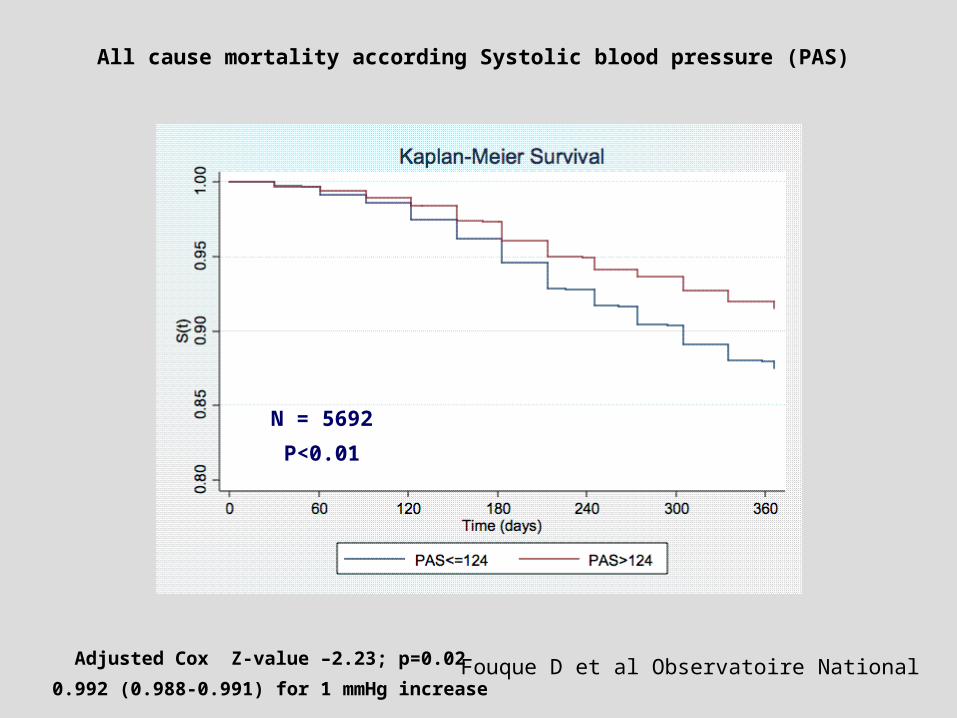
Fouque D et al Observatoire National
N = 5692
P<0.01
All cause mortality according Systolic blood pressure (PAS)
Adjusted Cox Z-value –2.23; p=0.02
0.992 (0.988-0.991) for 1 mmHg increase

All cause mortality according Diastolic blood pressure (PAd)
N = 5692
P<0.01
Fouque D. et al Observatoire NationalAdjusted Cox: Z-value = –6.73; p<0.001
0.977 (0.971-0.984) for 1 mmHg increase
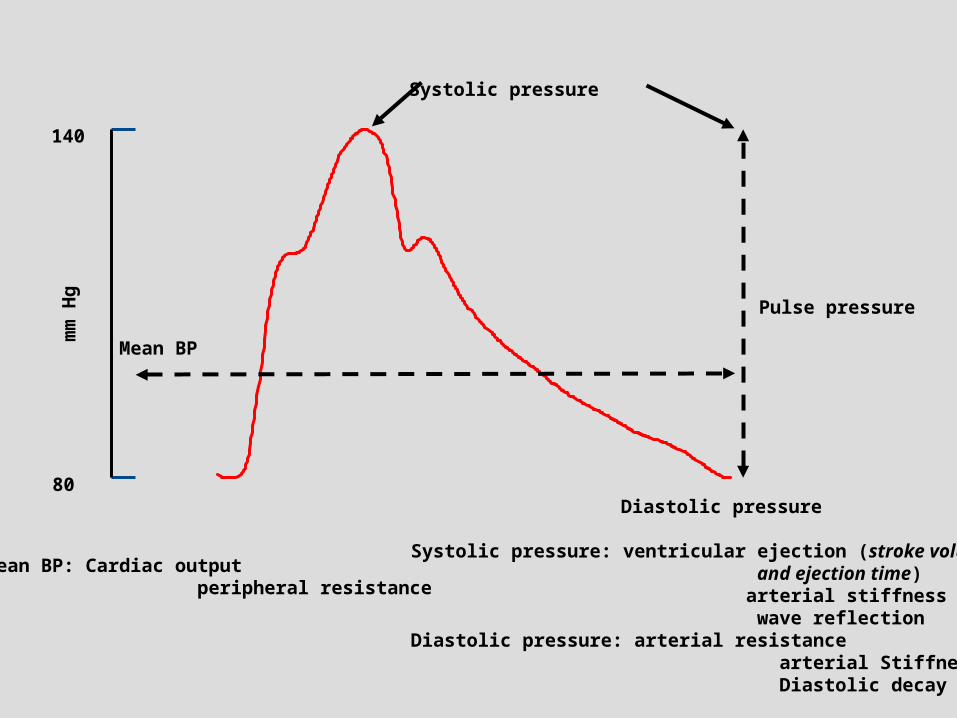
80
140
Mean BP
Pulse pressure
Mean BP: Cardiac output peripheral resistance
mm
Hg
Systolic pressure: ventricular ejection (stroke volume and ejection time) arterial stiffness wave reflectionDiastolic pressure: arterial resistance arterial Stiffness Diastolic decay time
Systolic pressure
Diastolic pressure

Augmentation Index (%)
20
48
76
104
132
160
500 1000 1500 2000 2500
Aortic pulse wave velocity (cm/s)
Syst
olic
e P
ress
ure
(mm
Hg)
20
48
76
104
132
160
20 55 90 125 160Stroke volume (ml)
Sys
toli
c P
ress
ure
(m
m H
g)
20
48
76
104
132
160
-40 -15 10 35 60
Sys
toli
c P
ress
ure
(m
m H
g)
R=0.47p<0.0001
R=0.60p<0.0001
R=0.17P <0.05
Correlation between arterial pulse pressure, wave reflexion (Augmentation index) aortic pulse wave velocity and stroke volume (n=230)
London et al KI 1996
.... .. ... .. . .
Time (sec)
80
140
4.6
4.38
. . . . . . . .
... .
Blo
od p
ress
ure
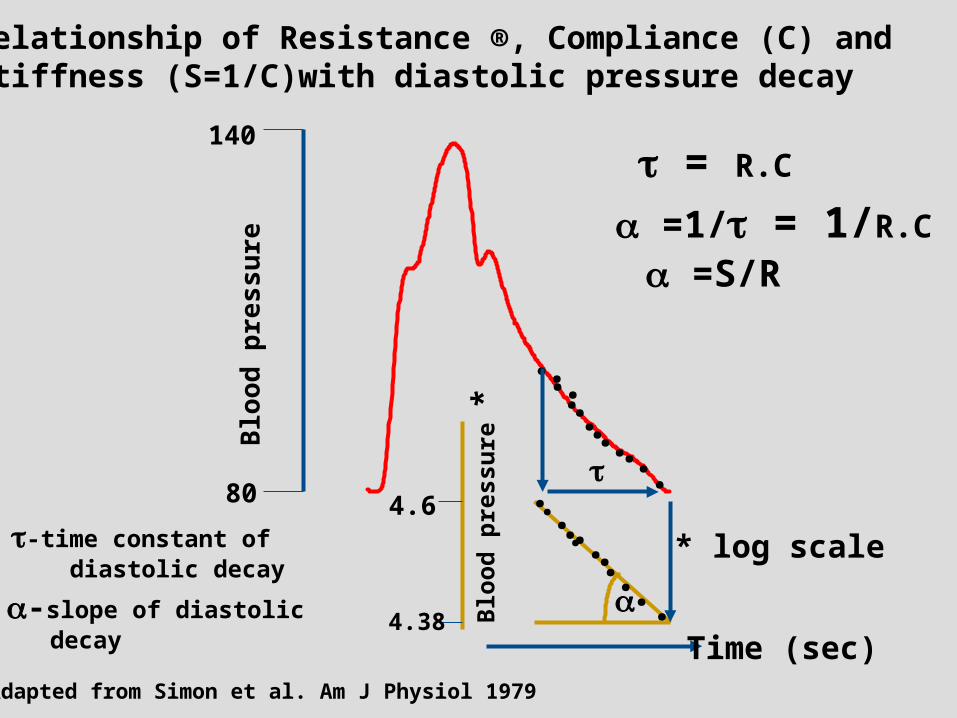
= R.C
=1/ = 1/R.C
Blo
od p
ress
ure
*
* log scale-time constant of diastolic decay
-slope of diastolic decay
Relationship of Resistance ®, Compliance (C) and Stiffness (S=1/C)with diastolic pressure decay
Adapted from Simon et al. Am J Physiol 1979
=S/R

80
110
140
170
200
230
0.5 1.1 1.7 2.3 2.8 3.4 4.0
Interdialysis body weight changes (kg)
Sys
toli
c p
ress
ure
(m
m H
g)
400
680
960
1240
1520
1800
0.5 1.1 1.7 2.3 2.8 3.4 4.0
Interdialysis body weight changes (kg)
Aor
tic
pu
lse
wav
e ve
loci
ty-P
WV
(cm
/s)
60
84
108
132
156
180
0.5 1.1 1.7 2.3 2.8 3.4 4.0
Interdialysis body weight changes (kg)
Str
oke
volu
me
- S
V (
mL
)r = 0.21
P = 0.015
NS-PWV and SV adjusted
r = 0.284
P < 0.01
Adjust. For Systolic BP
and PWV
r = 0517
P < 0.0001
Adjust for Systolic BP
Age and SV
London et al Kidney Int 1989

Diagrammatic representation of pressure-volume relationships
Volume
Pre
ssu
re
dP/dV
Einc=1Einc=2
Mean BP
0.00
0.25
0.50
0.75
1.0
0.00 0.25 0.50 0.75 1.0
1-Specificity
Sen
siti
vity
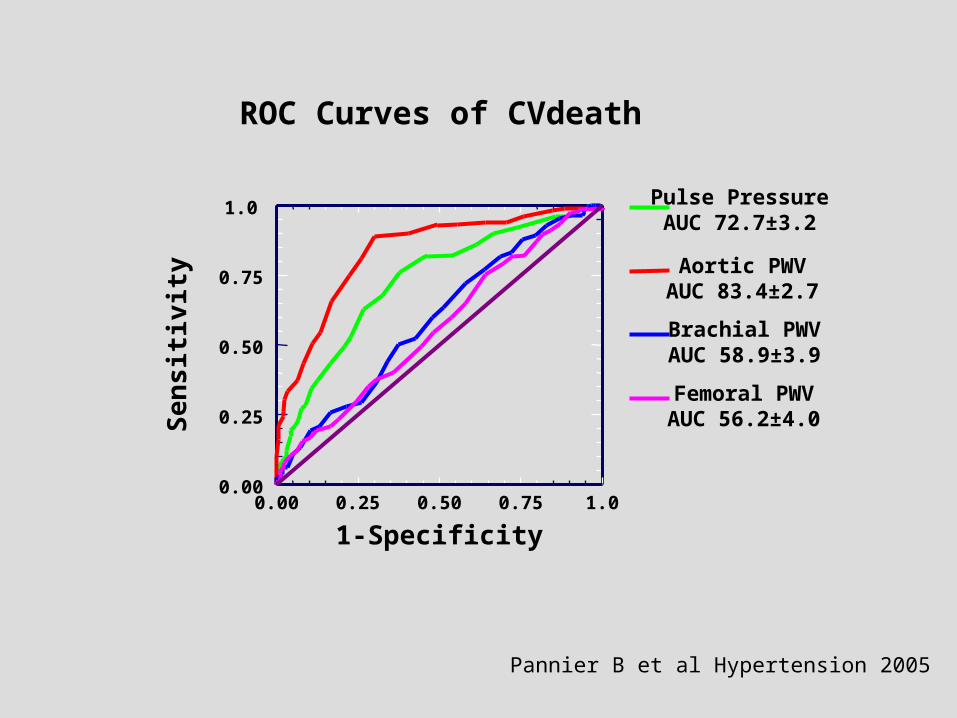
Pulse PressureAUC 72.7±3.2
Aortic PWVAUC 83.4±2.7
Brachial PWVAUC 58.9±3.9
Femoral PWVAUC 56.2±4.0
ROC Curves of CVdeath
Pannier B et al Hypertension 2005

Correlation between Age and Aortic Pulse Wave Velocityin General population ( ) and ESRD patients ( )
5
10
15
20
25
25 50 75 100
Age (years)
Aor
tic
PW
V (
m/s
)
r=0.625p<0.00001
r=0.719p<0.00001
0
100
200
300
400
500
600
10 20 30 40 50 60 70 80 90 100
Age (years)
Ch
arac
teri
stic
imp
edan
ce
(dyn
es.s
.cm
-5)
r=0.525P<0.00001
r=0.340P<0.01
Pannier et al Artery 2007;1:78-89
5
6
7
8
9
10
11
12
20 30 40 50 60 70 80 90
Age (years)
Car
otid
art
ery
dia
met
er (m
m)
2.5
3.2
3.8
4.5
5.2
5.8
6.5
20 30 40 50 60 70 80
Age (years)
Bra
chia
l art
ery
dia
met
er (m
m)
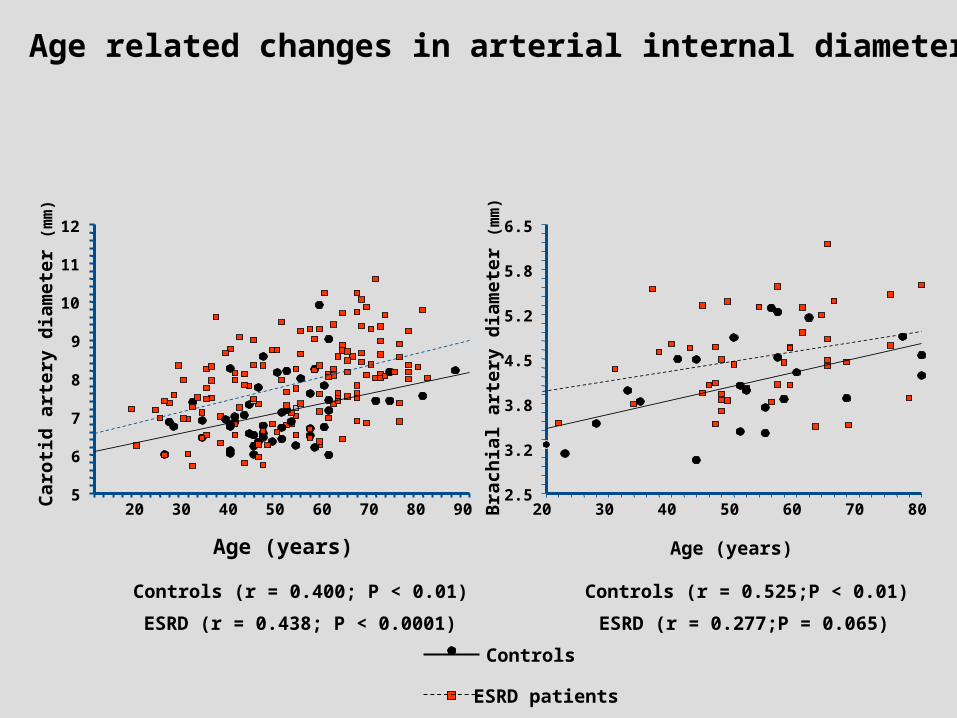
Controls
ESRD patients
Controls (r = 0.400; P < 0.01) Controls (r = 0.525;P < 0.01)
ESRD (r = 0.438; P < 0.0001) ESRD (r = 0.277;P = 0.065)
Age related changes in arterial internal diameters

0.40
0.50
0.60
0.70
0.80
0.90
1.00
1.10
10 20 30 40 50 60 70 80 90
Age (years)
Com
mon
car
otid
art
ery
IMT
h(m
m)
Controls
ESRD patients
Age related changes in Carotid IMTh
Pannier et al Hypertension 2005

Probability of overall survival in hemodialysispatients according to aortic PWV
Duration of follow-up (months)
0
1
0 35 70 105 140
0.50
0.75
0.25
PWV < 9.4 m/s
9.4 < PWV < 12.0 m/s
PWV > 12.0 m/s
Blacher et al. Circulation. 1999
Pro
bab
ilit
y of
ove
rall
su
rviv
al

All cause survival according to changes in aortic pulse wave velocity ( PWV) in response to BP decrease
2 = 28.01
P<0.00001
Guérin et al. Circulation. 2001.
Decreased PWVDecreased PWV
0.250.25
0.500.50
0.750.75
11
00
00 3535 7070 105105 140140
Unchanged or Unchanged or PWV PWV
Duration of follow-up (months)Duration of follow-up (months)
Survival rate
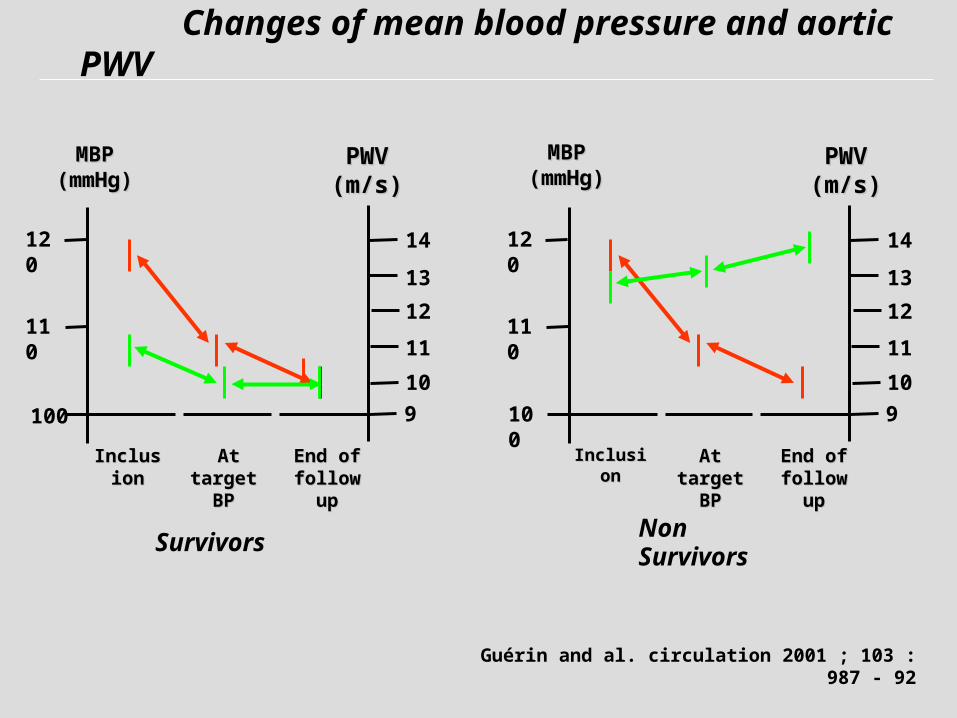
Changes of mean blood pressure and aortic PWV
Guérin and al. circulation 2001 ; 103 : 987 - 92
9
10
11
12
13
14
Survivors
110
120
InclusionInclusion At targetAt targetBPBP
End of End of follow upfollow up
MBPMBP(mmHg)(mmHg)
PWVPWV(m/s)(m/s)
9
10
11
12
13
14
Non Survivors
100
110
120
InclusionInclusion At targetAt targetBPBP
End of End of follow upfollow up
MBPMBP(mmHg)(mmHg)
PWVPWV(m/s)(m/s)
100
0.00
0.25
0.50
0.75
1.00
0.00 0.25 0.50 0.75 1.00
1-Specificity
Sen
siti
vity
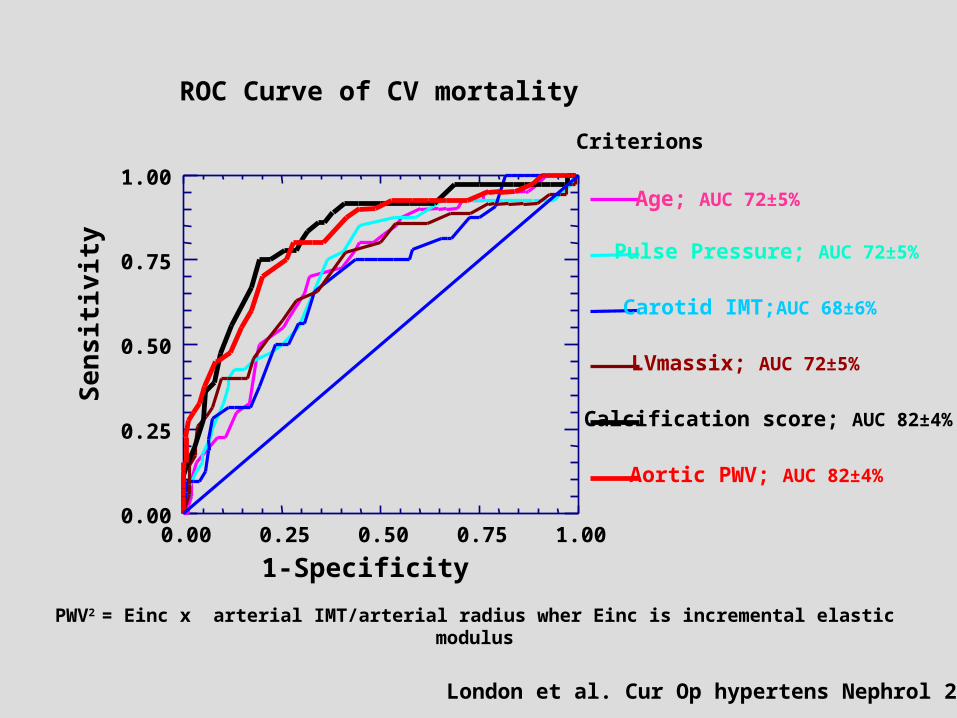
Criterions
Age; AUC 72±5%
Pulse Pressure; AUC 72±5%
Carotid IMT;AUC 68±6%
LVmassix; AUC 72±5%
Calcification score; AUC 82±4%
Aortic PWV; AUC 82±4%
ROC Curve of CV mortality
PWV2 = Einc x arterial IMT/arterial radius wher Einc is incremental elastic modulus
London et al. Cur Op hypertens Nephrol 2006
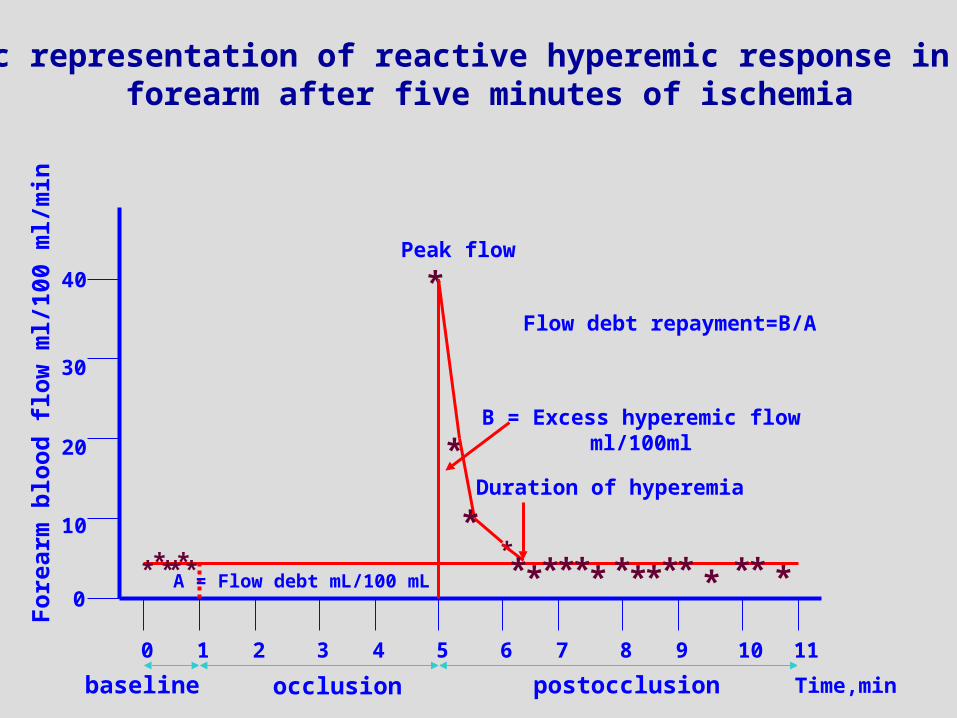
0 1 2 3 4 5 6 7 8 9 10 11
baseline occlusion postocclusion Time,min
******A = Flow debt mL/100 mL
*
*
******* ***** * ** *
Duration of hyperemia
Peak flow
B = Excess hyperemic flowml/100ml
Flow debt repayment=B/A
For
earm
blo
od f
low
ml/
100
ml/
min
0
10
20
30
40
Schematic representation of reactive hyperemic response in the humanforearm after five minutes of ischemia
*

0
100
200
300
400
Controls ESRDT
ime
to d
ebt
rep
aym
ent
(s)
0
63
125
188
250
Controls ESRD
Flo
w d
ebt
rep
aym
ent
(%)
Pannier B et al. Kidney Int 2001
P<0.0001 P<0.0001
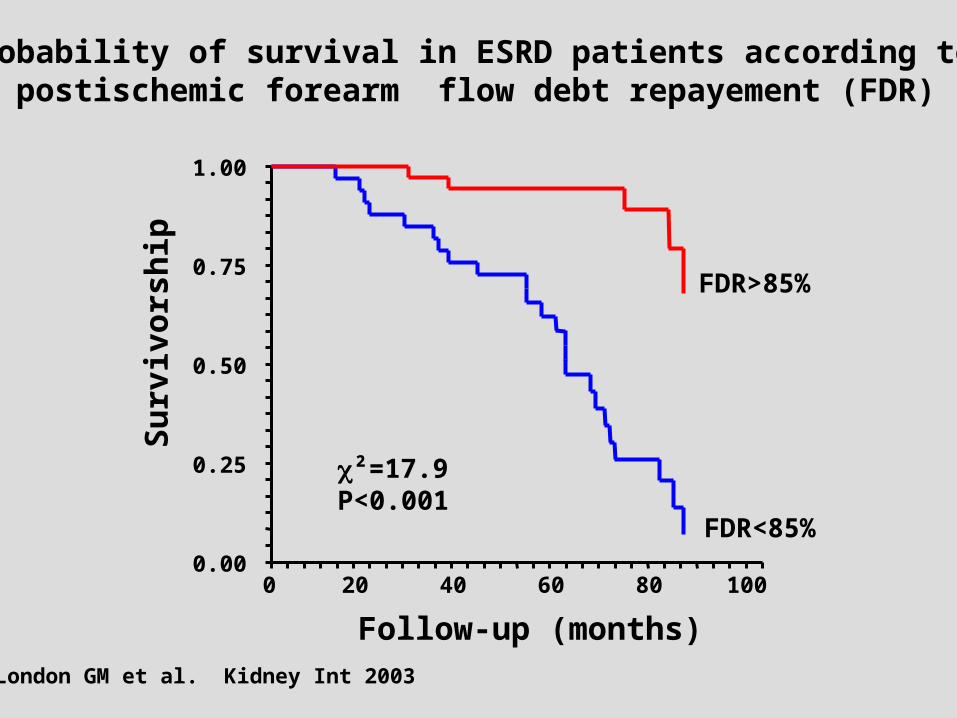
0.00
0.25
0.50
0.75
1.00
0 20 40 60 80 100
Follow-up (months)
Su
rviv
orsh
ip
Probability of survival in ESRD patients according to postischemic forearm flow debt repayement (FDR)
FDR>85%
FDR<85%
²=17.9P<0.001
London GM et al. Kidney Int 2003

Mullen, M. J. et al. Circ Res 2001;88:145-151
Methods of stimulating increased blood flow
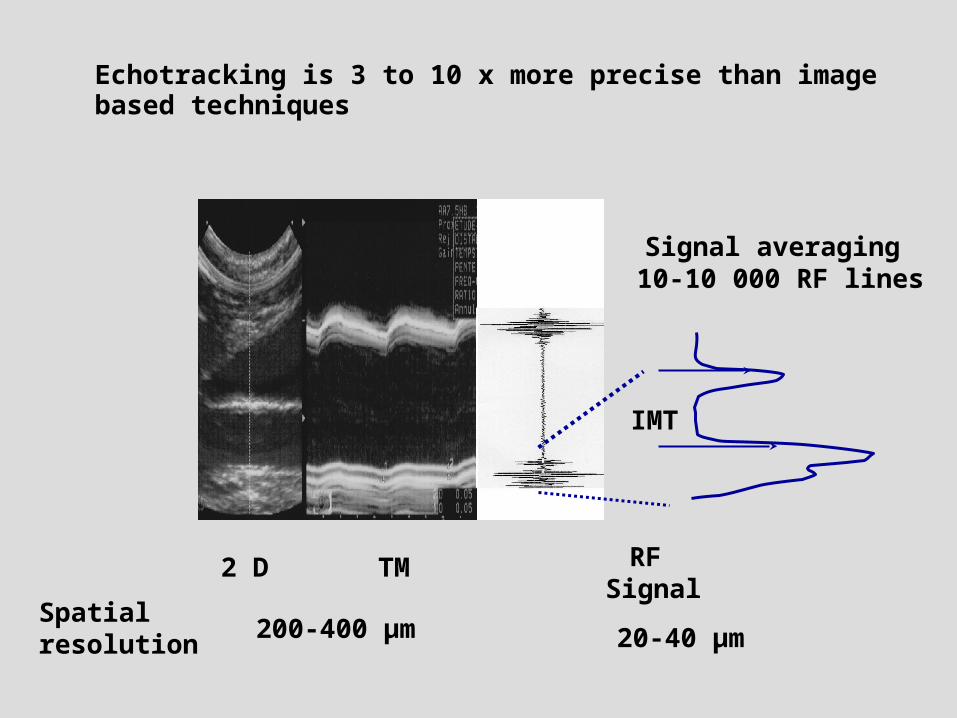
2 D TM RF Signal
IMT
Signal averaging 10-10 000 RF lines
Spatialresolution
200-400 µm 20-40 µm
Echotracking is 3 to 10 x more precise than image based techniques

Ghiadoni, L. et al. Hypertension 2003;41:1281-1286
Graphs show FMD, GTN-induced dilation, and RH in normotensive subjects (white circles and bars) and in patients with essential hypertension (black
circles and bars)
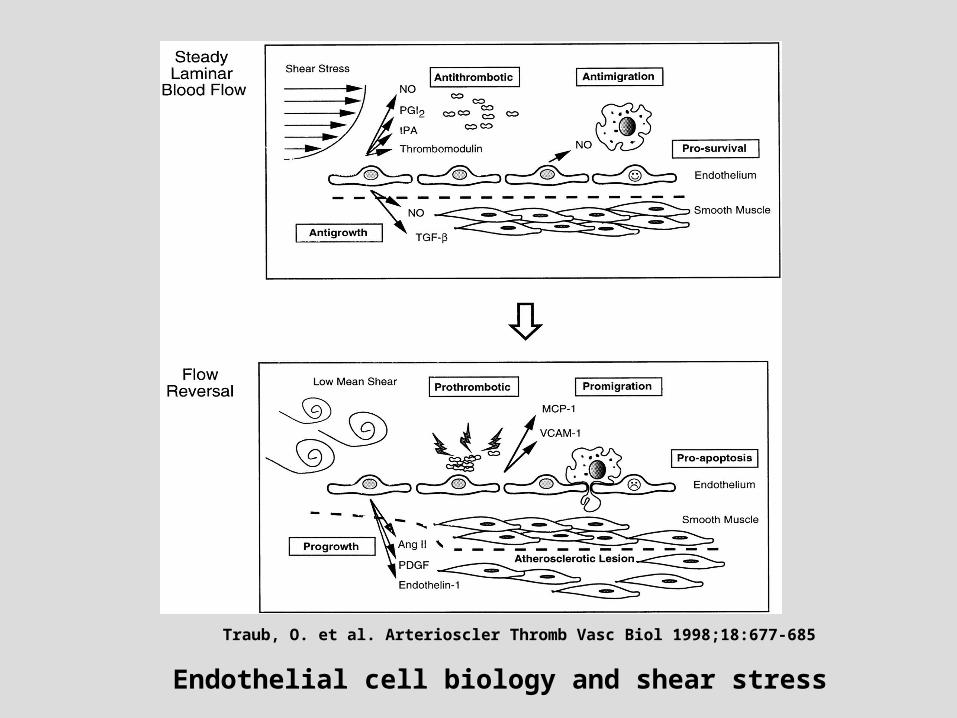
Traub, O. et al. Arterioscler Thromb Vasc Biol 1998;18:677-685
Endothelial cell biology and shear stress
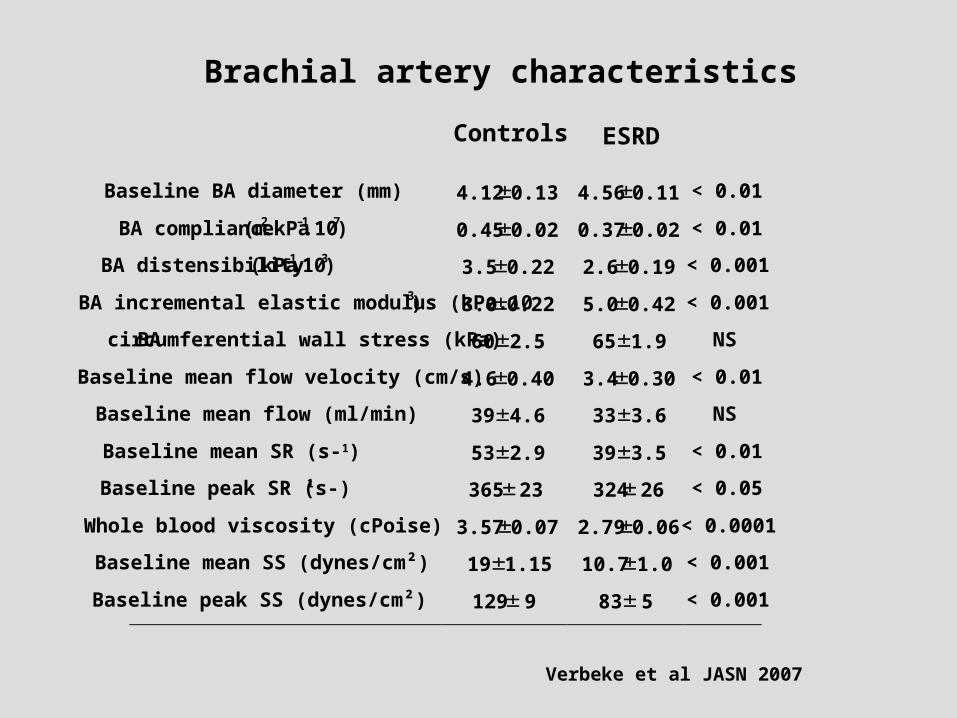
Baseline BA diameter (mm) 4.12 0.13 4.56 0.11 < 0.01
BA compliance (m2.kPa–1.10–7) 0.45 0.02 0.37 0.02 < 0.01
BA distensibility (kPa–1.10–3) 3.5 0.22 2.6 0.19 < 0.001
BA incremental elastic modulus (kPa.103) 3.0 0.22 5.0 0.42 < 0.001
BA circumferential wall stress (kPa) 60 2.5 65 1.9 NS
Baseline mean flow velocity (cm/s) 4.6 0.40 3.4 0.30 < 0.01
Baseline mean flow (ml/min) 39 4.6 33 3.6 NS
Baseline mean SR (s-1)– 53 2.9 39 3.5 < 0.01
Baseline peak SR (s-)1 365 23 324 26 < 0.05
Whole blood viscosity (cPoise) 3.57 0.07 2.79 0.06 < 0.0001
Baseline mean SS (dynes/cm²) 19 1.15 10.7 1.0 < 0.001
Baseline peak SS (dynes/cm²) 129 9 83 5 < 0.001
Controls ESRD
Brachial artery characteristics
Verbeke et al JASN 2007
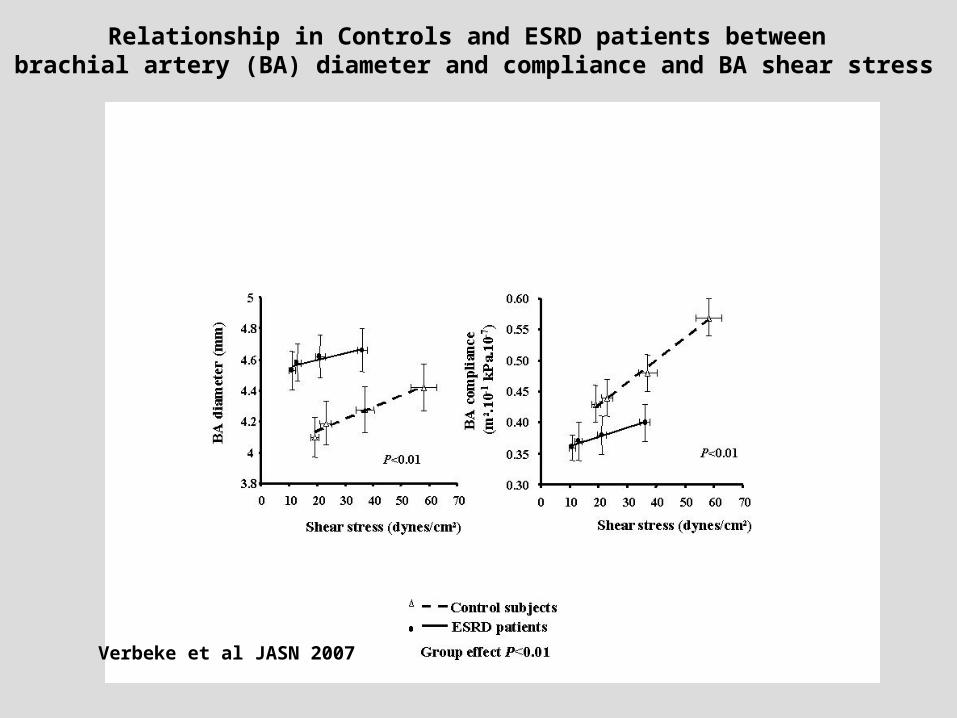
Relationship in Controls and ESRD patients between brachial artery (BA) diameter and compliance and BA shear stress
Verbeke et al JASN 2007
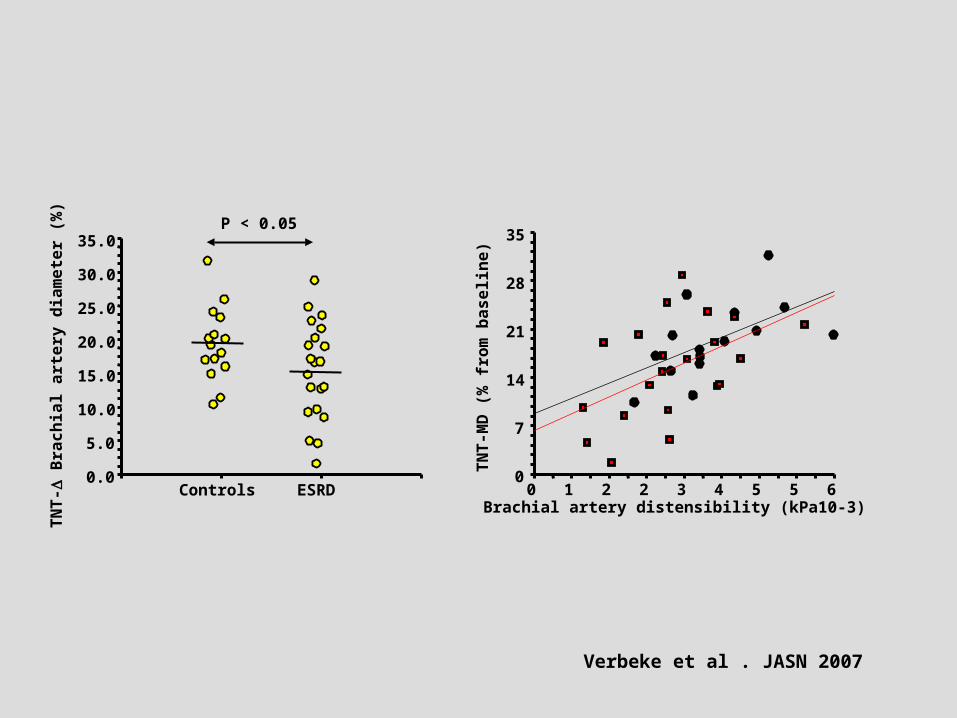
0.0
5.0
10.0
15.0
20.0
25.0
30.0
35.0
Controls ESRDTN
T-
Bra
chia
l art
ery
dia
met
er (
%)
P < 0.05
0
7
14
21
28
35
0 1 2 2 3 4 5 5 6Brachial artery distensibility (kPa10-3)
TN
T-M
D (
% f
rom
bas
elin
e)
Verbeke et al . JASN 2007


![Comprehensive ESRD Care Initiative LDO Model€¦ · Comprehensive ESRD Care Initiative LDO Model . July [15], 2015 . ... Comprehensive ESRD Care Initiative Participation Agreement](https://static.fdocuments.us/doc/165x107/5af2cc657f8b9a95468ba91b/comprehensive-esrd-care-initiative-ldo-model-comprehensive-esrd-care-initiative.jpg)