Art and Perception The Framing of Characters in Popular Movies
20
Art and Perception The Framing of Characters in Popular Movies James E. Cutting Cornell University I investigated the number and locations of characters as they appear on the screen in 48 popular movies released from 1935 to 2010. Sampling an average of 1 of every 500 frames (~20 s of film) I amassed data from almost 14,000 movie images. The number and placement of the characters in each image were digitally recorded and compared across years and across aspect ratios (the ratio of the width to the height of the image). Results show a roughly linear decrease in the number of characters on the screen across years. Moreover, the number of characters influences shot scale, shot duration, and mediates their direct effect on one another. The location of characters on the screen was measured by the bridge of the nose between the eyes. By this measure I found that framing varies widely across aspect ratios, but when each image is conformed to the same shape, the overlap of the locations of characters is remarkably constant across years and aspect ratios for images with one, two, and three characters. Together, these results exemplify both constancy and change in the evolution of popular movies. Keywords: Aspect Ratios, Characters, Hollywood Style, Fixations, Movies 1. Film Theory, Hollywood Style, and Historical Change In his discussion of film form Eisenstein (1949, pp. 15-16) distinguished between the mise-en-scène and the mise-en-cadre. Both are concepts important for film theory. Mise-en-scène means, literally, “placed on the stage” but it has come to mean the three- dimensional arrangement and consideration of everything that happens in front of the camera. Bordwell (2005), for example, focused on the logic of the staging of characters in this three dimensional space. Mise-en-cadre means “placed in the frame” and the logic of the number and the placement of characters within the two-dimensional extent of the cinematographic image is the domain that I study here. But to what end? A central focus of cognitive film theory concerns how popular movies are structured to convey their narratives to viewers (see, for example, Bordwell, 1989; Currie, 1995). This approach to movies opens up many possibilities. One is that to study the general structure of movies is simultaneously to study the predispositions of the mind – its perception, cognition, and affect. My students and I have embraced this stance and, more particularly, we have assumed that the study of changes in film over the last century can reveal many facets of popular movie structure – called Hollywood style – that have evolved to fit better what our minds can easily process. This article continues this research tack, but here I more deliberately borrow a tenet from Bordwell et al (1985; Bordwell, 2006). That is, although it is undeniable that popular movies are evolving in
Transcript of Art and Perception The Framing of Characters in Popular Movies

Art and Perception
The Framing of Characters in Popular Movies
James E. Cutting
Cornell University
I investigated the number and locations of characters as they appear on the screen in 48 popular movies released from 1935 to 2010. Sampling an average of 1 of every 500 frames (~20 s of film) I amassed data from almost 14,000 movie images. The number and placement of the characters in each image were digitally recorded and compared across years and across aspect ratios (the ratio of the width to the height of the image). Results show a roughly linear decrease in the number of characters on the screen across years. Moreover, the number of characters influences shot scale, shot duration, and mediates their direct effect on one another. The location of characters on the screen was measured by the bridge of the nose between the eyes. By this measure I found that framing varies widely across aspect ratios, but when each image is conformed to the same shape, the overlap of the locations of characters is remarkably constant across years and aspect ratios for images with one, two, and three characters. Together, these results exemplify both constancy and change in the evolution of popular movies.
Keywords: Aspect Ratios, Characters, Hollywood Style, Fixations, Movies
1. Film Theory, Hollywood Style, and Historical Change
In his discussion of film form Eisenstein (1949, pp. 15-16) distinguished between the mise-en-scène and the mise-en-cadre. Both are concepts important for film theory. Mise-en-scène means, literally, “placed on the stage” but it has come to mean the three-dimensional arrangement and consideration of everything that happens in front of the camera. Bordwell (2005), for example, focused on the logic of the staging of characters in this three dimensional space. Mise-en-cadre means “placed in the frame” and the logic of the number and the placement of characters within the two-dimensional extent of the cinematographic image is the domain that I study here. But to what end?
A central focus of cognitive film theory concerns how popular movies are
structured to convey their narratives to viewers (see, for example, Bordwell, 1989; Currie, 1995). This approach to movies opens up many possibilities. One is that to study the general structure of movies is simultaneously to study the predispositions of the mind – its perception, cognition, and affect. My students and I have embraced this stance and, more particularly, we have assumed that the study of changes in film over the last century can reveal many facets of popular movie structure – called Hollywood style – that have evolved to fit better what our minds can easily process. This article continues this research tack, but here I more deliberately borrow a tenet from Bordwell et al (1985; Bordwell, 2006). That is, although it is undeniable that popular movies are evolving in

framing characters 2
certain aspects of their style, it is equally undeniable that other aspects are rock solid and unchanging.
Consider first some of the changes. In many cases the content of older movies
may seem dated. Frequently they are adaptations of now-seldom-read novels or of theatrical productions, a genre that no longer excites a wide swath of popular culture. Moreover, older movies occasionally present an unflinching and embarrassing slice of our cultural past – colonialism, racism, sexism, and the denigration of the foreign and the weak. Less offensively, clothing and hairstyles and the incessant smoking of cigarettes may strike us as anachronistic. But these attributes are not in the domain of my inquiry. Instead, I am interested in one aspect of the change in the physical appearance of movies. Of course, old movies are often in black and white; they can be grainy; their sound quality is beneath today’s standards; they are often framed narrowly in the Academy aspect ratio (4:3 or 1.37) like old-style television or blown out of scale and distorted with the original CinemaScope (2.55; see Cutting, 2014b); and they often have longer duration shots than contemporary viewers are accustomed to (Cutting et al, 2011b, 2011c; Salt, 2006). One also finds fades and dissolves interleaved between scenes to a degree that no modern filmmaker would dare emulate (Cutting et al, 2011a); and major characters often walk in and out of scenes, which contemporary movies rarely replicate (Cutting, 2014a).
Although popular movies have changed dramatically over the last 75 years, in
many ways they have hardly changed at all. The popular genres are roughly the same, the narrative form is roughly the same, and many aspects of the studio-era Hollywood style are still with us. Many stylistic attributes that worked well in older movies – shot/reverse shot organization in dialogs, point-of-view editing (where a character looks offscreen and the movie cuts to what that character is looking at), and continuity editing (emphasizing the logical coherence of the succession of shots) – are essentially the same now as they were years ago. Moreover, the arc-like structure of scenes has not changed (Cutting et al, 2012); scenes generally begin and end with longer duration shots and tend to begin with a longer scale shot and then move in on the action.
This article is about examples of both stasis and change in movies. In particular,
although the normalized placement of characters within the image has hardly changed at all, the number of those characters has diminished markedly with time. The shots of these movies simultaneously present more characters and, as I will demonstrate, this has consequences for other aspects of film form.
2. Methods for Registering the Number and Location of Characters
How might the placement and enumeration of characters be sampled and measured? To begin, I selected 48 English-language movies. Three were chosen from each of 18 years in release intervals of five years from 1935 to 2010. Within each release year one movie was classified on the Internet Movie Database (IMDb, http://www.imdb.com) as a drama (sometimes also a romance), one as a comedy (sometimes also a romantic comedy), and one as an action film (sometimes a war movie or a thriller). Each was among the highest grossing movies of its release year, or has been

framing characters 3
Fig. 1. Examples of the interface and responses for frames in three movies in the most common aspect ratios – 1.37, 1.85, and 2.35. The top panel shows Clarence Doolittle (Frank Sinatra) in Anchors Aweigh (1945, from DVD, Warner Home Video); the middle panel shows Kate McCallister (Catherine O’Hara) in Home Alone (1990, from DVD, Twentieth Century Fox Home Entertainment); and the bottom panel shows Joseph Turner (Robert Redford) in Three Days of the Condor (1975, from DVD, Paramount Home Video). The crosshair at the nose of the bridge of each character mimics the crosshair used in the computer interface to locate the position of each character in the frame. In the upper left corner of each still are small red numerals that served as buttons to click on when the number of characters in the image had been determined, which was followed (left to right) by clicks that located each character (up to five) in the image.
seen by the most people reporting on the IMDb. This group was culled from a larger sample of 160 movies that my students and I have explored previously (Cutting et al 2010; Cutting et al, 2011b). The 48 movies are listed in the appendix.
The movies were extracted from commercially available DVDs and displayed on
a laptop or desktop computer. I wrote a computer interface that skipped through each movie, beginning to end, by a uniformly random number of frames bounded between 400 and 600. Thus, on average three were selected from every 1500 frames (~1 min of film at

framing characters 4
24 frames/s). In this manner between 247 (Ace Ventura: When Nature Calls, 1995) and 508 (Spartacus, 1960) frames were sampled per movie, for a total of 16,063 images.
Because I was interested in the relations among shot duration and the other
variables, I then removed frames that were from the same shot, leaving a total of 13,956 sampled frames, of which a small number had missing data. The reason for omitting these samples is that shots that lasted more than about 20 s might have two frames that represented them, those of 40 s might have three, and so forth. Without their removal the results would be slightly biased in the representation of long-duration shots.
The mouse-controlled interface presented a single frame, allowing me first to count the number of people shown – 1, 2, 3, 4, or 5+ (five or more) – and to register that number by moving crosshairs to the upper left corner of the image and clicking on the appropriate numeral there. The interface then allowed me to move the crosshairs again and click on each of one to five characters in the image, left to right. For pragmatic reasons I will consider here only the locations of up to three characters. To register their location, I moved the crosshairs to the bridge of the nose just between the eyes. I chose this position because it is generally the center of gravity of fixations for viewers watching single-character shots (one-shots) in movies (Smith, 2013). Examples are shown in Fig. 1.
Obviously with long and medium scale shots the exact positioning of the cross hairs on the face would hardly make any difference. Considering 2.35 films and the arrangement of seats in movie theaters, THX certification (THX, 2014) would demand that image heights should be 20° from the middle of the theater. This means that for a typical long shot the height of a character’s head is about 2°, a bit more than the width of one’s thumb at arm’s length, with the difference between the eyes and the mouth a bit less than 1°. With closeups, on the other hand, such crosshair positioning might matter, since mouths are fixated about one third of the time (Võ et al, 2012).
The data on the distribution of various shot scales in this sample show that 8% of
these frames are extreme long shots (1 = XLS, with the environment shown well beyond the head and feet of the characters), 14% long shots (2 = LS, barely encompassing the head and feet), 24% medium long shots (3 = MLS, showing the characters roughly from the knees or mid thigh up), 30% medium shots (4 = MS, waist or stomach up), 16% medium closeups (5 = MCU, upper chest, shoulders and head), 6% closeups (6 = CU, head alone), and 1% extreme closeups (7 = XCU, only part of the head fitting the screen). Only in the latter three categories is the face large enough so that fixation patterns away from the eyes might be reliably registered. For a medium closeup the head is about 8° in height with the difference between the mouth and eyes about 3°. These, the closeups, and the extreme closeups would show some mean fixation positions below the bridge of the nose, but perhaps only one third of the time for shots of these three scales (or ~7% of all frames). A more detailed analysis of fixation and shot scale is given in Section 5.
For this investigation, however, I was interested in the locations of characters
regardless of how they faced with respect to the camera. When a character is turned away, I estimated the position of the bridge of their nose and clicked there. When all (up
framing characters 5
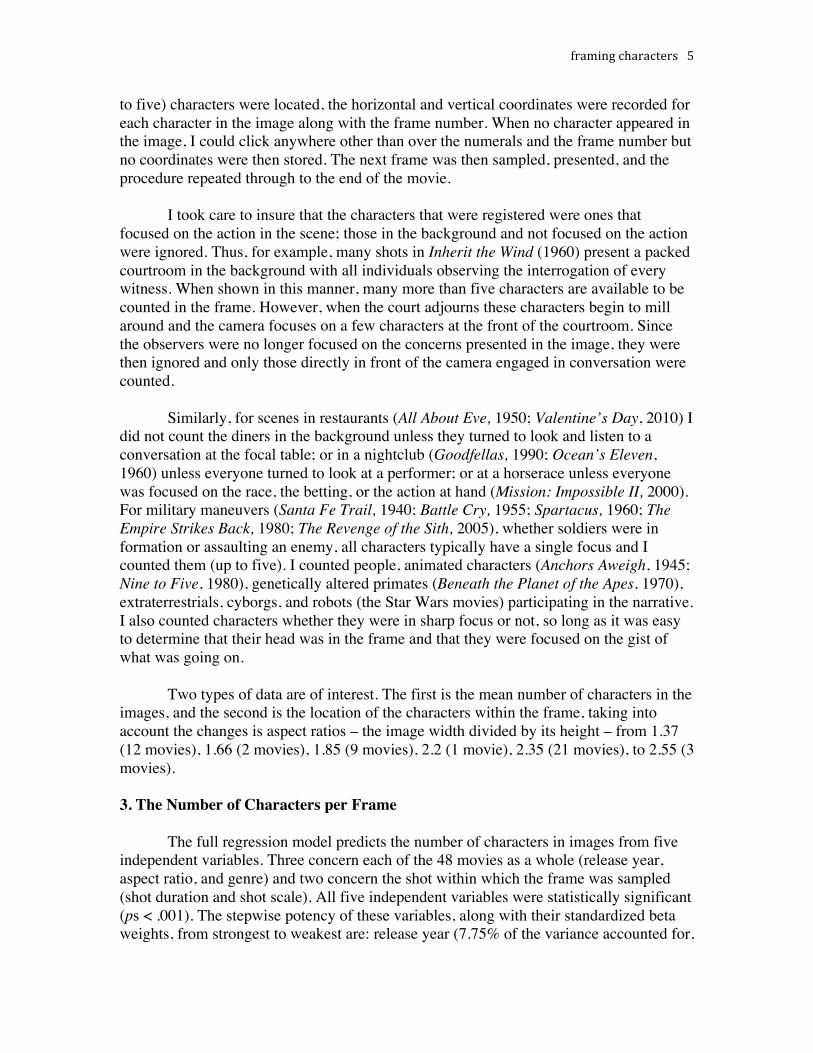
to five) characters were located, the horizontal and vertical coordinates were recorded for each character in the image along with the frame number. When no character appeared in the image, I could click anywhere other than over the numerals and the frame number but no coordinates were then stored. The next frame was then sampled, presented, and the procedure repeated through to the end of the movie.
I took care to insure that the characters that were registered were ones that
focused on the action in the scene; those in the background and not focused on the action were ignored. Thus, for example, many shots in Inherit the Wind (1960) present a packed courtroom in the background with all individuals observing the interrogation of every witness. When shown in this manner, many more than five characters are available to be counted in the frame. However, when the court adjourns these characters begin to mill around and the camera focuses on a few characters at the front of the courtroom. Since the observers were no longer focused on the concerns presented in the image, they were then ignored and only those directly in front of the camera engaged in conversation were counted.
Similarly, for scenes in restaurants (All About Eve, 1950; Valentine’s Day, 2010) I
did not count the diners in the background unless they turned to look and listen to a conversation at the focal table; or in a nightclub (Goodfellas, 1990; Ocean’s Eleven, 1960) unless everyone turned to look at a performer; or at a horserace unless everyone was focused on the race, the betting, or the action at hand (Mission: Impossible II, 2000). For military maneuvers (Santa Fe Trail, 1940; Battle Cry, 1955; Spartacus, 1960; The Empire Strikes Back, 1980; The Revenge of the Sith, 2005), whether soldiers were in formation or assaulting an enemy, all characters typically have a single focus and I counted them (up to five). I counted people, animated characters (Anchors Aweigh, 1945; Nine to Five, 1980), genetically altered primates (Beneath the Planet of the Apes, 1970), extraterrestrials, cyborgs, and robots (the Star Wars movies) participating in the narrative. I also counted characters whether they were in sharp focus or not, so long as it was easy to determine that their head was in the frame and that they were focused on the gist of what was going on.
Two types of data are of interest. The first is the mean number of characters in the
images, and the second is the location of the characters within the frame, taking into account the changes is aspect ratios – the image width divided by its height – from 1.37 (12 movies), 1.66 (2 movies), 1.85 (9 movies), 2.2 (1 movie), 2.35 (21 movies), to 2.55 (3 movies). 3. The Number of Characters per Frame
The full regression model predicts the number of characters in images from five independent variables. Three concern each of the 48 movies as a whole (release year, aspect ratio, and genre) and two concern the shot within which the frame was sampled (shot duration and shot scale). All five independent variables were statistically significant (ps < .001). The stepwise potency of these variables, along with their standardized beta weights, from strongest to weakest are: release year (7.75% of the variance accounted for,

framing characters 6
Fig. 2. The upper panel shows the mean number of characters per frame per movie plotted by release year. The lower panel shows the distribution of characters in the images of 24 older movies (1935-1970) and 24 newer movies (1975-2010). The whiskers at the right of each function are the mean 95% confidence intervals for data points in each function. The entry for 5+ includes all frames with five or more characters in them.
β [beta] = -.25), shot scale (+3.53%, β = -.19), aspect ratio (+0.19%, β = .06), shot duration (+0.15%, β = .04), and genre (+0.09%, β = .03). For the whole model the adjusted R2 = .117 (F(6,13928) = 557, p < .0001, with dfs = 2 for genre and df = 1 for year, aspect, duration, and scale). I discuss the effects on characters of release year in this section, the effects of characters on shot duration and shot scale in Section 4, the effects of shot scale in Sections 4 and 5, and the effects of aspect ratio in Sections 4 and 6.

framing characters 7
Consider two ways of thinking about the characters in an image – their mean
number and their distribution. The upper panel of Fig. 2 shows a scatterplot of the mean number of characters per image in each of the 48 movies by release year. Note the strong, essentially linear decline (r = .72, t(46) = 6.98, p < .0001, Cohen’s d = 2.06). Remember, all images with five or more characters were truncated to a value of five; some images (although not very many) might have hundreds, even thousands, of visible individuals focusing on the action in a particular shot. Notice that the images of movies from 1935 to 1950 average about 2.5 characters, whereas the those from 1995 to 2010 average only about 1.5 characters, with some contemporary movies yielding an average near a single character per frame across the entire movie.
A more detailed understanding of this change can be seen in a plot of the distributions of characters for two groups of movies – the mean proportions of the 24 movies from 1935 to 1970 and those of the 24 movies from 1975 to 2010. These differences are shown in lower panel of Fig. 2. The functions differ reliably at every point – 0, 1, 2, 3, 4, and 5+ characters (ts(46) > |3.26|, ps < .002, ds > 0.42), with greater proportions for the older movies at 2, 3, 4, and 5+ characters. Notice also that the older movies also have proportionately fewer situations in which there is one or no character. The modal number from older movies is two characters per frame along with quite a lot of frames in the 5+ category. In contrast the modal number for the newer movies is one character per frame, and with not only less than half in the 5+ category but also twice as many (14%) in the category where no character’s head appears. This latter kind of image is particularly common in action movies where inserts (closeups of details that the filmmakers want to make sure viewers notice) show characters’ hands on gadgets or guns, clocks ticking down, or computer screens with moving cursors or typed-in messages, or closing long shots show vehicles of all kinds speeding off. 4. Characters, Shot Scale, and Shot Duration What does this numerical change in character presentation add to what we know about changes in film form and Hollywood style? Three variables interact in this context – shot duration, shot scale, and the number of characters in the frame. We know that shot durations have gotten shorter over the course of this sample, 1935 to 2010 (Cutting et al, 2010; Salt, 2006) and that shot scales have shifted more towards closeups (Cutting et al, 2012; Cutting and Iricinschi, 2014; Salt, 2006). Moreover, relying on the statements of filmmakers, Bordwell (2006, p. 137) suggested a link between these two: “Tighter framings permit faster cutting.” One would suppose that fewer characters would also allow tighter framings and, perhaps in turn, shorter duration shots. How closely related are all of these variables?
Results are represented in the panels of Fig. 3. The vertically elongated gray clouds of varying density in both panels are representations of the raw data – the darker the area the more data points are represented. The darkest correspond to those shots with reaction time regions at the 80th percentile density and higher. Intermediate gray areas

framing characters 8
Fig. 3: The top panel shows a representation of the effects of the number of characters depicted in a shot and the increasing duration of that shot. The upward sloping regression line shows this effect to be about 1.5 s per character. The bottom panel shows the effect of shot scale and the decreasing shot duration. The narrow vertical clouds in both panels represent the distributions of raw data where darker regions represent more data points and lighter regions fewer data points. XLS = extreme long shot, LS = long shot, MLS = medium long shot, MS = medium shot, MCU = medium close up, CU = close up, XCU = extreme close up.
correspond to the data between 60th and 80th, the 40th and 60th, and the 20th and 40th percentiles. White areas are those below the 20th percentile.
The upper panel shows an upwardly sloping regression line that represents how
shot duration increases with the increasing number of characters that appear in the frame (t(13929) = 9.16, p < .0001, Cohen’s d = .16). The plot suggests that each additional character that appears typically necessitates an additional 1.5 s per shot. Consistent with

framing characters 9
Fig. 4. The mediation of the effect of shot scale on shot duration by the number of characters in the frame. That is, the effect of shot scale on shot duration (closer shots are linked to shorter duration shots; Bordwell, 2006, p. 137) is significantly affected (mediated) by the number of characters in the frame. In other words, the more characters the longer the shot scale, and in turn the longer the shot scale the longer the shot duration.
this finding, the shortest duration shots are generally those with no characters. For the various kinds of closeups these are often inserts (for example, shots of hands on objects), and for the various kinds of longer shots these range from panoramas of mountains to unpopulated street scenes to empty rooms to vacant desks. Unsurprisingly, the images that are most frequent are with those one (36%) and two characters (30%) characters.
In the lower panel the downwardly sloping regression line represents the decrease
in shot duration as shot scale increases, moving towards closeups (t = -6.27, p < .0001, d = .11). Thus, generally speaking, tighter framing yields shorter duration shots as Bordwell suggested. Again, medium long (3; here 23%) and medium shots (4; 30%) are the most common. Closeups (6) and extreme closeups (7) are combined since they are rare.
Logically, these three variables are ordered in film production. The director stages the mise-en-scène with the characters to be seen in the shots, the cinematographer frames the scale for the mise-en-cadre, and the editor cuts and assembles the shots. One can statistically assess the relation among the three variables by a mediation analysis (Baron and Kenney, 1986), looking for causal relations that may follow the logical ones. How this analysis is performed is suggested in Fig. 4. The associations (regression coefficients) among the three variables are assessed. Each of these is relatively small (they can range from 0.0 to 1.0) but statistically significant given the very large sample. Of critical importance here is the association between shot scale and shot duration (-.045). When one takes into account the number of characters in the frame this association decreases (-.033) very strongly as measured by a Sobel test (z = 17.7; Preacher and Hayes, 2004). This means that the number of characters is not only statistically related to shot duration and shot scale, but one can say that it causally affects the relationship between them.
There are other important effects not shown in Fig. 3. These include a strong
decline of shot duration with release year (t = -31.42, p < .0001, d = .53), probably the most widely known and researched historical change in popular movies. This effect predicts shot duration, while not diminishing the effect of the number of characters (t = 5.02, p < .001, d = .09) or shot scale (t = -2.92, p < .001, d = .05) on shot duration. It is

framing characters 10
tempting then, given the results shown in Figs. 3 and 4, to think that a good bit of this release-year effect is due to the effects studied here – the decreasing number characters per shot and the increasing shot scale. In fact, however, they are only a small part of the story. Stepwise multiple regression analysis allows one to assess the relative magnitude of these effects. If one enters the number of characters and the shot scale into the analysis of shot duration first, one finds that they account for 4.4%of the variance. If one then enters release year, it accounts for an additional 9.4% of the variance. Because these effects are correlated, if one does the reverse, entering release year first, one find that it accounts for 12.9% of the variance, and together the number of characters and shot scale account for only an additional 0.9% variance. Thus, much more is going on with the decline of shot durations than the variables studied here. Roughly speaking, perhaps only about a fifth of the decline in shot duration can be accounted for by the decline in the number of characters shown in a frame.
Finally, there is also a reliable effect of aspect ratio (t = -17.48, p < .0001, d = .29)
although the direction of this simple trend is somewhat counterintuitive – the wider (and hence larger) the screen the fewer the number of characters is presented. Movies in Academy ratio (aspect = 1.37) have more people in them than those in widescreen (1.85), which have more than those in CinemaScope (2.35). The reason for this is its combination with two other trends: First, the number of characters per image has declined with release year and all movies released prior to 1953 were in the Academy ratio; and second, more contemporary action films, which show fewer characters per image – 1.91 vs. 2.01 for comedies and dramas (t = 4.81, p < .008, d = .08) – tend to be formatted in 2.35 whereas comedies and dramas in this sample are often formatted in 1.85 (see Cutting, 2014a, 2014b). When genre and release year are factored out there is a smaller and positive relationship between aspect ratio and the number of characters – the wider the image the more characters within the frame (t = 5.89, p < .0001, d = .10).
5. One-Shots, Shot Scale, and Attentional Synchrony
Above, I suggested that filmmakers may have diminished the number of characters shown in shots in part as an effort to increase their control of viewers’ gaze. That is, with one character in view there are fewer choices of where to look than if there are two or more. But shot scale and the further consideration of one-shots can provide additional support for this view. Hasson et al (2008) showed considerable correlation in gaze position for viewers of film, and Smith and Mital (2013) showed that this attentional synchrony (shared positions of eye fixation) are considerably greater than anything seen for static pictures. Combining one-shots with the consideration of shot scale offers a further opportunity to investigate attentional synchrony, and Smith (2013) measured eye fixations on characters in shots of different scale. Smith found that the variance in eye fixation positions was least for medium close-ups and that this variance increased as filmmakers moved to longer shots (eye gaze went to other parts of the body) and when they moved to close-ups (eye gaze dodged between eyes and mouth, which were enlarged for these shots).

framing characters 11
Fig 5. The top panel shows comparison of the distributions of shot scales for two groups of films, the relatively old (1935-1970) and the more contemporary (1975-2010). Again, XLS = extreme long shot, LS = long shot, MLS = medium long shot, MS = medium shot, MCU = medium close up, CU = close up, XCU = extreme close up. The bottom panel shows the measured spread of fixations, and hence attentional synchrony, of viewers to one-shots according to shot scale (data digitally taken from Smith, 2013, Figure 9.3).
Although I have no eye movement data here, it is useful to compare the eye-
position covariance data taken from Smith (2013), shown in the lower panel of Fig. 5, with the distributional one-shot scale data for the samples of frames in the 48 films studied here, shown in the upper panel. It is also useful to compare the older films with the more contemporary ones. The correlation of the compactness of eye fixations from Smith (2013) with the one-shot scale proportions for films from 1935 to 1970 is quite high (r = .88, p < .009, t(5) = 4.14, d = 3.71), but that for the films from 1975 to 2010 is a bit higher (r = .95, p < .001, t(5) = 7.66, d = 7.66). These latter distributions differ significantly (t(13933) = 198, p < .0001, d = 2.17), and it would appear that filmmakers may be, among many other things, tailoring the distributions of their shot scales in line with their desire to control viewer gaze. Let me now shift gears from a gradual historical changes in Hollywood style to a robust constancy.
framing characters 12
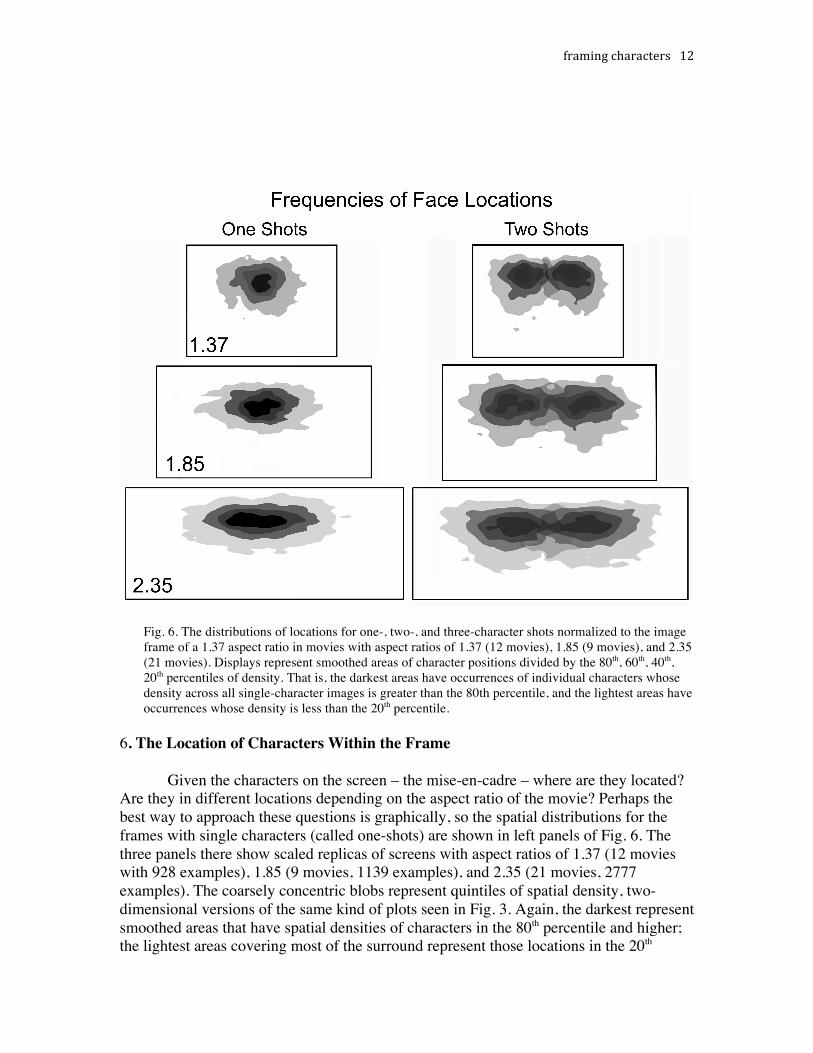
Fig. 6. The distributions of locations for one-, two-, and three-character shots normalized to the image frame of a 1.37 aspect ratio in movies with aspect ratios of 1.37 (12 movies), 1.85 (9 movies), and 2.35 (21 movies). Displays represent smoothed areas of character positions divided by the 80th, 60th, 40th, 20th percentiles of density. That is, the darkest areas have occurrences of individual characters whose density across all single-character images is greater than the 80th percentile, and the lightest areas have occurrences whose density is less than the 20th percentile.
6. The Location of Characters Within the Frame Given the characters on the screen – the mise-en-cadre – where are they located? Are they in different locations depending on the aspect ratio of the movie? Perhaps the best way to approach these questions is graphically, so the spatial distributions for the frames with single characters (called one-shots) are shown in left panels of Fig. 6. The three panels there show scaled replicas of screens with aspect ratios of 1.37 (12 movies with 928 examples), 1.85 (9 movies, 1139 examples), and 2.35 (21 movies, 2777 examples). The coarsely concentric blobs represent quintiles of spatial density, two-dimensional versions of the same kind of plots seen in Fig. 3. Again, the darkest represent smoothed areas that have spatial densities of characters in the 80th percentile and higher; the lightest areas covering most of the surround represent those locations in the 20th

framing characters 13
Fig. 7. The distributions of locations for one-, two-, and three-character shots normalized (affine transformed) to the image frame of a 1.37 aspect ratio. The grid of lines divides the area into thirds, both horizontally and vertically following the putative “rule of thirds.” I regard the correspondence of the grid lines to the two-shot case to be happenstantial.
percentile and lower, and intermediate gray areas in between. The most obvious and visible result is that as the movie image gets wider, the locations in which single characters appear spreads out accordingly. One can assess this effect by measuring the distances of all one-shot characters in all formats from the center of the screen. Indeed, as the screen gets wider the locations of the characters spread laterally away from the center (t(5380) = 46.64, p < .0001, d = 1.27).

framing characters 14
However, notice also that the lateral spread appears proportional to the aspect ratio of the screen. If one morphs the screens to the same shape (an affine transformation represented in the top panel of Fig. 7 as a 1.37 format screen) the distributions of all the percentile regions become congruent. Indeed, after this adjustment the variation in proportional distances of characters from the center of the screen across all aspect ratios disappears (t = 0.07, ns). Null hypothesis testing does not allow for assessment of the plausibility of finding no statistical effect, but Bayesian analysis does (Rouder et al, 2009). When the effect of release year is assessed after genre and aspect ratios are partialed out, the results show that the null hypothesis is slightly favored over the plausibility of an effect of release year. The ratio of the evidence for the null over the evidence for a change over release years, called the Bayes factor, is 1.07. Thus, despite the differences in screen shapes across the 75 years, there has been a remarkable constancy in the proportional placement of single characters on the screen. The same type of general patterns can be seen with two characters, in framings called two-shots. These are shown for different aspect ratios in right panels of Fig. 6, and with the morphed similarities in the middle panel of Fig. 7. The average distance of the two characters from the center of the screen grows with the aspect ratio, as suggested in the right panels of Fig. 7 (t(5212) = 32.77, p < .0001, d = .46); yet the normalized distance in the morphed comparisons shown in Fig. 7 is greatly reduced in the context of so many examples (t = -3.27, p < .001, d = .09, Bayes factor = 0.35). In fact, the mean positions of the two characters in the normalized space are proportionately slightly closer together on wider screens. Since lateral extents of the screens vary it will be useful to measure such displacements in terms of the vertical extent of the screen, which can be taken as constant across all aspect ratios. Thus, the two-shot difference in mean normalized character positions between 1.37 and 2.55 formats is, measured laterally, about 1% of the screen height – statistically reliable but almost negligible. Moreover, like that for one-shots, the residual effect here cannot be attributed to variations over release years; Bayesian analysis greatly favors the null hypothesis (Bayes factor = 11.3). The distributions of characters continue these trends for three-shots, although they become noisier as suggested in the normalized graph at the bottom of Fig. 7. The mean position of the central figure in the three-shot is roughly the mean position of the single character in the one-shot. The flanking two characters are displaced more laterally than the characters in the two-shot. Moreover, the spread of the flanking characters increases with aspect ratio (t(1418) = 24.9, p < .0001, d = 1.32) as before, but when normalized the differences across aspect ratios are minimized (t = -2.73, p < .006, d = .14, Bayes factor = 0.91). As with the characters in the normalized two-shots, the mean position of flanking characters in the three-shots are pinched together a bit more in wider screen shots, even a bit more than they are in two-shots. The lateral difference between the flanking characters in the 1.37 and 2.55 formats is about 2% of the screen height. Moreover and again, a Bayesian analysis favors the null hypothesis over any effect of release years (Bayes factor = 6.33).

framing characters 15
7. Asymmetries and a Rule of Thirds? There are also asymmetries in the image results seen in Figs. 6 and 7. All of these have displacements slightly to the left of center of the screen. For one-shots, this lateral displacement is about 2% of screen height (t(5381) = 9.97, p < .0001, d = .27). For two-shots, this leftward displacement of both characters is about 1% of the screen height (t(5216) = 4.23, p < .0001, d = .12). And for the characters in the three-shots they are all displaced to the left by almost 3% of the screen height (t(1418) = 3.83, p < .0001, d = .20).
It is somewhat difficult to know how to account for such effects. Are these results real or an artifact? It is often said that many actors have a preference for which side of their face is photographed; web searches suggest that Claudette Colbert strongly preferred that the left side of her face be photographed but that Mariah Carey prefers her right. Blackburn and Schirillo (2012) have shown that three-quarter views of left sides of peoples’ faces, in both normal and mirror-reversed presentations, are judged as more attractive than the right sides – but the effect size is relatively small and the number of pictures used were relatively few. Were this effect real, the logic of the placement of characters’ heads more towards the right side of the screen would place their noses more to the left. Nonetheless, the data for all of this seems weak and the logic of staging characters in such a manner seems tenuous when applied to different places on the screen. Most characters cannot be facing screen left most of the time.
More likely, this slight leftward bias could be an undershoot response of mine in
performing the task, moving the mouse cursor left to right from the upper left of the image where the numerals are located to indicate the number of characters in the image to the bridge of the nose for each of the characters. Results concerning Fitts’ Law of for lateral movement accuracies often find such an undershoot when moving from a start position to a target manually (Engelbrecht, Berthier, and O’Sullivan, 2003) or even with saccadic eye movements (Wu, Kwon, and Kowler, 2010). Fortunately, even if such a bias accounts for the asymmetries, it matters little for the overall patterns shown in Figs. 6 and 7. Moreover, it would not be applicable to the vertical dimension, nor would it affect the number of characters recorded per frame shown in Fig. 2.
Finally, grid lines are placed in the morphed 1.37-format images of Fig. 7. These represent what is called the “rule of thirds” concerning the composition of images in photography and in film. That is, the horizontal and vertical extents of the image are divided into thirds and the cross hatchings create nine equal areas. The intersections of the lines are often thought to be good composition points. That is, placing objects there is thought to provide a good dynamic balance. This idea seems to have originated with John Thomas Smith (1797, pp. 15-17) and has been promoted in some books on art, photography, and cinematography (see Bergeron and Lopes, 2012, p. 71; Ryan and Lenos, 2012, p. 40; Thompson and Bowen, 2013, pp 43-44). Consider horizontal and vertical dimensions of this “rule.” For a two-shot and moving from the left edge of the frame to the right edge, the modal horizontal placement of the characters’ heads at one-third and two-thirds across the image would seem almost

framing characters 16
Fig 8. The framework for testing the appropriateness of the “rule of thirds” as applied to the cinematic framing shown in Fig 6.
automatic. Each head would normally be surrounded by a certain amount of social distance (as in conversation, but not as in kissing) and, regardless of shot scale, the composition of the shot would likely bring the heads towards the center and away from the edges. The modal vertical placements would follow. Each head needs space above it (called headroom; Thompson and Bowen, 2013) moving the eyes downward from the top and much of the body is typically included, moving the eye up from the center. But rather than impressionistically considering this rule, one can address the issue statistically. Shown in Fig. 8 is a mock-up of a 1.37 screen image, with ellipses drawn around the intersections of the lines that delimit one criterion for assessing the rule of thirds. The radial axes of the ellipses are 11% of the screen dimensions. In this context it seems reasonable to consider only the upper two ellipses for the placement of the bridge of the characters’ noses. At issue is: what proportion of the bridges of the noses of the characters appears within these ellipses? Whereas these particular ellipses occupy 17% of the upper half of the screen, 41% of the characters’ faces appear within them. This effect is highly reliable (χ2(1) = 4558, p < .0001), but the fact that 59% of the characters fall outside of this region makes any assumption of a corroboration of the “rule of thirds” seem less impressive. Moreover, considering the one-shots, the characters appear within the ellipses only 19% of the time, and in the three-shots they appear within them only 30% of the shots. It seems to me that these data are not strong evidence in favor a “rule of thirds” as applied to the framing of characters in popular movies. Moreover, others have questioned the empirical efficacy of this rule in photography (see Guidi and Palmer, 2014; Palmer, Hara, and Griscom, 2014). My conclusion, then, is that because the one-shot and the three-shot distributions bear little resemblance to the intersections in Fig 7, the correspondence of characters positions and the grid lines for two-shots – one out of three cases shown in Fig. 7 – is essentially happenstance. The two-shot pattern seems to follow from the symmetries of frame by character number interactions. 8. Discussion and Summary Although he did not do so quantitatively, Bordwell (2005) studied the spatial distribution of characters in the mise-en-scène, the area in front of the camera. This

framing characters 17
quantitative study explored the number and distribution of characters in the mise-en-cadre, in the frame of the image. Bordwell et al (1985) and Bordwell (2006) explored the history of the development of Hollywood style, emphasizing both its constancy and change from the silent era through the studio and post-studio eras to the present day. In exploring the number and locations of characters in frames taken from 48 movies, I found one of each.
First, the average number of characters shown in shots of older movies is more than that for more contemporary ones, and the change from means of about 2.5 to about 1.5 characters appears to have been smooth and incremental. But second, the proportional placement of characters within the frame has, despite changes in aspect ratio, remained remarkably constant over the same period. In shots where one, two, and three characters are portrayed and then morphed to the same aspect ratio, I found vanishingly little difference, whether the frame is in Academy ratio (1.37) or CinemaScope (2.35). These results, one of change and the other of constancy, suggest that popular cinema is evolving but not in all attributes.
Why might one of these variables change (the number of characters in the frame)
and the other one not (the placement of the characters in that frame)? The answer to the latter would appear to be that there are few good options. Note that, although there is great variation in where one, two, and three characters might appear on the screen as shown in Fig. 7, the center of the screen is a compositionally prominent spot (Arnheim, 1982; Guidi and Palmer, 2014) and viewers have a bias to look there (Mital et al 2011; Tatler, 2007). It is not clear whether this bias comes from our experience looking at movies, or whether movies capitalize on the symmetries around the center of the frame and force us to look there – chicken and egg. But either way, working from the center out, whether as a filmmaker or as a viewer, seems to be a fine normative strategy. Thus, for a single character or the central character of three, the center of the frame will be the location of central tendency. For two characters, or for the flanking characters in the threesome, they need to be spread out. But if they are too far from the center, constraints of saccade length and accuracy may impair viewers’ quick apprehension of the action; but they also can’t be too close if they are to keep personal or social distance.
Why would the number of characters on the screen decline? The answer to this
question, I think, is threefold. The first rationale stems from filmmakers’ increasing control of viewers’ gaze (Smith, 2013). Viewers look at the faces of characters in movies almost all the time; they rarely look at backgrounds. By presenting fewer characters per image, filmmakers give viewers fewer options as to where to look. Second, reducing the number of characters in frame allows filmmakers to hone in on one in particular, increasingly using closeups of various kinds. And third, as noted by Bordwell (2006) and shown in Fig. 3, closer shots allow quicker cutting. The latter two trends – more closeups and shorter duration shots – are attributes of what Bordwell (2006) has called the intensified continuity found in contemporary movies. I claim that the first trend – fewer characters in the frame – is a precondition for the latter two, and the mediation analysis provides support for this view.

framing characters 18
Acknowledgments I thank my students – Kaitlin Brunick, Ayse Candan, and Catalina Iricinschi – for their continued support, and Malcolm Turvey for leading me to the analysis of shots scales and shot duration as they might be related to the number of characters in the frame. References Arnheim, R. (1982). The power of the center. University of California Press, Berkeley, CA, USA. Baron, R. M. and Kenney, D. A. (1986). The moderator-mediator variable distinction in social
psychological research: Conceptual, strategic, and statistical considerations. J. of Pers. Soc. Psychol., 51, 1173-1182.
Bergeron, V. and Lopes, D. M. (2012). Aesthetic theory and aesthetic science: Prospects for integration. In: Aesthetic science: Connecting minds, brains, and experience, A. Shimamura and S. E. Palmer (Eds.) pp. 63-79. Oxford, New York, USA.
Blackburn, K. and Schirillo, J. (2012). Emotive hemispheric differences measure in real-life portraits using pupil diameter and subjective aesthetic preferences. Exp. Brain Res., 219, 447-455.
Bordwell, D. (1989). A case for cognitivism. Iris, 9(Spring), 11-40. Bordwell, D. (2005). Figures traced in light: On cinematic staging. University of California Press,
Berkeley, CA, USA. Bordwell, D. (2006). The way Hollywood tells it. University of California Press, Berkeley, CA, USA. Bordwell, D., Staiger, J., and Thompson, K. (1985). The classical Hollywood cinema: Film style and mode
of production to 1960. Columbia University Press, New York, USA. Currie, G. (1995). Image and mind: Film, philosophy, and cognitive science. Cambridge University Press,
Cambridge, UK. Cutting, J. E. (2014a). Event segmentation and seven types of narrative discontinuity in popular movies.
Acta Psychol., 149(6), 69-77. Cutting, J. E. (2014b). How light and motion bathe the silver screen. Psychol. Aesth. Creat. Arts, in press. Cutting, J. E., Brunick, K. L., and Candan, A. (2012). Perceiving event dynamics and parsing Hollywood
films. J. Exp. Psychol.: Hum. Percept. Perf., 34(4), 1476-1490. ��� Cutting, J. E., Brunick, K.L., and DeLong, J. E. (2011a). The changing poetics of the dissolve in
Hollywood film. Emp. Stud. Arts, 29(2), 149-169. ��� Cutting, J. E., Brunick, K. L., DeLong, J. E., Iricinschi, C., and Candan, A. (2011b). Quicker, faster, darker:
Changes in Hollywood film over 75 years. i-Percept., 2, 569-576. Cutting, J. E., DeLong, J.E., and Brunick, K. L. (2011c). Visual activity in Hollywood film: 1935 to 2005
and beyond. Psychol. Aesth. Creat. Arts, 5, 115-125. Cutting, J. E., DeLong, J. E., and Nothelfer, C.E. (2010). Attention and the evolution of Hollywood film.
Psychol. Sci., 21(3), 440-447. Cutting, J. E., and Iricinschi, C. (2014). Re-presentations of space in Hollywood movies. Cogn. Sci., in
press. Eisenstein, S. (1949). Film form: Essays in film theory. (J. Leyda, Trans.). Harcourt, New York, USA. Engelbrecht, S. E., Berthier, N. E., and O’Sullivan, L. P. (2003). The undershoot bias: Learning to act
optimally under uncertainty. Psychol. Sci., 14(3), 257-261. Guidi, S. and Palmer, S. E. (2014). The internal structure of a rectangular frame: Position, orientation, and
direction. Art and Perc., 1(2), 000-000. Hasson, U., Landesman, O., Knappmeyer, B., Valines, I., Rubin, N., and Heeger, D. J. (2008).
Neurocinematics: The neuroscience of film. Projections: The Journal for Movies and Mind, 2(1), 1-26.
Mital, P. K., Smith, T. J., Hill, R. L., & Henderson, J. M. (2011). Clustering of gaze during dynamic scene viewing is predicted by motion. Cognitive Computation, 3, 5-24.
Preacher, K. J., and Hayes, A. F. (2004). SPSS and SAS procedures for estimating indirect effects measures. Multivariate Behavioral Research, 30, 41-62.
Rouder, J. N., Speckman, P. L., Sun, D., Morey, R. D., and Iverson, G. (2009). Bayesian t-tests for accepting and rejecting the null hypothesis. Psychonomic Bulletin & Review, 16(2), 225-247.
Ryan, M., and Lenos, M. (2012). An introduction to film analysis: Technique and meaning in narrative film. Continuum, New York, USA.

framing characters 19
Salt, B. (2006). Moving into pictures. Starwood, London, UK. Smith, J. T. (1797). Remarks on rural scenery; with twenty etchings of cottages, from nature; and some
observations and precepts relative to the picturesque. Nathaniel Smith, London. http://en.wikipedia.org/wiki/Rule_of_thirds.
Smith, T. J. (2013). Watching you watch movies: Using eye tracking to inform cognitive film theory. In: Psychocinematics: Exploring cognition at the movies, A. P. Shimamura (Ed.), pp. 165-191. Oxford, New York, USA.
Smith, T. J., & Mital, P. K. (2013). Attentional synchrony and the influence of viewing task on gaze behavior in static and dynamic scenes. Journal of Vision 13(8), Article 16, 1-23.
Tatler, B. W. (2007). The central fixation bias in scene viewing: Selecting an optimal viewing position independently of motor biases and image feature distributions. Journal of Vision, 7(14), Article 4, 1-17.
Thompson, R. and Bowen, C. J. (2013). The grammar of the shot (3rd ed.) Focal Press, Burlington, MA, USA.
THX (2014). THX certified cinemas screen placement. http://www.txh.com/professional/cinema-certification/cinema-specifications/thx-certified-screen-placement/ Accessed 18 June 2014.
Võ, M. L, Smith, T. J., Mital, P. K., and Henderson, J. M. (2012). Do the eyes really have it? Dynamic allocation of attention when viewing moving faces. J. Vision, 12(13), Article 3, 1-14.
Wu, C.-C., Kwon, O.-S., and Kowler, E. (2010). Fitts’ Law and speed/accuracy tradeoffs during sequences of saccades: Implications for strategies of saccadic planning. Vis. Res., 50(21), 2142-2157.
Filmography (Movies and their Aspect Ratios)
1935 Conway, J. (1935). A Tale of Two Cities. Warner Home Video, USA, 1.37 Curtiz, M. (1935). Captain Blood. Warner Home Video, USA, 1.37 Wood, S. (1935). A Night at the Opera. Warner Home Video, USA, 1.37 1940 Cukor, G. (1940). The Philadelphia Story. Warner Home Video, USA, 1.37 Curtiz, M. (1940). Santa Fe Trail. Warner Home Video, USA, 1.37 Ford, J. (1940). Grapes of Wrath. Twentieth Century Fox Home Entertainment, USA, 1.37 1945 Curtiz, M. (1945) Mildred Pierce. Warner Home Video, USA, 1.37 Lloyd, F. (1945). Blood on the Sun. Republic Pictures Home Video, USA, 1.37 Sidney, G. (1945). Anchors Aweigh. Warner Home Video, USA, 1.37 1950 Koster, H. (1950). Harvey. Universal Studios Home Video, USA. 1.37 Mankiewicz, J. (1950). All About Eve. Twentieth Century Fox Home Video, USA, 1.37 Tourneur, J. (1950). The Flame and the Arrow. Warner Home Video, USA, 1.37 1955 Kazan, E. (1955). East of Eden. Warner Home Video, USA 2.55 Walsh, R. (1955). Battle Cry. Warner Home Video, USA 2.55 Wilder, B. (1955). The Seven Year Itch. Twentieth Century Fox Home Video, USA, 2.55 1960 Kramer, S. (1960). Inherit the Wind. MGM/UA Home Video, USA, 1.66 Kubrick, S. (1960). Spartacus. Universal Studios Home Entertainment, USA, 2.2 Milestone, L. (1960). Ocean’s Eleven. Warner Home Video, USA, 2.35

framing characters 20
1965 Donner, C. & Talmadge, R. (1965). What’s New Pussycat. MGM/UA Home Entertainment, France/USA,
1.66 Edwards, B. (1965). The Great Race. Warner Home Video, USA, 2.35 McLaglen, A. (1965). Shenandoah. Universal Studios Home Entertainment USA, 1.85 1970 Altman, R. (1970). MASH. Twentieth Century Fox Home Video, USA, 2.35 Post, T. (1970). Beneath the Planet of the Apes. Twentieth Century Fox Home Video, USA, 2.35 Rafelson, B. (1970). Five Easy Pieces. Columbia TriStar Home Entertainment, USA, 1.85 1975 Edwards, B. (1975). Return of the Pink Panther. Universal Studios Home Video, UK, 2.35 Huston, J. (1975). The Man Who Would Be King. Warner Home Video, UK/USA, 2.35 Pollack, S. (1975). Three Days of the Condor. Paramount Home Video, USA, 2.35 1980 Higgins, C. (1980). Nine to Five. Twentieth Century Fox Home Video, USA, 1.85 Kershner, I. (1980). Star Wars: Episode V – The Empire Strikes Back. Twentieth Century Fox Home
Video, USA, 2.35 Redford, R. (1980). Ordinary People. Twentieth Century Fox Home Video, USA, 1.85 1985 Cosmatos, G. (1985). Rambo: First Blood, Part 2. Universal Pictures Home Video, USA, 2.35 Landis, J. (1985). Spies Like Us. Warner Home Video, USA, 1.85 Weir, P. (1985). Witness. Paramount Home Entertainment, USA, 1.85 1990 Columbus, C. (1990). Home Alone. Twentieth Century Fox Home Entertainment, USA, 1.85 Harlin, R. (1990). Die Hard 2. Twentieth Century Fox Home Entertainment, USA, 2.35 Scorsese, M. (1990). Goodfellas. Warner Home Video, USA, 1.85 1995 Campbell, M. (1995). GoldenEye. MGM/UA Home Entertainment, UK/USA, 2.35 Oedekerk, S. (1995). Ace Ventura: When Nature Calls. Warner Home Video, USA, 2.35 Singer, B. (1995). The Usual Suspects. MGM Home Entertainment, USA/Germany, 2.35 2000 Woo, J. (2000). Mission: Impossible II. Paramount Home Entertainment, USA/Germany, 2.35 Soderbergh, S. (2000). Erin Brockovich. Sony Pictures Home Entertainment, USA, 2.35 Meyers, N. (2000). What Women Want. Paramount Home Video, USA, 1.85 2005 Dobkin, D. (2005). Wedding Crashers. Warner Home Video, USA, 2.35 Mangold, J. (2005). Walk the Line. Twentieth Century Fox Home Entertainment, USA/Germany, 2.35 Lucas, G. (2005). Star Wars: Episode III – Revenge of the Sith. Twentieth Century Fox Home
Entertainment, USA, 2.35 2010 Fincher, D. (2010). The Social Network. Sony Pictures Home Entertainment, USA, 2.35 Marshall, G. (2010). Valentine’s Day. Warner Home Video, USA, 2.35 Nolan, C. (2010). Inception. Warner Home Video, USA/UK, 2.35