Arsenic in Rice and Rice Products - Startseite - BfR · Arsenic in Rice and Rice Products BfR...
58
Seite 1 von 58 www.bfr.bund.de Arsenic in Rice and Rice Products BfR Opinion No. 018/2015 of 24 June 2014 Arsenic occurs in various concentrations everywhere in the soil. It has been known for quite some time that cereals such as rice can contain more arsenic in the form of inorganic arsenic compounds (also known as inorganic arsenic) from the environment than other cereal types. The level of arsenic in rice depends on several factors, such as the concentration in the soil and in irrigation water, the type of rice and also the preparation of the food. If intake is long- term, inorganic arsenic compounds can impair various organs, even if ingested in compara- tively small quantities. The intake of inorganic arsenic with drinking water correlates in epi- demiological studies among other things with skin diseases and an increased risk of con- tracting certain types of cancer. For this reason, international panels classify inorganic arse- nic as carcinogenic to humans. The carcinogenic mechanism of inorganic arsenic has not been fully clarified yet. Thus it has not been possible up to now to derive a safe intake quanti- ty which may not involve an increased risk of cancer. The existence of inorganic arsenic in foods is therefore undesired in all quantities, although it cannot be completely avoided. Examinations undertaken by the regional authorities responsible for monitoring have con- firmed that rice and rice products such as rice cakes and creamed rice for infants can have relatively high levels of inorganic arsenic, which is of particular relevance from a toxicological point of view. These findings match up with those of the European Food Safety Authority (EFSA) and the authorities in other EU member states. On behalf of the Federal Ministry of Food and Agriculture, the Federal Institute for Risk Assessment (BfR) has assessed the health risk posed for various consumer groups through the intake of inorganic arsenic com- pounds with rice and rice products. After making an assessment based on the Margin of Exposure concept 1 , the BfR arrives at the conclusion that health impairments concerning the risk of cancer are possible. The levels of inorganic arsenic in foods should therefore be reduced to an unavoidable minimum (ALARA principle). The BfR recommends that possibilities to reduce exposure to inorganic arsenic compounds from rice and rice products be examined. The data show that the levels in several of the rice products examined are higher than in grains of rice. The reasons for the higher levels of ar- senic compounds in these rice products compared to grains of rice should be clarified. Op- tions to minimise the levels of arsenic in these products should be evaluated. Furthermore, the consumption data on rice products should be updated so that exposure can be estimated realistically, especially where small children are concerned. 1 The Margin of Exposure expresses the ratio between the exposure of the consumer and the exposure that causes health impairments (e.g. an increase in tumour incidence) either in a test with animals or in epidemiological studies, which occur addi- tionally in a certain percentage of the exposed test animals or human population. It is used if no dose without effect can be established through experiments and it gives risk management indications regarding the degree of urgency with which measures are required.
Transcript of Arsenic in Rice and Rice Products - Startseite - BfR · Arsenic in Rice and Rice Products BfR...
Seite 1 von 58
www.bfr.bund.de
Arsenic in Rice and Rice Products BfR Opinion No. 018/2015 of 24 June 2014 Arsenic occurs in various concentrations everywhere in the soil. It has been known for quite some time that cereals such as rice can contain more arsenic in the form of inorganic arsenic compounds (also known as inorganic arsenic) from the environment than other cereal types. The level of arsenic in rice depends on several factors, such as the concentration in the soil and in irrigation water, the type of rice and also the preparation of the food. If intake is long-term, inorganic arsenic compounds can impair various organs, even if ingested in compara-tively small quantities. The intake of inorganic arsenic with drinking water correlates in epi-demiological studies among other things with skin diseases and an increased risk of con-tracting certain types of cancer. For this reason, international panels classify inorganic arse-nic as carcinogenic to humans. The carcinogenic mechanism of inorganic arsenic has not been fully clarified yet. Thus it has not been possible up to now to derive a safe intake quanti-ty which may not involve an increased risk of cancer. The existence of inorganic arsenic in foods is therefore undesired in all quantities, although it cannot be completely avoided. Examinations undertaken by the regional authorities responsible for monitoring have con-firmed that rice and rice products such as rice cakes and creamed rice for infants can have relatively high levels of inorganic arsenic, which is of particular relevance from a toxicological point of view. These findings match up with those of the European Food Safety Authority (EFSA) and the authorities in other EU member states. On behalf of the Federal Ministry of Food and Agriculture, the Federal Institute for Risk Assessment (BfR) has assessed the health risk posed for various consumer groups through the intake of inorganic arsenic com-pounds with rice and rice products. After making an assessment based on the Margin of Exposure concept1, the BfR arrives at the conclusion that health impairments concerning the risk of cancer are possible. The levels of inorganic arsenic in foods should therefore be reduced to an unavoidable minimum (ALARA principle). The BfR recommends that possibilities to reduce exposure to inorganic arsenic compounds from rice and rice products be examined. The data show that the levels in several of the rice products examined are higher than in grains of rice. The reasons for the higher levels of ar-senic compounds in these rice products compared to grains of rice should be clarified. Op-tions to minimise the levels of arsenic in these products should be evaluated. Furthermore, the consumption data on rice products should be updated so that exposure can be estimated realistically, especially where small children are concerned.
1 The Margin of Exposure expresses the ratio between the exposure of the consumer and the exposure that causes health impairments (e.g. an increase in tumour incidence) either in a test with animals or in epidemiological studies, which occur addi-tionally in a certain percentage of the exposed test animals or human population. It is used if no dose without effect can be established through experiments and it gives risk management indications regarding the degree of urgency with which measures are required.

Seite 2 von 58
www.bfr.bund.de
Bundesinstitut für Risikobewertung
BfR Risk Profile:
Arsenic in Rice and Rice Products (Opinion No.18/2015)
A Affected group(s) 1. Children
2. General public
B Likelihood of a health impairment
Practically ex-cluded
Unlikely Possible Likely Assured
C Severity of the health impairment
No impairment Slight impairment
[reversible/irreversible] Moderate impairment
[reversible/irreversible] Severe impairment
irreversible
D Reliability of available data
High: The most important data are
available and consistent
Moderate: Several important data are
missing or inconsistent
Low: Numerous important data are
missing or inconsistent
E Controllability by con-sumers
Control not necessary Controllable through
precautions Controllable through
avoidance Not controllable
Explanations The purpose of the risk profile is to visualise the risk outlined in the BfR opinion and not to make risk comparisons. The risk profile should only be read in combination with the opinion. B: The carcinogenic mechanism of inorganic arsenic has not been fully clarified yet. From the knowledge of the carcinogenic mechanism and epidemiological data known to date, no intake quantity can be derived which does not involve an increase in the risk of cancer. Exposure to inor-ganic arsenic is therefore evaluated in such a way that even the smallest quantities can increase the risk of contracting certain cancers and that the ALARA principle should be applied. E: As consumers cannot recognise the levels of inorganic arsenic in rice or rice products, they cannot control them either. They can reduce their intake of arsenic through rice and rice products, however, by varying their consumption of cereal types and products (reduction of the rice percent-age).
1 Object of the Assessment The Federal Ministry of Food and Agriculture (BMEL) commissioned the German Federal Institute for Risk Assessment (BfR) with a health assessment of the occurrence of arsenic in rice and rice products. In doing so, a report from the Bavarian State Office for Health and Food Safety (LGL) on the same topic was to be given special consideration. The LGL report (hereinafter referred to as LGL 2012) assesses the test results of inorganic arsenic in 80 samples of rice grains and 86 samples of rice products (in particular rice cakes). For its assessment, the BfR took into account other data provided by the Federal Office of Food Safety (BVL) on levels of inorganic and organic arsenic in rice and rice products as well as in other foods. This involves a total of 62,552 data records on arsenic levels in food2 (33,664 data records from tests conducted in the years 2000–2005 and 28,888 from the years 2006–2012). On the basis of information conveyed by the Max Rubner Institute (MRI) on the German Food Code and Nutrient Database (BLS code) of puffed rice and rice cakes in German Nutrition Study II (NVS II), the consumption data for rice cakes and puffed rice were determined and defined more closely. These data were incorporated in the exposure estimation. An exposure estimation was also made for rice-based baby food. To do so, the data measured by the LGL for creamed rice and rice flakes were taken into account. This
2 Number of samples without data cleansing

Seite 3 von 58
www.bfr.bund.de
Bundesinstitut für Risikobewertung
version of the opinion also pays due consideration to new findings on the exposure of the European population to inorganic arsenic (EFSA 2014). 2 Result The intake of inorganic arsenic through the consumption of rice and rice products was as-sessed with regard to health in this opinion. According to the model for long-term exposure, health impairments in the form of non-carcinogenic effects caused by the intake of inorganic arsenic purely through the consump-tion of rice and rice products are unlikely for the population groups observed here. Health impairments through the intake of inorganic arsenic due to high consumption of rice and rice products over a short period are also unlikely according to this exposure model. No safe intake quantity which cannot be associated with an increase in the risk of cancer can be given for the carcinogenic effect of inorganic arsenic. Health risks with regard to the car-cinogenic effects of the intake of inorganic arsenic due to the consumption of rice and rice products are therefore possible. Where the intake quantities of inorganic arsenic through the consumption of rice and rice products are concerned, comparatively low MOE values result for adults and children (MOE values for children with average consumption quantities 9 to 500, with high consumption quantities [P95] MOE values 2 to 143; for adults with average consumption quantities MOE values 37 to 1,000 and with high consumption quantities MOE values 12 to 320). The low MOE values show that only a small margin exists between the intake quantity of inorganic arsenic caused by the consumption of rice and rice products estimated in the ex-posure model and the toxicological reference values (0.3 to 8 µg/kg b.w. per day) derived from epidemiological studies on the correlation between exposure to inorganic arsenic in drinking water and adverse effects. According to the exposure model on hand, the consump-tion of rice and rice products leads to intake quantities which have a comparatively low mar-gin relative to the intake quantities for which an association with an additional risk of lung cancer through the intake of inorganic arsenic with drinking water was observed in epidemio-logical studies. Comparatively low MOE values for the intake quantities of inorganic arsenic resulting purely from the long-term consumption of certain rice products also result for individual population groups. From the low MOE values, a high priority results to reduce the exposure of consumers of all age groups to inorganic arsenic. The BfR recommends that possibilities to reduce exposure to inorganic arsenic through the consumption of rice and rice products be reviewed for consumers in all age groups. In the view of the BfR, the reasons for the higher levels of inorganic arsenic in certain rice products in relation to grains of rice should be clarified. The BfR also recommends an update of the consumption data for rice products. From the latest EFSA opinion (2014) on exposure to inorganic arsenic through the consump-tion of food, it is apparent that where the European population is concerned, foods with sig-nificantly lower levels of inorganic arsenic compared to rice could make the biggest contribu-

Seite 4 von 58
www.bfr.bund.de
Bundesinstitut für Risikobewertung
tion towards exposure to inorganic arsenic due to the high quantities consumed. With babies, for example, milk, dairy produce (but not breast milk), drinking water and baby food are the main sources of exposure to inorganic arsenic. With the other age groups, non-rice-based cereal products (mainly wheat bread and rolls) are the main source of exposure to inorganic arsenic according to most nutrition studies. Rice, milk, dairy produce and drinking water also make a significant contribution to arsenic intake (EFSA 2014). 3 Reasoning 3.1 Risk assessment 3.1.1 Possible hazard source Arsenic Arsenic (chemical symbol As, CAS Number 7440-38-2, atomic weight 74.92) is a metalloid which occurs naturally in the earth’s crust. In essence, it accompanies sulphidic zinc, lead and copper ores (Marquardt and Schäfer 2004) from which it is released into the environ-ment through natural and anthropogenic processes such as copper and lead production, the metal-consuming industry or through energy acquisition from fossil fuels (EFSA 2009). Arsenic finds its way into soils primarily through phosphatic fertilisers and sewage sludge. The arsenic dissolved in bodies of water can originate from release from sediments as well as from industrial and domestic waste water. Arsenic-rich sediments cause some high con-centrations of arsenic in the groundwater in parts of India and Bangladesh. Arsenic com-pounds are released into the air through forest fires, volcano eruptions and industrial pro-cesses (e.g. coal-fired power stations). Improper handling of waste, such as that from the metal industry, or the incorrect disposal of waste wood which was treated with preservatives containing arsenic, can lead to the in-creased release of arsenic compounds into the local and regional environment. One of the main uses of arsenic compounds used to be as an active substance in wood pre-servatives, fungicides, herbicides and insecticides. Within the EU, Regulation (EC) No. 1907/2006 stipulates that, apart from a few exceptions, arsenic compounds may not be used as substances or components of preparations intended to prevent the growth of microorgan-isms, or for the preservation of wood or treatment of service water. Special applications for elementary arsenic include its use as an anti-friction agent, ammunition alloy and gallium arsenide semiconductor in the electrical industry (EFSA 2009). Arsenic occurs in many different inorganic and organic compounds and in various oxidation states (-3, +3, +5). The majority of the arsenic compounds detected in living creatures and foods contain arsenic in oxidation state +5. Inorganic arsenic occurs in the environment in water, soil and foods pentavalently (as an arsenate [V], As [V], [AsO4]
3−) or trivalently (as an arsenite [III], As [III], [AsO3]3-). In the air,
arsenic occurs mainly in the form of arsenic trioxide (As2O3) (ATSDR 2007). Organic arsenic compounds contain carbon and hydrogen and are formed through the me-tabolism of inorganic arsenic compounds (methylation) and integration into biomolecules. The most important organic arsenic compounds which can be detected in foods are arseno-betaine (the most common arsenic compound in fish and seafood) and arsenosugar (the
Seite 5 von 58
www.bfr.bund.de
Bundesinstitut für Risikobewertung
most common arsenic compound in marine algae). Small quantities of arsenolipids, ar-senocholine and simple methylated arsenic compounds (methylarsonate or monomethylar-sonic acid, dimethylarsinate or dimethylarsinic acid, trimethylarsine oxide and the tetra-methylarsonium ion) can also be detected in foods. In rice, monomethylarsonic acid and di-methylarsinic acid can be detected in addition to inorganic As (III) and As (V) (D’Amato et al. 2004). Rice and rice products Rice (Oryza sativa L.) is a cereal. The main type cultivated Oryza sativa L. is annual and comprises over 10,000 varieties which are categorised into three subspecies: indica (long-grain rice with well-known varieties such as Patna and Basmati), japonica (round-grain rice such as the chalky white grains which are particularly well suited for preparing rice pudding) and javanica (medium-grain rice). The main cultivation areas in the world lie in south-east Asia, with other important areas in the USA and South America (Brazil). In Europe, the largest amount of rice is produced in Italy, followed by the Russian Federation, Spain, Greece, Ukraine and France (FAOSTAT census for 2010). Rice is the staple food for almost two thirds of the world’s population. In several countries of Asia, rice provides 75% of daily calorific intake (FAO 2001 in Roy et al. 2011). Annual per capita consumption in Germany is estimated at 3 to 4 kg (3.9 kg in the years 2002/03, Ternes et al. 2005). Rice in the husk, which is obtained after threshing, is also known as paddy rice. The husked rice kernel (endosperm, germ bud, bran layer), which is also marketed as whole-grain rice3, is usually exported. A further processing stage is the milling (fine grinding4, removal of most of the bran layer and germ bud; with a milling quality of approx. 93%, the product is called “white rice”, with a milling quality of 82–85% “polished rice”). To restrict the loss of vitamins and minerals during milling, the rice is soaked in water before peeling and then treated with hot steam to produce “parboiled” rice. During this process, a proportion of several ingredients migrates from the outer layers to the interior of the grain (Roy et al. 2012; Ternes et al. 2005). Hereinafter, rice of every degree of processing available in the retail sector is lumped togeth-er under the term “rice grains”. Rice varieties defined in the data provided by the BVL as “not specified more precisely”, “round-grain”, “long-grain or “parboiled” rice are subsumed under the term “white rice”. “Brown rice” is the generic term used for rice varieties defined in the data provided by the BVL as “natural”, “whole-grain” or “unmilled” rice. Rice varieties defined in the provided data as “parboiled rice” are either listed separately under this term or, where a separate evaluation is not possible, under the term “white rice”. By means of additional processing stages, various foods are made from rice grains and the components removed from their surface (bran) (Ternes et al. 2005). Rice germ oil (rice bran oil, rice oil) is made from the rice bran. Rice starch is made from broken rice (grains that get broken during processing) and the rice gluten acquired during the process as a byproduct is used as an ingredient in soup seasoning and sodium glutamate production, as well as in an-imal feed. Rice flour consists either of milled broken rice or a mixture of flour from the outer layers of the rice grain (sanding flour) and fine broken grains which are then used in top qual-
3 Whole-grain rice is the name given to rice which is cooked and eaten without being milled and polished in advance. The com-plete rice grain as it exists after threshing is inedible. Other names: peeled rice, brown rice, cargo rice, natural rice. 4 “Milled rice” means here that the rice has had its outer layers removed and not necessarily that it has been processed into flour.

Seite 6 von 58
www.bfr.bund.de
Bundesinstitut für Risikobewertung
ity for products including baby food, but mostly as animal feed. Other rice products used as baby food include rice flakes, for which white or broken rice is compressed into ultra-thin flakes on heated rollers, and rice flour (pregelatinised rice flour) which is broken down in a drum dryer and which, as an instant rice food, is ready to eat without cooking after mixing with liquids. Rice crispies are made from a mash of polished rice and other ingredients which are then dried, conditioned5, rolled and if necessary roasted. To make puffed rice, the rice grains are exposed to a temperature of 220 °C and pressure of 1 MPa, which causes the endosperm to expand quickly and the gelatinising starch to form a foam structure. Rice cakes (also referred to as rice waffles) are made from puffed brown rice and possible other ingredients in a process in which the minerals are retained but some of the vitamins (B vita-mins) are lost (Ternes et al. 2005). 3.1.2 Hazard potential The toxicity of arsenic depends on the type of each chemical compound (e.g. inorganic or organic arsenic, oxidation state), solubility and intake route. Organic arsenic compounds The toxic effects of organic arsenic compounds are different and have to be viewed sepa-rately (EFSA 2009). Generally speaking, organic arsenic compounds are regarded as less toxic compared to inorganic arsenic compounds. Organic arsenic compounds, which enrich themselves in fish and seafood, are primarily arsenobetaine and arsenocholine. These com-pounds are regarded as toxicologically irrelevant (ATSDR 2007, EFSA 2009). The toxicity of other organic arsenic compounds has not been clarified to any great extent and for this rea-son, the toxicological assessments of international organisations (EFSA 2009, WHO/FAO 2011) for arsenic in foods focus on inorganic arsenic compounds. Toxicokinetics of organic arsenic compounds Little is known about the resorption of organic arsenic compounds in humans. There are indi-cations of resorption rates of 75% (dimethylarsinate [DMA] and methylarsonate [MA]), 80% (arsenosugar) and >70% (arsenobetaine) after oral intake (EFSA 2009). In a pig model, 33% of the organic arsenic in rice (dimethylarsinic acid) was bioavailable (Juhasz et al. 2006). Hardly anything is known about the distribution of organic arsenic compounds in human blood and organs and about possible placental transfer. Arsenobetaine is not metabolised in humans, but it is excreted without change. Arsenosugar and arsenolipids, on the other hand, are metabolised to pentavalent dimethylarsinate (DMA) and excreted in urine (FAO/WHO 2011). Compared to other species, including humans, the half-life of DMA in rats is consider-ably longer. DMA is methylated more effectively in rats (ATSDR 2007). Toxic effects of organic arsenic compounds No knowledge is available on the acute toxicity of organic arsenic compounds in humans (EFSA 2009). In animal studies, most organic arsenic compounds including pentavalent methylated metabolites of inorganic arsenic MA (V) and DMA (V) show a lower acute toxicity compared to inorganic arsenic. The trivalent methylated metabolites, however, are more strongly cytotoxic in vitro than inorganic trivalent arsenic (Petrick et al. 2000). Methylarsonite (MA [III]) also shows a high acute toxicity in animal tests (FAO/WHO 2011).
5 Conditioning = to treat with steam
Seite 7 von 58
www.bfr.bund.de
Bundesinstitut für Risikobewertung
The most sensitive effect after the repeated administration of methylarsonate (MA [V]) is diar-rhoea. The most sensitive effect after the repeated administration of dimethylarsinate (DMA [V]) is bladder carcinogenicity in rats (EFSA 2009). The higher sensitivity of rats compared to other species is attributed to a higher metabolism capacity to DMA III and lower elimination (ATSDR 2007, FAO/WHO 2011). In a carcinogenicity study with mice, DMA (V) also increased the incidence of tumours in the lungs. In a study in which mice were given pentavalent (As [V]) and trivalent methylarsonite (MA [III]) in their drinking water, MA (III) in the highest dosage showed a higher potential for the induction of lymphomas (FAO/WHO 2011). DMA (V) and MA (V) were classified as “possibly carcinogenic to humans” (Group 2B) by the International Agency for Research on Cancer (IARC) (IARC 2012). Arsenobetaine and other organic arsenic compounds, which are not me-tabolised in humans, are classified by the IARC as “not classifiable as to their carcinogenicity to humans” (Group 3). A minimal risk level (MRL)6 of 0.02 mg DMA/kg body weight (b.w.) per day was derived for non-carcinogenic effects after chronic oral exposure (ATSDR 2007). MMA (III) and DMA (III) do not induce any point mutations (IARC 2012), but they are capable of triggering chromosomal aberrations. In several test systems, the trivalent organic arsenic compounds have a stronger genotoxic potential than inorganic arsenic compounds (inhibition of nucleotide excision repair in vitro, induction of DNA strand breaks in vitro). In an animal test, DMA (V) induced DNA strand breaks in the lung and aneuploidies in bone marrow (FAO/WHO 2011). Inorganic arsenic compounds Large variabilities exist for inorganic arsenic compounds in the metabolism and in the toxi-cokinetics between different species, populations and individuals (EFSA 2009). For this rea-son, results of animal experiments are not suitable for deriving toxicological limit values for inorganic arsenic when assessing human health risks (ATSDR 2007). Trivalent inorganic arsenic compounds are usually more toxic than pentavalent ones and show great willingness to react with compounds with neighbouring SH groups, thus inhibiting enzymes, for example. As the differences in toxicity are not great, the compounds can be converted into one another in the environment or after being ingested into the body, and analysis in foods and other environmental media does not usually distinguish between the individual compounds, inorganic compounds of different oxidation states are assessed to-gether in this opinion as well as in international evaluations (ATSDR 2007, JECFA 2011, EFSA 2009). Toxicokinetics of inorganic arsenic compounds The bioavailability of inorganic arsenic depends among other things on the solubility of the arsenic compound in question and the matrix in which it occurs. Inorganic arsenic com-pounds which are easily soluble in water are resorbed in the gastrointestinal tract to a con-siderable extent (up to 95%) after oral intake (EFSA 2009). In blood, arsenic is to be found in plasma and in erythrocytes where it binds onto haemoglo-bin (EFSA 2009). In most species, including humans, arsenic is rapidly eliminated from the
6 The Minimal Risk Level (MRL) is an estimated value of daily exposure to a substance which, with a certain duration of expo-sure, does probably not pose any significant risk of adverse health effects in humans (non-carcinogenic effect) (ATSDR 2007)

Seite 8 von 58
www.bfr.bund.de
Bundesinstitut für Risikobewertung
blood. Increased levels are then found in the liver, kidneys, spleen and lungs. An exception to this is rats, in which arsenic also accumulates in erythrocytes (EFSA 2009). After a while, the arsenic shifts to tissue with a high concentration of sulphur-containing proteins and is then detected in many species above all in the hair, nails and skin (EFSA 2009). Arsenic transfers to the placenta but is only excreted in small quantities with milk (EFSA 2009). In the mammalian metabolism, the majority of inorganic arsenic is excreted with the urine in the form of methylated metabolites. Ingested arsenate (V) is initially reduced to more strongly reactive arsenite (III) through glutathione S-transferases, for example. This is followed by oxidative methylation to pentavalent methyl arsonate (MA [V]. This metabolite can in turn be reduced (trivalent methyl arsonite MA [III]) before being oxidatively methylated again to pen-tavalent dimethyl arsinate (DMA [V]). It is not clear whether further reduction to unstable tri-valent dimethyl arsinite (DMA [III]) occurs in humans. In addition to inorganic arsenic, current studies only show pentavalent methylated metabolites (methyl arsonate, MA [V] and dimethyl arsinate, DMA [V]) in the urine and toe nails of people exposed to arsenic (Button et al. 2009). There are great inter- and intraspecific differences in the efficiency with which inor-ganic arsenic compounds are methylated in the mammalian organism. Most test animals methylate arsenic considerably more efficiently than humans do (EFSA 2009). Excretion in most species including humans is primarily in urine, but biliary excretion is predominant in rats. Toxic effects of inorganic arsenic compounds A large number of organ systems can be affected by toxicity after short-term intake (gastroin-testinal tract, cardiovascular system, kidneys, nervous system, respiratory tract, liver, blood and skin). Facial swelling and gastrointestinal disorders have been described as being the most sensitive effects. The Lowest Observable Adverse Effect Level (LOAEL) lies at 0.05 mg/kg b.w. per day (FAO/WHO 2011). A Minimal Risk Level (MRL) of 0.005 mg/kg b.w. per day has been derived for acute and subacute oral7 exposure (up to 14 days) to inor-ganic arsenic in humans (ATSDR 2007)8. With chronic exposure, the skin is the human organ which is most sensitive to the non-carcinogenic effects of inorganic arsenic. Typical dermal effects are hyperkeratosis, especial-ly in the palms of the hands and soles of the feet, and changes to the pigmentation (begin-ning at 0.002 – 0.02 mg As/kg b.w. per day). Damage also occurs to peripheral blood vessels which can lead to acrocyanosis9 and mortification of tissue (gangrene10, blackfoot disease on the south-west coast of Taiwan11). An increased risk of coronary heart disease and diabetes is also described (EFSA 2009). In addition to this, chronic exposure to arsenic can lead to peripheral neuropathy. For the non-carcinogenic effects of inorganic arsenic with chronic oral exposure (>1 year), an MRL of 0.0003 mg/kg b.w. per day was derived based on an NOAEL of 0.0008 mg/kg b.w. per day12 and an uncertainty factor of 3 for intraspecific variability.
7 Other exposure routes (inhalative, dermal) are not described in this opinion. 8 Based on an LOAEL of 0.05 mg arsenic/kg b.w./day for the occurrence of facial swelling and gastrointestinal disorders (skin lesions and neuropathy with several patients too) in persons who had consumed soya sauce containing arsenic (0.1 mg arse-nic/ml) and an uncertainty factor of 10 due to the use of the LOAEL as the starting point for deriving the MRL (ATSDR 2007). Exposure: 3 mg/day, 0.05 mg/kg b.w./day with 55 kg b.w., exposure over 2–3 weeks 9 Blue colouring of body appendages, e.g. fingers, through lack of oxygen 10 Gangrene = tissue necrosis, usually through an inadequate blood supply 11 High levels of humic acids in the water are being discussed as possible causes 12 The MRL value was derived from a study on arsenic intake with drinking water, NOAEL 0.8 µg/kg b.w./day (Tseng 1977 in ATSDR 2007) using an uncertainty factor of 3 for interindividual variability. Intake of arsenic via food was not taken into account. In the epidemiological study conducted in Taiwan upon which the study was based, skin lesions and cases of blackfoot disease occurred with higher estimated intake quantities. 15 to 211 µg/day (mean 61 µg/day) were assumed for arsenic intake via food (ATSDR 2007).

Seite 9 von 58
www.bfr.bund.de
Bundesinstitut für Risikobewertung
Epidemiological tests of the effects of prenatal exposure to arsenic in drinking water for de-velopmental toxicity parameters give indications of a statistically significant, slightly increased risk of miscarriage, lower birth weight, neonatal mortality and deformities. Several studies also give indications of a developmental neurotoxic effect as a result of high postnatal expo-sure. Most of these are cross-sectional studies with low case numbers which do not permit any conclusions regarding the dose-effect relationship (EFSA 2009). Arsenic and inorganic arsenic compounds have been classified by the International Agency for Research on Cancer (IARC) as “carcinogenic to humans” (Group 1) (IARC 2012). Epide-miological studies show an association between the intake of inorganic arsenic compounds with drinking water and an increased risk of cancer of the skin, bladder and lungs. Associa-tions between the intake of arsenic and cancer of the kidneys, liver and prostate gland were also proven (IARC 2012). Inorganic arsenic does not bond covalently to DNA and does not induce any point mutations in the bacterial test system. In mammal cells, inorganic arsenic induces DNA damage in vitro and in vivo which is detected as micronuclei, sister chromatid exchanges, chromosomal ab-errations, aneuploidies and DNA strand breaks. In epidemiological studies too, an increased frequency of micronuclei, chromosomal aberrations and sister chromatid exchanges was observed in peripheral lymphocytes and epithelial cells of oral mucous tissue and the urinary bladder in association with exposure to arsenic through drinking water (EFSA 2009). The EFSA (2009) derived reference values for toxicological assessment for the endpoints skin damage, lung cancer, bladder cancer and skin cancer from epidemiological studies. The lowest BMDL values13 were modelled for the endpoint lung cancer from a case-control study on the increase of the prevalence of lung cancer in the population of Chile with aver-age concentrations of 30–49 µg arsenic/L in drinking water in the years 1930–1994 and higher concentrations compared to 0–10 µg/L (Ferreccio et al. 2000). Based on the average arsenic concentrations in drinking water (1958–1970, the years with the highest concentrations of arsenic in drinking water), the effective dose (ED) which equates to an additional risk of lung cancer of 1% (ED01=17 µg/L for men and 27 µg/L for women) and/or the lower limit of the 95% confidence interval of the ED01 (LED01=14 µg/L for men and 21 µg/L for women) was determined (NRC 2001 in EFSA 2009) and used to model a BMDL01 value in the range from 0.34 to 0.69 µg/kg b.w. per day (EFSA 2009)14. According to the EFSA (2009), the entire range of BMDL01 values derived from epidemiologi-cal studies of 0.3 to 8 µg/kg b.w. per day should be used instead of an individual value for risk characterisation, as each of the studies is fraught with a degree of uncertainty. A BMDL01 of 0.3 µg/kg b.w. per day was also derived from a study on the decrease of birth weight de-pending on the concentration of arsenic in the mother’s urine (Rahman et al. 2009). In a current WHO/FAO statement (2011), a value of 3 µg/kg b.w. per day was modelled as the lowest BMDL0,5
15 from a prospective epidemiological study on the association between the concentration of arsenic in drinking water and the increase in the incidence of lung can- 13 BMDL = Benchmark Dose Lower Confidence Limit; the BMDL01 value equates to the statistical, unilateral lower limit of the 95% confidence interval of the dose or concentration which causes a 1% increase in the frequency and extent of effects. 14 Assumptions for the intake of arsenic through food for study populations in North and South America 10 to 20 µg/day and for the drinking water quantity including cooking water 1 to 2 L per day with an average body weight of 70 kg 15 0.5% increase in the incidence of lung cancer above the background value over an average re-observation period of 11.5 years

Seite 10 von 58
www.bfr.bund.de
Bundesinstitut für Risikobewertung
cer (Chen 2010) based on average assumptions for exposure to arsenic16 (WHO/FAO 2011). The risk characterisation of this health assessment makes exclusive reference to the value range of 0.3 to 8 µg/kg b.w. per day derived by the EFSA (2009). The PTDI value of 2 µg/kg b.w. (FAO/WHO 1983), as well as the PTWI value of 15 µg/kg b.w. (FAO/WHO 1989) used for previous assessments of arsenic in foods does not pay con-sideration to more recent epidemiological data on the carcinogenic effect of inorganic arsenic on the lungs and bladder. As the value lies in the range of the BMDL01 values derived from these data, it is regarded as no longer suitable for assessing the health risks of arsenic (EF-SA 2009, FAO/WHO 2011). Inorganic arsenic is regarded as not directly DNA-reactive (ATSDR 2007, EFSA 2009, FAO/WHO 2011). Various mechanisms are postulated for the carcinogenic effect, for each of which it is assumed that an intake quantity exists below which a carcinogenic effect is not to be assumed (threshold). Due to uncertainties regarding the dose-effect relationship, howev-er, the epidemiological data are not considered suitable to derive an intake quantity in the sense of a TDI which is not associated to any appreciable health risk. For this reason, the risk characterisation should be based on the Margin of Exposure (MOE)17 between the refer-ence points identified from the epidemiological data and the exposure within the population (EFSA 2009). 3.1.3 Exposure Food and drinking water are the main source of human exposure to arsenic (ATSDR 2007). Meharg (2004 in Juhasz 2006) estimates that rice consumption in Bangladesh accounts for 60% of the intake of arsenic through food. Fish, seafood and algae can contain high concen-trations of total arsenic, although most of these are organic arsenic compounds which are less relevant from a toxicological point of view. Most terrestrial foods, on the other hand, con-tain low concentrations of total arsenic with a relatively high proportion of inorganic arsenic. Almost all of the total arsenic in drinking water is inorganic (EFSA 2009, 2014), whereas in-organic as well as organic arsenic compounds occur in varying proportions in rice (e.g. dime-thyl arsenic acid and monomethyl arsenic acid in arborio rice; D’Amato et al. 2004).18 The following food categories were included in the EFSA exposure estimate for inorganic arsenic (2014): cereals and cereal products, vegetables and vegetable products, starchy roots and tubers, nuts, oilseed and legumes, fruit and fruit products, meat and meat prod-ucts, fish and seafood, milk and dairy products, eggs and egg products, sugar and confec-tionery, vegetable and animal fats and oils, fruit and vegetable juices; alcoholic and non-alcoholic beverages, drinking water; herbs and spices, foods for babies and infants, products for special nutritional purposes, compound foods and snacks and desserts.
16 Assumption of an intake of 75 µg arsenic/day through food, excluding drinking water, and 3 litres of drinking water per day including cooking water with an average body weight of 55 kg for the study population in north-eastern Taiwan. Based on a range of assumptions for the intake of arsenic via food of 50 to 200 µg/day and drinking water consumption of 2 to 4 litres per day including cooking water, BMDL0,5 values of 2 to 7 µg/kg b.w. per day were modelled for people with an average body weight of 55 kg. 17 MOE concept; as a dimensionless number, the Margin of Exposure (MOE) gives the ratio between a defined point on the dose-effects curve for an adverse effect of a substance and the modelled exposure for certain population groups. The MOE does not imply any statements on a “safe” intake quantity in the sense of a tolerable daily intake quantity (Alexander et al. 2012). 18 The concentrations of arsenic in groundwater usually lie below 10 µg/L, but they can reach up to 5,000 µg/L in several regions (EFSA 2009). Surface water generally contains lower levels of arsenic than groundwater.

Seite 11 von 58
www.bfr.bund.de
Bundesinstitut für Risikobewertung
The updated intake estimated by the EFSA (2014) for inorganic arsenic from all foods amounts to 0.11 to 0.38 µg/kg b.w. per day (min LB to max UB19) for adults aged up to 65 years with average consumption quantities, and 0.18 to 0.64 µg/kg b.w. per day (min LB to max UB) with high consumption quantities (P 95), thus leading to considerably lower esti-mate values compared to 2009. The results of the exposure estimate for children are also lower in the latest study. Accordingly, children from infancy to an age of ten years ingest 0.20 to 1.37 µg/kg b.w. per day (min LB to max UB) with average consumption quantities and 0.36 to 2.09 µg/kg b.w. per day (min LB to max UB) with high consumption quantities (P 95). A less aggregated food classification was used in the latest exposure estimate. By doing so, it was possible to better match the classification of the foods with regard to the data on concentrations and consumption compared to the exposure estimate from 2009. It was also possible to include a larger number of measured data on levels of inorganic arsenic. The more nuanced exposure estimate made by the EFSA (2014) makes it clear that expo-sure to inorganic arsenic is not only lower than is assumed in the opinion of 2009 but also that in addition to rice, it is spread over several much-consumed foods which show relatively low levels. Rice is seen in several publications as the main source of exposure for the intake of inorgan-ic arsenic with food if no drinking water with high arsenic levels is consumed (e.g. Zhu et al. 2008). It becomes apparent from the EFSA opinion on exposure to inorganic arsenic through food, however, that other foods with significantly lower levels of inorganic arsenic compared to rice could make the biggest contribution to the exposure of the European population due to the large quantities consumed. The biggest contributions to the exposure of infants to in-organic arsenic were made by milk and dairy products (19–36%), drinking water (16–33%) and baby food (13–31%). With the remaining age groups, most nutrition studies show that non-rice-based cereal prod-ucts (mainly wheat bread and rolls) make the biggest contribution towards exposure to inor-ganic arsenic. Rice, milk and dairy produce and drinking water also play a major role (EFSA 2014). Rice has a share of 4–5% in the total exposure of infants to inorganic arsenic and of 0.3 to 16% in all other age groups. These percentages are calculated from exposure estimates which are based on MB values for the levels of inorganic arsenic in food. Based on LB val-ues, a much higher percentage of total exposure to inorganic arsenic results for rice in all age groups due to the relatively large number of values below the quantification or detection limit with other foods. For adults, rice is the biggest or second biggest exposure source of inorganic arsenic according to several consumption studies (EFSA 2014). The extent of the levels of arsenic in rice depends on several factors. In addition to the arse-nic level in the soil, other soil factors, such as the levels of other minerals it contains, also have an influence on the arsenic intake of the rice plant (Bogdan und Schenk 2009). The irrigation technology also has a decisive effect on the arsenic levels in rice (Spanu et al. 2012). Differences exist too in the intake of arsenic and its distribution to various plant organs in different rice varieties (Ye et al. 2012). The preparation of the food and in particular the arsenic level in the water used for cooking have a great influence here too. Almost all of the arsenic that exists in the cooking water is
19 Lower bound (LB) = the value 0 is assumed for all values below the limit of detection/quantification; upper bound (UB) = the limit of detection/quantification is taken as the value for all values below the limit of detection/quantification
Seite 12 von 58
www.bfr.bund.de
Bundesinstitut für Risikobewertung
absorbed by the rice during cooking (8913%) (Torres-Escribano et al. 2008). Conversely, preparation in water that does not contain any arsenic (<0,003 mg/l) can reduce the arsenic levels in the prepared rice by up to 75% compared to raw rice if the rice is washed before cooking, boiled in water in a ratio of 1:6 and the cooking water is disposed of after boiling (Sengupta et al. 2006). The available consumption and concentration data do not allow cooking habits to be taken into consideration in exposure modelling. The corresponding concentration data could be collected within a total diet study. 3.1.3.1 Base data 3.1.3.1.1 Consumption studies National Consumption Study II The National Consumption Study II (NVS II) of the Max Rubner Institute (MRI) provided the data base regarding the consumption of rice and rice products among adolescents and adults. The NVS II is the current representative study on the consumption behaviour of the German population. The study, in the scope of which approximately 20,000 people aged be-tween 14 and 80 were asked about their dietary habits using three different survey methods (dietary history, 24-hour recall and weight log), took place between 2005 and 2006 through-out Germany (MRI 2008). The consumption evaluations are based on the data from the “Dietary history” interviews of the NVS II, which were collected by means of the “DISHES 05” program. With the “Dietary history” method, 15,371 people were surveyed and their usual consumption over the past four weeks was recorded retrospectively. This method provides good estimates of the long-term consumption of substances when food items are grouped into categories or food items that are consumed regularly are considered. Due to the survey period of four weeks and the limited accuracy in terms of the individual food items included, the intake levels may be un-derestimated when all respondents are considered for food items that are consumed only sporadically and do not form part of the daily diet. The evaluations are also based on the data of the two independent 24-hour recalls of the NVS II, which were collected in a computer-aided interview by means of “EPIC-SOFT” (MRI 2008, Krems et al. 2006). Data from 13,926 people who completed both interviews were evaluated. Because consumption information for individual days is available, the 24-hour recall method is suitable for exposure estimates for both acute and chronic risks. EsKiMo study The EsKiMo (Eating Study as a KiGGS Module) was conducted by the Robert Koch Institute and the University of Paderborn as part of KiGGS, the National Health Survey for Children and Adolescents, and financed by the Federal Ministry of Food, Agriculture and Consumer Protection. The EsKiMo study was conducted in 2006 with approximately 2,400 children and adolescents aged between 6 and 11 years throughout all of Germany. Two methods were used for data collection. With the help of their parents, the children filled out a food diary for three randomly selected consecutive days. In this diary, they wrote down all food items they had consumed and in which quantities, along with details on preparation etc. The 12 to 17 year-olds took part in a “Dietary history” interview, conducted using the “DISHES” program, in which they were asked about their usual consumption over the past four weeks. In addi-

Seite 13 von 58
www.bfr.bund.de
Bundesinstitut für Risikobewertung
tion, they filled out a questionnaire on food consumption frequency (Mensink et al. 2007). The method used for the 12 to 17 year-olds provides good estimates for the long-term intake of substances when food items are grouped into general categories or food items that are consumed regularly are considered. Because consumption information is available for indi-vidual days, the method used for the 6 to 11 year-olds is suitable for exposure estimates for both acute and chronic risks. VELS study Consumption data from the VELS study (Heseker et al. 2003; Banasiak et al. 2005) were used as base data on the consumption of rice and rice products for children under 6 years old. This study was conducted between 2001 and 2002 on 816 infants and toddlers aged between 6 months and 5 years throughout all of Germany. The parents kept two three-day logs on all food items consumed for each child. Because consumption information is availa-ble for individual days, the two three-day logs are suitable for exposure estimates for both acute and chronic risks. 3.1.3.1.2 Base data on the levels of inorganic arsenic and total arsenic in rice and rice products Data from food monitoring, provided by the Federal Office of Consumer Protection and Food Safety (BVL) Due to the order to evaluate arsenic in rice and rice cakes, the BfR requested that the BVL pass on data on total arsenic and inorganic arsenic. The BVL provided a total of 62,552 data sets20 (33,664 from 2000–2005, 28,888 from 2006–2012 on inorganic and total arsenic in all food items). Following a request to the BVL, data from 1,989 samples with information on arsenic levels in rice from the period between 2000 and 2012 and 298 samples with levels of inorganic arsenic in rice and rice products (all from 2010-2011) were provided to the BfR in September 2012. The data were collected either within the scope of specific evaluation pro-grammes such as food monitoring and the federal control plan or within the scope of routine monitoring. For this reason, representative sampling cannot generally be assumed. Data from food monitoring, provided by the Bavarian Health and Food Safety Authority In 2010 and 2011, the Bavarian Health and Food Safety Authority (LGL) tested grains of rice and rice products for inorganic arsenic (LGL 2012). The LGL kindly made the data from the analyses (80 rice grain samples, 86 rice product samples) available to the BfR for this opin-ion. Data from ÖKO-TEST 06/2012 In its June 2012 edition, the ÖKO-TEST magazine tested rice cakes (n=20) from different manufacturers for inorganic arsenic, among other substances. The BfR has access to these analysis results only in published form, not as individual data. 3.1.3.2 Methods
20 Sample numbers without data cleansing
Seite 14 von 58
www.bfr.bund.de
Bundesinstitut für Risikobewertung
Evaluation is carried out in each case with SPSS 12.0 and Microsoft Excel 2003. The 95% confidence interval calculated by means of the SPSS procedure “Examine” was used for the significance test of the mean values. 3.1.3.3 Results on the levels of inorganic arsenic in rice and rice products and on the con-sumption of rice and rice products 3.1.3.3.1 Data on occurrence Levels of arsenic, inorganic Data from food monitoring, provided by the Federal Office of Food Safety and Consumer Protection 621 analysis results in which inorganic arsenic was measured in food are available. Of these, 261 results are for rice and 37 for rice products (the latter were only measured after 2010). The tested rice products are: 14x rice pudding from 2010, 1x puffed rice from 2011 and 22x various products for infants and toddlers (cereal-based food, gluten-free cereal porridge and baby meals) from 2010/2011 for which it is unclear whether they contained rice. No data on inorganic arsenic in rice cakes were provided. First, the evaluations were carried out based on the detailed matrix codes specified for the provided data. This resulted in low numbers of samples for the various tested categories of grains of rice (e.g. long-grain rice, round-grain rice, brown rice) and different rice products. The measured values were summarised into the following groups (Table 1): Grains of rice The separate analysis of data on occurrence for rice without information on preparation di-vided into rice (not specified further), round-grain rice and long-grain rice did not show any differences in terms of the mean levels of inorganic arsenic, so these categories were com-bined into the single group “white rice”. Brown rice and parboiled rice were each considered as a separate group (Table 1). Broken rice was not included in the exposure estimate due to the low sample numbers (3 samples) and the low relevance (it is not consumed on its own, but primarily used in rice products). Rice pudding No differences in terms of the levels of inorganic arsenic were detected in the different sam-ples from rice pudding21, so they were combined into one group “rice pudding” because of the low sample numbers. Furthermore, these 14 measured values for rice pudding were all below the detection limit of 0.02 mg/kg. In Table 1, LB and UB are specified for rice pudding, as for the other food groups. In the exposure estimate, the value of 0.02 mg/kg (UB) was entered as the value of the level of inorganic arsenic in rice pudding (Table 18). Gluten-free cereal porridge
21 This refers to ready-to-eat rice pudding offered for retail sale (cooked, flavoured rice pudding, cooked rice pudding with cin-namon and cooked rice pudding with chocolate sauce)

Seite 15 von 58
www.bfr.bund.de
Bundesinstitut für Risikobewertung
From the food items for infants and toddlers, the gluten-free cereal porridge products were combined into a group. The data on occurrence relate to the dried product and not the pre-pared, ready-to-eat product. These data were shown in Table 1 but could not be included in the exposure estimate because no information was available on whether and to what extent the products contained rice. Data on the levels in cereal-based foods (n=3) and infant meals (n=6) were not included in the evaluation because no information was available on whether these contained rice. Puffed rice A relatively high level of inorganic arsenic was determined for puffed rice (0.16 mg/kg). How-ever, because only a single value was available here, this content value was not included in the exposure estimate. The evaluation of the data on levels in puffed rice provided by the LGL described below did not confirm this high value. Other aspects of data preparation No differences depending on the analytical method used were detected for any of the ana-lysed rice types or rice products in terms of the mean levels. Data on occurrence for 20 samples for which a detection limit of >0.1 mg/kg (detection limit was 0.2 mg/kg) was specified were removed from the valid data set (15x grains of rice, 5x parboiled rice). Different methods of handling values under the detection or quantification limit changed the results by up to 20% for the data provided. The greatest difference was evident in the white rice group, with a deviation of 23% between lower bound (LB = the value 0 is assumed for all values below the detection or quantification limit) and upper bound (UB = the detection or quantification limit is taken as the value for all values below the detection or quantification limit). To take this degree of uncertainty into account, data evaluation was carried out for LB and UB assumptions. The measurements for inorganic arsenic in rice and rice products all come from the year 2010 or 2011, and no significant differences are evident between the two years. Table 1: Levels of inorganic arsenic in rice, data from food monitoring in the years 2010 and 2011, mg/kg
N LB UB
White rice* 190 0.070 0.086
Brown rice** 10 0.089 0.099
Rice, parboiled 38 0.080 0.097
Rice pudding 14 0.000 0.020
Gluten-free cereal porridge 13 0.119 0.122 * Without information on preparation; rice (not specified further), round-grain rice, long-grain rice are summarised into this group ** Referred to as “rice, unmilled” in the data transfer LB: lower bound UB: upper bound N: Number of analysis results
Insufficient information was available to allow a differentiated evaluation of data on occur-rence in relation to origin. For example, only three samples with the information “Origin USA” were available. Rice from Italy contained slightly higher levels of inorganic arsenic than rice

Seite 16 von 58
www.bfr.bund.de
Bundesinstitut für Risikobewertung
from Germany22, other EU countries and Asia. However, the differences were not statistically significant. The values in rice from Asia were marginally lower than those in rice from Ger-many and other EU countries, but these differences were also not statistically significant. Data from food monitoring, provided by the LGL The analysis results of the LGL were summarised according to the food groups shown in Table 2. Table 2: Number of analysed samples of the LGL (2012) per food group
Grains of rice 74
Grains of rice (other than those listed below)* 24
Long-grain rice, parboiled 4
Long-grain rice, without information on parboiling 40
Boil-in-bag rice 6
Brown rice ** 6
Rice cakes 51
Instant rice-based baby food*** 25
Snacks with rice (sweet/savoury) 10
Puffed rice 3
Chocolate rice 4
Rice crackers 3 * Without information on preparation; rice (nsf = not specified further), sticky rice, basmati rice, jasmine rice, oryza, round-grain rice, golden rice and mountain rice are grouped together here ** Designated as “natural or whole-grain rice” in the data transferred by the LGL *** Transferred as creamed rice, rice flakes
With respect to the mean levels of inorganic arsenic, slight differences were evident between grains of rice, long-grain rice (parboiled or no information on parboiling) and boil-in-bag rice, although these were not statistically significant. This could be due to the low number of sam-ples in some food categories. For this reason, these categories are grouped together in fur-ther tables. Brown rice contained higher mean values as compared to the other “Grains of rice” categories. However, this difference is not statistically significant, which could also be due to low numbers of samples. Nevertheless, the data on the level of inorganic arsenic in brown rice are shown separately. The mean value of inorganic arsenic levels in rice cakes is higher than that of grains of rice and all other rice products, and this difference is statistically significant. The second highest level of inorganic arsenic was detected for the category of instant rice-based baby food. The difference was statistically significant in relation to the other rice products and grains of rice, but not statistically significant for brown rice.
22 Information on the origin “Germany” of the samples was taken from the data transferred by the monitoring bodies. No infor-mation on the area of cultivation was available.

Seite 17 von 58
www.bfr.bund.de
Bundesinstitut für Risikobewertung
Table 3: Mean and high levels of inorganic arsenic in rice and rice products, data from the LGL from the years 2010–2011, mg/kg (LGL 2012)
Valid N Mean value 95th percentile
Total 166 0.161 0.312 White rice (long-grain rice, parboiled; long-grain rice, no information on parboiling; boil-in-bag rice)
74 0.101 0.200
Brown rice** 6 0.141 0.231*
Rice cakes 51 0.260 0.425
Instant rice-based baby food **** 25 0.187 0.309
Snacks with rice (sweet/savoury)*** 10 0.053 0.107* * Skewed towards maximum due to low number of samples ** Designated as “Natural or whole-grain rice” in the data transferred by the LGL *** Designated as puffed rice, chocolate rice and rice crackers in the data transferred by the LGL **** Designated as creamed rice, rice flakes in the data transferred by the LGL
Lower levels of inorganic arsenic were detected for the group “Snacks with rice, sweet/savoury” (puffed rice, chocolate rice and rice crackers) than for the other evaluated groups. At 0.050 mg/kg, the mean level of the three samples of puffed rice was considerably lower than the level of the BVL’s single sample (0.16 mg/kg). Data from ÖKO-TEST 6/2012 The information from the publication of an investigation on levels of various contaminants (including inorganic arsenic) in rice cakes is not available as individual measured values. Instead, statements are made on the concentration range in which the levels in the tested products lie. These are displayed for inorganic arsenic in Table 4 and compared to the data from the LGL grouped according to the same criteria. Table 4: Comparison of the tests of rice cakes for inorganic arsenic from ÖKO-TEST 06/2012 and LGL (2012)
ÖKO-TEST 06/2012 LGL, 2010–2011
[mg/kg] Frequency Percent Frequency Percent
0–0.05 0 0% 0 0%
0.05–0.10 1 5% 4 8%
0.10–0.20 11 55% 7 14%
>0.20 8 40% 40 78%
From this table, it is evident that the levels of inorganic arsenic in rice cakes reported by the LGL are higher than those published by the ÖKO-TEST magazine. In both random samples, levels of at least 0.05 mg/kg were detected in all products. For both data sources, the lowest percentage of samples was in the group 0.05–0.10 mg/kg (“slightly elevated” according to ÖKO-TEST classification), with 5% in the case of ÖKO-TEST and 8% in the case of LGL. The test series differed in terms of the ratio of distribution of the levels to the categories >0.20 mg/kg and 0.10–0.20 mg/kg. In the case of ÖKO-TEST, more samples are in the group with low values (55% as compared to 40%); in the case of LGL, 78% of the samples are assigned to the group with values greater than 0.20 mg/kg and only 14% to the group 0.10–0.20 mg/kg.

Seite 18 von 58
www.bfr.bund.de
Bundesinstitut für Risikobewertung
Levels of total arsenic 1,691 analysis results from 2000–2012 were provided on levels of total arsenic in rice and products that may contain rice. 131 of these samples were excluded because they did not belong to the food group being considered. The remaining 1,560 analysis results will be ex-amined below. First, evaluations were carried out based on the detailed matrix codes for the individual ana-lysed food items specified with the transferred data. To avoid sample numbers that were too low, the following food groups were formed: White rice A differentiation of the analysis results for white rice according to long-grain rice, round-grain rice and parboiled rice is possible. The initial separate evaluation of the levels in long-grain rice (n=298) (0.149 mg/kg), round-grain rice (n=74) (0.153 mg/kg), parboiled rice (n=153) (0.157 mg/kg) and wild rice (n=18) (0.145 mg/kg) did not show any significant differences in the mean levels of total arsenic, so these were summarised into a group “white rice” (nto-
tal=1,032) together with rice that was not specified further (n=489) (0.131 mg/kg). Mean levels in this group were between 0.14 (LB) and 0.144 (UB) mg total arsenic/kg (Table 5). Due to the low number of analysed samples (n=18, mean level of total arsenic 0.145 mg/kg) and the low relevance (it is not consumed on its own, but primarily used in rice products), broken rice is not included in the exposure estimate. Brown rice No information on the degree of processing was available for approximately 75% of the sam-ples. Data on occurrence for 75 samples could be assigned to the “brown rice”23 group (Ta-ble 5). In the remaining samples, higher mean levels of total arsenic were detected for brown rice as compared to white rice. There was a sufficient number of samples for measurements of total arsenic in brown rice to allow this to be considered separately from white rice in the exposure estimate. Rice pudding The levels of total arsenic in the different sorts of rice pudding24 (n=21) that were analysed did not show a large variance and were therefore summarised into the group “rice pudding” for the exposure estimate. The mean values of the levels of total arsenic were between 0.002 (LB) and 0.046 (UB) mg/kg (Table 5). For rice pudding, 19 of the 21 available analysis results were below the quantification limit; a factor between LB and UB of almost 20 was derived from this. To take this degree of uncertainty into account, the exposure estimate was carried out for assumptions according to LB and UB, as for the other food groups.
23 Reported as “unmilled rice” in the transferred data 24 This refers to ready-to-eat rice pudding offered for retail sale (cooked, flavoured rice pudding, cooked rice pudding with cin-namon, with fruit and cooked rice pudding with chocolate sauce).
Seite 19 von 58
www.bfr.bund.de
Bundesinstitut für Risikobewertung
Cereal porridges for infants and toddlers Cereal porridges for infants and toddlers were first evaluated separately as gluten-free (n=75) and not gluten-free (n=123). However, no relevant differences were evident in terms of the mean levels of total arsenic (mean levels in gluten-free porridges: 0.061 mg/kg; other porridges: 0.060 mg/kg; 95th percentile of levels in gluten-free porridges: 0.200 mg/kg, other porridges: 0.217 mg/kg). The information on occurrence refers to the cereal powder in each case, not to the prepared product ready for consumption. The data on occurrence of this product group could not be included in the exposure estimate because no information was available on whether and to which extent the products contained rice. Instant rice-based baby food The data on occurrence of rice semolina (n=2, total arsenic 0.160 mg/kg) and rice flakes (n=3, total arsenic 0.205 mg/kg) were used for the exposure estimate of instant rice-based baby food (Table 5). The resulting mean value should be considered uncertain due to the low number of samples in this product group (n=5). The mean level of total arsenic in rice semo-lina and rice flakes of 0.187 mg/kg is comparable with the mean level of inorganic arsenic in creamed rice and rice flakes of the LGL (0.187 mg/kg, n=25). Snacks with rice Data on occurrence of puffed rice and flaked rice were combined in the “Snacks with rice” group (Table 5). A mean level of total arsenic of 0.93 mg/kg was determined for puffed rice (n=3). An analysis result for the level of total arsenic of 0.63 mg/kg was available for flaked rice (n=1) (Table 5). Rice flour At 0.120 mg/kg, the mean levels of total arsenic in rice flour were below the mean levels for white rice. Due to the low number of analysis results (n=4), the value for the level of total arsenic in white rice was used instead of this value. This should be viewed as a conservative approach which, due to the low consumption levels of rice flour, will only have negligible ef-fects on the estimation of the intake of arsenic through the consumption of rice and rice products. Rice starch No measurements of total arsenic levels in rice starch were available to the BfR. As with rice flour, the levels in white rice were used for the exposure estimate. For the following food items, only a small number of analysis results were available; these were not included in the exposure estimate because they could not be reasonably assigned to a group, no consumption data were available, and/or it was not clear whether and to which extent the relevant product contained rice:

Seite 20 von 58
www.bfr.bund.de
Bundesinstitut für Risikobewertung
“Muesli bars/bites” (n=137, total arsenic 0.006 to 0.18 mg/kg), “Cereal bars” (n=18, total arsenic 0.008 to 0.02 mg/kg), “Rice pudding, dessert powder” (n=1, total arsenic 0.025 mg/kg), Chocolate with addition of other foods (n=12, total arsenic 0.02 to 0.03 mg/kg)25 Rice noodles (n=8, total arsenic 0.064 mg/kg) 21 analysis results (of which: 8x rice, nsf; 5x rice, parboiled rice; 6x long-grain rice; 1x round-grain rice; 1x broken rice) with a detection limit of 0.2 mg/kg were excluded based on the criteria in the EFSA opinion (2009). Six analysis results were excluded due to the specified reason for sampling. Five of these samples were in a range below the detection limit up to 0.04 mg/kg (1x rice nsf, 3x cereal porridges for babies and toddlers, 1x cereal bars/muesli bars) and one sample of long-grain rice contained 0.21 mg/kg. An outlier with a level of 15.1 mg/kg was clearly due to a transfer or calculation error because the value in the “Standard measured value” column cannot be derived from the results of the other columns and the sample was not rejected. The value was reset to the value of 0.10 mg/kg in the “MESSERG_NUM” column, in line with the other samples from the same moni-toring body in the same year with the same reason for sampling and the same matrix. Handling values below the detection or quantification limit Because the percentage of values below the detection or quantification limit was low as compared to the values that could be quantified, the handling of values below this limit is irrelevant for white rice and brown rice, but did have a considerable effect on the evaluation of the mean levels in cereal porridges (deviation 51%), “Snacks with rice” (deviation 34%) and rice pudding. The specified deviation percentages resulted between lower bound (LB = the value 0 is assumed for all values below the detection or quantification limit) and upper bound (UB = the detection or quantification limit is taken as the value for all values below the detection or quantification limit). In the case of rice semolina and rice flakes, all values were above the detection or quantification limit, so LB and UB match.
25 At 0.028 mg/kg (values under the detection or quantification limit set to half of the detection or quantification limit), the mean level of total arsenic in the twelve samples “440102 Chocolate with additions from other foods” was below the value for choco-late of 0.039 mg/kg (BVL Volume of Tables 2002) measured during food monitoring in 2002. Overall, the range of measured values from 0.02–0.03 mg/kg is below the 90th percentile of 0.07 mg/kg of values from food monitoring in the year 2002.
Seite 21 von 58
www.bfr.bund.de
Bundesinstitut für Risikobewertung
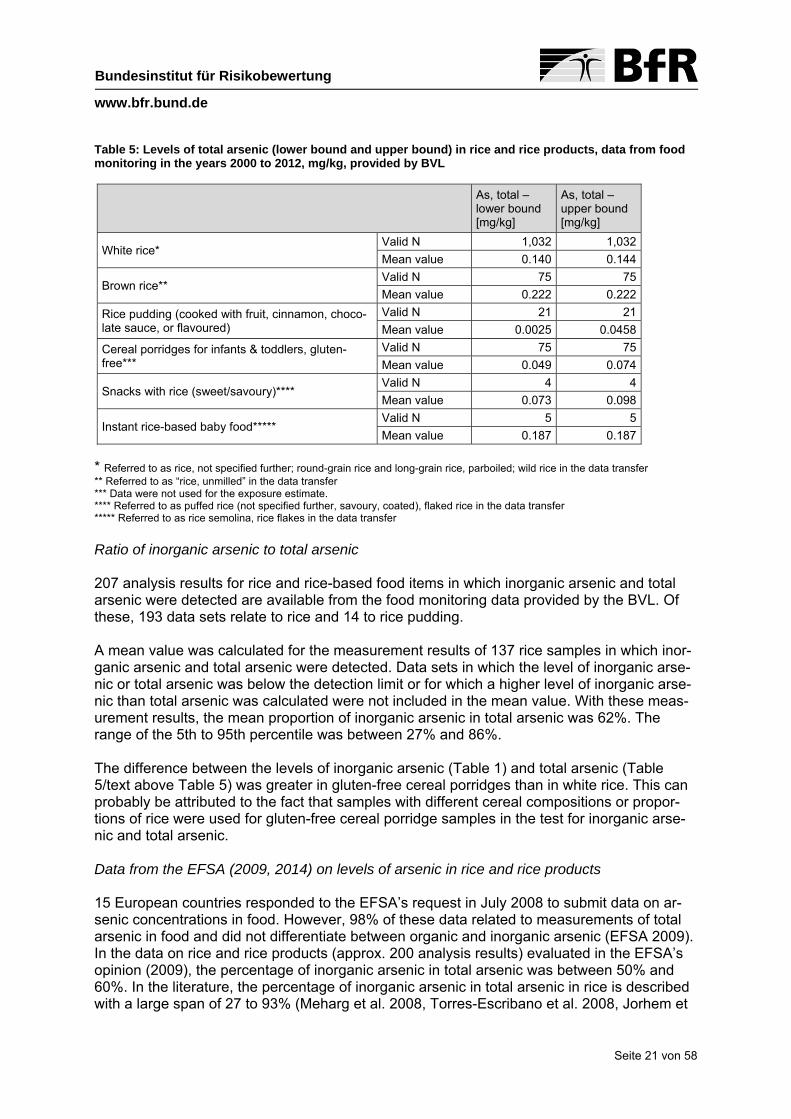
Table 5: Levels of total arsenic (lower bound and upper bound) in rice and rice products, data from food monitoring in the years 2000 to 2012, mg/kg, provided by BVL
As, total – lower bound [mg/kg]
As, total – upper bound [mg/kg]
White rice* Valid N 1,032 1,032
Mean value 0.140 0.144
Brown rice** Valid N 75 75
Mean value 0.222 0.222
Rice pudding (cooked with fruit, cinnamon, choco-late sauce, or flavoured)
Valid N 21 21
Mean value 0.0025 0.0458
Cereal porridges for infants & toddlers, gluten-free***
Valid N 75 75
Mean value 0.049 0.074
Snacks with rice (sweet/savoury)**** Valid N 4 4
Mean value 0.073 0.098
Instant rice-based baby food***** Valid N 5 5
Mean value 0.187 0.187 * Referred to as rice, not specified further; round-grain rice and long-grain rice, parboiled; wild rice in the data transfer ** Referred to as “rice, unmilled” in the data transfer *** Data were not used for the exposure estimate. **** Referred to as puffed rice (not specified further, savoury, coated), flaked rice in the data transfer ***** Referred to as rice semolina, rice flakes in the data transfer
Ratio of inorganic arsenic to total arsenic 207 analysis results for rice and rice-based food items in which inorganic arsenic and total arsenic were detected are available from the food monitoring data provided by the BVL. Of these, 193 data sets relate to rice and 14 to rice pudding. A mean value was calculated for the measurement results of 137 rice samples in which inor-ganic arsenic and total arsenic were detected. Data sets in which the level of inorganic arse-nic or total arsenic was below the detection limit or for which a higher level of inorganic arse-nic than total arsenic was calculated were not included in the mean value. With these meas-urement results, the mean proportion of inorganic arsenic in total arsenic was 62%. The range of the 5th to 95th percentile was between 27% and 86%. The difference between the levels of inorganic arsenic (Table 1) and total arsenic (Table 5/text above Table 5) was greater in gluten-free cereal porridges than in white rice. This can probably be attributed to the fact that samples with different cereal compositions or propor-tions of rice were used for gluten-free cereal porridge samples in the test for inorganic arse-nic and total arsenic. Data from the EFSA (2009, 2014) on levels of arsenic in rice and rice products 15 European countries responded to the EFSA’s request in July 2008 to submit data on ar-senic concentrations in food. However, 98% of these data related to measurements of total arsenic in food and did not differentiate between organic and inorganic arsenic (EFSA 2009). In the data on rice and rice products (approx. 200 analysis results) evaluated in the EFSA’s opinion (2009), the percentage of inorganic arsenic in total arsenic was between 50% and 60%. In the literature, the percentage of inorganic arsenic in total arsenic in rice is described with a large span of 27 to 93% (Meharg et al. 2008, Torres-Escribano et al. 2008, Jorhem et

Seite 22 von 58
www.bfr.bund.de
Bundesinstitut für Risikobewertung
al. 2008). In the EFSA opinion (2009), the exposure estimate of inorganic arsenic in specific food categories (terrestrial food) was based on scenarios of 50%, 70% and 100% inorganic arsenic in total arsenic. The levels of total arsenic in rice and rice products according to the EFSA (2009) are shown in Table 6. Table 6: Levels of total arsenic in rice, rice products and rice-based baby food in mg/kg (EFSA 2009)
Food N <LOD Type P5 Median Mean P95 Max.
Grains of rice 1,122 9.80% LB 0.0000 0.1100 0.1362 0.3600 1.1800
UB 0.0240 0.1100 0.1424 0.3600 1.1800
Rice products 314 28% LB 0.0000 0.1000 0.1422 0.3900 1.9800
UB 0.0200 0.1000 0.1659 0.3900 1.9800
Rice-based baby food
19 21% LB 0.0000 0.1610 0.1496 0.2760 0.2760
UB 0.0109 0.1610 0.1575 0.2760 0.2760 LOD = Limit of detection
In March 2014, a further EFSA opinion on food-related exposure of the population in Europe to inorganic arsenic was published (EFSA 2014). This exposure estimate was primarily based on data on total arsenic in food, too. For some food groups, for example rice and rice products, measurement results on levels of inorganic arsenic were also available. The values for levels of inorganic arsenic for rice and rice products shown in Table 7 were included in the EFSA exposure estimate (2014).

Seite 23 von 58
www.bfr.bund.de
Bundesinstitut für Risikobewertung
Table 7: Levels of inorganic arsenic in rice and rice products in mg/kg (according to EFSA 2014)
Mean estimated value for the level of
inorganic arsenic (mg/kg)h
Food Ng <LOD/LOQ ( %) LB MB UB
Rice, browna 122 ( 94) 2 0.151 0.152 0.153
Rice, long-graina 482 (130) 20 0.078 0.088 0.099
Rice, mixedb 0.092 0.101 0.110
Rice, parboileda 156 ( 70) 14 0.092 0.105 0.117
Rice, red 12 ( 12) 0 0.162 0.162 0.162
Rice, whitea 299 (189) 9 0.084 0.089 0.093
Rice, wild 25 ( 8) 24 0.072 0.075 0.078
Rice (unspecified)a 1,112 (201) 10 0.079 0.094 0.108
Unleavened bread, crispbread, rusk (with rice)d
0.093 0.099 0.106
Rice breadd 0.093 0.099 0.106
Rice flakes 19 ( 2) 24 0.073 0.076 0.080
Rice flakes and chocolatee 0.061 0.075 0.089
Rice porridgeb 0.092 0.101 0.110
Rice, poppedf 0.108 0.111 0.115
Fine bakery wares (with rice)c 41 ( 31) 0 0.261 0.261 0.261
Rice drinka 66 ( 60) 27 0.011 0.012 0.012 Ready-to-eat meal for children, cereal-based (with rice)
14 ( 6) 0 0.107 0.107 0.107
Cereal-based food for infants and young children (with rice)
52 ( 20) 0 0.133 0.133 0.133
Fibre supplements (based on rice)
14 ( 8) 0 1.486 1.486 1.486
Rice-based meals 12 ( 1) 33 0.040 0.045 0.050
Starchy pudding (with rice) 14 ( 11) 36 0.070 0.081 0.092 LOD/LOQ = Limit of detection/quantification a Mean values calculated exclusively on the basis of measured values on levels of inorganic arsenic b Because fewer than ten values were available, the mean estimated values for the average levels in all analysed rice types were used c Mainly rice cakes d Mean estimated value based on the average levels in five samples of rice bread, six samples of unleavened bread, crispbread and rusk e Mean estimated value based on the average levels in three samples of rice flakes with chocolate and the samples of rice flakes f Estimated values derived from the average concentration of three samples of rice, popped with sugar and eight samples of rice popped g Number of measured values, with number of measured values for inorganic arsenic in brackets h In the case of the food items designated with "a", only the measured values for levels of inorganic arsenic were included. For the other food items, the measured values for levels of inorganic arsenic (if available) were combined with estimated values for the level of inorganic arsenic based on measured values for the level of total arsenic (assumption for rice-based food items: 70% of total arsenic is inorganic arsenic).

Seite 24 von 58
www.bfr.bund.de
Bundesinstitut für Risikobewertung
3.1.3.3.2 Consumption data on rice and rice products NVS II – 14 to 80 age group In the following, the 14 to 80 age group will also be referred to as the “adult” group in order to distinguish it from the age groups of children and adolescents investigated in other nutrition studies. For the evaluation of NVS II, four food groups were created for the consumption of rice and rice products. The “grains of rice” group combines white rice, brown rice, parboiled rice and wild rice26. “Snack with rice (sweet/savoury)” comprises sweets containing rice, such as ce-real bars, crisped rice or puffed rice. Rice cakes form their own group and were evaluated individually. The consumption of rice flour and rice starch forms an additional group. Long-term consumption in g/d and in relation to body weight (b.w.) is shown in Table 8 based on all respondents (i.e., the total study population) as well as consumers only. Table 8: Long-term (monthly average) consumption level in [g/d] and [g/kg b.w./day] according to NVS II, DISHES
g/d g/kg b.w./day
Total study population
Consumers only
Total study population
Consumers only
Grains of rice
Valid N 15,371 13,017 15,371 13,017
Mean 15.3 18.1 0.211 0.249
P95 47.0 49.5 0.650 0.709
Snack with rice (sweet/savoury)
Valid N 15,371 42 15,371 42
Mean 0.1 20.5 0.001 0.305
P95 0.0 85.5 0.000 1.587
Rice cakes
Valid N 15,371 80 15,371 80
Mean 0.1 9.7 0.001 0.154
P95 0.0 30.0 0.000 0.481
Rice flour, Rice starch
Valid N 15,371 37 15,371 37
Mean 0.0 0.4 0.000 0.005
P95 0.0 1.0 0.000 0.015
The average consumption of grains of rice is 15.3 g/d when all respondents are considered and 18.1 g/d for the group of consumers. The consumption of grains of rice is 0.211 g/d per kg b.w. on average for all respondents and 0.249 g/d per kg b.w. for the consumers. The consumption of rice cakes is 0.1 g/d on average when all respondents are considered and 9.7 g/d in the group of 42 consumers. The proportion of consumers corresponds to less than 0.1% of all respondents. Conclusions drawn for the group of consumers cannot be applied to the population as a whole. Short-term consumption, specified as the maximum consumption level measured over two days in the 24h-recalls of NVS II, is shown in Table 9 both in g/d and in relation to body weight. The short-term consumption of grains of rice on average is 115.8 g/d and 1.6 g/d per kg b.w. The short-term consumption of rice cakes for high consumers (P95) is 90 g/d or 1.4 g/d per kg b.w. Rice starch is not listed in Table 9 as there were no mentions of its consump-tion in the 24h-recalls.
26 Contains the BLS codes husked rice (C352XXX), unhusked rice (C351XXX), parboiled (C359XXX) and wild rice (C353XXX) with different types of processing and preparation, indicated here by XXX in the BLS code
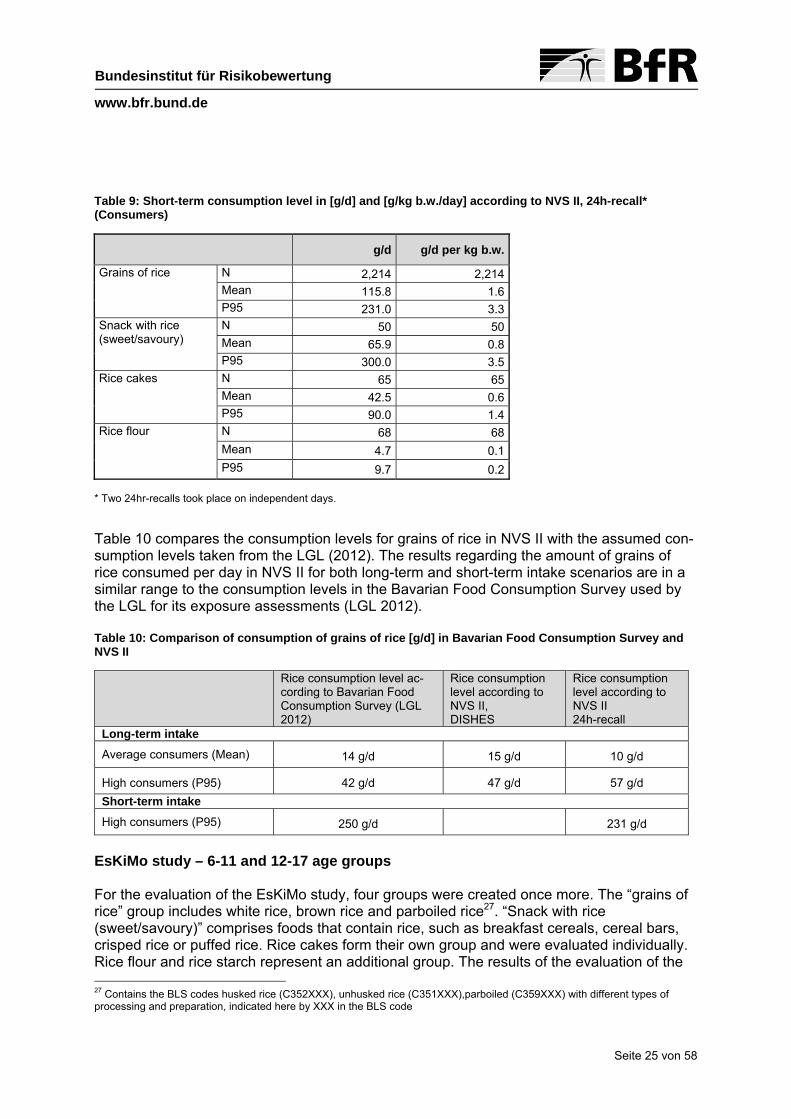
Seite 25 von 58
www.bfr.bund.de
Bundesinstitut für Risikobewertung
Table 9: Short-term consumption level in [g/d] and [g/kg b.w./day] according to NVS II, 24h-recall* (Consumers)
g/d g/d per kg b.w.
Grains of rice N 2,214 2,214 Mean 115.8 1.6 P95 231.0 3.3
Snack with rice (sweet/savoury)
N 50 50 Mean 65.9 0.8 P95 300.0 3.5
Rice cakes N 65 65 Mean 42.5 0.6 P95 90.0 1.4
Rice flour N 68 68 Mean 4.7 0.1
P95 9.7 0.2 * Two 24hr-recalls took place on independent days.
Table 10 compares the consumption levels for grains of rice in NVS II with the assumed con-sumption levels taken from the LGL (2012). The results regarding the amount of grains of rice consumed per day in NVS II for both long-term and short-term intake scenarios are in a similar range to the consumption levels in the Bavarian Food Consumption Survey used by the LGL for its exposure assessments (LGL 2012). Table 10: Comparison of consumption of grains of rice [g/d] in Bavarian Food Consumption Survey and NVS II
Rice consumption level ac-cording to Bavarian Food Consumption Survey (LGL 2012)
Rice consumption level according to NVS II, DISHES
Rice consumption level according to NVS II 24h-recall
Long-term intake
Average consumers (Mean) 14 g/d 15 g/d 10 g/d
High consumers (P95) 42 g/d 47 g/d 57 g/d
Short-term intake
High consumers (P95) 250 g/d 231 g/d
EsKiMo study – 6-11 and 12-17 age groups For the evaluation of the EsKiMo study, four groups were created once more. The “grains of rice” group includes white rice, brown rice and parboiled rice27. “Snack with rice (sweet/savoury)” comprises foods that contain rice, such as breakfast cereals, cereal bars, crisped rice or puffed rice. Rice cakes form their own group and were evaluated individually. Rice flour and rice starch represent an additional group. The results of the evaluation of the 27 Contains the BLS codes husked rice (C352XXX), unhusked rice (C351XXX),parboiled (C359XXX) with different types of processing and preparation, indicated here by XXX in the BLS code

Seite 26 von 58
www.bfr.bund.de
Bundesinstitut für Risikobewertung
EsKiMo study for 6-11 year-old and 12-17 year-old children and adolescents are illustrated in Table 11.
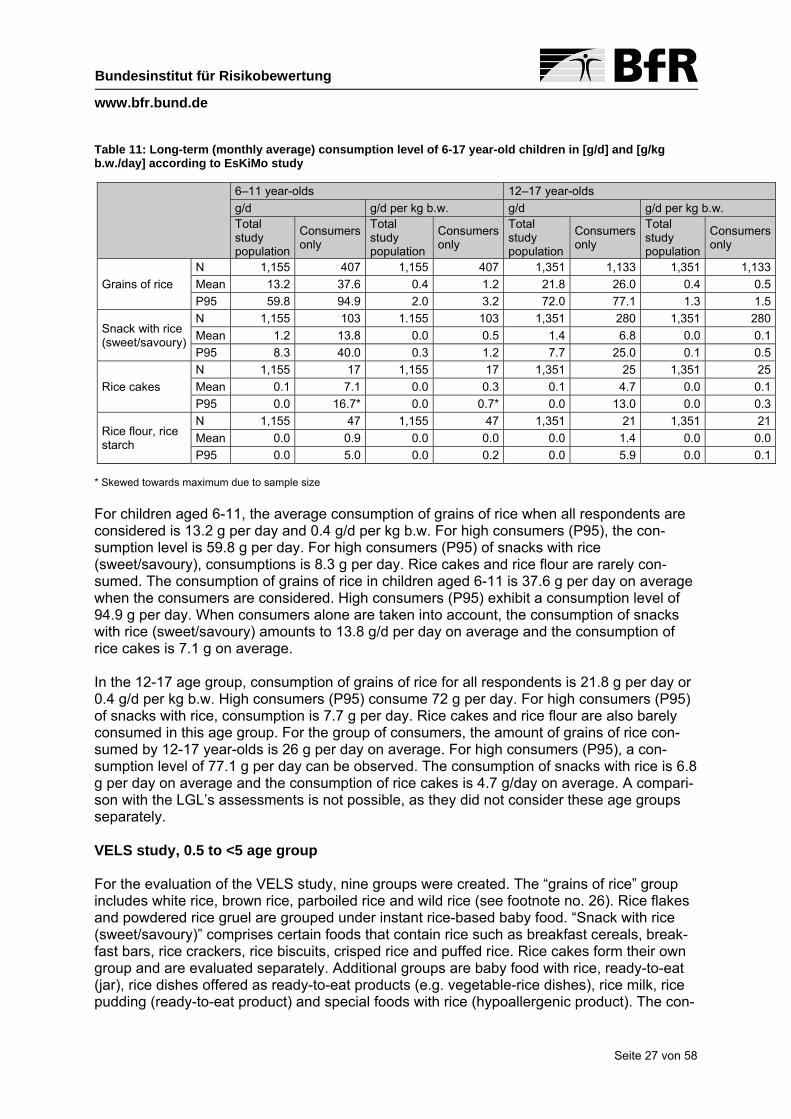
Seite 27 von 58
www.bfr.bund.de
Bundesinstitut für Risikobewertung
Table 11: Long-term (monthly average) consumption level of 6-17 year-old children in [g/d] and [g/kg b.w./day] according to EsKiMo study
6–11 year-olds 12–17 year-olds
g/d g/d per kg b.w. g/d g/d per kg b.w. Total study population
Consumers only
Total study population
Consumers only
Total study population
Consumers only
Total study population
Consumers only
Grains of rice
N 1,155 407 1,155 407 1,351 1,133 1,351 1,133
Mean 13.2 37.6 0.4 1.2 21.8 26.0 0.4 0.5
P95 59.8 94.9 2.0 3.2 72.0 77.1 1.3 1.5
Snack with rice (sweet/savoury)
N 1,155 103 1.155 103 1,351 280 1,351 280
Mean 1.2 13.8 0.0 0.5 1.4 6.8 0.0 0.1
P95 8.3 40.0 0.3 1.2 7.7 25.0 0.1 0.5
Rice cakes
N 1,155 17 1,155 17 1,351 25 1,351 25
Mean 0.1 7.1 0.0 0.3 0.1 4.7 0.0 0.1
P95 0.0 16.7* 0.0 0.7* 0.0 13.0 0.0 0.3
Rice flour, rice starch
N 1,155 47 1,155 47 1,351 21 1,351 21
Mean 0.0 0.9 0.0 0.0 0.0 1.4 0.0 0.0
P95 0.0 5.0 0.0 0.2 0.0 5.9 0.0 0.1 * Skewed towards maximum due to sample size
For children aged 6-11, the average consumption of grains of rice when all respondents are considered is 13.2 g per day and 0.4 g/d per kg b.w. For high consumers (P95), the con-sumption level is 59.8 g per day. For high consumers (P95) of snacks with rice (sweet/savoury), consumptions is 8.3 g per day. Rice cakes and rice flour are rarely con-sumed. The consumption of grains of rice in children aged 6-11 is 37.6 g per day on average when the consumers are considered. High consumers (P95) exhibit a consumption level of 94.9 g per day. When consumers alone are taken into account, the consumption of snacks with rice (sweet/savoury) amounts to 13.8 g/d per day on average and the consumption of rice cakes is 7.1 g on average. In the 12-17 age group, consumption of grains of rice for all respondents is 21.8 g per day or 0.4 g/d per kg b.w. High consumers (P95) consume 72 g per day. For high consumers (P95) of snacks with rice, consumption is 7.7 g per day. Rice cakes and rice flour are also barely consumed in this age group. For the group of consumers, the amount of grains of rice con-sumed by 12-17 year-olds is 26 g per day on average. For high consumers (P95), a con-sumption level of 77.1 g per day can be observed. The consumption of snacks with rice is 6.8 g per day on average and the consumption of rice cakes is 4.7 g/day on average. A compari-son with the LGL’s assessments is not possible, as they did not consider these age groups separately. VELS study, 0.5 to <5 age group For the evaluation of the VELS study, nine groups were created. The “grains of rice” group includes white rice, brown rice, parboiled rice and wild rice (see footnote no. 26). Rice flakes and powdered rice gruel are grouped under instant rice-based baby food. “Snack with rice (sweet/savoury)” comprises certain foods that contain rice such as breakfast cereals, break-fast bars, rice crackers, rice biscuits, crisped rice and puffed rice. Rice cakes form their own group and are evaluated separately. Additional groups are baby food with rice, ready-to-eat (jar), rice dishes offered as ready-to-eat products (e.g. vegetable-rice dishes), rice milk, rice pudding (ready-to-eat product) and special foods with rice (hypoallergenic product). The con-

Seite 28 von 58
www.bfr.bund.de
Bundesinstitut für Risikobewertung
sumption levels always refer to the whole product and not only to the rice portion of the prod-uct, as this is unknown. In Table 12 to Table 14, consumption levels are listed according to the groups described above. Due to the large differences in eating habits in infants and children in the age ranges 0.5-1 (baby food/breastfeeding and complementary food) 1-2 (complementary food and tran-sitioning to adult food) and 2-5 (adult food), the categories were subdivided according to these age groups. Children of all age groups who were still being breastfed when the data were collected were not included in the exposure assessment. Rice consumption in 0.5-<1 year-old infants, at 8.1 g/d on average and 25.4 g/d for the high consumers (P 95), is higher than in older respondents between the ages 1 and 5. The pro-portion of consumers among the respondents is 98.1%, meaning that rice forms a key part of this age group’s daily diet. The following tables show the long and short-term consumption levels in g/d in relation to body weight according to the VELS study. To show the consumption levels for rice, the fol-lowing tables list all of the created groups with consumption levels provided for each one. As data on the occurrence of arsenic are not available for all of the food groups mentioned here, only the groups for grains of rice, snacks with rice, rice cakes, rice pudding and instant rice-based baby food can be included in the exposure assessment.
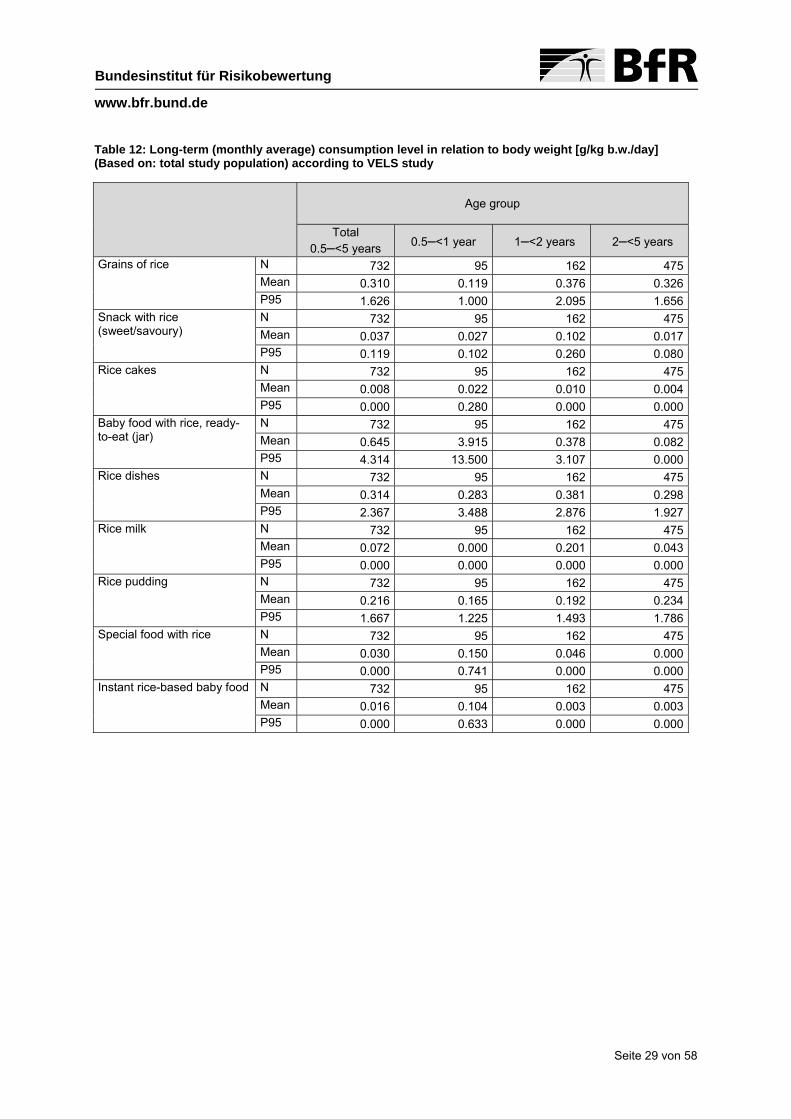
Seite 29 von 58
www.bfr.bund.de
Bundesinstitut für Risikobewertung
Table 12: Long-term (monthly average) consumption level in relation to body weight [g/kg b.w./day] (Based on: total study population) according to VELS study
Age group
Total
0.5–<5 years 0.5–<1 year 1–<2 years 2–<5 years
Grains of rice N 732 95 162 475 Mean 0.310 0.119 0.376 0.326 P95 1.626 1.000 2.095 1.656
Snack with rice (sweet/savoury)
N 732 95 162 475 Mean 0.037 0.027 0.102 0.017 P95 0.119 0.102 0.260 0.080
Rice cakes N 732 95 162 475 Mean 0.008 0.022 0.010 0.004 P95 0.000 0.280 0.000 0.000
Baby food with rice, ready-to-eat (jar)
N 732 95 162 475 Mean 0.645 3.915 0.378 0.082 P95 4.314 13.500 3.107 0.000
Rice dishes N 732 95 162 475 Mean 0.314 0.283 0.381 0.298 P95 2.367 3.488 2.876 1.927
Rice milk N 732 95 162 475 Mean 0.072 0.000 0.201 0.043 P95 0.000 0.000 0.000 0.000
Rice pudding N 732 95 162 475 Mean 0.216 0.165 0.192 0.234 P95 1.667 1.225 1.493 1.786
Special food with rice N 732 95 162 475 Mean 0.030 0.150 0.046 0.000 P95 0.000 0.741 0.000 0.000
Instant rice-based baby food N 732 95 162 475 Mean 0.016 0.104 0.003 0.003 P95 0.000 0.633 0.000 0.000
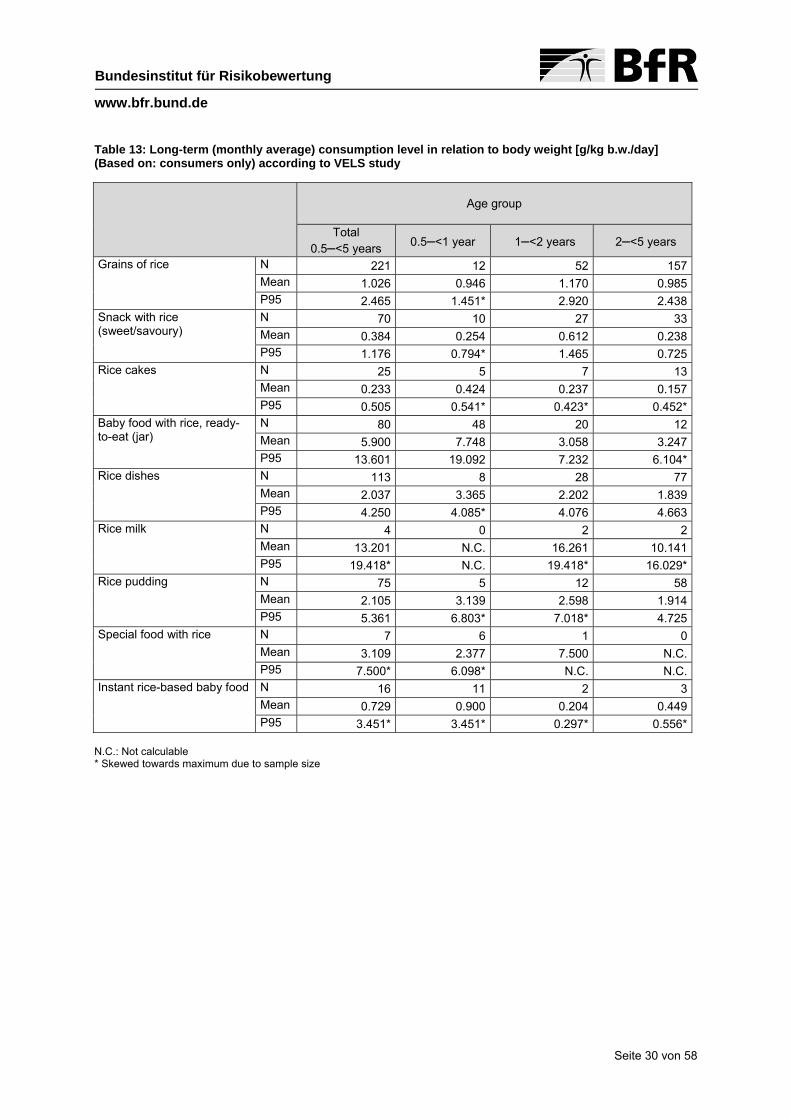
Seite 30 von 58
www.bfr.bund.de
Bundesinstitut für Risikobewertung
Table 13: Long-term (monthly average) consumption level in relation to body weight [g/kg b.w./day] (Based on: consumers only) according to VELS study
Age group
Total
0.5–<5 years 0.5–<1 year 1–<2 years 2–<5 years
Grains of rice N 221 12 52 157 Mean 1.026 0.946 1.170 0.985 P95 2.465 1.451* 2.920 2.438
Snack with rice (sweet/savoury)
N 70 10 27 33 Mean 0.384 0.254 0.612 0.238 P95 1.176 0.794* 1.465 0.725
Rice cakes N 25 5 7 13 Mean 0.233 0.424 0.237 0.157 P95 0.505 0.541* 0.423* 0.452*
Baby food with rice, ready-to-eat (jar)
N 80 48 20 12 Mean 5.900 7.748 3.058 3.247 P95 13.601 19.092 7.232 6.104*
Rice dishes N 113 8 28 77 Mean 2.037 3.365 2.202 1.839 P95 4.250 4.085* 4.076 4.663
Rice milk N 4 0 2 2 Mean 13.201 N.C. 16.261 10.141 P95 19.418* N.C. 19.418* 16.029*
Rice pudding N 75 5 12 58 Mean 2.105 3.139 2.598 1.914 P95 5.361 6.803* 7.018* 4.725
Special food with rice N 7 6 1 0 Mean 3.109 2.377 7.500 N.C. P95 7.500* 6.098* N.C. N.C.
Instant rice-based baby food N 16 11 2 3 Mean 0.729 0.900 0.204 0.449 P95 3.451* 3.451* 0.297* 0.556*
N.C.: Not calculable * Skewed towards maximum due to sample size

Seite 31 von 58
www.bfr.bund.de
Bundesinstitut für Risikobewertung
Table 14: Short-term consumption level of rice and rice products according to VELS study, g/kg b.w. per day
Age group
Total
0.5–<5 years 0.5–<1 year 1–<2 years 2–<5 years
Grains of rice N 221 12 52 157 Mean 5.267 5.674 6.228 4.918 P95 11.882 8.704* 14.792 11.134
Snack with rice (sweet/savoury) N 70 10 27 33 Mean 1.375 0.725 1.985 1.073 P95 4.500 1.569* 8.788 2.878
Rice cakes N 25 5 7 13 Mean 1.033 1.464 1.119 0.822 P95 2.025 1.961* 1.538* 2.034*
Rice-based baby food, ready-to-eat (jar)
N 80 48 20 12 Mean 20.697 24.922 13.690 15.473 P95 43.434 46.782 23.810 19.868*
Rice dishes N 113 8 28 77 Mean 10.577 20.192 11.230 9.341 P95 24.510 24.510* 21.182 27.000
Rice milk N 4 0 2 2 Mean 33.807 N.C. 43.071 24.543 P95 46.952* N.C. 46.952* 38.164*
Rice pudding N 75 5 12 58 Mean 10.962 14.752 13.944 10.019 P95 21.055 20.410* 42.105* 19.229
Special food with rice N 7 6 1 0 Mean 5.011 4.107 10.435 N.C. P95 10.435* 6.098* N.C. N.C.
Instant rice-based baby food N 16 11 2 3 Mean 2.048 2.146 1.224 2.236 P95 4.902* 4.902* 1.782* 3.333*
N.C.: Not calculable * Skewed towards the maximum due to sample size
The following table, Table 15, shows a comparison between the consumption levels of rice cakes from the VELS study and the LGL report (LGL 2012). Based on the group of consum-ers, the consumption levels of rice cakes for a chronic intake scenario in the VELS study are somewhat lower than the consumption levels established in the LGL report (LGL 2012). In-take for an acute intake scenario is 8 g/d when all respondents are taken into account and 8 to 20 g/d when only the consumers are considered. Overall, the consumption levels for rice cakes used in the LGL report (LGL 2012) are also in a similar range to those taken from the VELS study.
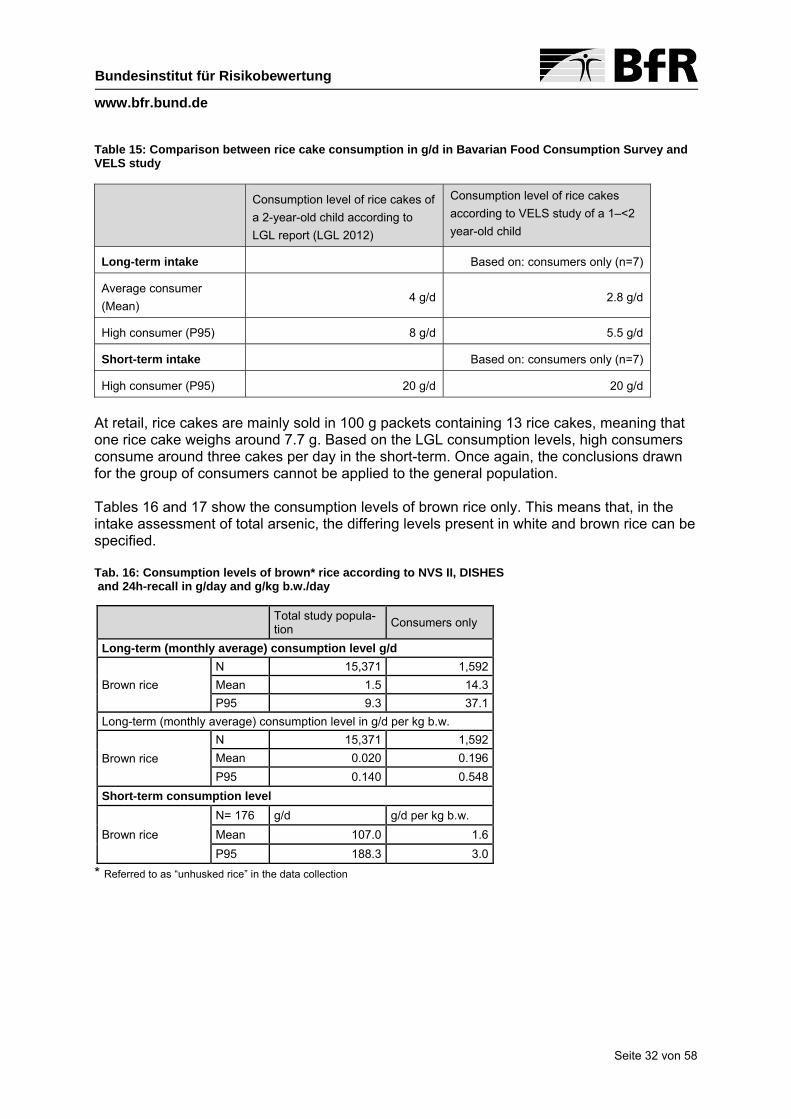
Seite 32 von 58
www.bfr.bund.de
Bundesinstitut für Risikobewertung
Table 15: Comparison between rice cake consumption in g/d in Bavarian Food Consumption Survey and VELS study
Consumption level of rice cakes of
a 2-year-old child according to
LGL report (LGL 2012)
Consumption level of rice cakes
according to VELS study of a 1–<2
year-old child
Long-term intake Based on: consumers only (n=7)
Average consumer
(Mean) 4 g/d 2.8 g/d
High consumer (P95) 8 g/d 5.5 g/d
Short-term intake Based on: consumers only (n=7)
High consumer (P95) 20 g/d 20 g/d
At retail, rice cakes are mainly sold in 100 g packets containing 13 rice cakes, meaning that one rice cake weighs around 7.7 g. Based on the LGL consumption levels, high consumers consume around three cakes per day in the short-term. Once again, the conclusions drawn for the group of consumers cannot be applied to the general population. Tables 16 and 17 show the consumption levels of brown rice only. This means that, in the intake assessment of total arsenic, the differing levels present in white and brown rice can be specified. Tab. 16: Consumption levels of brown* rice according to NVS II, DISHES and 24h-recall in g/day and g/kg b.w./day
Total study popula-tion
Consumers only
Long-term (monthly average) consumption level g/d
Brown rice
N 15,371 1,592
Mean 1.5 14.3
P95 9.3 37.1
Long-term (monthly average) consumption level in g/d per kg b.w.
Brown rice
N 15,371 1,592
Mean 0.020 0.196
P95 0.140 0.548
Short-term consumption level
Brown rice
N= 176 g/d g/d per kg b.w.
Mean 107.0 1.6
P95 188.3 3.0
* Referred to as “unhusked rice” in the data collection
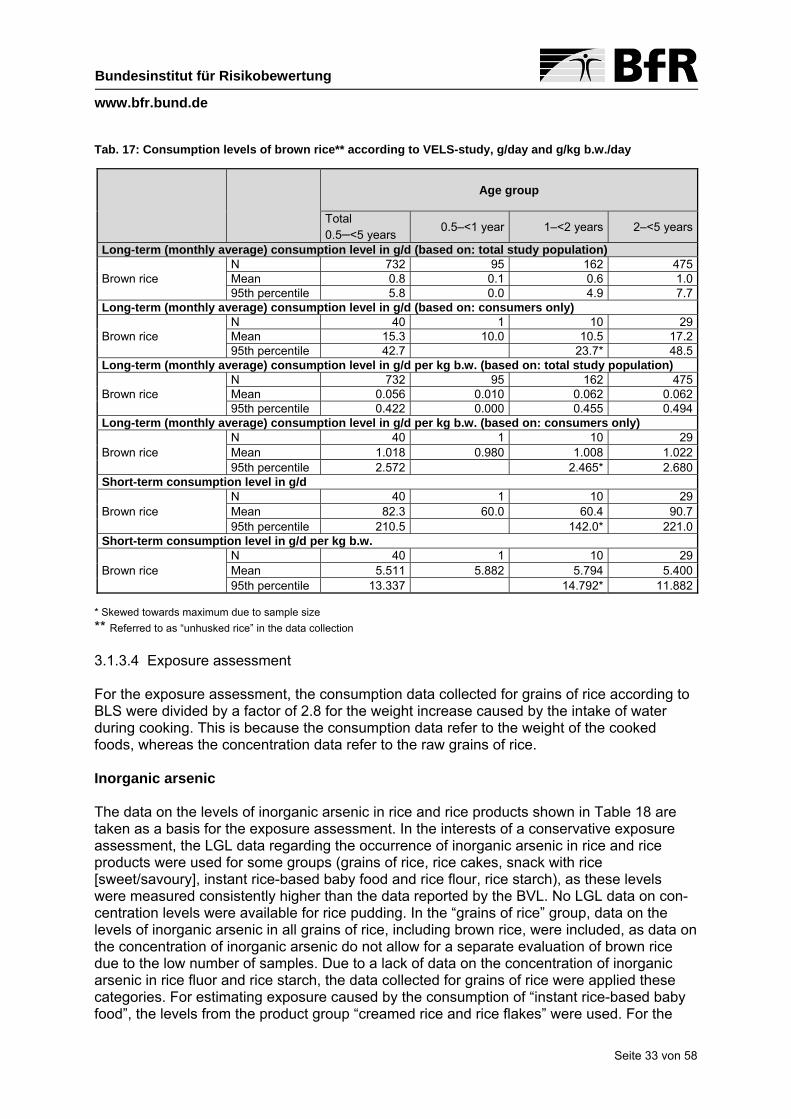
Seite 33 von 58
www.bfr.bund.de
Bundesinstitut für Risikobewertung
Tab. 17: Consumption levels of brown rice** according to VELS-study, g/day and g/kg b.w./day
Age group
Total 0.5–<5 years
0.5–<1 year 1–<2 years 2–<5 years
Long-term (monthly average) consumption level in g/d (based on: total study population)
Brown rice N 732 95 162 475 Mean 0.8 0.1 0.6 1.0 95th percentile 5.8 0.0 4.9 7.7
Long-term (monthly average) consumption level in g/d (based on: consumers only)
Brown rice N 40 1 10 29 Mean 15.3 10.0 10.5 17.2 95th percentile 42.7 23.7* 48.5
Long-term (monthly average) consumption level in g/d per kg b.w. (based on: total study population)
Brown rice N 732 95 162 475 Mean 0.056 0.010 0.062 0.062 95th percentile 0.422 0.000 0.455 0.494
Long-term (monthly average) consumption level in g/d per kg b.w. (based on: consumers only)
Brown rice N 40 1 10 29 Mean 1.018 0.980 1.008 1.022 95th percentile 2.572 2.465* 2.680
Short-term consumption level in g/d
Brown rice N 40 1 10 29 Mean 82.3 60.0 60.4 90.7 95th percentile 210.5 142.0* 221.0
Short-term consumption level in g/d per kg b.w.
Brown rice N 40 1 10 29 Mean 5.511 5.882 5.794 5.400 95th percentile 13.337 14.792* 11.882
* Skewed towards maximum due to sample size
** Referred to as “unhusked rice” in the data collection
3.1.3.4 Exposure assessment For the exposure assessment, the consumption data collected for grains of rice according to BLS were divided by a factor of 2.8 for the weight increase caused by the intake of water during cooking. This is because the consumption data refer to the weight of the cooked foods, whereas the concentration data refer to the raw grains of rice. Inorganic arsenic The data on the levels of inorganic arsenic in rice and rice products shown in Table 18 are taken as a basis for the exposure assessment. In the interests of a conservative exposure assessment, the LGL data regarding the occurrence of inorganic arsenic in rice and rice products were used for some groups (grains of rice, rice cakes, snack with rice [sweet/savoury], instant rice-based baby food and rice flour, rice starch), as these levels were measured consistently higher than the data reported by the BVL. No LGL data on con-centration levels were available for rice pudding. In the “grains of rice” group, data on the levels of inorganic arsenic in all grains of rice, including brown rice, were included, as data on the concentration of inorganic arsenic do not allow for a separate evaluation of brown rice due to the low number of samples. Due to a lack of data on the concentration of inorganic arsenic in rice fluor and rice starch, the data collected for grains of rice were applied these categories. For estimating exposure caused by the consumption of “instant rice-based baby food”, the levels from the product group “creamed rice and rice flakes” were used. For the

Seite 34 von 58
www.bfr.bund.de
Bundesinstitut für Risikobewertung
product groups special food with rice, rice milk, rice dishes and “baby food with rice, ready-to-eat (jar)”, there are either no data regarding the concentration of inorganic arsenic or the proportion of rice the products contain, or it was not possible to take data from other product groups or grains of rice. These rice products are therefore not part of the exposure assess-ment. The likelihood of this resulting in an underestimation is judged to be negligible, as in some cases the consumption levels are low and these rice products are mostly only made up of a certain proportion of rice. Table 18: Levels of inorganic arsenic in rice and rice products used for the exposure assessment, mg/kg
Product Valid N Mean P95
Grains of rice** 80 0.104 0.207
Rice cakes** 51 0.260 0.425 Snack with rice (sweet/savoury)**
10 0.053 0.107*
Rice pudding*** 14 0.020 0.020*
Instant rice-based baby food** 25 0.187 0.309
Rice flour, rice starch**** 80 0.104 0.207 * Skewed towards maximum due to sample size ** LGL 2012 data for white and brown rice (grains of rice), rice cakes, puffed and chocolate rice and rice crackers (snack with rice sweet/savoury), creamed rice, rice flakes (instant rice-based baby food) *** Data from food monitoring, provided by the BVL **** Data for grains of rice used, as no concentration data were available for rice flour The exposure assessment was carried out based on the mean values and not based on the high levels (P95), as the long-term intake of rice and rice products with exclusively high lev-els is not viewed as realistic. For the 14-80 age group, based on the consumption levels established in NVS II, a long-term intake of arsenic of 0.008 µg/kg b.w./day arises from the consumption of total rice (total study population). The consumers ingest 0.009 µg/kg b.w./day through the consumption of total rice. When all respondents are considered, this level of intake is mainly due to the consump-tion of grains of rice. Further food groups with rice, such as rice cakes or snacks with rice, have no influence on the intake level of arsenic via rice and rice products when all respond-ents are considered due to the low number of consumers (see Table 22). Due to the high levels of inorganic arsenic in rice cakes, the consumption of 9.7 g rice cakes (around 1.25 rice cakes) per day (0.154 g/kg b.w./day) when consumers are taken into account results in an intake of 0.04 µg inorganic arsenic/kg b.w./day, which corresponds to around five times the average intake of inorganic arsenic in all respondents (0.008 µg/kg b.w./day).

Seite 35 von 58
www.bfr.bund.de
Bundesinstitut für Risikobewertung
Table 19: Assessment of long-term exposure to inorganic arsenic [µg/kg b.w./day] according to NVS II, DISHES
Total study population
Consumers only
Total rice
Valid N 15,371 13,037 Minimum 0.000 0.000 Mean 0.008 0.009 P95 0.025 0.027
Grains of rice
Valid N 15,371 13,017 Minimum 0.000 0.000 Mean 0.008 0.009 P95 0.024 0.026
Snack with rice (sweet/savoury)
Valid N 15,371 42 Minimum 0.000 0.000 Mean 0.000 0.016 P95 0.000 0.084
Rice cakes
Valid N 15,371 80 Minimum 0.000 0.001 Mean 0.000 0.040 P95 0.000 0.125
Rice flour, rice starch
Valid N 15,371 37 Minimum 0.000 0.000 Mean 0.000 0.001 P95 0.000 0.002
Short-term intake of inorganic arsenic via grains of rice is 0.059 µg/kg b.w. per day on aver-age. The short-term consumption of rice cakes leads to the highest exposure to inorganic arsenic when compared to the other rice-based foods with an average of 0.161 µg/kg b.w. per day. The consumption of “snacks with rice” results in short-term exposure of 0.045 µg/kg b.w./day (see Table 20). For the age group of 6-11 year-old children, based on the consumption levels determined in the EsKiMo study a long-term intake of inorganic arsenic of 0.020 µg/kg b.w./day results from the consumption of total rice (total study population). The consumption of rice cakes in this age group results in an inorganic arsenic intake of 0.068 µg/kg b.w./day (average, consum-ers) (see Table 21). For the age group of 12-17 year-old children and adolescents, the consumption of total rice results in a long-term intake of inorganic arsenic of 0.016 µg/kg b.w./day (total study popula-tion), based on the consumption levels determined in the EsKiMo study. In the group of con-sumers, 0.019 µg/kg b.w./day inorganic arsenic is ingested due to the consumption of total rice. The consumption of rice cakes in this age group results in an intake of inorganic arsenic of 0.024 µg/kg b.w./day (average, consumers).
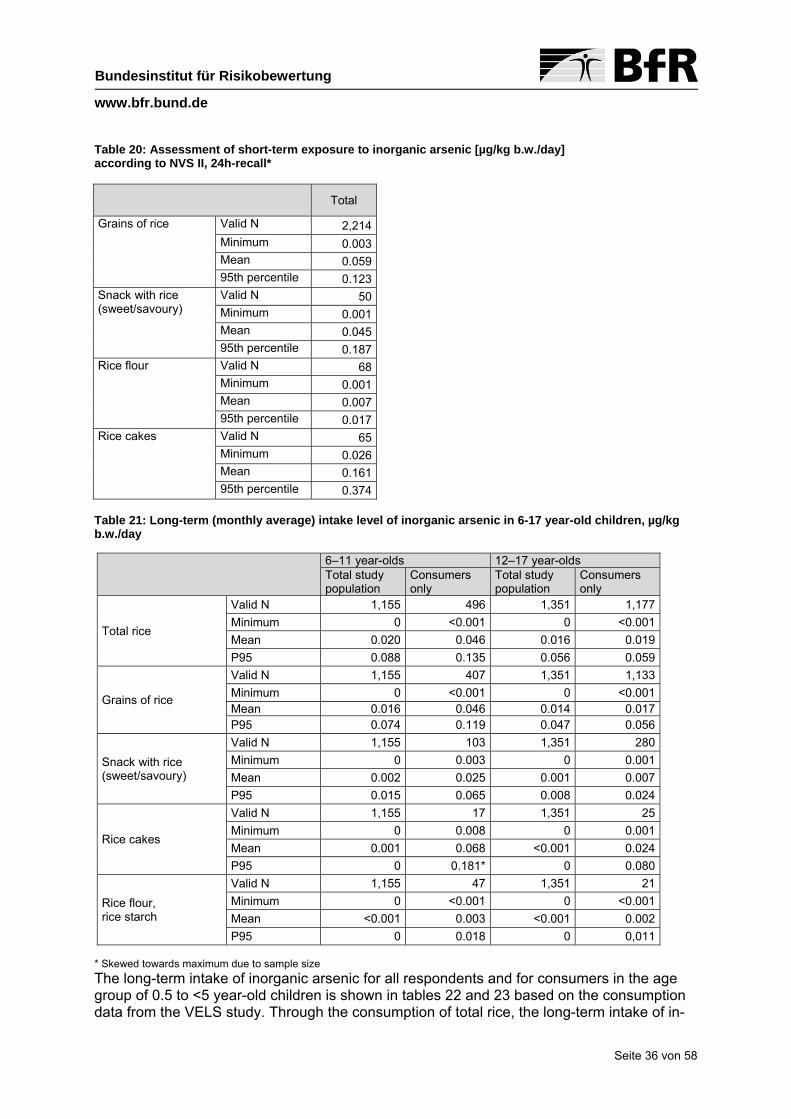
Seite 36 von 58
www.bfr.bund.de
Bundesinstitut für Risikobewertung
Table 20: Assessment of short-term exposure to inorganic arsenic [µg/kg b.w./day] according to NVS II, 24h-recall*
Total
Grains of rice Valid N 2,214 Minimum 0.003 Mean 0.059 95th percentile 0.123
Snack with rice (sweet/savoury)
Valid N 50 Minimum 0.001 Mean 0.045 95th percentile 0.187
Rice flour Valid N 68 Minimum 0.001 Mean 0.007 95th percentile 0.017
Rice cakes Valid N 65 Minimum 0.026 Mean 0.161 95th percentile 0.374
Table 21: Long-term (monthly average) intake level of inorganic arsenic in 6-17 year-old children, µg/kg b.w./day
6–11 year-olds 12–17 year-olds Total study population
Consumers only
Total study population
Consumers only
Total rice
Valid N 1,155 496 1,351 1,177
Minimum 0 <0.001 0 <0.001
Mean 0.020 0.046 0.016 0.019
P95 0.088 0.135 0.056 0.059
Grains of rice
Valid N 1,155 407 1,351 1,133
Minimum 0 <0.001 0 <0.001 Mean 0.016 0.046 0.014 0.017 P95 0.074 0.119 0.047 0.056
Snack with rice (sweet/savoury)
Valid N 1,155 103 1,351 280
Minimum 0 0.003 0 0.001
Mean 0.002 0.025 0.001 0.007
P95 0.015 0.065 0.008 0.024
Rice cakes
Valid N 1,155 17 1,351 25
Minimum 0 0.008 0 0.001
Mean 0.001 0.068 <0.001 0.024
P95 0 0.181* 0 0.080
Rice flour, rice starch
Valid N 1,155 47 1,351 21
Minimum 0 <0.001 0 <0.001
Mean <0.001 0.003 <0.001 0.002
P95 0 0.018 0 0,011 * Skewed towards maximum due to sample size
The long-term intake of inorganic arsenic for all respondents and for consumers in the age group of 0.5 to <5 year-old children is shown in tables 22 and 23 based on the consumption data from the VELS study. Through the consumption of total rice, the long-term intake of in-

Seite 37 von 58
www.bfr.bund.de
Bundesinstitut für Risikobewertung
organic arsenic in children aged 0.5–<1 is 0.034 µg/kg b.w./day (average, total study popula-tion, Table 21). In the group of consumers, 0.113 µg/kg b.w./day inorganic arsenic is ingest-ed through consumption of total rice in children of this age group (average, consumers, Table 23). The consumption of rice cakes in this age group results in an intake of inorganic arsenic of 0.110 µg/kg b.w./day (average, consumers), although it should be noted that this conclu-sion is based on five consumers only and is therefore subject to uncertainty. Table 22: Long-term (monthly average) intake level of inorganic arsenic (based on: total study population) according to VELS study, µg/kg b.w./day
Age group
Total
0.5–<5 years 0.5–<1 year 1–<2 years 2–<5 years
Total rice N 732 95 162 475 Mean 0.023 0.034 0.026 0.019 P95 0.095 0.170 0.093 0.081
Grains of rice
N 732 95 162 475 Mean 0.012 0.004 0.014 0.012 P95 0.060 0.037 0.078 0.062
Snack with rice (sweet/savoury)
N 732 95 162 475 Mean 0.002 0.001 0.005 0.001 P95 0.006 0.005 0.014 0.004
Rice cakes N 732 95 162 475 Mean 0.002 0.006 0.003 0.001 P95 0.000 0.073 0.000 0.000
Rice pudding N 732 95 162 475 Mean 0.004 0.003 0.004 0.005 P95 0.033 0.025 0.030 0.036
Instant rice-based baby food
N 732 95 162 475 Mean 0.003 0.019 0.000 0.001 P95 0.000 0.118 0.000 0.000

Seite 38 von 58
www.bfr.bund.de
Bundesinstitut für Risikobewertung
Table 23: Long-term (monthly average) intake level of inorganic arsenic (based on: consumers only) ac-cording to VELS study, µg/kg b.w./day
Age group
Total
0.5–<5 years 0.5–<1 year 1–<2 years 2–<5 years
Total rice N 328 29 76 223 Mean 0.051 0.113 0.056 0.041 P95 0.131 0.364 0.140 0.105
Grains of rice N 221 12 52 157 Mean 0.038 0.035 0.043 0.037 P95 0.092 0.054* 0.108 0.091
Snack with rice (sweet/savoury)
N 70 10 27 33 Mean 0.020 0.013 0.032 0.013 P95 0.062 0.042* 0.078 0.038
Rice cakes N 25 5 7 13 Mean 0.061 0.110 0.062 0.041 P95 0.131 0.141* 0.110* 0.118*
Rice pudding N 75 5 12 58 Mean 0.042 0.063 0.052 0.038 P95 0.107 0.136* 0.140* 0.095
Instant rice-based baby food
N 16 11 2 3 Mean 0.136 0.168 0.038 0.084 P95 0.645* 0.645* 0.056* 0.104*
* Skewed towards maximum due to sample size
The short-term intake of inorganic arsenic for the age group of 0.5–<5 year-old children is shown in Table 24. The short-term intake of inorganic arsenic through the consumption of rice cakes in this age group is around 0.27 µg/kg b.w./day on average and 0.53 µg/kg b.w./day under high consumption (P95) (considering consumers only in both cases).

Seite 39 von 58
www.bfr.bund.de
Bundesinstitut für Risikobewertung
Table 24: Short-term intake level of inorganic arsenic (based on: consumers only) according to VELS study, µg/kg b.w./day
Age group
Total 0.5–< 5 years
0.5–<1 year 1–<2 years 2–<5 years
Grains of rice N 221 12 52 157 Mean 0.196 0.211 0.231 0.183 P95 0.441 0.323* 0.549 0.414
Snack with rice (sweet/savoury)
N 70 10 27 33 Mean 0.073 0.038 0.105 0.057 P95 0.239 0.083* 0.466 0.153
Rice cakes N 25 5 7 13 Mean 0.269 0.381 0.291 0.214 P95 0.527 0.510* 0.400* 0.529*
Rice pudding N 75 5 12 58 Mean 0.219 0.295 0.279 0.200 P95 0.421 0.408* 0.842* 0.385
Instant rice-based baby food
N 16 11 2 3 Mean 0.383 0.401 0.229 0.418 P95 0.917* 0.917* 0.333* 0.623*
* Skewed towards maximum due to sample size
Total arsenic Some of the data shown in Table 5 from food monitoring carried out between 2000 and 2012 on total arsenic (UB and LB) in rice and rice products are taken as a basis for the exposure assessment. For some rice-based foods whose consumption levels were collected in the consumption studies used for the exposure assessment, there either were no data on the levels of total arsenic, or no data could be taken from other product groups or grains of rice. These foods include rice cakes, special food with rice, rice milk, rice dishes and rice-based baby food, ready-to-eat (jar). These rice products are therefore not included in the exposure assessment for total arsenic. Rice pudding was also not included in the exposure assess-ment, as no consumption data were present in NVS II. The possibility that this could lead to an underestimation is, with the exception of rice cakes, considered to be insignificant, as low consumption levels are present for these foods and these rice products only consist of a pro-portion of rice, depending on the type of preparation. For consumers of rice cakes, an under-estimation of exposure can be assumed in this exposure assessment for total arsenic, par-ticularly in the age group of children under one year old.

Seite 40 von 58
www.bfr.bund.de
Bundesinstitut für Risikobewertung
Table 25: Assessment of long-term exposure to total arsenic according to NVS II, DISHES, µg/kg b.w./day
LB UB Total – total study popula-tion
Total – con-sumers only
Total – total study popula-tion
Total – con-sumers only
Total rice Valid N 15,371 13,024 15,371 13,024 Mean 0.011 0.013 0.011 0.014 95th percentile 0.035 0.030 0.036 0.039
White rice Valid N 15,371 12,363 15,371 12,363 Mean 0.010 0.012 0.010 0.012 95th percentile 0.030 0.034 0.031 0.035
Brown rice Valid N 15,371 1,592 15,371 1,592 Mean 0.002 0.016 0.002 0.016 95th percentile 0.011 0.043 0.011 0.043
Snack with rice (sweet/savoury)
Valid N 15,371 42 15,371 42 Mean 0.000 0.022 0.000 0.030 95th percentile 0.000 0.116 0.000 0.156
Rice flour, rice starch* Valid N 15,371 37 15,371 37 Mean 0.000 0.001 0.000 0.001 95th percentile 0.000 0.002 0.000 0.002
*For rice flour and rice starch, the values for the concentrations in white rice were used for the exposure assessment.
On the basis of the consumption levels determined in NVS II, a long-term intake of total ar-senic of 0.011 µg/kg b.w./day results from the consumption of total rice (total study popula-tion) in the 14-80 age group. The consumers ingest between 0.013 and 0.014 µg/kg b.w./day through the consumption of total rice. When all respondents are taken into account, this in-take level is predominantly due to the consumption of white rice (see Table 25). Based on the consumption levels for white rice collected in NVS II, a short-term total arsenic intake of between 0.079 and 0.081 µg/kg b.w./day can be observed. Brown rice (N=176) leads to the highest short-term exposure at 0.123 µg/kg b.w./day (see Table 26). The long-term intake of total arsenic in the age group of 0.5–<5-year-old children for all re-spondents and the group of consumers is shown in Table 27 and Table 28. Through the con-sumption of total rice, the long-term intake of total arsenic in children aged 1–<2 years is 0.029 to 0.040 µg/kg b.w./day (total study population). The consumers of the same age in-gest between 0.063 and 0.088 µg/kg b.w./day total arsenic through the consumption of total rice. The consumers in the 0.5-<1 year age group ingest between 0.099 and 0.127 µg/kg b.w./day.

Seite 41 von 58
www.bfr.bund.de
Bundesinstitut für Risikobewertung
Table 26: Assessment of short-term exposure to total arsenic according to NVS II, 24h-recall, µg/kg b.w./day
Total LB Total UB
White rice Valid N 2,065 2,065 Mean 0.079 0.081 95th percentile 0.165 0.170
Brown rice Valid N 176 176 Mean 0.123 0.123 95th percentile 0.240 0.240
Snack with rice (sweet/savoury)
Valid N 113 113 Mean 0.052 0.070 95th percentile 0.119 0.160
Rice flour, rice starch* Valid N 68 68 Mean 0.009 0.009 95th percentile 0.023 0.023
* For rice flour and rice starch, the values for the concentrations in white rice were used for the exposure assessment.
Table 27: Long-term (monthly average) intake level of total arsenic in µg/kg b.w./day (based on: total study population) according to VELS study, lower bound (LB) and upper bound (UB)
Age group
Total
0.5–<5 years 0.5–<1 year 1–<2 years 2–<5 years
LB UB LB UB LB UB LB UB Total rice N 732 732 95 95 162 162 475 475
Mean 0.024 0.034 0.028 0.036 0.029 0.040 0.021 0.032 P95 0.105 0.144 0.126 0.228 0.115 0.150 0.097 0.135
White rice N 732 732 95 95 162 162 475 475 Mean 0.013 0.013 0.005 0.006 0.016 0.016 0.013 0.014 P95 0.076 0.079 0.050 0.051 0.099 0.102 0.079 0.082
Brown rice N 732 732 95 95 162 162 475 475 Mean 0.004 0.004 0.001 0.001 0.005 0.005 0.005 0.005 P95 0.033 0.033 0.000 0.000 0.036 0.036 0.039 0.039
Snack with rice (sweet/savoury)
N 732 732 95 95 162 162 475 475 Mean 0.003 0.004 0.002 0.003 0.007 0.010 0.001 0.002 P95 0.009 0.012 0.007 0.010 0.019 0.025 0.006 0.008
Rice pudding N 732 732 95 95 162 162 475 475 Mean 0.001 0.010 0.000 0.008 0.000 0.009 0.001 0.011 P95
0.004 0.076 0.003 0.056 0.004 0.068 0.004 0.082
Instant rice-based baby food
N 732 732 95 95 162 162 475 475 Mean 0.003 0.003 0.019 0.019 0.000 0.000 0.001 0.001 P95 0.000 0.000 0.118 0.118 0.000 0.000 0.000 0.000

Seite 42 von 58
www.bfr.bund.de
Bundesinstitut für Risikobewertung
Table 28: Long-term (monthly average) intake level of total arsenic in µg/kg b.w./day (based on: consum-ers only) according to VELS study, lower bound (LB) and upper bound (UB)
Age group
Total
0.5–<5 years 0.5–<1 year 1–<2 years 2–<5 years
LB UB LB UB LB UB LB UB Total rice N 317 317 27 27 74 74 216 216
Mean 0.054 0.079 0.099 0.127 0.063 0.088 0.046 0.070 P95 0.146 0.207 0.377 0.393 0.146 0.207 0.135 0.181
White rice N 189 189 11 11 45 45 133 133 Mean 0.050 0.051 0.047 0.048 0.056 0.058 0.048 0.049 P95 0.122 0.125 0.073* 0.075* 0.125 0.128 0.122 0.125
Brown rice N 40 40 1 1 10 10 29 29 Mean 0.081 0.081 0.078 0.078 0.080 0.080 0.081 0.081 P95 0.204 0.204 N.C. N.C. 0.195* 0.195* 0.212 0.212
Snack with rice (sweet/savoury)
N 70 70 10 10 27 27 33 33 Mean 0.028 0.038 0.019 0.025 0.045 0.060 0.017 0.023 P95 0.086 0.115 0.058* 0.078* 0.107 0.144 0.053 0.071
Rice pudding N 75 75 5 5 12 12 58 58 Mean 0.005 0.096 0.008 0.144 0.006 0.119 0.005 0.088 P95 0.013 0.246 0.017* 0.312* 0.018* 0.321* 0.012 0.216
Instant rice-based baby food
N 16 16 11 11 2 2 3 3 Mean 0.136 0.136 0.168 0.168 0.038 0.038 0.084 0.084 P95 0.645* 0.645* 0.645* 0.645* 0.056* 0.056* 0.104* 0.104*
* Skewed towards maximum due to sample size
Short-term intake of total arsenic is shown in Table 29 for the age group of 0.5-<5 year-old children. The highest average intake of total arsenic for children is found in consumers of brown rice at 0.437 µg/kg b.w./day.

Seite 43 von 58
www.bfr.bund.de
Bundesinstitut für Risikobewertung
Table 29: Short-term intake level in µg/kg b.w./day (based on: consumers only) according to VELS study, lower bound (LB) and upper bound (UB)
Age group
Total
0.5–<5 years 0.5–<1 year 1–<2 years 2–<5 years
LB UB LB UB LB UB LB UB
White rice
N 189 189 11 11 45 45 133 133 Mean 0.258 0.265 0.283 0.291 0.308 0.317 0.239 0.246 P95 0.577 0.593 0.435* 0.448 0.675 0.694 0.549 0.565
Brown rice
N 40 40 1 1 10 10 29 29 Mean 0.437 0.437 0.466 0.466 0.459 0.459 0.428 0.428 P95 1.057 1.057 N.C. N.C. 1.173* 1.173* 0.942 0.942
Snack with rice (sweet/savoury)
N 70 70 10 10 27 27 33 33 Mean 0.100 0.135 0.053 0.071 0.145 0.195 0.078 0.105 P95 0.329 0.441 0.115* 0.154* 0.642 0.861 0.210 0.282
Rice pudding
N 75 75 5 5 12 12 58 58 Mean 0.027 0.502 0.037 0.676 0.035 0.639 0.025 0.459 P95 0.053 0.964 0.051* 0.935* 0.105* 1.928* 0.048 0.881
Instant rice-based baby food
N 16 16 11 11 2 2 3 3 Mean 0.383 0.383 0.401 0.401 0.229 0.229 0.418 0.418 P95 0.917* 0.917* 0.917* 0.917* 0.333* 0.333* 0.623* 0.623*
* Skewed towards maximum due to sample size
Assessment of inorganic arsenic intake based on the exposure assessment for total arsenic Due to the uncertainty regarding the proportion of inorganic arsenic in total arsenic, three scenarios were calculated for the individual rice-based foods by analogy to the EFSA (2009) for the assessment of inorganic arsenic intake based on the exposure assessment for total arsenic EFSA (2009). These scenarios, presented below, show exposure to inorganic arse-nic when proportions of inorganic arsenic of 100 %, 70 % and 50 % of total arsenic are as-sumed (Tables 30 to 31). In the interests of a conservative approach, this exposure assess-ment was carried out for children aged 0.5–<1, as this age group is, on average, the most exposed to inorganic arsenic through the consumption of total rice, according to the results presented in this opinion thus far. Depending on the scenario, the average long-term intake of inorganic arsenic for 0.5–<1 year-old children for all respondents is between 0.014 and 0.028 µg/kg b.w./day (LB) or 0.018 and 0.036 µg/kg b.w./day (UB). When the consumers are considered, the average long-term intake of inorganic arsenic is between 0.049 and 0.099 µg/kg b.w./day (LB) or be-tween 0.064 and 0.127 µg/kg b.w./day (UB). For a discussion on the intake levels of inorgan-ic arsenic calculated based on the levels of total arsenic, please refer to section 3.3 “Further aspects”.

Seite 44 von 58
www.bfr.bund.de
Bundesinstitut für Risikobewertung
Table 30: Scenarios of long-term intake of inorganic arsenic based on exposure to total arsenic (total study population), µg/kg b.w./day
0.5–<1 year-old children LB UB
Scenario 1
100 % Scenario 2
70 % Scenario 3
50 % Scenario 1
100 % Scenario 2
70 % Scenario 3
50 %
Total rice N 95 95 95 95 95 95
Mean 0.028 0.020 0.014 0.036 0.025 0.018
P95 0.126 0.088 0.063 0.228 0.160 0.114
Table 31: Scenarios of long-term intake of inorganic arsenic based on exposure to total arsenic (consum-ers only), µg/kg b.w./day
0.5–<1 year-old children LB UB
Scenario 1
100 % Scenario 2
70 % Scenario 3
50 % Scenario 1
100 % Scenario 2
70 % Scenario 3
50 %
Total rice N 27 27 27 27 27 27
Mean 0.099 0.069 0.049 0.127 0.089 0.064
P95 0.377 0.264 0.189 0.393 0.275 0.197
3.1.4 Risk characterisation According to the exposure assessment carried out by the EFSA (2009), the total intake of inorganic arsenic through food for adults in Europe is 0.13 to 0.56 µg/kg b.w./day (median, UB 0.43 µg/kg b.w./day) when average consumption levels are assumed and is therefore in the lower range of the BMDL01 values of 0.3 to 8 µg/kg b.w./day derived from epidemiologi-cal studies. For people with special consumption habits (consumption of algae and algae products or particularly high rice consumption) the levels of inorganic arsenic can be two to ten times higher than the median. According to the EFSA (2009), “the estimated dietary ex-posures to inorganic arsenic for average and high level consumers in Europe are within the range of the BMDL01 values identified, and therefore there is little or no margin of exposure and the possibility of a risk to some consumers cannot be excluded”. According to the current exposure assessment of the EFSA (2014), the total intake of inor-ganic arsenic through food is lower than was assumed in previous opinions. For adults up to the age of 65 in Europe, an exposure level of 0.11 to 0.38 µg/kg b.w./day (min LB to max UB) for average consumption levels and 0.18 to 0.64 µg/kg b.w./day (min LB to max UB) for high consumption levels (P95) was calculated, which is at the lower end of the BMDL01 val-ues of 0.3 to 8 µg/kg b.w./day derived from epidemiological studies. The opinion of the FAO/WHO (2011) describes an exposure to inorganic arsenic through food of 0.1 to 3.0 µg/kg b.w./day in the USA and various European and Asian countries. The upper end of this also reaches the level of the BMDL0.5 for inorganic arsenic of 3 µg/kg b.w./day derived here. Sources of exposure other than food (outdoor air, smoking, direct intake via soil by children in areas with high levels of arsenic in the soil) form only a small part of the total exposure to inorganic arsenic in Europe (EFSA 2009) and can be disregarded in the risk characterisation.

Seite 45 von 58
www.bfr.bund.de
Bundesinstitut für Risikobewertung
The risk characterisation of this health assessment relies on exposure modelling based on data regarding the levels of inorganic arsenic in rice and rice products in the German market (LGL 2012 among others) as well as data on consumption behaviour of the German popula-tion taken from consumption studies for children (EsKiMo study28, VELS study29) and adults (NVS II30). For the potential carcinogenic effects of inorganic arsenic with long-term exposure, it is not yet possible to derive a value for a safe intake level in the sense of a tolerable daily intake (TDI) over a lifetime (EFSA 2009). The risk characterisation is therefore based on the Margin of Exposure concept (MOE concept31). The calculated estimated intake level of inorganic arsenic from rice and rice products is set based on the BMDL01 value range of 0.3 to 8 µg/kg b.w./day (EFSA 2009) as the toxicological reference value range. Due to the uncer-tainties associated with this, the BfR uses the lower value of this range for the risk character-isation, namely 0.3 µg/kg b.w./day. For the risk characterisation of potential non-carcinogenic effects of inorganic arsenic, a Minimal Risk Level (MRL) 32 value MRLchronic of 0.3 µg/kg b.w./day was used as the toxico-logical limit value for long-term exposure and an MRLacute value of 5 µg/kg b.w./day as the toxicological limit value for short-term exposure (ATSDR 2007). Long-term exposure Rice and rice products (“total rice”) Calculation of MOE values Based on the BMDL01 values of 0.3 to 8 µg/kg b.w./day, MOE values of 37 to 1000 (average consumption levels) and 12 to 320 (high consumption levels [P95]) are calculated for expo-sure to inorganic arsenic in adults through the consumption of rice and rice products when all respondents are considered (Table 32). In the group of consumers, the long-term exposure to inorganic arsenic through the con-sumption of rice and rice products calculated for adults as part of this opinion is 0.009 (aver-age consumption levels) to 0.027 µg/kg b.w./day (P95 of consumption levels) (Table 19). This results in MOE values of 11 to 88933 (Table 33). For children, the MOE values are lower (Table 33). This will be addressed in the followings-ection.
Looking at exposure based on the BMDL01 value range of 0.3 to 8 µg/kg b.w./day for the to-tal study population, the resulting MOE values for children aged 1 to 17 are 12 to 500 (av-erage consumption levels) and 3 to 143 (high consumption levels [P95]) (Table 32).
28 Nutrition study as a KiGGS module, KiGGS: German Health Interview and Examination Survey for Children and Adolescents (Mensink et al. 2007) 29 Consumption study to determine food intake of infants and young children for assessing an acute toxicity risk from residues of plant protection products (Heseker et al. 2003, Banasiak et al. 2005) 30German National Nutrition Survey II (NVS II) (Max Rubner Institute [MRI] 2008) 31 MOE concept, the Margin of Exposure (MOE) gives the relationship between a defined point on the dose-effect curve for an adverse effect of a substance and the modelled exposure for certain population groups as a dimensionless number. The MOE does not imply any conclusions regarding a “safe” intake level in the sense of a tolerable daily intake (Alexander et al. 2012) 32 Minimal Risk Level (MRL): Estimated value of daily exposure to a substance that probably poses no significant risk of an adverse health effect in humans (non-carcinogenic effect) for a certain exposure period (ATSDR 2007). 33 The MOE values are calculated based on the value range of the BMDL01 values of 0.3 to 8 µg/kg b.w./day derived by the EFSA (2009).

Seite 46 von 58
www.bfr.bund.de
Bundesinstitut für Risikobewertung
For children in the youngest age group studied (ages 0.5 to 1) the MOE values are in the range of 9 to 235 (average consumption levels) and 2 to 47 (high consumption levels [P95]). When modelling long-term exposure to inorganic arsenic through the consumption of rice and rice products in the group of consumers, the average intake for children aged 1 to 11 (0.046–0.056 µg/kg b.w./day) is around 5 times higher than in adults (0.009 µg/kg b.w./day). For children in the studied age groups up to 11 years old, intake levels of inorganic arsenic through the consumption of rice and rice products were reached for which the lower end of the resulting MOE values is less than 10 (Table 33, group of consumers, average and high consumption [P95]). For average consumption levels, the MOE values for these age groups lie in the range of 5 to 195, for high consumption levels (P95) in the range of 2 to 76. For younger children (0.5 to < 1 year old), the intake of inorganic arsenic through rice and rice products (0.113 µg/kg b.w./day) can exceed the corresponding values for adults by a factor of 12. For this age group, the lowest MOE values are also reached when the consum-ers are considered. This results in MOE values for this group of 3 to 71 at average consump-tion levels. For high consumption levels (P95), exposure is at the lower end of the BMDL01 values of 0.3 to 8 µg/kg b.w./day (MOE values 1 to 22). For adolescents aged 12 to 17, intake is twice as high as it is for adults (0.019 µg/kg b.w./day). Similar relationships are found when comparing exposure to inorganic arsenic in children and in adults at consumption levels in the 95th percentile. In summary, for children aged over 0.5 years and adults the intake levels of inorganic arse-nic through the consumption of rice and rice products when all respondents are considered is below the lower bound of the BMDL01 values. This results in comparatively low MOE values (for children with average consumption levels MOE values of 9 to 500, with high consumption levels [P95] MOE values of 2 to 143; for adults with average consumption levels [total study population] MOE values of 37 to 1,000, with high consumption levels MOE values of 12 to 320). For children aged 0.5 to <1 year, exposure to inorganic arsenic through the consumption of rice and rice products at high consumption levels (P95) in the group of consumers can reach the lower end of the BMDL01 values (MOE values 1 to 22).
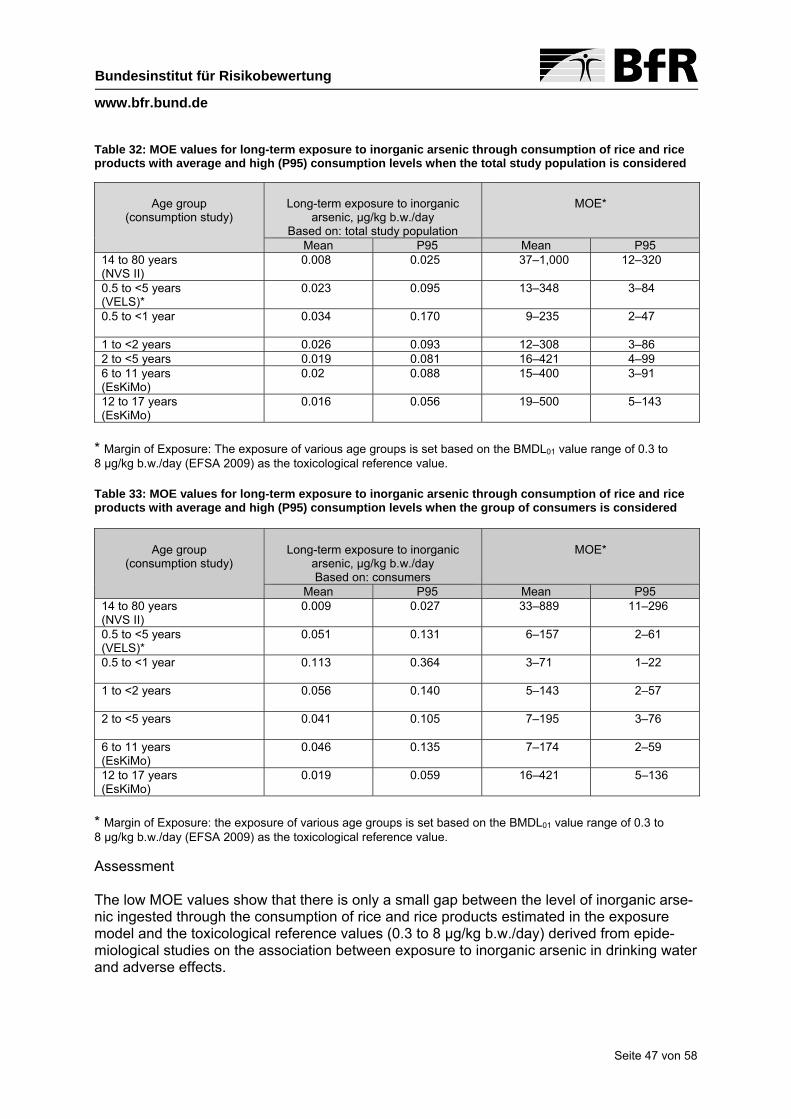
Seite 47 von 58
www.bfr.bund.de
Bundesinstitut für Risikobewertung
Table 32: MOE values for long-term exposure to inorganic arsenic through consumption of rice and rice products with average and high (P95) consumption levels when the total study population is considered
Age group
(consumption study)
Long-term exposure to inorganic
arsenic, µg/kg b.w./day Based on: total study population
MOE*
Mean P95 Mean P95 14 to 80 years (NVS II)
0.008 0.025 37–1,000 12–320
0.5 to <5 years (VELS)*
0.023 0.095 13–348 3–84
0.5 to <1 year
0.034 0.170 9–235 2–47
1 to <2 years 0.026 0.093 12–308 3–86 2 to <5 years 0.019 0.081 16–421 4–99 6 to 11 years (EsKiMo)
0.02 0.088 15–400 3–91
12 to 17 years (EsKiMo)
0.016 0.056 19–500 5–143
* Margin of Exposure: The exposure of various age groups is set based on the BMDL01 value range of 0.3 to 8 µg/kg b.w./day (EFSA 2009) as the toxicological reference value. Table 33: MOE values for long-term exposure to inorganic arsenic through consumption of rice and rice products with average and high (P95) consumption levels when the group of consumers is considered
Age group
(consumption study)
Long-term exposure to inorganic
arsenic, µg/kg b.w./day Based on: consumers
MOE*
Mean P95 Mean P95 14 to 80 years (NVS II)
0.009 0.027 33–889 11–296
0.5 to <5 years (VELS)*
0.051 0.131 6–157 2–61
0.5 to <1 year
0.113 0.364 3–71 1–22
1 to <2 years
0.056 0.140 5–143 2–57
2 to <5 years
0.041 0.105 7–195 3–76
6 to 11 years (EsKiMo)
0.046 0.135 7–174 2–59
12 to 17 years (EsKiMo)
0.019 0.059 16–421 5–136
* Margin of Exposure: the exposure of various age groups is set based on the BMDL01 value range of 0.3 to 8 µg/kg b.w./day (EFSA 2009) as the toxicological reference value. Assessment The low MOE values show that there is only a small gap between the level of inorganic arse-nic ingested through the consumption of rice and rice products estimated in the exposure model and the toxicological reference values (0.3 to 8 µg/kg b.w./day) derived from epide-miological studies on the association between exposure to inorganic arsenic in drinking water and adverse effects.

Seite 48 von 58
www.bfr.bund.de
Bundesinstitut für Risikobewertung
The low MOE values mean that reducing the exposure to inorganic arsenic from rice and rice products in consumers of all age groups is of high priority. Exhaustion of MRLchronic and assessment For the assessment of potential non-carcinogenic effects of long-term exposure to inorgan-ic arsenic, the MRLchronic of 0.3 µg/kg b.w./day (ATSDR 2007) is used. As described in the preceding sections, adults and children aged one year and above do not reach this value through the consumption of rice and rice products alone according to the exposure model for long-term intake. According to the model for long-term exposure, health impairments related to the non-carcinogenic effects of the intake of inorganic arsenic from the consumption of rice and rice products alone are unlikely for the population groups considered here34. This is in accord-ance with the opinion of the LGL (2012). Based on the consumption data from the VELS study, children aged 0.5 to 1 year in the group of consumers can reach an intake level of 0.364 µg inorganic arsenic/kg b.w./day through the consumption of rice and rice products when a high level of consumption (P95) is assumed (Table 33). This result cannot be applied to the population as a whole. According to the exposure model of the EFSA (2014), the long-term intake of inorganic arse-nic from all food in children aged between one and less than three years amounts to 0.39 to 1.00 µg/kg b.w./day (average consumption levels, median of exposure, LB-UB, Table 24 in EFSA 2014) and thus exceeds the MRLchronic of 0.3 µg/kg b.w./day for chronic exposure. The exposure assessment presented here shows that a notable proportion of this exposure can result from the consumption of rice and rice products alone35. According to the EFSA (2009), there is not necessarily a higher health risk for children as far as adverse effects due to long-term exposure are concerned, despite their higher exposure compared to adults. Epidemiological studies show health impairments following the long-term intake of drinking water with high levels of inorganic arsenic. There are only a few studies (e.g. Melkonian et al. 2013; Liao et al. 2008) on the association between health impairments and the intake of in-organic arsenic through foods other than drinking water. With regard to the intake of inorgan-ic arsenic through the consumption of rice, an epidemiological study in Bangladesh found an association with health effects (skin lesions) in people with low exposure to inorganic arsenic in drinking water (<100 µg/L) (Melkonian et al. 2013). The average rice consumption level in this study was 1628 g/day. For Germany, no association is yet known between health im-pairments and the intake of inorganic arsenic through rice consumption. Rice products alone The levels of inorganic arsenic in some rice products, such as rice cakes (mean 0.260 mg/kg, P95 425 mg/kg), can be significantly greater than the levels found in grains of rice (mean 0.104 mg/kg, P95 207 mg/kg) .
34 Children and adults who rely on a gluten-free diet for medical reasons could not be considered in the exposure model. 35 MRLchronic exhaustion of at least 1/10 by consumers of rice and rice products is classed as a “notable proportion” and is achieved by the following consumer groups: adults and adolescents (ages 12-17) with high consumption (P95) (consumers); adolescents (ages 12-17) with high consumption also in the total study population; children (ages 6-11) and young children (0.5 to <5) with high consumption (P95) (total study population) and average consumption (consumers).

Seite 49 von 58
www.bfr.bund.de
Bundesinstitut für Risikobewertung
When exposure to inorganic arsenic through the consumption of certain rice products is con-sidered separately, there are already significant to high intake levels of inorganic arsenic. Calculation of MOE values Long-term high consumption (P95) of rice snacks alone can lead to an intake of inorganic arsenic in the group of adult consumers which, at 0.084 µg/kg b.w./day (Table 19, 34), amounts to more than a tenth of the lower bound of the BMDL01 values (MOE values 4–95, Table 34). According to the present exposure model, adults in the group of consumers of rice snacks ingest more inorganic arsenic through this food alone on average (0.016 µg/kg b.w./day) than the population ingests on average through rice consumption (0.009 µg/kg b.w./day, total study population). However, it should be taken into account that food in the “rice snacks” group was only consumed by a small percentage of the surveyed study popula-tion (<1 %) Consumers of rice cakes ingest four times as much inorganic arsenic through this rice prod-uct alone than the total intake of inorganic arsenic in all respondents (at average consump-tion levels [9.7 g/d corresponding to approx. one rice cake per day] 0.04 µg inorganic arse-nic/kg b.w./day; at high consumption levels [P95] [30 g/day corresponding to approx. 4 rice cakes per day] 0.125 µg inorganic arsenic/kg b.w./day, Table 19, 34). For consumers of rice cakes, this results in MOE values of 8 to 200 at average consumption levels and 2 to 64 at high consumption levels (P95) (Table 34). It should also be considered for the interpretation of these results that rice cakes were only consumed by a small percentage of the surveyed study population (1.5%). However, intake of inorganic arsenic through the consumption of rice flour and rice starch is less significant in the adult population, even for consumers of these foods (MOE values for average consumption levels 300 to 8000, for high consumption levels [P95] 150 to 4,000).

Seite 50 von 58
www.bfr.bund.de
Bundesinstitut für Risikobewertung
Table 34: MOE values based on the group of consumers for long-term exposure of adults to inorganic arsenic through consumption of specific rice products with medium and high (P95) consumption levels
Rice product
Long-term exposure to inorganic arsenic, µg/kg b.w./day
Basis: Consumers
MOE*
Mean P95 Mean P95 Snacks with rice (sweet/savoury)
0.016 0.084 19–500 4–95
Rice cakes 0.040 0.125 8–200 2–64 Rice flour, rice starch 0.001 0.002 300–8000 150–4000
* Margin of Exposure is calculated based on the BMDL01 value range of 0.3 to 8 µg/kg b.w./day (EFSA 2009) and the exposure of various age groups. The exposure estimate for children and adolescents included the products snacks with rice, rice cakes, rice flour and rice starch (for children and adolescents between 6 and 17 years), rice pudding (for children from 6 months to < 5 years) and instant rice-based baby food (for children from 6 months to < 5 years). For the product group Snacks with rice, children aged between 1 and < 2 years reach the highest intake level of inorganic arsenic in proportion to their body weight (0.032 µg/kg b.w./day with medium consumption levels; 0.078 µg/kg b.w./day with high consumption levels [P95] in the consumer group). In relation to the BMDL01 values of 0.3 to 8 µg/kg b.w./day, this corresponds to MOE values of 9 to 250 (average consumption levels) and 4 to 103 (high consumption levels, P95). When all respondents are considered, MOE values in the range of 20 – 8,000 are derived for the “Snacks with rice” product group for children of all surveyed age groups and consumption levels. In the consideration of high consumption levels for children (P95, 0.018 µg/kg b.w./day for 6 to 11 year-old children and 0.011 µg/kg b.w./day for 12 to 17 year-old adolescents, basis: only consumers), low MOE values (17 to 727) are also determined for the exposure to inor-ganic arsenic through the consumption of rice flour and rice starch. No data on the con-sumption of these rice products are available for younger children. In children aged from 6 months to < 5 years, the consumption of rice pudding can also make a significant contribution to the exposure to inorganic arsenic. With the consumption of rice pudding, children aged between 6 months and < 1 year reach intake levels that corre-spond to MOE values from 5 to 127 with average consumption (0.063 µg/kg b.w./day, basis: consumers) and MOE values from 2 to 59 with high consumption (P95, 0.136 µg/kg b.w./day, basis: consumers). When all respondents are considered, MOE values in the range from 8 to 2,000 for rice pudding are determined for children of all surveyed age groups and consumption levels. In the interpretation of the results, the fact that the results for high consumption levels (P95) are skewed towards the maximum in the consideration of the consumers due to the low sample size should be taken into account. Furthermore, the exposure estimate for rice pud-ding was based on the assumption that the level of inorganic arsenic was equal to the detec-tion limit, since no contents above the detection limit were reported. For children, the highest intake of inorganic arsenic through the consumption of rice products came from the consumption of rice cakes and instant rice-based baby food.
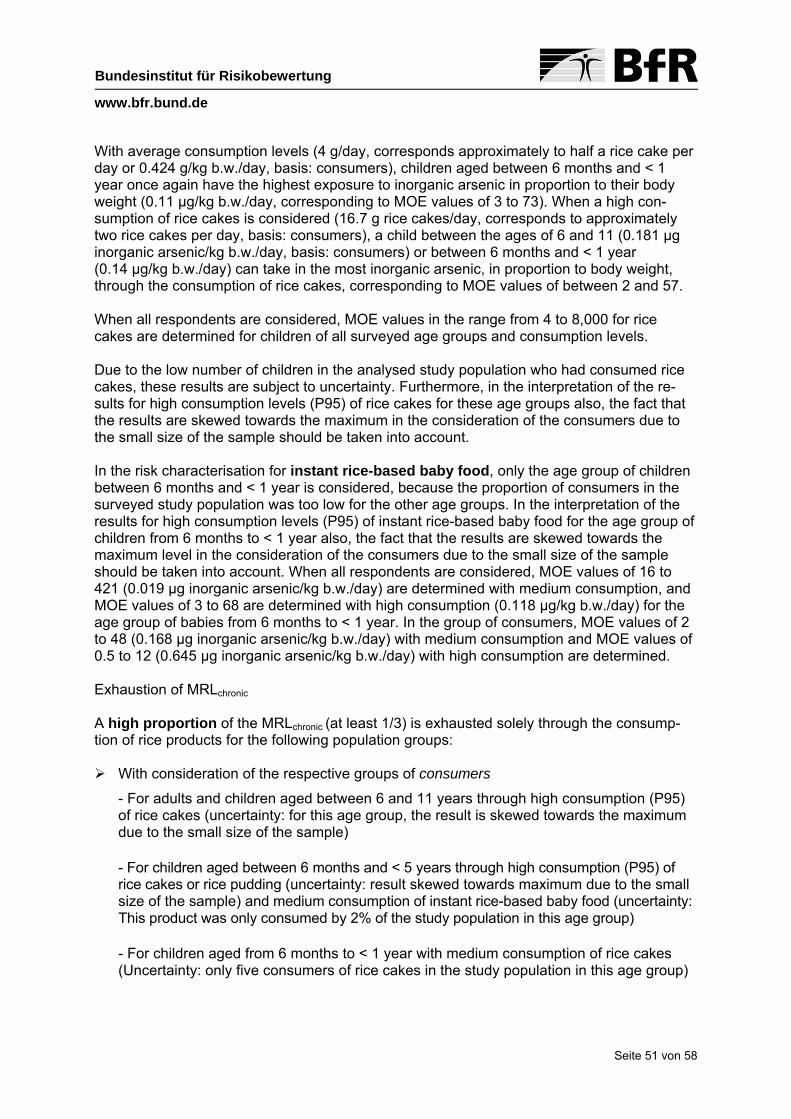
Seite 51 von 58
www.bfr.bund.de
Bundesinstitut für Risikobewertung
With average consumption levels (4 g/day, corresponds approximately to half a rice cake per day or 0.424 g/kg b.w./day, basis: consumers), children aged between 6 months and < 1 year once again have the highest exposure to inorganic arsenic in proportion to their body weight (0.11 µg/kg b.w./day, corresponding to MOE values of 3 to 73). When a high con-sumption of rice cakes is considered (16.7 g rice cakes/day, corresponds to approximately two rice cakes per day, basis: consumers), a child between the ages of 6 and 11 (0.181 µg inorganic arsenic/kg b.w./day, basis: consumers) or between 6 months and < 1 year (0.14 µg/kg b.w./day) can take in the most inorganic arsenic, in proportion to body weight, through the consumption of rice cakes, corresponding to MOE values of between 2 and 57. When all respondents are considered, MOE values in the range from 4 to 8,000 for rice cakes are determined for children of all surveyed age groups and consumption levels. Due to the low number of children in the analysed study population who had consumed rice cakes, these results are subject to uncertainty. Furthermore, in the interpretation of the re-sults for high consumption levels (P95) of rice cakes for these age groups also, the fact that the results are skewed towards the maximum in the consideration of the consumers due to the small size of the sample should be taken into account. In the risk characterisation for instant rice-based baby food, only the age group of children between 6 months and < 1 year is considered, because the proportion of consumers in the surveyed study population was too low for the other age groups. In the interpretation of the results for high consumption levels (P95) of instant rice-based baby food for the age group of children from 6 months to < 1 year also, the fact that the results are skewed towards the maximum level in the consideration of the consumers due to the small size of the sample should be taken into account. When all respondents are considered, MOE values of 16 to 421 (0.019 µg inorganic arsenic/kg b.w./day) are determined with medium consumption, and MOE values of 3 to 68 are determined with high consumption (0.118 µg/kg b.w./day) for the age group of babies from 6 months to < 1 year. In the group of consumers, MOE values of 2 to 48 (0.168 µg inorganic arsenic/kg b.w./day) with medium consumption and MOE values of 0.5 to 12 (0.645 µg inorganic arsenic/kg b.w./day) with high consumption are determined. Exhaustion of MRLchronic A high proportion of the MRLchronic (at least 1/3) is exhausted solely through the consump-tion of rice products for the following population groups: With consideration of the respective groups of consumers
- For adults and children aged between 6 and 11 years through high consumption (P95) of rice cakes (uncertainty: for this age group, the result is skewed towards the maximum due to the small size of the sample)
- For children aged between 6 months and < 5 years through high consumption (P95) of rice cakes or rice pudding (uncertainty: result skewed towards maximum due to the small size of the sample) and medium consumption of instant rice-based baby food (uncertainty: This product was only consumed by 2% of the study population in this age group)
- For children aged from 6 months to < 1 year with medium consumption of rice cakes (Uncertainty: only five consumers of rice cakes in the study population in this age group)
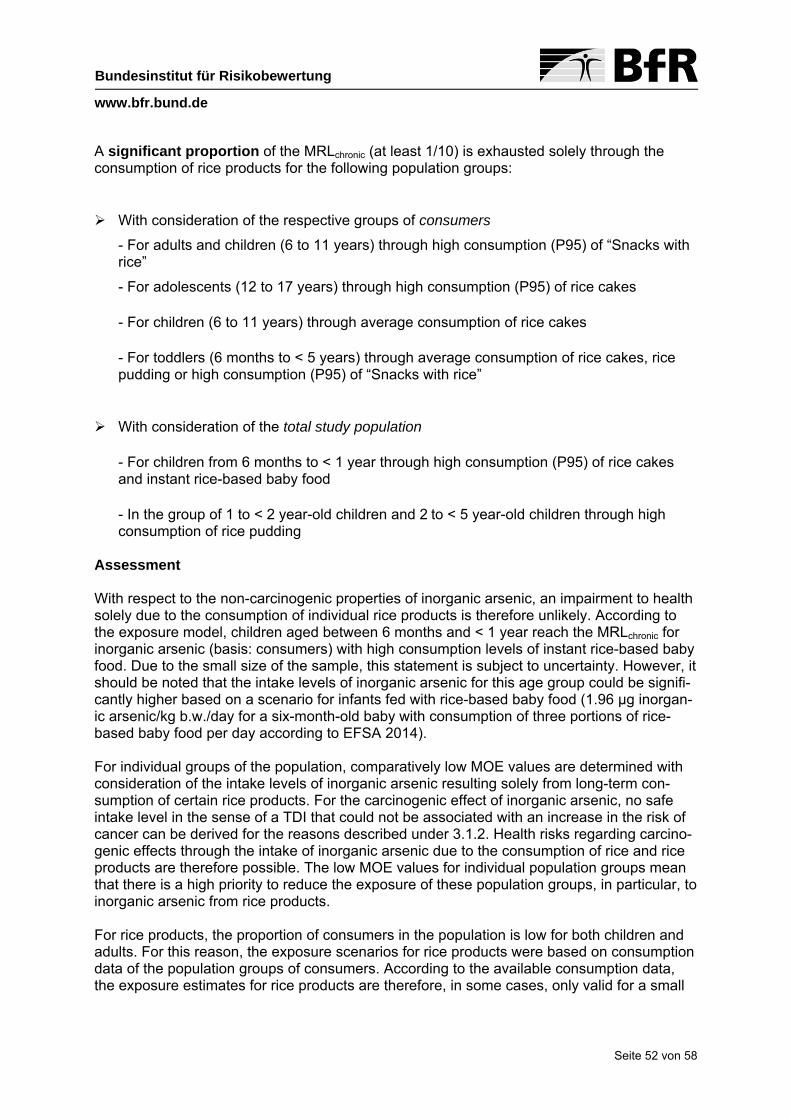
Seite 52 von 58
www.bfr.bund.de
Bundesinstitut für Risikobewertung
A significant proportion of the MRLchronic (at least 1/10) is exhausted solely through the consumption of rice products for the following population groups:
With consideration of the respective groups of consumers
- For adults and children (6 to 11 years) through high consumption (P95) of “Snacks with rice”
- For adolescents (12 to 17 years) through high consumption (P95) of rice cakes
- For children (6 to 11 years) through average consumption of rice cakes
- For toddlers (6 months to < 5 years) through average consumption of rice cakes, rice pudding or high consumption (P95) of “Snacks with rice”
With consideration of the total study population
- For children from 6 months to < 1 year through high consumption (P95) of rice cakes and instant rice-based baby food
- In the group of 1 to < 2 year-old children and 2 to < 5 year-old children through high consumption of rice pudding
Assessment With respect to the non-carcinogenic properties of inorganic arsenic, an impairment to health solely due to the consumption of individual rice products is therefore unlikely. According to the exposure model, children aged between 6 months and < 1 year reach the MRLchronic for inorganic arsenic (basis: consumers) with high consumption levels of instant rice-based baby food. Due to the small size of the sample, this statement is subject to uncertainty. However, it should be noted that the intake levels of inorganic arsenic for this age group could be signifi-cantly higher based on a scenario for infants fed with rice-based baby food (1.96 µg inorgan-ic arsenic/kg b.w./day for a six-month-old baby with consumption of three portions of rice-based baby food per day according to EFSA 2014). For individual groups of the population, comparatively low MOE values are determined with consideration of the intake levels of inorganic arsenic resulting solely from long-term con-sumption of certain rice products. For the carcinogenic effect of inorganic arsenic, no safe intake level in the sense of a TDI that could not be associated with an increase in the risk of cancer can be derived for the reasons described under 3.1.2. Health risks regarding carcino-genic effects through the intake of inorganic arsenic due to the consumption of rice and rice products are therefore possible. The low MOE values for individual population groups mean that there is a high priority to reduce the exposure of these population groups, in particular, to inorganic arsenic from rice products. For rice products, the proportion of consumers in the population is low for both children and adults. For this reason, the exposure scenarios for rice products were based on consumption data of the population groups of consumers. According to the available consumption data, the exposure estimates for rice products are therefore, in some cases, only valid for a small

Seite 53 von 58
www.bfr.bund.de
Bundesinstitut für Risikobewertung
proportion of consumers in the population. The corresponding conclusions are therefore not to be applied to the general population. In particular, the current consumption behaviour of the population regarding rice cakes may be underestimated by the consumption data.36 Because the exposure estimate was also car-ried out based on the consideration of the “consumers”, this possible underestimation does not affect this assessment, as far as it only affects the proportion of consumers in the popula-tion and not the intake levels. Nevertheless, the BfR recommends updating the consumption data, especially for rice cakes. Short-term exposure At 0.123 µg/kg b.w./day with high consumption levels (P95), the short-term exposure to inor-ganic arsenic through the consumption of grains of rice (Table 20) estimated based on the 24-hour recall logs of the NVS II for adults (basis: only consumers) is below the toxicological limit value for short-term exposure to inorganic arsenic (MRLacute 5 µg/kg b.w./day [ATSDR 2007]). The same applies to the short-term intake levels of inorganic arsenic for children aged between 6 months and < 5 years (basis: only consumers) (high consumption levels [P95] 0.441 µg/kg b.w./day; Table 24) estimated based on the consumption data of the VELS study. Impairments to health through the intake of inorganic arsenic due to short-term sole high consumption of rice and rice products are therefore unlikely according to the available expo-sure model. However, with separate consideration of individual age groups, children can exhaust a com-paratively high proportion of the MRLacute of 5 µg/kg b.w./day through short-term high con-sumption of rice or sole short-term high consumption (P95) of certain rice products, accord-ing to the model for short-term exposure. With short-term high consumption of grains of rice, the exposure for children aged from 1 < 2 years is 0.549 µg/kg b.w./day (basis: only consumers) and thus exhausts 11% of the MRLacute. Short-term high consumption of rice cakes as the only consumed rice product can exhaust one tenth of the MRLacute for children aged from 6 months to < 5 years (0.53 µg/kg b.w./day) and consumption of rice pudding in children aged from 1 to < 2 years could exhaust nearly one fifth of the MRLacute (0.842 µg/kg b.w./day). Nevertheless, even in the case of consumption of several of the analysed products for the studied age groups, levels above the MRLacute are not to be expected. Uncertainties Only a relatively small number of rice products were included in the exposure estimate, be-cause usable data on occurrence and consumption levels were only available for these products. For example, rice-based drinks (rice milk) and ready meals with rice, including those for children (jars of baby food) could not be included. Another uncertainty results from the fact that the consumption surveys did not necessarily record whether a food (e.g. baby food, cereal porridge) contained rice. The consumption of products containing rice may therefore be underestimated in the exposure estimate. In particular, the current consumption
36 In light of the large number of products available today (cf. ÖKO-TEST 06/2012), it is possible that the current proportion of consumers of rice cakes in the population may be under-represented in the consumption studies and that the consumption level may have increased in recent years.

Seite 54 von 58
www.bfr.bund.de
Bundesinstitut für Risikobewertung
behaviour of the population regarding rice cakes may not be represented by the consumption data. In light of the large number of products available today (cf. ÖKO-TEST 06/2012), it is possible that the current proportion of consumers of rice cakes in the population may be un-der-represented in the consumption studies and that the consumption level may have in-creased in recent years. Depending on the arsenic levels in the water used for preparation of the rice, levels in cooked rice may be higher or lower than in raw rice. In Germany, drinking water can general-ly be assumed to contain low levels of arsenic. Therefore, due to this uncertainty, an overes-timation of exposure to inorganic arsenic from the consumption of rice is more likely than an underestimation. This could not be taken into consideration in this exposure estimate. The BfR intends to conduct a Total Diet Study (TDS) for which the analysis of levels of inorganic arsenic in prepared food items has also been requested. Since a TDS measures levels in prepared food items, the results can reduce the uncertainties described above. Persons who can be assumed to consume particularly high levels of rice and rice products because of their medical need for a gluten-free diet are not included in this exposure esti-mate. A further uncertainty results from the fact that organic arsenic compounds are not considered in the exposure estimate used for the risk characterisation. According to a recent report from the U.S. Food and Drug Administration (FDA) (2012)37 on arsenic levels in rice and rice products, inorganic arsenic and dimethylarsinic acid (DMA) in various concentrations, as well as traces of methylarsonic acid (MA), were detected in the almost 200 tested samples. The BfR recommends analysing not only levels of inorganic arsenic, but also levels of organic arsenic compounds in rice and rice products. 3.2 Framework for action A high priority for reducing the exposure of consumers in all age groups results from the low MOE values concerning the possible carcinogenic effects of inorganic arsenic with long-term intake. Particular attention should be paid to the low MOE values that are determined in the sole consideration of exposure to individual rice products of specific groups of the population. The BfR therefore recommends investigating possibilities for reducing the exposure to inor-ganic arsenic through the consumption of rice and rice products and examining the reasons for the comparatively high levels of inorganic arsenic in certain rice products, particularly rice cakes. The EFSA opinion (2014) also refers to the unusually high levels of inorganic arsenic in rice cakes (Table 7). It is unclear whether these levels can be attributed to, for example, higher levels in the raw materials used to produce the rice products, specific manufacturing processes, or other causes. The BfR recommends analysing not only levels of inorganic ar-senic, but also total arsenic or levels of organic arsenic compounds. In addition, the EFSA opinion (2014) points out that infants who are fed with rice-based baby food could take in 1.96 µg inorganic arsenic/kg b.w./day through this food. On the initiative of the BfR, levels of inorganic arsenic and total arsenic in rice cakes and rice-based baby food will be analysed within the scope of national and federal state food monitoring as part of Project 7 “Total arsenic and inorganic arsenic in rice and in specific rice products” (project monitoring 2014).
37 FDA releases preliminary data on arsenic levels in rice and rice products, report from 19 September 2012, http://www.fda.gov/NewsEvents/Newsroom/PressAnnouncements/ucm319972.htm
Seite 55 von 58
www.bfr.bund.de
Bundesinstitut für Risikobewertung
3.3 Further aspects In parallel to the exposure estimate based on the levels of inorganic arsenic in rice and rice products, an exposure estimate based on the data provided from food monitoring between 2000 and 2012 on levels of total arsenic in rice and rice products was conducted. This expo-sure estimate comprised a scenario assuming a proportion of inorganic arsenic in total arse-nic of 100%. Thus, all arsenic detected in a food item, including organic arsenic compounds, was considered in the assessment. This may result in an overestimation of the exposure to inorganic arsenic. On the other hand, the larger number of samples allows a separate evalu-ation of white and brown rice with this exposure estimate. For white rice, the mean value for total arsenic (0.14 mg/kg) is between the mean value (0.10 mg/kg) and 95th percentile (0.21 mg/kg) for inorganic arsenic in grains of rice. For brown rice, the mean value for the levels of total arsenic (0.22 mg/kg) is within the range of the 95th percentile of the levels of inorganic arsenic (0.20 mg/kg). For “Snacks with rice”, the mean value for the levels of total arsenic (0.07–0.1 mg/kg) is in the range of the mean value (0.05 mg/kg) and the 95th percentile (0.12 mg/kg) of the levels of inorganic arsenic. For ce-real porridge, the mean value for the levels of total arsenic (LB-UB 0.05–0.07 mg/kg) is be-low the mean value for inorganic arsenic (0.12 mg/kg). Only for rice pudding are the mean values for the levels of total arsenic (UB 0.04 mg/kg) higher than the 95th percentile of the levels of inorganic arsenic (0.02 mg/kg). Accordingly, the exposure estimate for total arsenic shows intake levels in a similar range to the exposure estimate based on levels of inorganic arsenic. In line with the EFSA procedure (2009), an exposure estimate of the long-term intake of inorganic arsenic through the con-sumption of rice and rice products was carried out by way of example for children aged from 1 to < 2 years based on scenarios for proportions of inorganic arsenic of 50%, 70% and 100%38. This estimate supplies mean values for the intake level of inorganic arsenic of 0.014 to 0.041 µg/kg b.w./day, and therefore correlates well with the mean value of the exposure estimate based on the measured levels of inorganic arsenic of 0.026 µg/kg b.w./day for the same age group. More information on this topic on the BfR website Supplement EU maximum levels for inorganic arsenic in rice and rice products through con-sumption recommendations for the protection of infants, toddlers and children BfR Opinion No. 017/2015 dated 6 February 2014 https://www.bfr.bund.de/cm/349/supplement-eu-maximum-levels-for-inorganic-arsenic-in-rice-and-rice-products-through-consumption-recommandations-for-the-protection-of-infants-toddlers-and-children.pdf Questions and answers on arsenic levels in rice and rice products FAQ of the BfR dated 11 June 2015 https://www.bfr.bund.de/en/frequently_asked_questions_on_arsenic_levels_in_rice_and_rice_products-194425.html BfR “Opinions app”
38 Total study population

Seite 56 von 58
www.bfr.bund.de
Bundesinstitut für Risikobewertung
4 References Alexander J, Benford D, Boobis A, Eskola M, Fink-Gremmels J, Fürst P, Heppner C, Schlat-ter J, van Leeuwen R (2012) Risk assessment of contaminants in food and feed. EFSA Jour-nal 10 (10), 1004. Available online under http://www.efsa.europa.eu/efsajournal (last ac-cessed on 07 Jan. 2013) ATSDR (Agency for Toxic Substances and Disease Registry) (2007) Toxicological profile for arsenic. U.S. Department of Health and Human Services, Public Health Service. Atlanta, GA Banasiak U, Heseker H, Sieke C, Sommerfeld C, Vohmann C (2005) Abschätzung der Auf-nahme von Pflanzenschutzmittel-Rückständen in der Nahrung mit neuen Verzehrsmengen für Kinder. Bundesgesundheitsbl – Gesundheitsforsch – Gesundheitsschutz, 1: 48: 84–98 Bogdan K, Schenk MK (2009) Evaluation of soil characteristics potentially affecting arsenic concentration in paddy rice (Oryza sativa L.). Environ Pollution, 157: 2617–2621 Chen CL (2010) Ingested arsenic, characteristics of well water consumption and risk of dif-ferent histological types of lung cancer in northeastern Taiwan. Environmental Research, 110 (5): 455–462 D’Amato M, Forte G, Caroli S (2004) Identification and quantification of major species of ar-senic in rice. AOAC, 87 (1): 238–243 EFSA Panel on Contaminants in the Food Chain (CONTAM) (2009) Scientific opinion on arsenic in food. EFSA Journal, 7 (10): 1351. [199 pp.]. doi:10.2903/j.efsa.2009.1351. Availa-ble online under: http://www.efsa.europa.eu/de/efsajournal/doc/1351.pdf (last accessed on 19 Sept. 2012) EFSA Panel on Contaminants in the Food Chain (CONTAM) (2014) Dietary exposure to in-organic arsenic in the European population. EFSA Journal, 12 (3): 3597. [68 pp]. doi: 10.2903/j.efsa.2014.3597. Available online under: http://www.efsa.europa.eu/de/efsajournal/doc/3597.pdf (last accessed on 03 June 2014) FAOSTAT Food and Agriculture Organization of the United Nations, Query on production volumes in 2010. http://faostat.fao.org/site/567/DesktopDefault.aspx?PageID=567 #ancor (last accessed on 25 Sept. 2012) Ferreccio C, González C, Milosavjilevic V, Marshall G, Sancha AM, Smith AH (2000) Lung cancer and arsenic concentrations in drinking water in Chile. Epidemiology, 11 (6): 673–679 Heseker H, Oeppining A, Vohmann C (2003) Verzehrsstudie zur Ermittlung der Lebensmittel-aufnahme von Säuglingen und Kleinkindern für die Abschätzung eines akuten Toxizitätsrisi-kos durch Rückstände von Pflanzenschutzmitteln (VELS). Forschungsbericht im Auftrag des Bundesministeriums für Verbraucherschutz, Ernährung und Landwirtschaft, Universität Pa-derborn IARC Monographs on the Evaluation of Carcinogenic Risks to Humans (2004) Some drink-ing-water disinfectants and contaminants, including arsenic. Arsenic in Drinking Water, 84. Available online under: http://monographs.iarc.fr/GGTSPU-argusgate01.bfr.bund.de-945-
Seite 57 von 58
www.bfr.bund.de
Bundesinstitut für Risikobewertung
527885-YVZr6eOSsL2n5Orh-DAT/ENG/Monographs/vol84/mono84-6.pdf (last accessed on 15 Nov. 2012) Jorhem L, Åstrand C, Sundström B, Baxter M, Stokes P, Lewis J, Grawé KP (2008) Ele-ments in rice from the Swedish market: 1. Cadmium, lead and arsenic (total and inorganic). Food Additives & Contaminants, 25: 284–292 Krems C, Bauch A, Götz A, Heuer T, Hild A, Möseneder J, Brombach C (2006) Methoden der Nationalen Verzehrsstudie II. Ernährungs-Umschau, 53, Heft 2 Liao C-M, Shen H-H, Lin T-L, Chen S-C, Chen C-L, Hsu L-I Chen C-J (2008) Arsenic cancer risk posed to human health from tilapia consumption in Taiwan. Ecotoxicology and Environ-mental Safety, 70: 27–37 Marquardt H, Schäfer S (Hrsg) (2004) Lehrbuch der Toxikologie. Wissenschaftliche Verlags-gesellschaft Stuttgart, 2. Auflage, ISBN 3-8047-1777-2 Max Rubner-Institut (MRI) (2008) Nationale Verzehrsstudie II (NVS II), Ergebnisbericht 1, 2 http://www.was-esse-ich.de/ Meharg AA, Sun G, Williams PN, Adomako E, Deacon C, Zhu YG, Feldmann J, Raab A (2008) Inorganic arsenic levels in baby rice are of concern. Environmental Pollution, 152 (3): 746–749 Melkonian S, Argos M, Hall MN, Chen Y, Parvez F, Pierce B, Cao H, Aschebrook-Kilfoy B, Ahmed A, Islam T, Slarvcovich V, Gamble M, Haris PI, Graziano JH, Ahsan H (2013) Urinary and dietary analysis of 18,470 Bangaladeshis reveal a correlation of rice consumption with arsenic exposure and toxicity. PLOS ONE, 8 (11): 1–10 Mensink GBM, Heseker H, Richter A, Stahl A, Vohmann C (2007) Forschungsbericht. Ernäh-rungsstudie als KiGGS-Modul (EsKiMo) Petrick JS, Ayala-Fierro F, Cullen WR, Carter DE, Aposhian HV (2000) Monomethylarsonous acid (MMAIII) is more toxic than arsenite in chang human hepatocytes. Toxicology and Ap-plied Pharmacology, 163: 203–207 Rahmann A, Vahter M, Smith AH, Nermell B, Yunus M, El Arifeen S, Persson LA, Ekstrom EC (2009) Arsenic exposure during pregnancy and size at birth: a prospective cohort study in Bangladesh. American Journal of Epidemiology, 169 (3): 304–312 Roy P, Orikasa T, Okadome H, Nakamura N, Shiina T (2011) Processing conditions, rice properties, health and environment. Int J Environ Res Public Health, 8 (6): 1957–1976 Sengupta MK, Hossain MA, Mukherjee A, Ahamed S, Das B, Nayak B, Pal A, Chakraborti D (2006) Arsenic burden of cooked rice: traditional and modern methods. Food Chem Tox, 44 (11): 1823–1829 Spanu A, Daga L, Orlandoni AM, Sanna G (2012) The role of irrigation techniques in arsenic bioaccumulation in rice (Oryza sativa L.). Environ Sci Technol, 46: 8333–8340 Ternes W, Täufel A, Tunger L, Zobel M (Hrsg) (2005) Lebensmittel-Lexikon, 4. Auflage 2005, ISBN 3-89947-165-2, B. Behr’s Verlag GmbH & Co. KG, Hamburg
Seite 58 von 58
www.bfr.bund.de
Bundesinstitut für Risikobewertung
Torres-Escribano S, Leal M, Vélez D, Montoro R (2008) Total and inorganic arsenic concen-trations in rice sold in Spain, effect of cooking, and risk assessments. Environ Sci Technol, 42 (10): 3867–3872 WHO/FAO (World Health Organization/Food and Agriculture Organization of the United Na-tions) (2001) Safety evaluation of certain contaminants in food. WHO Food Additives Series 63, FAO JECFA Monographs 8, available online under: http://whqlibdoc.who.int/publications/ 2011/9789241660631_eng.pdf (last accessed on 19 Sept. 2012) Ye XX, Sun B, Yin YL (2012) Variation of As concentration between soil types and rice geno-types and selection of cultivars for reducing As in the diet. Chemosphere, 87: 384–389 Zhu Y-G, Williams PN, Meharg AA (2008) Exposure to inorganic arsenic from rice: A global health issue? Environ Pollution, 154: 169–171
About the BfR
The German Federal Institute for Risk Assessment (BfR) is a scientifically independent insti-tution within the portfolio of the Federal Ministry of Food and Agriculture (BMEL) in Germany. It advises the Federal Government and Federal Laender on questions of food, chemical and product safety. The BfR conducts its own research on topics that are closely linked to its as-sessment tasks.
This text version is a translation of the original German text which is the only legally binding version.