ars.els-cdn.com · Web viewSupplementary Materials. Hollow Mo-doped CoP Nanoarrays for Efficient...
22
Supplementary Materials Hollow Mo-doped CoP Nanoarrays for Efficient Overall Water Splitting Cao Guan 1 , Haijun Wu 1 , Wen Xiao 1 , Ximeng Liu 1 , Wenjie Zang 1 , Hong Zhang 1 , Jun Ding 1 , Yuan Ping Feng 2 , Stephen J. Pennycook 1 , and John Wang 1 1 Department of Materials Science and Engineering, National University of Singapore, 117575 Singapore. 2 Department of Physics, National University of Singapore, 117542 Singapore.
Transcript of ars.els-cdn.com · Web viewSupplementary Materials. Hollow Mo-doped CoP Nanoarrays for Efficient...

Supplementary MaterialsHollow Mo-doped CoP Nanoarrays for Efficient Overall Water
Splitting
Cao Guan1, Haijun Wu1, Wen Xiao1, Ximeng Liu1, Wenjie Zang1, Hong Zhang1, Jun Ding1, Yuan Ping Feng2, Stephen J. Pennycook1, and John Wang1
1Department of Materials Science and Engineering, National University of Singapore, 117575 Singapore. 2Department of Physics, National University of Singapore, 117542 Singapore.
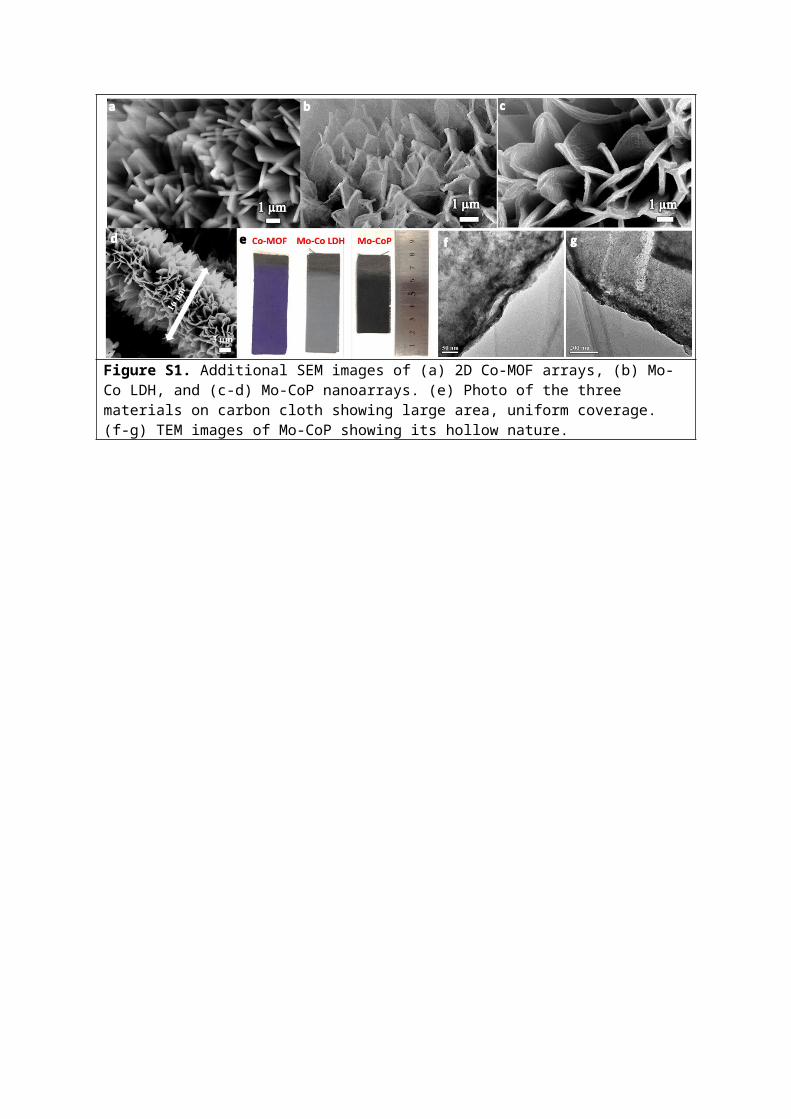
Figure S1. Additional SEM images of (a) 2D Co-MOF arrays, (b) Mo-Co LDH, and (c-d) Mo-CoP nanoarrays. (e) Photo of the three materials on carbon cloth showing large area, uniform coverage. (f-g) TEM images of Mo-CoP showing its hollow nature.

Figure S2. XPS broad scan of (a) Mo-CoP and (b) CoP.

Figure S3. Schematic fabrication process of Mo-CoP, CoP and Co3O4 from 2D Co-MOF arrays.

Figure S4. (a-b) SEM, (c) XRD, and (d) TEM results from hollow CoP nanoarrays on carbon cloth.
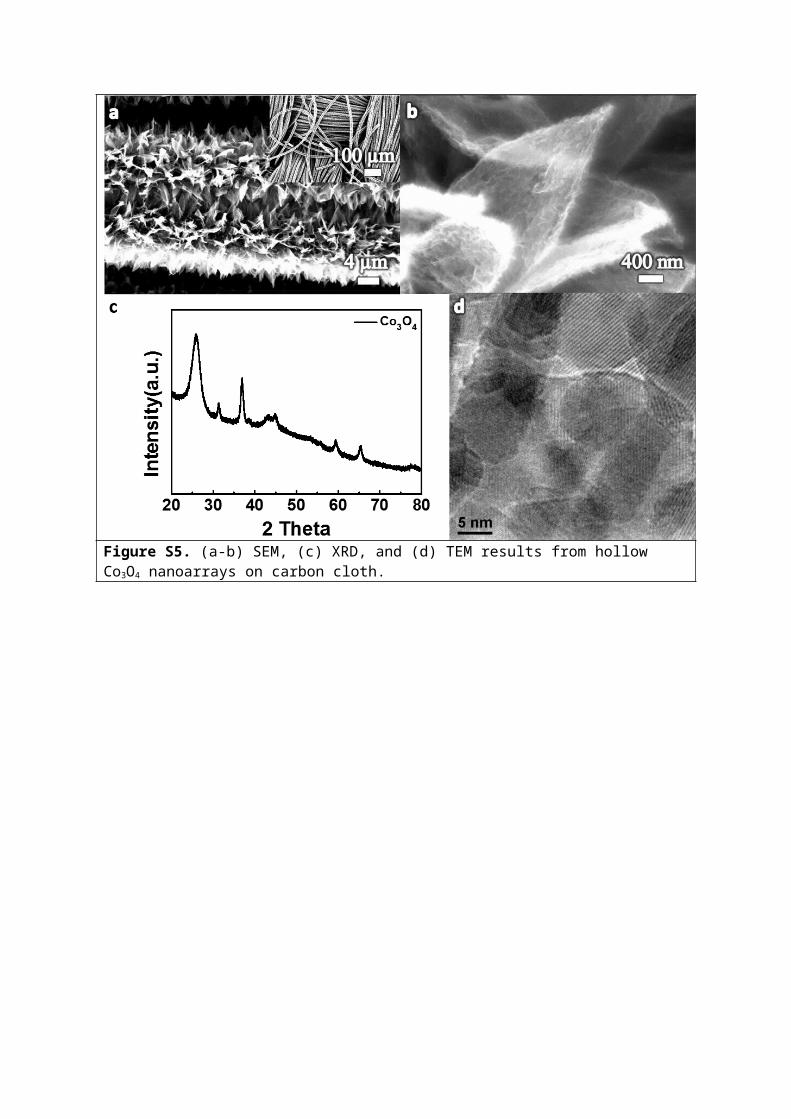
Figure S5. (a-b) SEM, (c) XRD, and (d) TEM results from hollow Co3O4 nanoarrays on carbon cloth.

Figure S6. HER properties of Mo-CoP and Pt/C in (a-b) acidic and (c-d) neutral electrolyte. (a, c) LSV curves, (b, d) stability test.
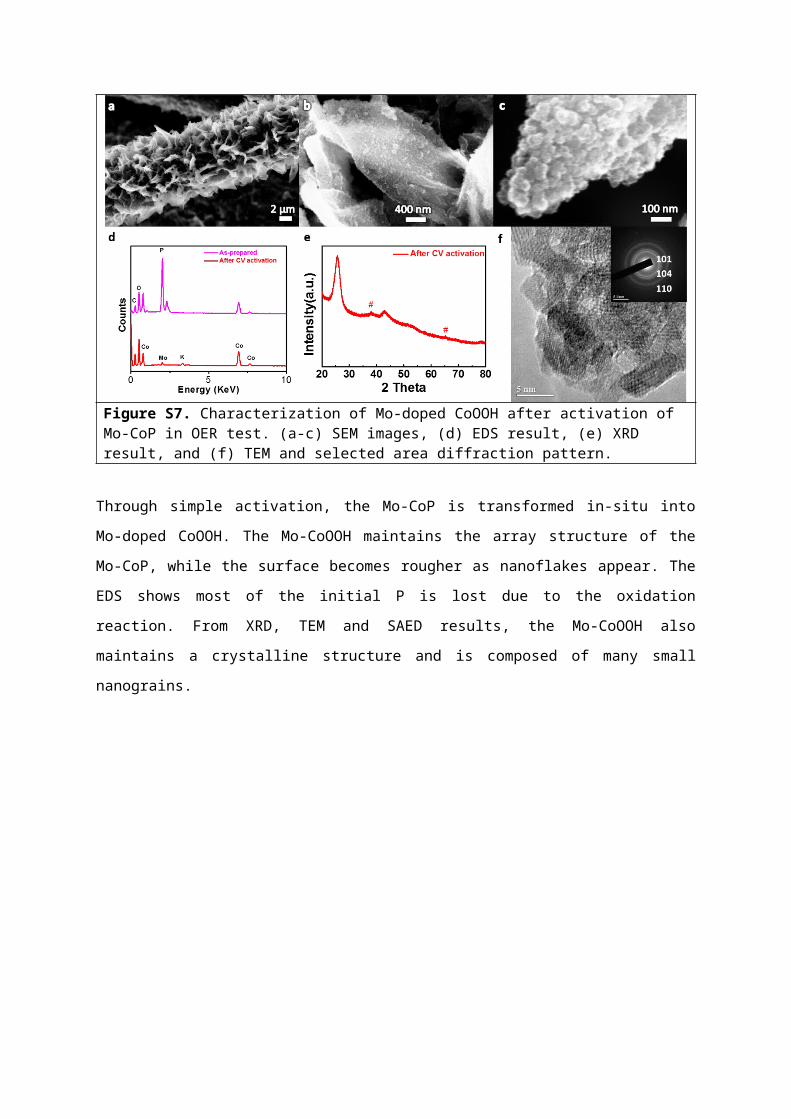
Figure S7. Characterization of Mo-doped CoOOH after activation of Mo-CoP in OER test. (a-c) SEM images, (d) EDS result, (e) XRD result, and (f) TEM and selected area diffraction pattern.
Through simple activation, the Mo-CoP is transformed in-situ into Mo-doped CoOOH. The Mo-
CoOOH maintains the array structure of the Mo-CoP, while the surface becomes rougher as
nanoflakes appear. The EDS shows most of the initial P is lost due to the oxidation reaction. From
XRD, TEM and SAED results, the Mo-CoOOH also maintains a crystalline structure and is composed of
many small nanograins.
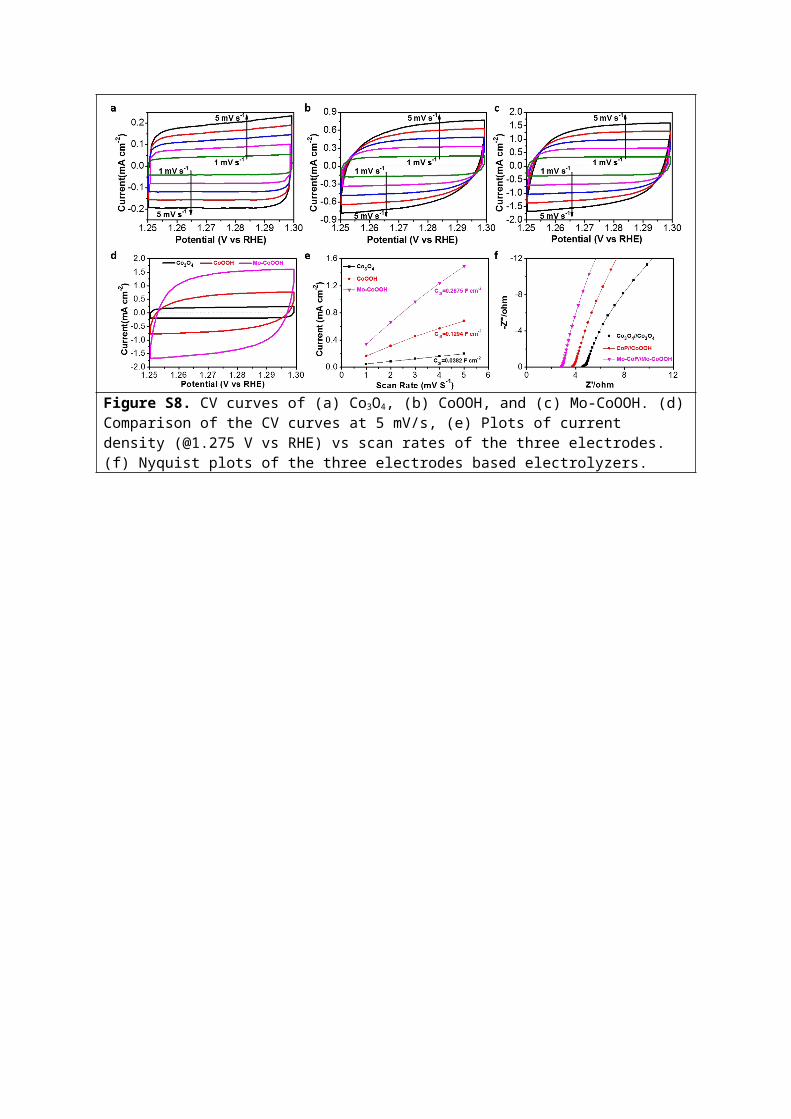
Figure S8. CV curves of (a) Co3O4, (b) CoOOH, and (c) Mo-CoOOH. (d) Comparison of the CV curves at 5 mV/s, (e) Plots of current density (@1.275 V vs RHE) vs scan rates of the three electrodes. (f) Nyquist plots of the three electrodes based electrolyzers.

Figure S9. Atomic structures of (a) CoP unit cell and (b-C) CoP (111) surface model.
CoP unit cell adopts a space group of Pnma with calculated lattice constants of a = 3.27 Å, b = 5.07
Å and c = 5.56 Å as shown in Figure S8a. CoP (111) surface model of 1×1 lateral cell was built as
seen in Figure S8b-c.[1] A vacuum slab of 10 Å in thickness was applied to prevent interaction
between two neighboring surfaces. Five top-most atomic layers were relaxed to optimize the
surface structure and all other atoms were frozen to simulate bulk structure. The corresponding
Mo-doped CoP (111) surface model (Mo5Co13P18) is shown in Figure 5a where substitutional MoCo
dopants are considered. -CoOOH unit cell adopts a space group of R3M with calculated lattice
constants of a = 2.88 Å, b = 2.88 Å and c = 13.04 Å as shown in Figure S9a. Oxygen-terminated -
CoOOH (001) surface was built as seen in Figure S9b.[2] A vacuum slab of 12 Å in thickness was
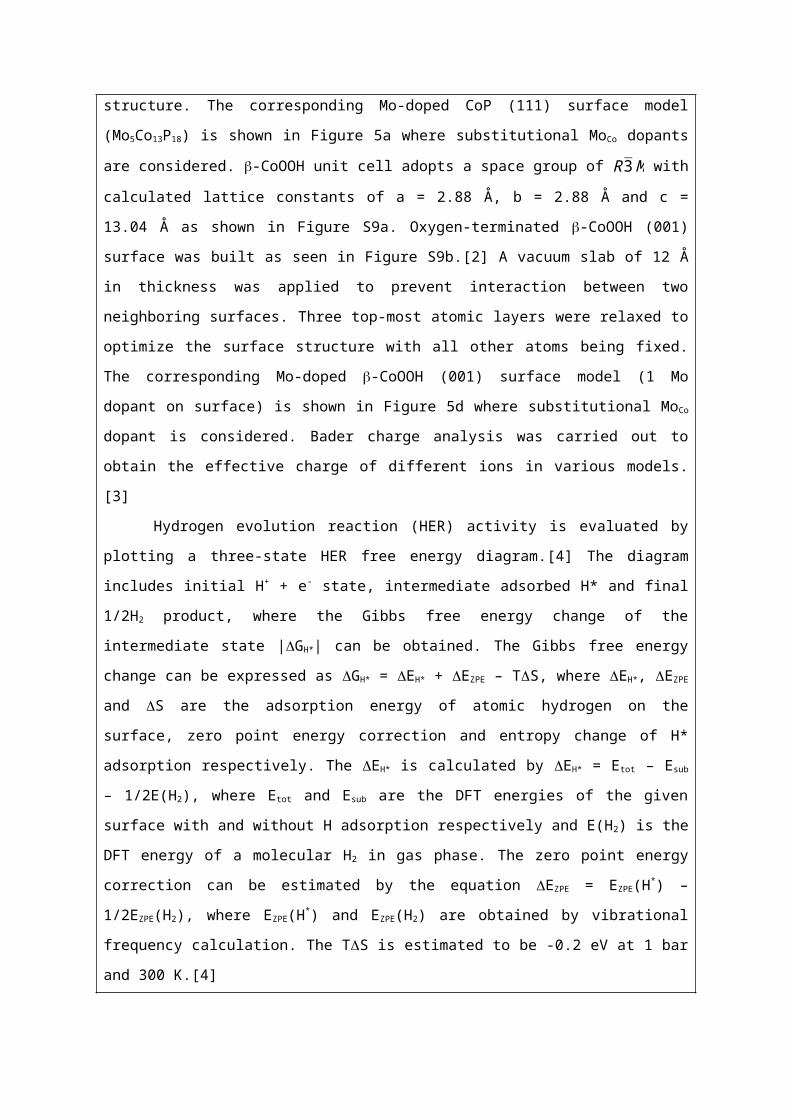
applied to prevent interaction between two neighboring surfaces. Three top-most atomic layers
were relaxed to optimize the surface structure with all other atoms being fixed. The
corresponding Mo-doped -CoOOH (001) surface model (1 Mo dopant on surface) is shown in
Figure 5d where substitutional MoCo dopant is considered. Bader charge analysis was carried out
to obtain the effective charge of different ions in various models.[3]
Hydrogen evolution reaction (HER) activity is evaluated by plotting a three-state HER free
energy diagram.[4] The diagram includes initial H+ + e- state, intermediate adsorbed H* and final
1/2H2 product, where the Gibbs free energy change of the intermediate state |GH*| can be
obtained. The Gibbs free energy change can be expressed as GH* = EH* + EZPE – TS, where
EH*, EZPE and S are the adsorption energy of atomic hydrogen on the surface, zero point energy
correction and entropy change of H* adsorption respectively. The EH* is calculated by EH* = Etot –
Esub – 1/2E(H2), where Etot and Esub are the DFT energies of the given surface with and without H
adsorption respectively and E(H2) is the DFT energy of a molecular H2 in gas phase. The zero point
energy correction can be estimated by the equation EZPE = EZPE(H*) – 1/2EZPE(H2), where EZPE(H*)
and EZPE(H2) are obtained by vibrational frequency calculation. The TS is estimated to be -0.2 eV
at 1 bar and 300 K.[4]

Figure S10. Atomic structures of (a) β-CoOOH unit cell and (b) β-CoOOH (001) surface model.
Oxygen evolution reaction (OER) activity is evaluated by considering the following four elementary
steps.[5, 6]
(1) H2O (l) + * → HO* + H+ + e-
G10 = EHO* – E* + 1/2 E(H∙ 2) – E(H2O) + EZPE –TS
(2) HO* → O* + H+ + e-
G20 = EO* –EHO* + 1/2 E(H∙ 2) + EZPE –TS
(3) O* + H2O (l) → HOO* + H+ + e-
G30 = EHOO* – EO* + 1/2 E(H∙ 2) – E(H2O) + EZPE –TS
(4) HOO* → O2 (g) + H++ e-
G40 = E* – EHOO* + 2 E(H∙ 2O) – 3/2 E(H∙ 2) + 4.92 + EZPE –TS
where E(H2) and E(H2O) are DFT energies of an isolated H2 and H2O molecule respectively. E*, EHO*, EO* and EHOO* are DFT energies of bare surface and the surface with HO*, O* and HOO* adsorption respectively. Zero-point energy (ZPE) correctionEZPE for various absorbents and TS at 298 K are adapted from literature.[5] The potential limiting step (PLS) for the overall OER process is the elementary step with the highest free energy change G0 among the four elementary steps. Further, the PLS determines the overpotential which is calculated by the equation = max[G1
0, G2
0, G30, G4
0]/e – 1.23 (V).[6]
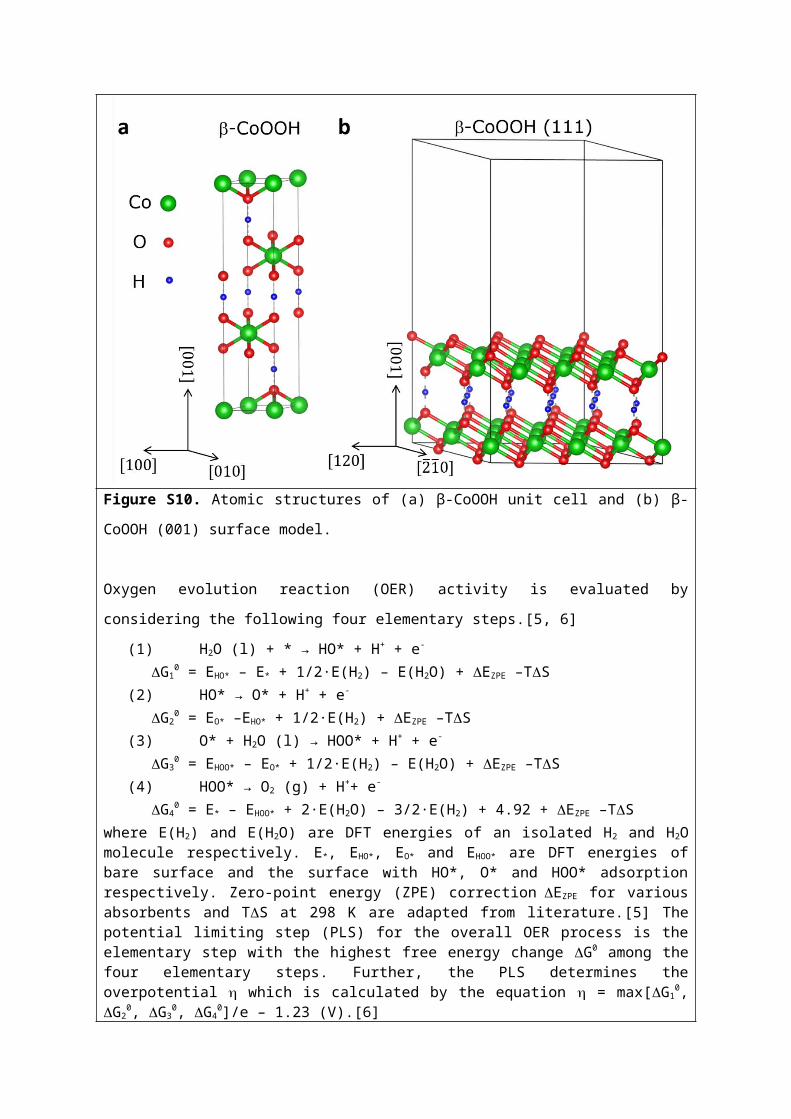
Figure S11. (a-b) TEM images and (c) diffraction pattern of Mo-CoP after the HER test. (d-e) TEM images and (f) diffraction pattern of Mo-CoOOH after the OER test. (g) XRD results of Mo-CoP before and after HER/OER test.

Table S1. Summary of recent reported highly active HER catalysts in 1 M KOH electrolyte.
Catalyst Substrate Mass loading
(mg cm-2)
Current density
(mA cm-2)
Potential(V vs. RHE)
Tafel Slope
(mV dec-
1)
Reference
Hollow Mo-CoP nanoarrays
Carbon Cloth 2.5 -10 -0.040 65 Current Work
Carbon tubes/cobalt-sulfide
Carbon paper 0.32(Co-S) -10 -0.19 131 [7]
Co/CoP GC/powder 0.22 -10 -0.253 73.8 [8]Co9S8@MoS2/CNFs GC/powder 0.212 -10 -0.19 110 [9]Cobalt embeddednitrogen-rich carbon nanotubes
GC/powder 0.28 -10 -0.37 N.A. [10]
CoMoP@C GC/powder 0.354 -10 -0.081 55.53 [11]CoNx/C GC/powder 2 -10 -0.17 75 [12]CoP nanowire arrays
Carbon Cloth 0.92 -10 -0.209 129 [13]
CoP/CNTs Carbon fiber paper/powder
0.5 -10 -0.076 67 [14]
CoP@BCN-1 GC/powder 0.004 -10 -0.215 52 [15]CoPx nanoparticlesembedded in N-doped carbon
GC/powder 0.283 -10 -0.145 51 [16]
Cu3P Ni foam 0.25 -10 -0.13 83 [17]Fe-CoP nanowires Ti foil 1.03 -10 -0.078 75 [18]FeP nanorod arrays Carbon cloth 1.5 -10 -0.218 146 [19]Hollow Co3O4 Microtube Arrays
Ni foam N.A. -20 -0.19 98 [20]
MoP/Ni2P Ni foam N.A. -10 -0.075 100.2 [21]MoS2/Ni3S2 Ni foam 9.7 -10 -0.11 83 [22]Ni1-xCoxSe2 mesoporous nanosheet
Ni foam 2.16 -10 -0.085 52 [23]
Ni8P3 Ni foam N.A. -10 -0.13 58.5 [24]NiCo2O4
Hollow Microcuboids
Ni foam/powder
1 -10 -0.110 497 [25]
NiCoP Ni foam 1.6 -10 -0.032 37 [26]NiFe LDH Ni foam N.A. -10 -0.21 N.A. [27]Ni-Mo/Cu nanowires
Cu foam 2.17 -10 -0.115 107 [28]
NiMo3S4 GC/powder 0.3 -10 -0.257 98 [29]Zn0.30Co2.70S4 GC/powder 0.285 -10 -0.085 N.A. [30]
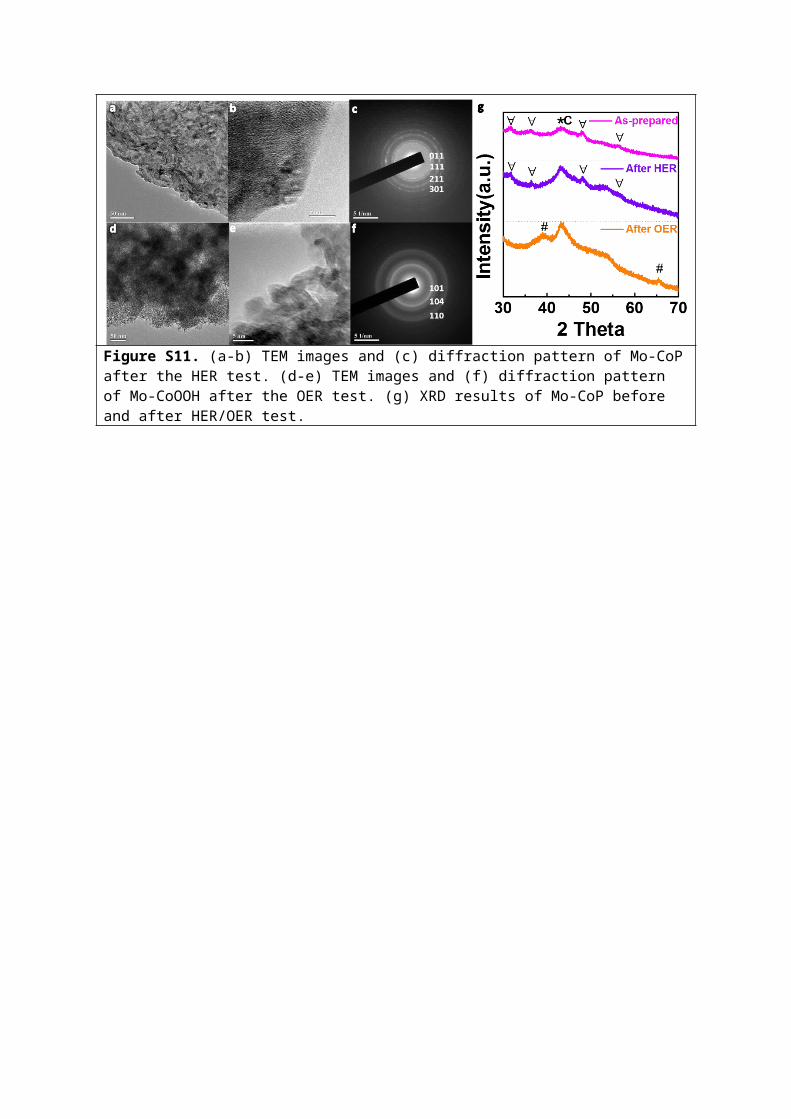
Table S2. Summary of recent reported highly active OER catalysts in 1 M KOH or NaOH electrolyte.
Catalyst Substrate Mass loading
(mg cm-2)
Current density
(mA cm-2)
Potential(V vs. RHE)
Tafel Slope
(mV dec-1)
Reference
Hollow Mo-CoOOH nanoarrays
Carbon Cloth ~2.5 10 1.535 56 Current Work
Carbon tubes/cobalt-sulfide
Carbon paper 0.32(Co-S)
10 1.536 72 [7]
Co/CoP GC/powder 0.22 10 1.57 79.5 [8]Co3O4/NiCo2O4 double-shelled nanocages
Ni foam/powder
1 10 1.57 88 [31]
Co3O4-Carbon Nanowire Arrays
Cu foil 0.2 10 1.52 70 [32]
Co9S8@MoS2/CNFs
Glassycarbon (GC)/powder
0.212 10 1.66 61 [9]
Cobalt-based borate nanosheets/graphene
GC/powder 0.285 10 1.52 53 [33]
CoMnP nanoparticles
GC/powder 0.284 10 1.56 61 [34]
CoPx nanoparticlesembedded in N-doped carbon
GC/powder 0.283 10 1.549 52 [16]
Hollow Co3O4 Microtube Arrays
Ni foam N.A. 150 1.59 84 [20]
MoP/Ni2P Ni foam N.A. 20 1.539 77.6 [21]MoS2/Ni3S2 Ni foam 9.7 10 1.448 88 [22]N-doped carbonnanotube frameworks
Glassycarbon (GC)/powder
0.2 10 1.60 93 [35]
Ni8P3 Ni foam N.A. 30 1.5 73.2 [24]NiCo LDH nanosheets
carbon paper 0.17 10 1.597 40 [36]
NiCo2O4
Hollow Microcuboids
Ni foam/powder
1 10 1.52 53 [25]
NiCoP Ni foam 1.6 10 1.51 87 [26]NiCoP/C GC/powder 0.05 10 1.56 96 [37]NiFe LDH Ni foam N.A. 10 1.47 N.A. [27]Ni-Mo/Cu nanowires
Cu foam 2.17 20 1.51 66 [28]
Surface Oxidized CoP Nanorods
GC/powder 0.71 10 1.55 71 [38]
Table S3. Summary of recent reported representative of highly active catalysts for overall water-splitting
Catalyst Substrate Mass loading(mg cm-2)
Current density(mA cm-2)
Voltage Electrolyte Reference
Mo-CoP //Mo-CoOOH
Carbon Cloth
2.5 10 1.56 1 M KOH Current Work
Carbon tubes/cobalt-sulfide
Carbon paper
0.32(Co-S) 10 1.743 1 M KOH [7]
Hollow Co3O4 Microtube Arrays
Ni foam N.A. 10 1.63 1 M KOH [20]
MoP/Ni2P Ni foam N.A. 10 1.55 1 M KOH [21]MoS2/Ni3S2 Ni foam 9.7 10 1.56 1 M KOH [22]Ni8P3 Ni foam N.A. 10 1.61 1 M KOH [24]NiCo2O4
Hollow Microcuboids
Ni foam/powder
1 10 1.65 1 M NaOH [25]
NiCoP Ni foam 1.6 10 1.58 1 M KOH [26]NiFe LDH Ni foam N.A. 10 1.7 1 M NaOH [27]Ni–Mo/Cu nanowires
Cu foam 2.17 10 1.61 1 M KOH [28]
Surface Oxidized CoP Nanorods
titanium felt sheet/powder
5 10 1.587 1 M KOH [38]
References:
[1] G. Hu, Q. Tang, D.-e. Jiang, Phys. Chem. Chem. Phys., 18 (2016) 23864-23871.[2] M. Bajdich, M. García-Mota, A. Vojvodic, J.K. Nørskov, A.T. Bell, J. Am. Chem. Soc., 135 (2013) 13521-13530.[3] W. Tang, E. Sanville, G. Henkelman, J. Phys. Condens. Matter, 21 (2009) 084204.[4] J.K. Nørskov, T. Bligaard, A. Logadottir, J. Kitchin, J.G. Chen, S. Pandelov, U. Stimming, J. Electrochem. Soc., 152 (2005) J23-J26.[5] M. Li, L. Zhang, Q. Xu, J. Niu, Z. Xia, J. Catal., 314 (2014) 66-72.[6] I.C. Man, H.Y. Su, F. Calle Vallejo, H.A. Hansen, J.I. Martínez, N.G. Inoglu, J. Kitchin, T.F. Jaramillo, ‐J.K. Nørskov, J. Rossmeisl, ChemCatChem, 3 (2011) 1159-1165.[7] J. Wang, H.-x. Zhong, Z.-l. Wang, F.-l. Meng, X.-b. Zhang, ACS Nano, 10 (2016) 2342-2348.[8] Z.-H. Xue, H. Su, Q.-Y. Yu, B. Zhang, H.-H. Wang, X.-H. Li, J.-S. Chen, Adv. Energy Mater., 7 (2017) 1602355.[9] H. Zhu, J. Zhang, R. Yanzhang, M. Du, Q. Wang, G. Gao, J. Wu, G. Wu, M. Zhang, B. Liu, J. Yao, X. Zhang, Adv. Mater., 27 (2015) 4752-4759.[10] X. Zou, X. Huang, A. Goswami, R. Silva, B.R. Sathe, E. Mikmeková, T. Asefa, Angew. Chem. Int. Ed., 53 (2014) 4372-4376.[11] Y.-Y. Ma, C.-X. Wu, X.-J. Feng, H.-Q. Tan, L.-K. Yan, Y. Liu, Z.-H. Kang, E.-B. Wang, Y.-G. Li, Energy Environ. Sci., 10 (2017) 788-798.[12] H.-W. Liang, S. Brüller, R. Dong, J. Zhang, X. Feng, K. Müllen, Nat. Commun., 6 (2015) 7992.[13] J. Tian, Q. Liu, A.M. Asiri, X. Sun, J. Am. Chem. Soc., 136 (2014) 7587-7590.[14] X. Zhang, X. Zhang, H. Xu, Z. Wu, H. Wang, Y. Liang, Adv. Funct. Mater., 27 (2017) 1606635.[15] H. Tabassum, W. Guo, W. Meng, A. Mahmood, R. Zhao, Q. Wang, R. Zou, Adv. Energy Mater., 7 (2017) 1601671.

[16] B. You, N. Jiang, M. Sheng, S. Gul, J. Yano, Y. Sun, Chem. Mater., 27 (2015) 7636-7642.[17] J. Hao, W. Yang, Z. Huang, C. Zhang, Advanced Materials Interfaces, 3 (2016) 1600236.[18] C. Tang, R. Zhang, W. Lu, L. He, X. Jiang, A.M. Asiri, X. Sun, Adv. Mater., 29 (2017) 1602441.[19] Y. Liang, Q. Liu, A.M. Asiri, X. Sun, Y. Luo, ACS Catalysis, 4 (2014) 4065-4069.[20] Y.P. Zhu, T.Y. Ma, M. Jaroniec, S.Z. Qiao, Angew. Chem. Int. Ed., 56 (2016) 1324–1328.[21] C. Du, M. Shang, J. Mao, W. Song, J. Mater. Chem. A, 5 (2017) 15940-15949.[22] J. Zhang, T. Wang, D. Pohl, B. Rellinghaus, R. Dong, S. Liu, X. Zhuang, X. Feng, Angew. Chem., 128 (2016) 6814-6819.[23] B. Liu, Y.-F. Zhao, H.-Q. Peng, Z.-Y. Zhang, C.-K. Sit, M.-F. Yuen, T.-R. Zhang, C.-S. Lee, W.-J. Zhang, Adv. Mater., (2017) n/a-n/a.[24] G.-F. Chen, T.Y. Ma, Z.-Q. Liu, N. Li, Y.-Z. Su, K. Davey, S.-Z. Qiao, Adv. Funct. Mater., 26 (2016) 3314-3323.[25] X. Gao, H. Zhang, Q. Li, X. Yu, Z. Hong, X. Zhang, C. Liang, Z. Lin, Angew. Chem. Int. Ed., 55 (2016) 6290-6294.[26] H. Liang, A.N. Gandi, D.H. Anjum, X. Wang, U. Schwingenschlögl, H.N. Alshareef, Nano Lett., 16 (2016) 7718–7725.[27] J. Luo, J.-H. Im, M.T. Mayer, M. Schreier, M.K. Nazeeruddin, N.-G. Park, S.D. Tilley, H.J. Fan, M. Grätzel, Science, 345 (2014) 1593-1596.[28] S. Zhao, J. Huang, Y. Liu, J. Shen, H. Wang, X. Yang, Y. Zhu, C. Li, J. Mater. Chem. A, 5 (2017) 4207-4214.[29] J. Jiang, M. Gao, W. Sheng, Y. Yan, Angew. Chem. Int. Ed., 55 (2016) 15240–15245.[30] Z.-F. Huang, J. Song, K. Li, M. Tahir, Y.-T. Wang, L. Pan, L. Wang, X. Zhang, J.-J. Zou, J. Am. Chem. Soc., 138 (2016) 1359-1365.[31] H. Hu, B. Guan, B. Xia, X.W. Lou, J. Am. Chem. Soc., 137 (2015) 5590-5595.[32] T.Y. Ma, S. Dai, M. Jaroniec, S.Z. Qiao, J. Am. Chem. Soc., 136 (2014) 13925-13931.[33] P. Chen, K. Xu, T. Zhou, Y. Tong, J. Wu, H. Cheng, X. Lu, H. Ding, C. Wu, Y. Xie, Angew. Chem. Int. Ed., 55 (2016) 2488-2492.[34] D. Li, H. Baydoun, C.N. Verani, S.L. Brock, J. Am. Chem. Soc., 138 (2016) 4006-4009.[35] B.Y. Xia, Y. Yan, N. Li, H.B. Wu, X.W. Lou, X. Wang, Nature Energy, 1 (2016) 15006.[36] H. Liang, F. Meng, M. Cabán-Acevedo, L. Li, A. Forticaux, L. Xiu, Z. Wang, S. Jin, Nano Lett., 15 (2015) 1421-1427.[37] P. He, X.-Y. Yu, X.W. Lou, Angew. Chem. Int. Ed., 56 (2017) 3897–3900.[38] J. Chang, Y. Xiao, M. Xiao, J. Ge, C. Liu, W. Xing, ACS Catalysis, 5 (2015) 6874-6878.


![New Synthesis of Polycrystalline NiSe Nanoarrays on Ni ... · storage would achieve sustainable and rapid development [1]. As an alternative device, supercapacitors (SCs), also called](https://static.fdocuments.us/doc/165x107/6103e5be59815e4c04513394/new-synthesis-of-polycrystalline-nise-nanoarrays-on-ni-storage-would-achieve.jpg)