ARR/FTR Solution Options
17
PJM © 2021 www.pjm.com | Public ARR/FTR Solution Options FTR Group AFMTF May 24, 2021
Transcript of ARR/FTR Solution Options

PJM © 2021www.pjm.com | Public
ARR/FTR Solution Options
FTR Group
AFMTF
May 24, 2021

PJM © 20212www.pjm.com | Public
Key Takeaways
• Solution options align with LEI report findings and incorporate various stakeholder feedback
to-date into three separate but related themes: ARRs, FTRs, Transparency / Simplicity
• Priority on preserving intended purposes & existing source/sink based construct, while:
– Enhancing alignment with what load pays in LMP due to congestion and how ARRs are
allocated on a zonal basis
– Ensuring load has priority rights to transmission system and congestion revenues
– Improving choice flexibility for load to collect auction revenues or DA congestion
revenues
• Advance FTR auction efficiencies, e.g. model transparency, price discovery and liquidity
while ensuring value added activity
• PJM supports and can implement these options however this is not a final proposal and PJM
remains open to additional input and alternative options

PJM © 20213www.pjm.com | Public
Proposal Themes
ARRs FTRs
Transparency & Simplicity

PJM © 20214www.pjm.com | Public
Amount of Rights Guaranteed - Options
• Status Quo: Up-to Zonal Base Load (ZBL) in Stage 1A
– ZBL is an LSE’s NSPL-ratio share of the zone previous year’s lowest
daily peak (usually 40-50% peak)
– 10-year guarantee (may trigger RTEP upgrades)
– Ratings on facilities with violations are increased and carried forward to
all FTR auctions (ratings may be reduced in subsequent auctions if
auction revenue is positive and ARRs are fully funded)
• Option 1: Increase Stage 1A guarantee to a fixed percentage of peak load
Key Takeaway: Preserving a Stage 1 protects hedging ability for native base load, future
integrations, and 10-year guarantee FERC requirement.

PJM © 20215www.pjm.com | Public
ZBL as a Percentage of NSPLKey takeaway: A fixed guarantee above 60% would increase Stage 1A MW awards for all zones.
FTR Group is currently performing analysis to determine what level could be
guaranteed without creating significant additional violations in a no outage case.
ZONE 17/18 18/19 19/20 20/21 21/22 Average 5-year
AE 37.7% 39.8% 38.2% 36.1% 35.0% 37.4%
AEP 54.0% 57.7% 56.5% 54.1% 53.3% 55.1%
AP 53.2% 54.5% 52.6% 49.3% 51.4% 52.2%
ATSI 49.6% 52.8% 51.6% 49.4% 45.2% 49.7%
BC 45.4% 46.7% 45.2% 44.5% 43.7% 45.1%
CE 44.0% 45.1% 43.2% 42.6% 40.7% 43.1%
DAY 47.7% 48.7% 49.0% 48.2% 43.5% 47.4%
DEOK 48.8% 51.4% 51.0% 48.8% 46.7% 49.4%
DOM 47.6% 48.1% 45.7% 49.2% 48.6% 47.8%
DPL 41.5% 46.0% 44.4% 40.4% 40.9% 42.6%
DUQ 47.4% 49.2% 48.9% 47.7% 43.8% 47.4%
EKPC 39.7% 44.3% 36.4% 38.0% 42.7% 40.2%
JC 38.0% 39.8% 37.2% 35.3% 35.6% 37.2%
ME 48.3% 49.3% 50.0% 47.0% 45.7% 48.0%
OVEC N/A 47.2% 21.1% 21.8% 17.6% 26.9%
PE 46.8% 47.8% 45.0% 44.1% 43.8% 45.5%
PEP 42.5% 46.5% 43.5% 43.6% 43.4% 43.9%
PL 45.7% 51.7% 51.7% 47.3% 50.9% 49.4%
PN 58.1% 57.4% 57.6% 55.2% 55.9% 56.8%
PS 43.1% 44.8% 42.7% 42.2% 41.6% 42.9%
RECO 35.9% 35.7% 34.4% 35.7% 33.7% 35.1%

PJM © 20216www.pjm.com | Public
Available source/sink points - Options
• Status quo:
– Stage 1 – source points only from designated active historical resources or Qualified
Replacement Resources
– Stage 2 – source points any available generator, interface, hub, zone
– Must always sink at load settlement point/aggregate (with fixed bus weightings)
• Option 1:
– Stage 1A – maintain status quo (up-to a TBD fixed percentage of NSPL)
– Stage 1B – Hub, Interface, Zone additional source points (up to NSPL, subject to SFT)
– Stage 2 – any source/sink combination available in the annual FTR auction (up to
remainder of NSPL, subject to SFT, over two rounds, 50% capability each round)
– Eliminate monthly residual ARR process
Key Takeaway: : Allow for the entire transmission system capability to be available to be
nominated prior to annual auction. Also, preserves NSPL related cap and zonal resource concept.

PJM © 20217www.pjm.com | Public
Residual and Annual ARR MW SummaryKey takeaway: Replace residual monthly ARRs with additional up-front ARR available
capability and surplus revenue. Monthly residual ARRs require extensive resources to clear.
0.0%
0.5%
1.0%
1.5%
2.0%
2.5%
3.0%
3.5%
4.0%
0
5
10
15
20
25
30
35
40
45
Th
ou
sa
nd
s
Total 12 month cleared MW
% of Residual to Annual ARR
0%
10%
20%
30%
40%
50%
60%
70%
-
10,000.0
20,000.0
30,000.0
40,000.0
50,000.0
60,000.0
70,000.0
80,000.0
Stage 1A Stage 1B Stage 2R1 Stage 2R2 Stage 2R3
21/22 ARR MW by Round
Bid MW Cleared MW % Total MW

PJM © 20218www.pjm.com | Public
Load Choice Flexibility - Options
• Status quo: Self-schedule FTR product is 24H Obligation “price taker”, does
not shift with load
• Option 1: replace self-scheduling concept with direct FTR allocation
concept, would shift with load (IMM State of the Market recommendation)
– Must be done prior to round 1 of the annual auction
– ARR holder would have two options:
• Keep ARR and collect auction revenues
• Convert ARR to directly allocated FTR at zero cost, forego auction revenues
– Option to Sell directly allocated FTR in annual auction
Key Takeaway: With the ability to swap an ARR for a FTR at no cost prior to the annual
auction allows additional flexibility for load to sell FTR at a reservation price.

PJM © 20219www.pjm.com | Public
Self-Schedule StatisticsKey takeaway: roughly 25% of ARRs is self-scheduled; existing 24H product is not flexible
26,689.4 24,528.9 27,478.7 29,145.8 27,594.1 27,015.6
81,910.7 95,960.3 99,157.5 104,918.8 100,794.3 102,734.4
0%
10%
20%
30%
40%
50%
60%
70%
80%
90%
100%
2016_2017 2017_2018 2018_2019 2019_2020 2020_2021 2021_2022
Percentage Self-Schedule MWs
SelfScheduled All Cleared ARR
0
20
40
60
80
100
120
6/1
/20
16
11
/1/2
01
6
4/1
/20
17
9/1
/20
17
2/1
/20
18
7/1
/20
18
12
/1/2
01
8
5/1
/20
19
10
/1/2
01
9
3/1
/20
20
8/1
/20
20
1/1
/20
21
6/1
/20
21
11
/1/2
02
1
4/1
/20
22
Mill
ions
Self-Scheduled FTRs
AuctionCharge DACredit_24h
DACredit_OnPeak DACredit_OffPeak
PJM © 202110www.pjm.com | Public
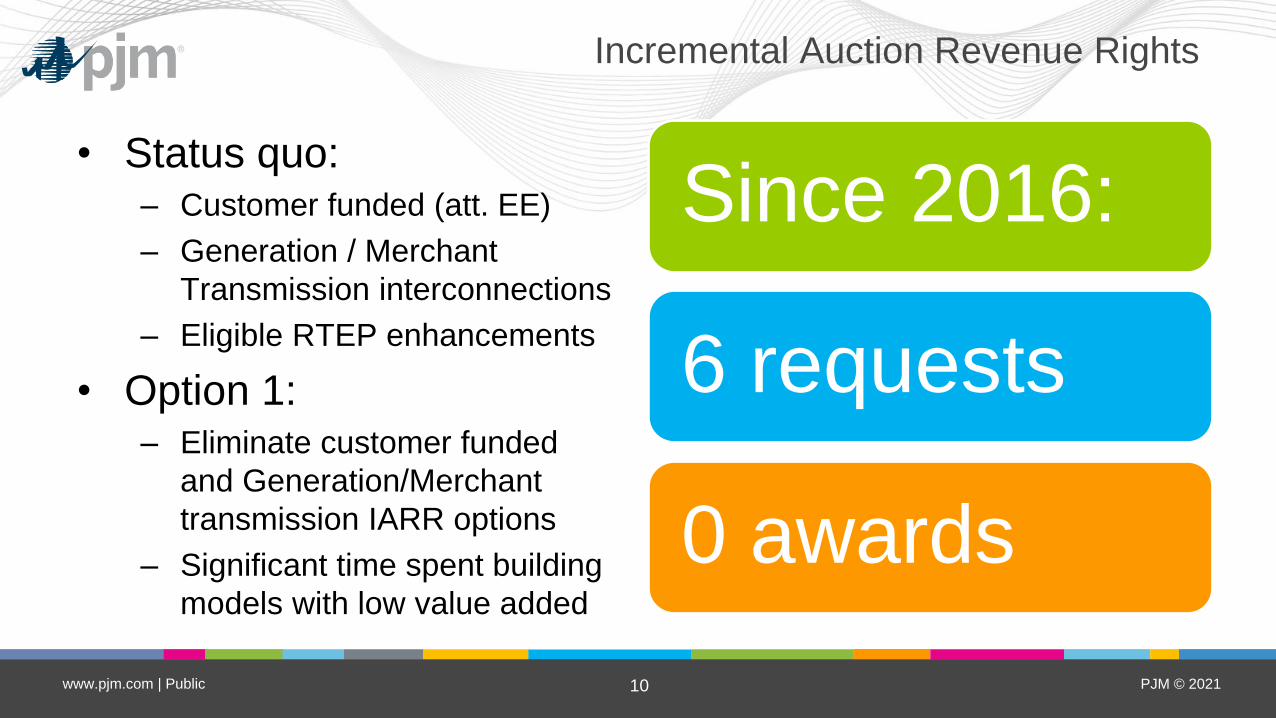
Incremental Auction Revenue Rights
• Status quo:– Customer funded (att. EE)
– Generation / Merchant
Transmission interconnections
– Eligible RTEP enhancements
• Option 1:– Eliminate customer funded
and Generation/Merchant
transmission IARR options
– Significant time spent building
models with low value added
Since 2016:
6 requests
0 awards

PJM © 202111www.pjm.com | Public
ARR Solution Options
Design Component Status Quo Solution Option Justification
Amount of guaranteed ARRs allocated Stage 1A up-to Zonal Base Load share of
historical source and sink paths only (~40-
50% of Network Service Peak Load
historically).
Maintain Stage 1A and 1B, 1A as-is, but
guarantee TBD % NSPL in 1A, 1B expand
resources up-to NSPL, subject to SFT.
Eliminate residual monthly ARR process.
Ensure priority rights to transmission
system and congestion revenues.
Availability and Assignment of Congestion
rights to Load (ARR source/sink points)
Stage 1 – source points only from
designated active historical resources or
Qualified Replacement Resources. Stage
2 – source points any available generator,
interface, hub, zone. Must always sink at
load settlement point/aggregate
Stage 1A – status quo;
Stage 1B – status quo sources plus Hub,
Zone and Interface, sink load settlement
point. (May request up to 100% NSPL)
Stage 2 – Relinquish and/or additional
requests with any source/sink combination
capped at total NSPL.
Enhance alignment with allocated rights
and actual cLMP costs paid.Modeling Detail Annual Model with modeled constraints,
line limits and outages based on DA snap
shot, Monthly updates during planning
year.
Option 1: Annual model (status quo)
Option 2: Seasonal model
Auction/DA Congestion surplus allocation Surplus goes to FTR deficiencies first,
residual allocated to ARR holders on ARR
weighted basis at the end of the Planning
Period.
Option 1: 100% to ARR Holders,
methodology TBD
Option 2: 100% to RT Load plus Exports
Congestion Right Election (Claim or Sell
Options)
Annual, 24H Obligation "Price taker" from
average 4 round annual auction prices.
Replace self-schedule option with option
for directly allocated FTR (no cost) prior to
Round 1 of Annual Auction, 24H obligation
Efficient choice flexibility for load to collect
auction revenues (at desired price) or
collect congestion revenues.
IARR Products Customer funded (Attachment EE),
Merchant, RTEP
Remove Attachment EE (Customer
Funded) and Merchant Transmission.
Retain RTEP IARRs
High administrative burden with very low
value.

PJM © 202112www.pjm.com | Public
Proposal Themes
ARRs FTRs
Transparency & Simplicity

PJM © 202113www.pjm.com | Public
FTR Solution Options
Design Component Status Quo Solution Option Justification
FTR Auction Bid Limits 10,000 per period, auction,
round by corporate entity
15,000 per prompt period per
auction round, per corporate
entity
Advance liquidity.
FTR product & class types 24H, On peak, Off peak (M-F
2300-0700, Weekend all day).
Monthly or Annual product.
Weekday peak hours (HE 8-23),
Weekend/holiday peak hours
(HE 8-23), Everyday off-peak
hours (HE 1-7, HE 24). Month or
Annual product
Increase hedge flexibility.
FTR Option paths and clearing
mechanism
No floor price. Add $1 floor price Ensure value added.

PJM © 202114www.pjm.com | Public
Option DataKey takeaway: Each planning period on average over 4,000 MWs clear less than $1
0.0
1,000.0
2,000.0
3,000.0
4,000.0
5,000.0
6,000.0
7,000.0
8,000.0
9,000.0
10,000.0
16_17 17_18 18_19 19_20 20_21 21_22
Cleared Option MWs Less than $1
Total

PJM © 202115www.pjm.com | Public
Proposal Themes
ARRs FTRs
Transparency & Simplicity

PJM © 202116www.pjm.com | Public
Transparency / Simplicity Solution Options
Design Component Status Quo Solution Option Justification
Network Model Posted
Information
Base topology, outages,
selected interface limits,
m2m flow, loop flow,
uncompensated flow,
contingencies modeled
Option 1: Model reference
document/model user guide
Option 2: post actual case
(exploring - will require GE
support)
Advance Transparency.
Network Model Posted
Information Frequency
Base models posted
quarterly; outages, interface
limits posted per auction,
aggregate and PAR
definitions, model mapping
files.

PJM © 202117www.pjm.com | Public
Contact
Facil i tator:
David Anders,
Secretary:
Ankit Kharod
SME/Presenter:
FTR Group
Member Hotl ine
(610) 666 – 8980
(866) 400 – 8980