Aroca Chile
22
DIVERSIFICATION AND DEVELOPMENT IN LOCAL ECONOMIES BASED ON MINING SECTOR: The Case of the Chilean II Region. Abstract The main objective of this paper is to measure the impact of the mining sector on the Chilean II Region and evaluate the conditions that affect the magnitude of this impact. Using an Input Output matrix for the II Region, we calculate the impact on output, income and employment. Later, we compare the impact on the labor market between private and stated owned firms, showing that there is a huge difference in the management system of each firm that results in different costs and benefits for regional development. In addition, we show that the mining sector is not important in terms of the backward and forward linkages within the region, but that it is very important in terms of the operation level and that it has resulted in a productive cluster in the north of the country which is far beyond the rest of the country in terms of the Gross Regional Product per capita. Finally, we survey other impacts on the quality of life of the regional population, describing the actions that have been taken by private and state owned firms, as well as the role of the Government in promoting development in the II Region.
-
Upload
dahlan-iskan -
Category
Documents
-
view
231 -
download
1
description
ar
Transcript of Aroca Chile

DIVERSIFICATION AND DEVELOPMENT IN LOCAL ECONOMIES BASED ON MINING SECTOR: The Case of
the Chilean II Region. Abstract The main objective of this paper is to measure the impact of the mining sector on the Chilean II Region and evaluate the conditions that affect the magnitude of this impact. Using an Input Output matrix for the II Region, we calculate the impact on output, income and employment. Later, we compare the impact on the labor market between private and stated owned firms, showing that there is a huge difference in the management system of each firm that results in different costs and benefits for regional development. In addition, we show that the mining sector is not important in terms of the backward and forward linkages within the region, but that it is very important in terms of the operation level and that it has resulted in a productive cluster in the north of the country which is far beyond the rest of the country in terms of the Gross Regional Product per capita. Finally, we survey other impacts on the quality of life of the regional population, describing the actions that have been taken by private and state owned firms, as well as the role of the Government in promoting development in the II Region.

2
INTRODUCTION The political geographic Chilean map has 13 regions. The II Region, located in the north area of the country, in the desert of Atacama, is rich in minerals, and its economic development is owed fundamentally to the mining exploitation. (see Chilean Map).
Chilean Map
Between 1950 and 1880, Chile was the biggest copper exporter of the world. Later, the production of copper was down and from 1870 until 1930, the exploitation of nitrate was the main activity of the mining sector of the country. However, from 1928 copper was again the main mining activity of the country and the II Region. Since 1928, we have been exploiting copper mines. We also exploit other minerals, but these are smaller in size. Large-scale copper mining includes the technologically more advanced mines, which are able to raise financial resources in international markets, and export their production by themselves. By law, to be considered in this category the mine should produce more than 75,000 metric tons. (Fischer 1999). In the II Region we find seven of the biggest mines of the country. Two of them: Chuquicamata and Radomiro Tomic are state owned; four of them: Minera Escondida Ltda., Michilla, Zaldivar and Mantos Blancos are private, and there is a joint venture between the Chilean State (49%) and Cyprus Amax (51%) which is named El Abra. In Table 1, one can see that more than half of the total copper production of the country takes place in the II Region and how the companies contribute to the copper regional production. Another interesting point of the copper exploitation in the II Region, as it is shown in Table 1, is that the companies are owned by the state and also by the private sector, and there is a new experience where there is a joint venture between them. This process of privatization of the mining exploitation has been growing in the last decade and since 1995, private copper output is larger than the one produced by the state owned companies.

3
The following graph shows the evolution of the copper production by private and state owned companies from 1971 to 1999. It is clear that in the last decade there has been a huge increase in the private mining sector, which is a result mainly of foreign investment and explains that the current annual production is double the production of six years ago. The impact of this extraordinary growth is the object of this study.
1999 1998 1997 1996 1995 1994Total (State owned - Codelco) 928027 909766 749425 648018 610150 606211Chuquicamata 630067 650154 650210 632282 610150 606211Radomiro Tomic 190104 161896 4049 0 0 0El Abra (49% Codelco) 107856 97716 95166 15736 0 0Total (Private companies) 1325118 1292860 1249054 1079098 620926 588079Escondida (*) 896210 919000 906000 841361 466914 483631El Abra (51% Cyprus Amax) 112258 101704 99050 16378 0 0Michilla 60563 62066 62683 62969 56000 27000Zaldívar 162000 120000 96000 77000 22000 0Mantos Blancos 94087 90090 85321 81390 76012 77448Total Regional Production (**) 2253145 2202626 1998479 1727116 1231076 1194290Total National Production 4382600 3686900 3392202 3115800 2488598 2150300% II Región Production 51,4% 59,7% 58,9% 55,4% 49,5% 55,5%
Table 1Production of Copper by Large Scale Companies of the Chilean II Region
(Metric tons of fine copper content)
(*) Fiscal Year (June 1st until May 31st)Source: Built by the authors based on Annuals Finance State of Mining Companies, Cochilco (2000e) and Ocaranza et al (2000)
Graph 1EVOLUTION OF CHILEAN COPPER PRODUCTION: PRIVATE AND STATE OWNED FIRM
(Thousands of metric tons of fine copper content)
0
500
1000
1500
2000
2500
1970 1975 1980 1985 1990 1995 2000
Years
To
ns
(Th
ou
san
d)
Private
State

4
ECONOMIC IMPACTS OF THE MINING SECTOR ON THE II REGION In order to measure the economic impacts of the Chilean Mining Sector on the II Region, we build up an input–output matrix (Aroca, 1999). The matrix includes twelve productive sectors, a final demand sector, and the payments to the factors: labor (wages) and capital (profits) (see Appendix 1). We measure the impacts of a change in final demand (i.e. change in Consumption, Investment, Government Expenditure or Export) through the multipliers. In addition, to overcome the criticism that an input–output model “tends to underestimate economic impacts because it omits the interaction between households’ spendable income (particularly wages and salaries) that results directly or indirectly from economic activity and the consequent household spending on consumer goods” (Isard et al, 1998), we estimate two kind of multipliers. The first one (Open system) assumes that the additional income (wages) that is paid for a change in the final demand is not spent in the region. The second type of multipliers (Closed system) assumes that all the additional labor income associated to a change of the demand is spent on the region. Therefore, the real impact should be some point between these two multipliers.
Output Multipliers We distinguish the investment from the operation of the mining sector. The investment has a totally different expenditure structure, and so impact, from the operation. While the first is very intensive in terms of the increase in demand directed to the Construction sector, the operation almost does not need any input from this sector. Thus, we first explore the impact of the mining sector operation. The output multipliers are calculated from the II Region Input Output Matrix, and the results are showed in Figure 1. The numbers of the sectors are the following:
1 Agriculture 2 Fishing 3 Mining 4 Manufacture 5 Utilities 6 Construction 7 Retails 8 Transportation and Communication 9 Business Services 10 Real State Services 11 Other Services 12 Public Administration
muhidin
Highlight
muhidin
Highlight
muhidin
Highlight
muhidin
Highlight

5
The mining sector is composed mainly by copper production. Copper production represents 84 per cent of the total production of the mining sector, and the mining sector represents more than 60 per cent of the Regional Product. The open system multipliers do not take account of the possibility that when there is an exogenous increasing in the final demand, the workers will receive more money that they can spend in the region. On the other side, closed system multipliers assume that the entire additional wage is spent in the region. (See Appendix 2 for the formulae).
0 1 2 3 4 5 6 7 8 9 10 11 12 130
0.5
1
1.5
2
2.5
3
3.5
4Figure 1: OUTPUT MULTIPLIERS
Economic Sector
US
$
Open Close
The open system multipliers vary between 1.01 and 1.65, which means that for one additional dollar that is spent on the final demand, the total output of the region increases by US$ 1.65 if it is spent in the Construction sector (5)1 or by 1.01 if the dollar is spent in the Real State Services sector (10). If the dollar is spent in the Mining sector it will imply an output increase of US$ 1.3. On the other side, if we assume that the new income that is generated by the additional dollar is spent in the region, we find significant difference among the economic impact of the sectors. It is clear from Figure 1 that the impact on total output is greater when the dollar goes to sectors associated with services, which are more labor intensive. The case of the Mining sector (3) shows an output multiplier of 1.8. It means that for each
1 The number of the sectors will be written in parentheses to facilitate understanding of the graphics.

6
additional dollar that is spent in the Mining sector, 1.8 dollars are generated in the whole region. Therefore, given the situation of the Mining sector, where part of the mining labor force commutes from other regions, we can conclude that the real impact on total output of each additional dollar spent in the sector will be between 1.3 and 1.8 dollars.
Output Linkages In addition to measuring the impact of a dollar spent in the mining sector, it is also interesting to know the sectors through which the impact is distributed. The linkages between sectors are measured by the coefficient of the Leontief Inverse Matrix. Figure 2 shows the linkage between the mining sector and the other sectors of the regional economy.
0 1 2 3 4 5 6 7 8 9 10 11 120
0.05
0.1
0.15
0.2Figure 2: OUTPUT LINKAGES
Economic Sector
US
$
Open Close
The Mining Sector (3) is connected with the Business Services sector (9), Utilities sector (5) (Energy sector) and the Retails sector (7). In addition, if the extra income that comes from the Mining sector is spent in the II Region, the linkages are stronger and four other sectors also appear to be connected with the Mining sector. These are: Manufacturing sector (4), Other Services sector (11), Transport and Communication sector (8), and Real State sector (10).

7
It is worth to call attention to the size of the closed system linkages. The cases of the Manufacturing (4) and Other Services sector (11) are really amazing, because they are greater than the Retail sector (7) open system linkage. It means that the impact of the expenditure of the workers within the Region is really significant and that the firm should try to motivate migration of the people more than provide incentives to commute between the region where they live and the II Region. This issue is not irrelevant. For example, El Abra (a joint venture between the Chilean State (49%) and Cyprus Amax (51%)), which produces about 220 thousand tons of copper per year, has 50 percent of the labor population who commute from other regions.
Income and Employment Multipliers Isard et al (1998) argue that many analysts feel that output multipliers are not very useful since they add up outputs over all sectors in the economy; it means output multipliers give the same value to all sectors. They state that a more interesting measure of economic importance should reflect the employment effects associated with output in the various sectors; income multipliers provide one way to do that. Figure 3 shows the Income Multipliers for the Mining sector.
0 1 2 3 4 5 6 7 8 9 10 11 12 13 140
0.01
0.02
0.03
0.04
0.05
0.06
0.07
0.08
0.09
0.1Figure 3: INCOME MULTIPLIERS
Economic Sector
US
$
Open Close
Each dollar that is spent in the Mining sector (3) implies an increment in the income of the worker of different size. Almost 10 cents is received by the worker in the Mining

8
sector, close to 4 cents received by the workers in Business Services (9) sector and 1.7 cents receive the workers from the Retails sector (7). If the additional income of the workers in spent in the II Region, some additional cents are received by workers in Other Services sector (2,5 cents), Real State sector (1,3 cents) and Transport and Communication (1,2 cents). The total amount that the workers in different sectors receive will be between 16 and 24 cents. The exact amount depends on how much of the additional income the workers spend in the II Region. It means that something between 16 to 24 percent of the mining output goes to the workers of the region of any sector. Alternatively, we can say that 9.7 percent of the mining sector output goes to the mining sector workers and between 6.3 and 14.3 percent of the mining sector output goes to workers in the other sectors of the regional economy. On the other hand, the DL 600 had the objective to promote foreign investment on the country in a time when the unemployment rate was higher than 30 percent (year 1982) and the political environment was not tranquil. Thus, employment creation was one of the main objectives of this law. The employment multiplier is the tool that can give us a measure of the impact of the mining operation on employment. We calculate the Type I and II Employment Multipliers because they give a better picture of the impact of mining sector on employment. These multipliers measure the impact using as a base the number of hired workers for the firm or sector. It means that the employment multiplier tells us how many hired workers there will be in the whole market, assuming that the firm or sector hires an additional worker.
Table 2: Employment Multipliers (Type I and II) Sectors Open System Closed System Agriculture 1.06 1.13 Fishing 1.22 1.25 Rest of Mining Sector 2.04 2.76 Private Firm 4.1 6.71 Manufacture 1.39 1.57 Utilities 4.54 6.29 Construction 1.2 1.57 Retails 1.1 1.27 Transportation and Communication 1.12 1.22
Business Services 1.45 2.34 Real State Services 1.01 1.34 Other Services 1.04 1.21 Public Administration 1.03 1.09

9
Source: Aroca (1999b) To analyze the employment multipliers we use Table 2, which was built to evaluate the impact of a private firm on the II Region. In order to do this, the Mining sector of the input output matrix was split in two rows and columns. One of these columns was used to characterize the Private firm and the other was for the rest of the Mining sector. The rest of the Mining sector is older and more traditional, while the Private firm has a few years on the market and a very aggressive management. First of all, a hired worker in the private firm means that 3.1 (Type I) or 5.7 (Type II) additional workers will be hired in the whole regional economy. This number is very impressive, since in the rest of the mining sector the equivalent numbers are much lower. They go from 1 to 1.7. Initially, people argue that the new private firm hired a lower number of workers per ton of produced copper. But, when we analyze the level of labor force in different firms we find something interesting. The private firm had around 2 thousand workers on its payroll, while a state firm (Division Chuquicamata, Codelco, Chile) that has a similar level of production has around 7 thousand hired workers. When we multiply these levels of labor force in each firm by the multipliers we find that there is a very similar quantity of workers associated with each firm, directly and indirectly. Thus, what the huge difference in the multipliers is reflecting is not the difference in intensities of labor but the difference in the management of the firms. While the state firm hires all the workers that it needs to develop its operation, the private firm outsources a great part of its activities, therefore the workers do not show up in the payroll, but indirectly they are working for the private firm. What are the effects of this difference in the management of the business on the Region? We can count positive and negative effects in both situations. The state firm has a more egalitarian wages distribution because the firm hires all the people who work in the mine. In addition, the quantity of workers implies that the firm has scale economies to build facilities for the well being of the labor force. On the other hand, the private firm only hires a portion of the total workers who work in the mine. Many people who work in the mine are not on the payroll of the firm but on the payroll of some other firm. Normally, the salaries paid by the supplying firm are lower than the salaries paid by the private firm, which may create a not so good labor environment. At the same time, there are several new small or medium firms that sell services to the private firm. This is a very positive fact in favor of creating a new productive base and a new class of entrepreneurs that start by selling their services to the mining private firm, and later expand their operation to other sectors of the regional economy. This is the case of securities firms, computing firms, food firms, etc.
10
The state firm is starting to do something similar and several small firms have been created by workers who quit their job in the state firm and sell the service that they provided to state firm as a workers, but now as a small or medium size firm. Thus, these workers not only continue doing the job that they did before, but also they are now the owners of the firm. This process has also been very efficient for the state firm because these workers are much more productive now than before, since the incentives are better.
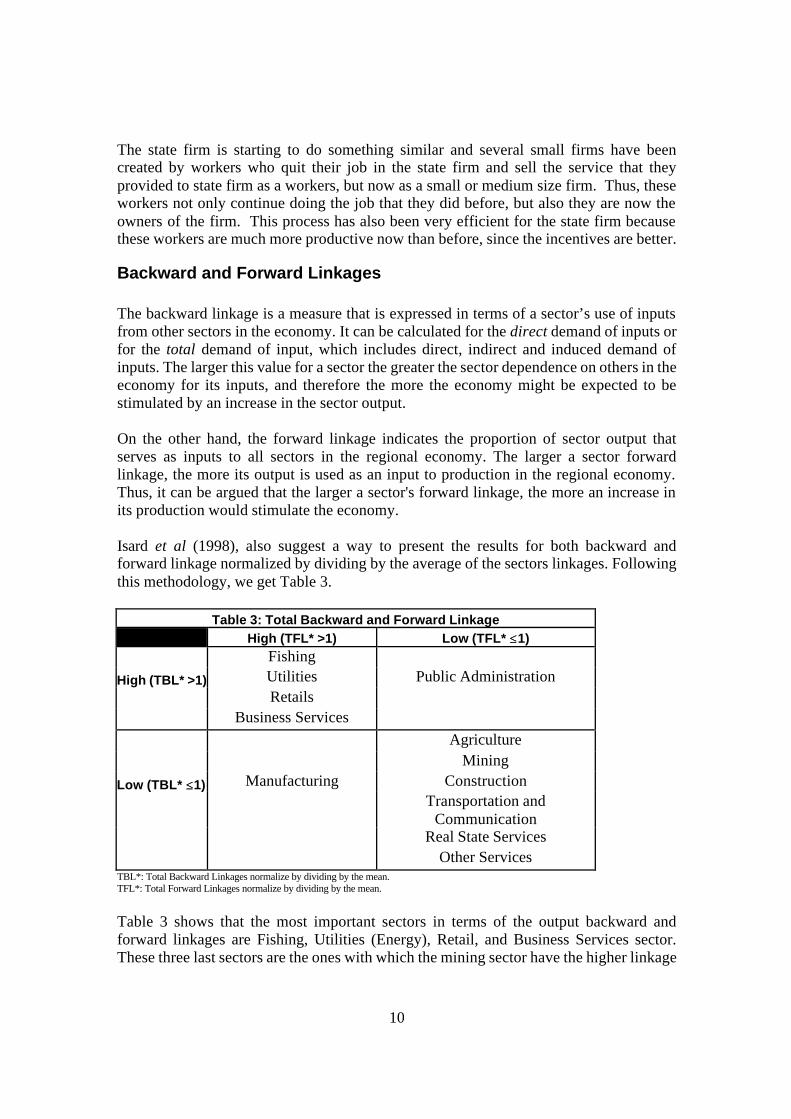
Backward and Forward Linkages The backward linkage is a measure that is expressed in terms of a sector’s use of inputs from other sectors in the economy. It can be calculated for the direct demand of inputs or for the total demand of input, which includes direct, indirect and induced demand of inputs. The larger this value for a sector the greater the sector dependence on others in the economy for its inputs, and therefore the more the economy might be expected to be stimulated by an increase in the sector output. On the other hand, the forward linkage indicates the proportion of sector output that serves as inputs to all sectors in the regional economy. The larger a sector forward linkage, the more its output is used as an input to production in the regional economy. Thus, it can be argued that the larger a sector's forward linkage, the more an increase in its production would stimulate the economy. Isard et al (1998), also suggest a way to present the results for both backward and forward linkage normalized by dividing by the average of the sectors linkages. Following this methodology, we get Table 3.
Table 3: Total Backward and Forward Linkage High (TFL* >1) Low (TFL* ≤≤1)
Fishing
High (TBL* >1) Utilities Public Administration
Retails
Business Services
Agriculture
Mining
Low (TBL* ≤≤1) Manufacturing Construction
Transportation and
Communication Real State Services
Other Services TBL*: Total Backward Linkages normalize by dividing by the mean. TFL*: Total Forward Linkages normalize by dividing by the mean.
Table 3 shows that the most important sectors in terms of the output backward and forward linkages are Fishing, Utilities (Energy), Retail, and Business Services sector. These three last sectors are the ones with which the mining sector have the higher linkage

11
according to Figure 1. Thus, even though the Mining sector is not one of the most important sectors in term of its linkage with other sectors, its main connections are with the three most important sectors of the region. When we combine this result with the fact that the Mining sector produces more than 60 percent of the total regional output, we see, indeed, that the Mining sector is by far the most important sector of the region.
The Mining Sector and the Spatial Context of the II Region In addition to the economic impact of the Mining sector on the Chilean II Region we have another measure that is associated not only with the operation of the mining sector but also with its investment process, which has been one of the main reasons for a high and constant growth in the last decade. In order to show the impact of the growth of the mining sector we follow Aroca and Bosch (2000), where they use a Moran Scatterplot to present one of the consequences of the Mining Sector activities.
-3 -2 -1 0 1 2 3-3
-2
-1
0
1
2
3FIGURE 4: MORAN SCATTERPLOT FOR THE CHILEAN REGIONS 1998
Gross Regional Product Per-Capita
Spa
tial L
ag
V
I
II III
IV
VI VII
VIII
IX X
XI
XII RM
Figure 4 shows the relation between the Gross Regional Product Per-Capita (GRPpc) and its spatial lag, which is calculated as the average of GRPpc of the regions that are neighbors to the region under study. Regions which are in the first quadrant, are the ones that have a GRPpc greater than the country mean and their neighbors also have an average GRPpc greater than the country average; the regions that are located in this

12
quadrant are called hot spots. On the other hand, we have the third quadrant where are located the regions that have GRPpc lower than the average with neighbors with similar characteristics; this zone is a recessive one. The other two quadrants represent transition zones. We calculate this relation from 1960 to 1998 and we find significant differences only in the last decade, where Figure 4 is the most representative. It said that there is a clear hot spot in the north of the country composed by Regions I, II and III. This is a cluster where the II Region is the leader and at the same time the one with biggest GRPpc. This cluster is characterized by the importance of the mining production and given the projects that are in the evaluation or investment process, this zone will continue growing faster than the country average.
Taxes and Patents. In Chile, according to the tributary legislation, the state mining companies pay higher taxes than the private ones. The foreign private mining companies pay a tax of 15% on profits. In addition, they have to pay a tax (35% of profits) on remittances of profits to the exterior, but they can deduct the 15% paid before, so they pay 35 tax% at most. They are also exempted from the payment of added value tax (I.V.A.) on imports of capital goods. On the other hand, the state companies, besides the tax on profits, should pay an extra tax of 40%. It is not deductible; that is to say, their contribution translates to 55% of their profits. (Agancino et al, 1998). An interesting point here is that since 1995 private copper production is greater than state copper production. However, the tax contribution of the private mining sector continues to be much lower than that of the state owned companies. For example, as is shown in Table 4, in the year 1995 the contribution of the private mining sector was 16.1% and in 1996 it reached 25.2% of the total taxes collected in the mining sector, while for those same years the private production of copper represented 53.2% and 60% respectively of the total production of the mining sector of the country. It is important to point out that the money collected in taxes doesn't stay in the region, but rather it goes to the national fiscal budget to be administered by the central government, and thus the impact of tax payments by the mining companies is not tangible directly in the region. On the other hand, private mining companies must pay annually an amount for concept of mining Patents, which varies according to the quantity of hectares used by the mine. The collection stays completely in the region, which is distributed between the municipalities and the F.N.D.R. (National Fund of Regional Development), which finances different projects that contribute with the development of the region. The payment of mining patents results in an important difference in the impact in the II Region between state and private mining, since only the private companies contribute this way to funds that are invested entirely in the region, improving the quality of their inhabitants' life.

13
IMPACTS ON THE COMMUNITY OF THE MINING SECTOR ON THE II REGION In addition to the economic impacts described previously, the Large Scale Regional Mining firms affect the community of the II Region in the following ways: Plans of benefits to the community: The mining companies of the region have undertaken plans of benefits to the community. They can be classified into Plans of Short or of Long Term. Those of short term have as a time horizon the period of exploitation of the mine; on the other hand, those of Long Term seek to produce an impact in the community that goes beyond the useful life of the mine (Sanchez et al, 2000). Among the long term benefits, the most important are those undertaken for Mining Escondida, since it has created a foundation dedicated to finance projects in the education, health and technology areas. This foundation undertakes projects of high social impact on marginal groups of the community, such as indigenous populations, handicapped people, woman household heads with incomplete studies, women in jail, etc. Also, Fundación Escondida has supported cultural and sport programs (Minera Escondida Limited 1998 and 1999). On the other hand, Codelco, the state national company with several divisions in different regions, doesn't concentrate its contributions to the II Region, but on the whole nation. Nevertheless, it is working with local authorities in a program denominated Plan Calama that has as its objective to make the city of Calama more attractive for the workers of Codelco, and close the city of Chuquicamata, which is located on the mine. It means that Codelco will invest in infrastructure of the urban city, and also will expand the possibilities of health, education and entertainment. (CODELCO, 2000).
1990-1996 1996 1995 1994 1993 1992 1991 1990Codelco 2937 629 731 345 77 328 287 539ENAP 456 148 102 117 25 10 29 26Stated Mining Sector 3393 777 833 462 102 338 315 565Mantos Blancos 26.7 4.9 2.3 1.7 1.1 3.3 7.2 6.2Michilla 16.1 5.4 9.5 1.2 0 0 0 0Escondida 744.8 248.4 154.9 138.4 71.2 128.8 3 0.1Soquimich 2.9 2.5 0.3 0 0 0 0.1 0Private Mining Sector 791 261 167 141 72 132 10 6Sector Minería (*) 4183 1038 1000 604 174 471 326 571Otros Sectores 8666 1392 1516 1494 1704 1273 1079 209Total Tax Revenue fron Mining 12849 2430 2516 2097 1878 1743 1405 780
Table 4Tax Revenue from Mining Sector
(Million US$ )
Source: Consultora Gemines; extract from Agacino et al (1998)(*) The included firm represents 80% of the mining sector output.

14
Codelco and most of the private mining companies have a policy of benefits to the community of Short Term which most frequently consists of donations to diverse institutions such as schools, orphanages, old men's shelters, municipalities, sport clubs, etc. These donations are usually contributions in money or in goods that have been used by the companies, such as computers, furniture, etc. Another benefit perceived by the community is the subsidy that some mining companies give to their workers for the purchase of housings through the implementation of residence plans. The Escondida program has built 820 residence units in different sectors of the city of Antofagasta (Minera Escondida Ltda., 1999) and it has subsidized their workers in the purchase of these. Zaldívar has also invested in these plans, but it has given the option to its employees to choose where they want to buy, which has resulted in a better integration of the workers in the community. On the other hand, Codelco historically has given its workers housing at very low cost and now it has a plan to transfer the population of Chuquicamata to the city of Calama, subsidizing workers' purchases of new residences. Decrease in the Level of Poverty: The private mining firms have contributed to lowering the percentage of poor in the II Region, since although the mining itself does not demand non skilled labor, other productive sectors as Construction and Retail sector have hired a considerable part of them, and they are highly associated with the Mining sector (Cochilco, 1999). Negative effects on the population's health: There has been an increase in respiratory illnesses, especially in the town of Chuquicamata. On the other hand, in the region, the biggest quantity in cases of AIDS of the country has been detected, which can be the consequence of an increase of prostitution rates and alcoholism in the region and these problems are typical of neighbor communities of the mine. Another warning indicator in the II Region is that it presents the highest rate of suicides and divorces in the country, which reflects the deterioration that can take place in the family, because the schedule of work that results in the head of the household being absent several days each week. (El Mercurio 2000a and 2000b). A negative externality attributed to the mining companies is the emission of toxic gases to the environment, which is critical near the towns close to a mine, as for instance in the case of the city Chuquicamata, located next to a division of Codelco. At the moment Codelco is developing a decontamination plan and is moving the population to the city of Calama (Fischer 1999). In the case of the other companies located in the region the effect on the air is not so harmful since they are in areas far from the cities. Some CODELCO smelters have violated the environmental norms of the air; among them is Chuquicamata that is located in the II Region. It has been forced to establish a decontamination plan. For this smelter plant, Codelco undertook a plan that involved global investment of US$107 Millions (Codelco 1999).

15
Fortunately, the new mining projects installed in the II Region after 1980 implemented environmental policies in line with international standards, projecting that Chile would sooner or later legislate in this respect. Indeed, in 1992 the state passed the new environmental law and created the National Commission of the Environment (CONAMA), an institution in charge of enforcing the environmental norms (Ginocchio, 1998).
THE ROLE OF THE GOVERNMENT IN MINING SECTOR DEVELOPMENT The main way that the Government has influenced the development of the mining sector has been through the laws. It has created the framework in which the companies will work. Over the last three decades, the mining legislation has evolved according to the country's vision of government. We survey this process as a sequence from the 70s until the current situation.
• Up to 1971 the Chilean Mining Legislation, according to the constitution of 1925, was based on the principle of Freedom of Mines; it implied that the property rights of the mines belonged to its discoverers.
• In July 1971, during the Allende´s Government, the Law 17450 was dictated. Through this Law the nationalization of the mining locations was legalized, changing these from being private property to property in concession, which would be regulated by the new Mining Code. This law meant the expropriation of the large copper mines without compensation. But, the mining code didn't pass because Pinochet's government took office.
• 1974, the Pinochet Government promulgated DL 600 (known as Statute of Foreign Investment), which assured the foreign investor's equitable treatment in front of the national ones, it allows free access to all the sectors of the economy with a minimum intervention of the state in its activities.
• D.L. 1350, in 1976, created the National Corporation of Copper (Codelco - Chile), composed by 4 divisions, which produced 84 percent of Chilean copper (Moguillansky 1998).
• The Law 13156, also promulgated by the military government, established that 10 percent of the sales revenues of Codelco are dedicated to finance the armed forces.
• In 1980, the Pinochet Government passed a new Constitution. This new constitution that came to replace the one of 1925, maintained the spirit of the Law 17450, which means that the full domain of the state on minerals was declared.
• In January of 1982, during the Pinochet Government, the Constitutional Organic Law on Mining Concessions (LOCCM) was promulgated. This Organic Law modifies the spirit of the Constitution substantially and tries to stimulate private investment with guarantees unprecedented in other economic activities. In this law, the Full Domain of the State with regard to the mining wealth is defined as subsidiary, which means that it is valid in case there is no private firm that

16
discovers the mine and/or requests it in concession. The concession for exploitation has an indefinite duration, since its conservation is only subject to the payment of an annual patent which is also deductible from tax payments. (Agancino et al, 1998).
• In 1992, the Aylwin Government promulgated law 19137. It allows Codelco-Chile to develop associations with private firms for the exploration and exploitation of new mines.
• Laws of Atmospheric Contamination. Two bodies of law have been passed: the D.S. 185 (Supreme Law, 1992) that establishes maximum levels of contamination in the air, and the Ordinance Nº 165/98 (June 1999) that regulates emissions of arsenic to the air.
• Laws on Water Contamination: They are dispersed in several legal bodies because the resource is required for different uses. The most known are the Code of Waters and the Code of Mining.
This whole institutional framework has reestablished private and foreign investors' trust in the country, making Chile an attractive place to invest, particularly in the mining sector, which was strongly affected by the nationalization of the mines. Nevertheless, the legal stability has turned out to be a necessary, but not sufficient condition to stimulate the realization of mining projects, since business takes into account other long term factors such as geologic characteristics, incorporation of new technologies that reduce the production costs in the industry of the copper, price perspectives and the mineral and political and economic stability of the country. These conditions have been met, so at the end of the 1980s, the mining boom started up and in 1989 the investment in the country via DL 600 was US$974 Millions (see Table 5).
As shown in the Figure 5, foreign investments were concentrated in the mining sector until the year 1995, with projects of copper exploitation located in the II Region being predominant. Starting from 1996 the mining investment boom lost n relative importance, since of the US$4800 Millions of foreign investment materialized in the country that year, only 20.7 percent went to the mining sector.
SECTORProm. 74-89 89 90 91 92 93 94 95 96 97 98 99
Total 311 974 1320 980 995 1724 2519 3020 4800 5041 5998 9086Mining 90 686 803 440 563 902 1761 1716 995 1626 2394 1221Other Sectors 221 288 517 540 432 822 758 1304 3805 3415 3604 7865% Mining 28.94 70.43 60.83 44.90 56.58 52.32 69.91 56.82 20.73 32.26 39.90 13.40Fuente: Moguillansky 1998 y Cochilco 2000h.
Table 5Foreign Investment Based on DL 600
(US$ Million)

17
The strong investment carried out in the mining sector brought the consequence that Chile recovered the world leadership in the copper production, passing from producing 11% of the world total in 1970 to 30% in 1998 (see Figure 6).
0%
20%
40%
60%
80%
100%
Per
cen
t
Prom. 74-89
89 90 91 92 93 94 95 96 97 98 99
Year
FIGURE 5: FOREIGN INVESTMENT BASED ON DL 600
Other Sectors
Mining
FIGURE 6: WORLD COPPER OUTPUT
0%
10%
20%
30%
40%
50%
60%
70%
80%
90%
100%
70 71 72 73 74 75 76 77 78 79 80 81 82 83 84 85 86 87 88 89 90 91 92 93 94 95 96 97 98
Year
Per
cen
t
Rest of World
Chilean

18
It is important to highlight that when we are referring to private mining, we are speaking almost entirely of foreign investors, because Chilean companies (with the exception of the group Luksic, owner of the mine Michilla and Pelambres) did not participate in the boom, mainly because of capital constraints, since the necessary investment amount in the sector is very high. On the other hand, participation by institutions that manage big quantities of money to invest, such as the Pensions Fund Administrator (A.F.P), is limited because the mining sector exceeds the maximum risk allowed.
ACTIONS TO STIMULATE DEVELOPMENT IN THE II REGION Several actions can be taken in order to stimulate regional development. Propositions in this respect include:
• In order to maintain or improve the quality of the environment it is necessary to comply with the environmental law. The enforcement is still poor and there is a lot of room for the state and companies to improve their environmental performance.
• In order to promote the growth of the productive base it is necessary to improve the financial system. The small and medium firms have serious problems getting credit from the banks; these problems are the collateral and the cost (interest rate). Some institutions have proposed a system of venture capital or special banks supported by the State. This is a very important problem to solve in order to expand the productive base of the II Region
• The forward linkages are really low in the copper industry in the II Region and there are few possibilities to increase it. Thus, it is important to make stronger the backward linkages by developing some of the following activities:
o Developing a medium and small supplier program with the objective to improve the quality of the services and inputs that are bought or outsourced by the large-scale mining companies.
o A practice that had had good experimental results is the support of the large-scale mining companies to a technical education institute. There is a low supply of skilled workers at technical level, and initiatives like this could strengthen the productive base.
• The large-scale mining companies should try to hire local labor or promote migration.
• The head offices of the companies are normally located in Santiago (Chilean capital city), because the main offices of the Government and the financial institutions are there. However, if they were located in the II Region, many of the firms whose main clients are the mining companies would move to the II Region, improving the productive base of the zone.
In addition, all the current programs with the objective of helping the community should be reinforced, making them as efficient as possible.

19
CONCLUSION We can highlight the following results from the research:
• The mining sector impact on the gross regional output is important because of the level of mining sector and not because the linkages with the other sectors of the region.
• The mining sector impact on the income implies that for each American dollar that is produced nine cents go to the workers of the mining sector and between 7 and 15 cents go to the workers of the other productive regional sectors.
• There are some significant differences between the private and state owned companies with respect to the management of the labor force. While state owned companies hired almost all the workers that they need to operate the mine, the private firms outsourced an important part of its operation. This management strategy has an important positive impact in developing a productive base in the zone.
• The tax system is very different for state and private owned firms. Although the tax payments of both types of firms benefit mainly the central government, some of the payments of the private firms stays in the regions.
• The mining sector is still one of the main sectors attracting foreign investment, and during the last decade it has been the cause of the huge economic growth in the region and the country.
• There are positive and negative impacts on the community. Here, the commitment of the companies and the regional government authorities is necessary to deal with the growing problems such as prostitution, AIDS, high rate of divorces, high rate of suicide, etc., which are directly or indirectly related to the development of the mining sector.

20
REFERENCES Agacino, R., C. Gonzalez and J. Rojas (1998). Capital Transnacional y Trabajo. El Desarrollo Minero en Chile. LOM Ediciones, Santiago, Chile. Aroca, Patricio (1999a). Una Matriz Insumo – Producto para la II Región: Metodologías y Resultados. Mimeo, IDEAR , Universidad Católica del Norte, Antofagasta, Chile. Aroca, Patricio (1999b). Evaluación del Impacto Económico del Proyecto Fase IV de Minera Escondida Limitada sobre la II Región y el País. Mimeo, IDEAR, Universidad Católica del Norte, Antofagasta, Chile. Aroca, P. and M. Bosch (2000). Crecimiento, Convergencia y Espacio en las Regiones Chilenas: 1960-1998. Estudios de Economía, (Forthcoming), Universidad de Chile, Santiago, Chile. COCHILCO (1999). Impactos Sociales de la Minería Privada en Chile. Documento Interno, Dirección de Estudios, Santiago, Chile. COCHILCO (2000). News on http://www.cochilco.cl
a) Planes de Descontaminación en Fundiciones Estatales b) Inversión Extranjera Materializada en Minería según DL 600 por
Regiones c) El Rol del Estado en la Minería Chilena d) EL Rol del Estado para el Desarrollo de la Minería e) Producción Chilena de Cobre Comerciable f) Normativa Relacionada con Minería g) Hacia una política Nacional del Cobre h) Inversión Extranjera en Chile Según DL 600
CODELCO, Memorias Anuales: 1997, 1998 and 1999. Santiago, Chile. CODELCO (2000). News on http://www.codelco.com/, “Codelco y Su Entorno.” El Mercurio (2000a). Demandas por Nulidades. Martes 19 de Septiembre, Antofagasta, Chile. El Mercurio (2000b). Sin ganas de vivir. Miércoles 20 de Septiembre, Antofagasta, Chile. Empresa Minera de Mantos Blancos S.A. Memoria Anual 1998, Antofagasta, Chile. Fischer, Nicole (1999). Role of State Owned Companies and Transnational Corporations in the Sustainable Development of Chile. MBA Thesis, Judge Institute of Management Studies, Cambridge University, UK.
21
Ginocchio, Rosanna (1998). Chile: Restoration Challenges... Mining Environmental Management, March, pp. 7-9. ILADES-Georgetown University and GERENS Ltda. (1996). The Copper Boom in the Chilean Economy: What should we expect?. Cochilco, Santiago, Chile. Isard, W., I.J. Azis, M.P.Drennan, R.E. Miller, S. Saltzman, E. Thorbecke (1998). Methods of Interregional and Regional Analysis. Ashgate, Hants, UK. La Tercera (2000). Los Resultados de Codelco. Miércoles 11 de Agosto, Santiago, Chile Minera Escondida Limitada, Memorias Anuales: 1998 and 1999. Antofagasta, Chile. Minera Michilla S.A. Memorias Anuales: 1998 and 1999, Antofagasta, Chile. O’Brien, Juan (1994). Undoing a Myth: Chile’s Debt to Copper and Mining. ICME, Ontario, Canada. Ocaranza, J., O. Arce and V. Perez (2000). Estadísticas del Cobre y Otros Minerales 1990-1999. Cochilco, Santiago, Chile. Sanchez, José Miguel et al (2000). Análisis Medioambiental, Sociocultural y Económico de la Gran Minería y la Comunidad. Estudios de Casos en Chile. Informe Final, Instituto de Economía, PUC, Santiago, Chile. Vial, F. and M. Lufin (1993). Subcontratación y Desarrollo Sustentable en la II Región. Ambiente y Desarrollo, Septiembre, pp. 46-51.

22
APPENDIX 1 INPUT OUTPUT MATRIX FOR THE CHILEAN II REGION
Sectors 1 2 3 4 5 6 7 8 9 10 11 12 Int. Sales C Other FD FD Total PP
1Agriculture 0 0 0 0 0 0 0 0 0 0 0 0 0 5,723 42 5,765 5,765
2Fishing 0 5,134 0 8,906 0 0 0 0 0 0 58 0 14,099 8,796 7,953 16,749 30,848
3Mining 0 1 1,876 1,582 64 4,849 305 37 947 0 44 31 9,738 366 4,084,462 4,084,828 4,094,566
4Manufacture 334 1,982 4,433 58,780 9,013 95,400 17,786 9,042 12,296 190 5,911 44 215,211 120,356 140,347 260,702 475,914
5Utilities 22 31 224,050 7,827 226,460 2,194 5,200 1,504 9,180 665 2,174 3,592 482,899 35,831 116,320 152,151 635,050
6Construction 0 0 0 0 0 0 0 880 0 0 0 0 880 0 826,536 826,536 827,416
7Retails 133 690 225,097 1,561 3,184 1,960 1,896 3,463 3,724 10 2,253 87 244,059 82,663 7,741 90,404 334,463
8Transp/Comm. 113 29 17,290 1,877 6,274 152 2,554 7,594 438 0 1,147 1,743 39,211 101,345 10,816 112,161 151,372
9Business Serv. 14 254 311,788 19,198 10,495 26,691 49,118 6,130 152,387 34 7,164 4,969 588,241 19,693 0 19,693 607,934
10Real State Serv. 0 0 0 0 0 0 0 0 0 0 0 0 0 89,451 0 89,451 89,451
11Other Services 7 2 178 11 2,676 287 845 1,777 90 109 1,232 73 7,287 161,870 68,629 250,499 237,786
12Public Adm. 0 0 0 0 0 0 0 0 0 0 0 0 0 0 32,883 32,883 32,883
Inter. Buys 624 8,123 784,712 99,742 258,167 131,533 77,703 30,427 179,062 1,009 19,982 10,540 1,601,624 626,094 5,315,729 5,941,823 7,543,447
Wages 940 5,029 398,034 50,949 22,293 221,472 104,032 40,308 207,137 35,656 95,113 21,627 1,202,591 0 0 0 1,202,591
Depreciation 382 2,466 119,862 35,018 96,144 11,509 0 12,783 0 2,243 3,889 0 284,297 0 0 0 284,297
Profits 2,082 6,861 1,944,354 130,135 154,557 113,635 106,601 41,318 82,801 19,053 96,068 0 2,697,466 0 0 0 2,697,466
Ind. Taxes 126 218 110,953 2,524 0 2,641 2,779 911 13,075 642 1,294 0 135,164 0 0 0 135,164
Import 1,610 8,151 736,771 157,261 103,889 346,625 61,409 24,750 129,360 30,849 20,916 716 1,622,305 0 0 0 1,622,305
Total PP 5,765 30,848 4,094,685 475,629 635,050 827,416 352,525 150,498 611,434 89,451 237,263 32,883 7,543,447 626,094 5,315,729 5,941,823 13,485,270
Employment 532 6,462 21,452 15,454 865 20,385 23,103 14,314 9,433 3,167 18,364 11,729
Source: Aroca (1999). In thousands of American Dollars