ARobustComparisonoftheKDDCup99and NSL ... · NSL-KDD datasets were normalized to values between 0...
8
A Robust Comparison of the KDDCup99 and NSL-KDD IoT Network Intrusion Detection Datasets Through Various Machine Learning Algorithms Suchet Sapre, Pouyan Ahmadi, Khondkar Islam Department of Information Sciences and Technology George Mason University Fairfax, USA ssapre, pahmadi, [email protected] Abstract—In recent years, as intrusion attacks on IoT networks have grown exponentially, there is an immediate need for sophis- ticated intrusion detection systems (IDSs). A vast majority of current IDSs are data-driven, which means that one of the most important aspects of this area of research is the quality of the data acquired from IoT network traffic. Two of the most cited intrusion detection datasets are the KDDCup99 and the NSL- KDD. The main goal of our project was to conduct a robust comparison of both datasets by evaluating the performance of various Machine Learning (ML) classifiers trained on them with a larger set of classification metrics than previous researchers. From our research, we were able to conclude that the NSL-KDD dataset is of a higher quality than the KDDCup99 dataset as the classifiers trained on it were on average 20.18% less accurate. This is because the classifiers trained on the KDDCup99 dataset exhibited a bias towards the redundancies within it, allowing them to achieve higher accuracies. Index Terms—Intrusion Detection, Machine Learning, NSL- KDD, KDDCup99, Artificial Neural Network, Random Forest, Support Vector Machine, Naïve Bayes Classifier I. I With the rapid development of the internet, intrusion attacks on IoT networks have been growing exponentially and are a highly pertinent threat in the modern era. Millions of internet users, companies, and national governments are liable to cyberattacks. Consequently, creating sophisticated methods to identify these network intrusions is one of the most prevalent problems in cybersecurity research. Network intrusion detection systems (IDSs) heavily rely on data from IoT networks to "learn" patterns that allow them to identify compromised networks. Two prominent datasets used for network intrusion classification are the KDDCup99 and NSL-KDD. The KDDCup99 dataset was created in 1999 by researchers at the University of California, Irvine and was the pioneer intrusion detection dataset. However, it has been empirically shown that the KDDCup99 dataset contains many inefficiencies. The NSL-KDD dataset, which is a subsample of the KDDCup99 dataset, was created by the University of New Brunswick Canadian Institute for Cybersecurity in response to these flaws. Throughout this paper, we will refer to two different classifi- cation subproblems: binary and type classification. The binary classification refers to identifying whether a network state rep- resents an intrusion or not (no intrusion / normal = 0, intrusion = 1). The type classification refers to identifying whether a network state represents one of five different intrusion types: Normal (no intrusions), DoS, Probe, R2L, and U2R. These intrusion types are defined in the "Datasets (IV)" section. In the past, there have been very few exhaustive comparisons of both the KDDCup99 and NSL-KDD datasets. As a result, this study hopes to shed light on the similarities and differences between these datasets in regards to how various Machine Learning (ML) classifiers train and perform on them. We used four ML classifiers for this study: the Naïve Bayes Classifier (NBC), Support Vector Machines (SVMs), Random Forests, and Artificial Neural Networks (ANNs). II. R R Artificial Intelligence (AI) and ML have been readily used to analyze and classify data in both the KDDCup99 and NSL-KDD network intrusion detection datasets. The most common methods of analysis in the past have been classical ML algorithms such as SVMs and NBCs, however, recently, the focus has shifted to the use of ANNs. For instance, a team of researchers was able to obtain around an 80% accuracy for the binary classification of the NSL-KDD dataset with an ANN. This result is approximately the same as the result we obtained using an ANN [4]. In regard to comparing the quality of both datasets, another group analyzed ensemble ML model’s ability to classify IoT intrusion attacks in both of these datasets. They found that in general, the classifiers trained on the KDDCup99 dataset obtained a higher accuracy than those trained on the NSL- KDD dataset. However, this team utilized feature selection when preprocessing their data, which demonstrates why they were able to obtain characteristically higher accuracies of 99.42% and 98.70% on the KDDCup99 and NSL-KDD datasets respectively for the binary classification task [5]. arXiv:1912.13204v1 [cs.LG] 31 Dec 2019
Transcript of ARobustComparisonoftheKDDCup99and NSL ... · NSL-KDD datasets were normalized to values between 0...

A Robust Comparison of the KDDCup99 andNSL-KDD IoT Network Intrusion DetectionDatasets Through Various Machine Learning
AlgorithmsSuchet Sapre, Pouyan Ahmadi, Khondkar IslamDepartment of Information Sciences and Technology
George Mason UniversityFairfax, USA
ssapre, pahmadi, [email protected]
Abstract—In recent years, as intrusion attacks on IoT networkshave grown exponentially, there is an immediate need for sophis-ticated intrusion detection systems (IDSs). A vast majority ofcurrent IDSs are data-driven, which means that one of the mostimportant aspects of this area of research is the quality of thedata acquired from IoT network traffic. Two of the most citedintrusion detection datasets are the KDDCup99 and the NSL-KDD. The main goal of our project was to conduct a robustcomparison of both datasets by evaluating the performance ofvarious Machine Learning (ML) classifiers trained on them witha larger set of classification metrics than previous researchers.From our research, we were able to conclude that the NSL-KDDdataset is of a higher quality than the KDDCup99 dataset as theclassifiers trained on it were on average 20.18% less accurate.This is because the classifiers trained on the KDDCup99 datasetexhibited a bias towards the redundancies within it, allowingthem to achieve higher accuracies.
Index Terms—Intrusion Detection, Machine Learning, NSL-KDD, KDDCup99, Artificial Neural Network, Random Forest,Support Vector Machine, Naïve Bayes Classifier
I. IntroductionWith the rapid development of the internet, intrusion attacks
on IoT networks have been growing exponentially and are ahighly pertinent threat in the modern era. Millions of internetusers, companies, and national governments are liable tocyberattacks. Consequently, creating sophisticated methods toidentify these network intrusions is one of the most prevalentproblems in cybersecurity research.Network intrusion detection systems (IDSs) heavily rely on
data from IoT networks to "learn" patterns that allow themto identify compromised networks. Two prominent datasetsused for network intrusion classification are the KDDCup99and NSL-KDD. The KDDCup99 dataset was created in 1999by researchers at the University of California, Irvine and wasthe pioneer intrusion detection dataset. However, it has beenempirically shown that the KDDCup99 dataset contains manyinefficiencies. The NSL-KDD dataset, which is a subsample ofthe KDDCup99 dataset, was created by the University of NewBrunswick Canadian Institute for Cybersecurity in response tothese flaws.
Throughout this paper, we will refer to two different classifi-cation subproblems: binary and type classification. The binaryclassification refers to identifying whether a network state rep-resents an intrusion or not (no intrusion / normal = 0, intrusion= 1). The type classification refers to identifying whether anetwork state represents one of five different intrusion types:Normal (no intrusions), DoS, Probe, R2L, and U2R. Theseintrusion types are defined in the "Datasets (IV)" section. Inthe past, there have been very few exhaustive comparisons ofboth the KDDCup99 and NSL-KDD datasets. As a result, thisstudy hopes to shed light on the similarities and differencesbetween these datasets in regards to how various MachineLearning (ML) classifiers train and perform on them. We usedfour ML classifiers for this study: the Naïve Bayes Classifier(NBC), Support Vector Machines (SVMs), Random Forests,and Artificial Neural Networks (ANNs).
II. Related ResearchArtificial Intelligence (AI) and ML have been readily used
to analyze and classify data in both the KDDCup99 andNSL-KDD network intrusion detection datasets. The mostcommon methods of analysis in the past have been classicalML algorithms such as SVMs and NBCs, however, recently,the focus has shifted to the use of ANNs. For instance, a teamof researchers was able to obtain around an 80% accuracyfor the binary classification of the NSL-KDD dataset with anANN. This result is approximately the same as the result weobtained using an ANN [4].In regard to comparing the quality of both datasets, another
group analyzed ensemble ML model’s ability to classify IoTintrusion attacks in both of these datasets. They found thatin general, the classifiers trained on the KDDCup99 datasetobtained a higher accuracy than those trained on the NSL-KDD dataset. However, this team utilized feature selectionwhen preprocessing their data, which demonstrates why theywere able to obtain characteristically higher accuracies of99.42% and 98.70% on the KDDCup99 and NSL-KDDdatasets respectively for the binary classification task [5].
arX
iv:1
912.
1320
4v1
[cs
.LG
] 3
1 D
ec 2
019

Finally, one of the most relevant research studies to thecontents of this paper was conducted by the original creatorsof the NSL-KDD dataset. This team constructed the NSL-KDD dataset as a means of improving the KDDCup99 dataset.Namely, they removed redundant and repetitive records fromthe KDDCup99 dataset in hopes of improving its quality. Thisgroup also tested numerous ML algorithms on their newlycreated NSL-KDD dataset and observed lower accuracies onit in comparison to the KDDCup99 dataset for the binaryclassification task. They attributed this lower accuracy to theincreased rigor of the NSL-KDD dataset as represented by theremoval of "easy-to-classify" records [6].
III. System ModelFigure 1 shows the system model for this study starting from
the dataset and ending with the evaluation of the various MLclassifiers.
Fig. 1. Diagram of System Model
IV. DatasetsA. Overview
Both the KDDCup99 and NSL-KDD datasets contain fivemain intrusion types or categories: Normal (No intrusion),DoS, Probe, U2R, and R2L. These intrusion types are definedbelow,
1) Normal: Networks that do not contain any intrusions.2) DoS: Shutting down a network by flooding it with
information and requests.3) R2L: Unauthorized access from a remote machine4) U2R: Intruder attempts to gain access to a normal user
account5) Probe: Surveillance intrusions on networks [9].
In addition, we will also consider the binary categorizationfor this dataset (i.e. 0 representing when a network intrusiondoes NOT occur and 1 representing when a network intru-sion DOES occur). These two categorization types will bereferenced throughout the paper as "type categorization" and"binary categorization," respectively.
1) KDDCup99: The KDDCup99 is the original IoT net-work intrusion dataset that was created in 1999. The motiva-tion behind the dataset’s creation was to improve the capabilityof IDSs. Namely, with this dataset, cybersecurity researcherscould train algorithms to better identify when a network intru-sion occurs based on quantitative and categorical data regard-ing the state of the network itself. With respect to the trainingand test datasets, we used the pre-sampled 10% subset of theKDDCup99 training dataset ("kddcup.data_10_percent.gz") asour experimental training dataset and the full KDDCup99test dataset ("corrected.gz") as our experimental test dataset.This choice was made in order to reduce the computationalpower required to process and handle the full training dataset.Henceforth, whenever we say "KDDCup99 training dataset",we are referring to the 10% subset of the full KDDCup99training dataset [9].One of the most important aspects of this dataset is the im-
balanced class distribution. Notably, the extremely low numberof both R2L and U2R intrusion types present within it. Figure2 and Table 1 display the class distribution within this dataset,illustrating the relatively low number of R2L and U2R attacktypes in comparison to the other three. Table 2 displays theclass distribution in the context of the binary categorization. Itis evident that the number of intruded networks far outnumbersthe number of normal networks.
TABLE IIntrusion-Type Class Distribution in KDDCup99 Training Dataset
Normal DoS R2L U2R Probe
Frequency 97,278 391,458 1,126 52 4,107
Fig. 2. Intrusion-Type Class Distribution in KDDCup99 Training Dataset
TABLE IIBinary Class Distribution in KDDCup99 Training Dataset
Normal Intrusion
Frequency 97,278 396,743
2) NSL-KDD: The NSL-KDD dataset is the improvedversion of the KDDCup99 dataset. In essence, researchers inthe University of New Brunswick Canadian Institute for Cyber-security removed redundant records from the original KDD-Cup99 dataset to create a more concise and efficient intrusion

detection dataset. Concerning the training and test datasets, weused the full NSL-KDD training ("KDDTrain+.TXT") and test("KDDTest+.TXT") datasets as our experimental training andtest datasets. We were able to do this because the NSL-KDDdataset is much smaller in comparison to the full KDDCup99dataset [10].
Although there is still a class imbalance between intrusiontypes, namely, the low number of U2R and R2L intrusions,the fact that there are far fewer instances of the other threeintrusion types mitigates the effect of this class imbalance incomparison to the KDDCup99 training dataset. Figure 3 andTable 3 illustrate this. Moreover, Table 4 displays the classdistribution in the context of the binary categorization. It isimportant to note that there is a much greater class balancebetween normal and intruded networks in comparison to theKDDCup99 training dataset.
TABLE IIIIntrusion-Type Class Distribution in NSL-KDD Training Dataset
Normal DoS R2L U2R Probe
Frequency 67,343 45,927 995 52 11,656
Fig. 3. Intrusion-Type Class Distribution in NSL-KDD Training Dataset
TABLE IVBinary Class Distribution in NSL-KDD Training Dataset
Normal Intrusion
Frequency 67,343 58,630
B. PreprocessingBecause both datasets contained categorical features, we
one-hot encoded all of these categorical columns so that theML algorithms could "understand" the data.
The train and test datasets for both the KDDCup99 andNSL-KDD datasets were normalized to values between 0and 1 by the L2 or Euclidian normalization. When the L2normalization is applied on vector ®x, such that ®y = ®x
‖ ®x ‖ , thesum of the squares of the components of ®y (the normalizedvector) equals 1. The L2 normalization was used instead ofthe L1 normalization because it has been demonstrated that
the former has many advantages that improve the performanceof ML classifiers.
V. Machine Learning MethodsThis section describes the theory and implementation of the
four ML algorithms that we used in this study: the Naïve BayesClassifier (NBC), Support Vector Machines (SVMs), RandomForests, and Artificial Neural Networks (ANNs). As a note,all of the ML classifiers were trained on normalized data.
A. Naïve Bayes Classifier1) Overview: The NBC is a probabilistic classifier that
utilizes the Bayes theorem. Its naivety comes from the ratherstrong assumptions of independence among the features ina particular dataset. Bayes theorem can be expressed as thefollowing mathematical relationship:
P(Ck | ®x) =P(®x |Ck)P(Ck)
P(®x) , (1)
where ®x = (x1, x2, ... , xn) is a data point consisting of nindependent features, Ck represents class k, and P(Ck | ®x) is theprobability that data point ®x belongs to class Ck . The NBCalgorithm applies Bayes theorem across all of the featureswithin the dataset. In this manner, the class y that data point®x belongs to (as predicted by the NBC) can be expressed as
y = argmaxk∈{1,...,K }
P(Ck)n∏i=1
P(xi |Ck). (2)
Because some of the features within both datasets were contin-uous values, we used the Gaussian NBC which simply assumesthat these continuous features are distributed according to theGaussian distribution. Additionally, for the multi-class portionof this classification task, we used the Multinomial NBC.Going into this study, the NBC served as our standard of
comparison as it is known to be less accurate than the otherthree classifiers used in this study [1].
2) Implementation: As previously mentioned the GaussianNBC was used for both the binary and type classification tasks.Additionally, for the type classification task, the Multinomialvariant of the Gaussian NBC was used.
B. Support Vector Machines1) Overview: SVMs are ML algorithms that attempt to use
hyperplane-based vectors in order to separate the data‘s labelswith maximal margin. With this hyperplane separation, theSVM is then able to "understand" the spatial location of theclasses within the dataset [8].
2) Implementation: Because SVMs are traditionally usedfor binary classifications, we only used the SVM in orderto classify whether or not a particular network contained anintrusion. This means we did not use the SVM to classify theintrusion type. This is reflected in the results section.SVMs are known to be computationally expensive. As a
result, we only used a 0.05% random sample of both the

KDDCup99 and NSL-KDD training datasets to train our SVM.Furthermore, we utilized the linear kernel for our SVM.
C. Random Forest1) Overview: Random Forests or random decision trees
function by creating numerous "mini" decision trees or esti-mators and repeatedly training these estimators on a particulardataset. The Random Forest evaluates output by essentiallytaking the majority vote of these estimators. More formally,classification occurs by taking the average (or the majorityvote) of the estimators for a given input sample x ′ as repre-sented by the mathematical function:
f =1B
B∑b=1
fb(x‘) (3)
Here, f represents the class that sample x‘ belongs to(as predicted by the Random Forest), B is the number ofestimators, and fb is a function representing what class theparticular estimator b predicts sample x ′ to be in [7].
2) Implementation: We used 5 estimators in our implemen-tation of the Random Forest algorithm. Furthermore, becauseRandom Forests are also computationally expensive, we onlytrained it on a 0.1% random sample of both the KDDCup99and NSL-KDD training datasets. The Random Forest algo-rithm was adaptable to both the binary and type classificationtasks. Figures 4 and 5 show sample shallow estimators fromour KDDCup99 and NSL-KDD Random Forests, respectively.
Fig. 4. Random Forest Estimator - KDDCup99
D. Artificial Neural Network1) Overview: ANNs mimic the processing techniques of the
human brain. They do this by passing "information" througha series of weighted neuron layers (nodes) which are fine-tuned until the ANN can successfully replicate the patternsand relationships within datasets’ features and labels. This issimilar to how our brain gradually adjusts neural connectionsto learn new skills.
Fig. 5. Random Forest Estimator - NSL-KDD
Looking at the mathematical nature of a single node, thisconnectivity is clear. If there are four nodes each contain-ing the input scalars x1, x2, x3, x4, respectively, that all passinformation into one node, there will be four connections.Each of these connections will have a particular "weight",w1,w2,w3,w4, respectively. To replicate the human brain, theone neuron that is receiving the information from the otherfour has to scale each of the inputs (xi’s) by the weight oftheir connection. Then, the ANN sums all of these weightedinputs adds a scalar bias and applies an activation functionwhich helps introduce non-linearity to the model. In all, thiscan be represented mathematically as:
Neuron Output = f (b +∑i
wi xi). (4)
Here, f is the activation function (sigmoid, ReLU, etc.) and bis the scalar bias.
2) Implementation: The topology of our ANN consistedof two hidden layers of size 100 nodes and one output layerof size 5 or 1 nodes depending on whether the classificationwas type or binary, respectively. Figures 6 and 7 depict thetopology of the binary and type classification ANN, respec-tively. Both hidden layers were activated by the ReLU functiondefined as,
ReLU(x) = max(0, x), (5)
The 1 node output layer was activated by the sigmoid functiondefined as,
sigmoid(x) = 11 + e−x
, (6)
and finally, the 5 node output layer was activated by thesoftmax function defined as,
SoftMax(z)i =ezi∑Nj=1 ez j
for i = 1, ..., N
and z = (zi, ..., zN ) ∈ RN .
(7)

This function can take a vector z of dimension N with realvalues and normalize that vector such that the sum of itscomponents is 1. After normalization, the components of zare probabilities representing the extent to which the classifierbelieves a particular data point belongs to each class [11].
Fig. 6. Binary Classification ANN Topology
Fig. 7. Type Classification ANN Topology
Two primary training specifications were present in theANN’s we used in this study: validation-loss based patienceand model checkpoints. Validation-loss based patience refersto how many epochs we let our ANN train for. Specifically,we allowed our ANN to keep training until the validation-lossdid not decrease for a chosen number of epochs, in our case,we chose this number to be 20 (patience = 20). The modelcheckpoints specification allowed us to save the best modelfrom the ANN’s entire training time based on the validation-
loss. To clarify, consider an ANN that trained for 200 epochs,if the validation-loss was the best at epoch 58, the ANN fromepoch 58 would be saved and used for the results.The Adam Optimizer was chosen here as it has been proven
to work for a vast majority of ML classification tasks [3].Additionally, we employed the Categorical Cross Entropy(CCE) loss function defined below:
CCE Loss = −M∑c=1
yo,c log(po,c). (8)
Here, M is the number of different classes, y is the binaryindicator (0 or 1) that the class label c is correct for observationo, and p is the probability, calculated by the classifier, thatobservation o belongs to class c [2]. Figures 8 and 9 depictsample training/testing accuracy and loss curves in the trainingprocedure for both the KDDCup99 and NSL-KDD dataset-based classifiers during the binary classification task. It isimportant to note that the KDDCup99-ANN’s validation lossfunction decreases over an interval while the NSL-KDD-ANN’s validation loss function is nearly always increasing.These graphs are cut off at 20 epochs.
Fig. 8. Traning/Testing Loss & Accuracy Curve - KDDCup99
Fig. 9. Traning/Testing Loss & Accuracy Curve - NSL-KDD
VI. ResultsA. Evaluation CriteriaTwo separate trials were conducted to evaluate the perfor-
mance of the ML classifiers. Firstly, we had to evaluate theirperformance in the type classification task. To do this weutilized an overall testing accuracy (the classifiers’ accuracyon the testing portions of the KDDCup99 and NSL-KDD
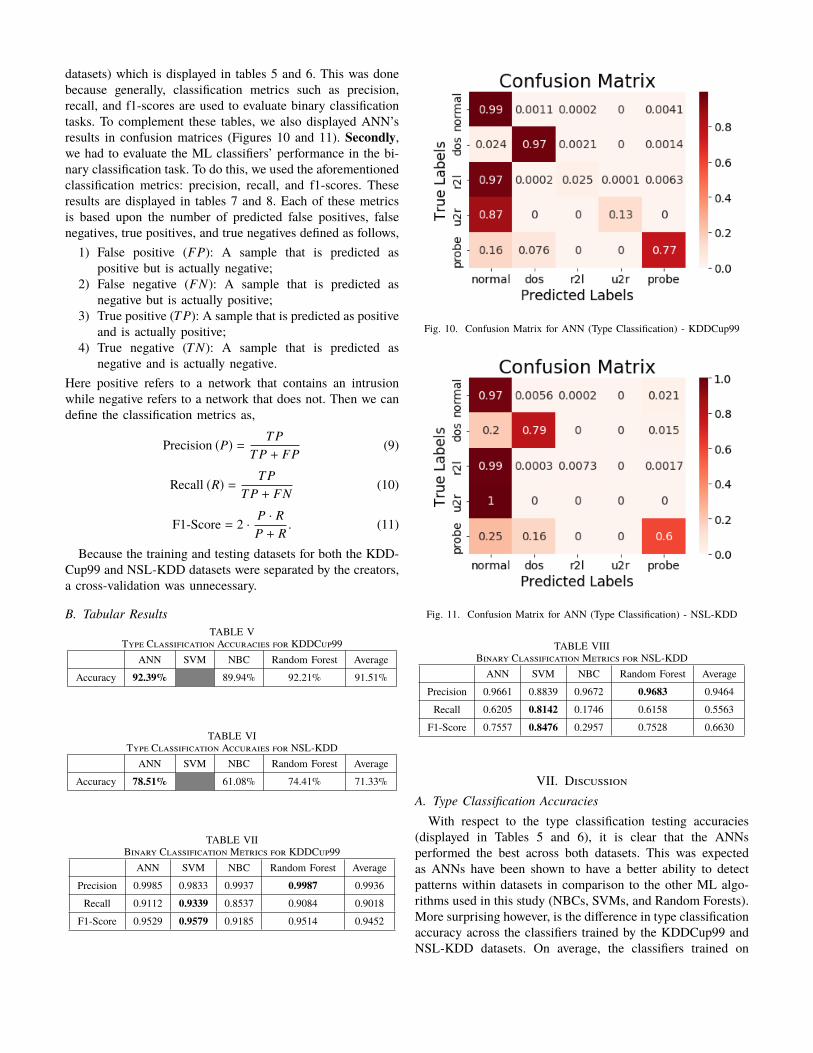
datasets) which is displayed in tables 5 and 6. This was donebecause generally, classification metrics such as precision,recall, and f1-scores are used to evaluate binary classificationtasks. To complement these tables, we also displayed ANN’sresults in confusion matrices (Figures 10 and 11). Secondly,we had to evaluate the ML classifiers’ performance in the bi-nary classification task. To do this, we used the aforementionedclassification metrics: precision, recall, and f1-scores. Theseresults are displayed in tables 7 and 8. Each of these metricsis based upon the number of predicted false positives, falsenegatives, true positives, and true negatives defined as follows,
1) False positive (FP): A sample that is predicted aspositive but is actually negative;
2) False negative (FN): A sample that is predicted asnegative but is actually positive;
3) True positive (TP): A sample that is predicted as positiveand is actually positive;
4) True negative (T N): A sample that is predicted asnegative and is actually negative.
Here positive refers to a network that contains an intrusionwhile negative refers to a network that does not. Then we candefine the classification metrics as,
Precision (P) = TPTP + FP
(9)
Recall (R) = TPTP + FN
(10)
F1-Score = 2 · P · RP + R
. (11)
Because the training and testing datasets for both the KDD-Cup99 and NSL-KDD datasets were separated by the creators,a cross-validation was unnecessary.
B. Tabular ResultsTABLE V
Type Classification Accuracies for KDDCup99ANN SVM NBC Random Forest Average
Accuracy 92.39% 89.94% 92.21% 91.51%
TABLE VIType Classification Accuraies for NSL-KDD
ANN SVM NBC Random Forest Average
Accuracy 78.51% 61.08% 74.41% 71.33%
TABLE VIIBinary Classification Metrics for KDDCup99
ANN SVM NBC Random Forest Average
Precision 0.9985 0.9833 0.9937 0.9987 0.9936
Recall 0.9112 0.9339 0.8537 0.9084 0.9018
F1-Score 0.9529 0.9579 0.9185 0.9514 0.9452
Fig. 10. Confusion Matrix for ANN (Type Classification) - KDDCup99
Fig. 11. Confusion Matrix for ANN (Type Classification) - NSL-KDD
TABLE VIIIBinary Classification Metrics for NSL-KDDANN SVM NBC Random Forest Average
Precision 0.9661 0.8839 0.9672 0.9683 0.9464
Recall 0.6205 0.8142 0.1746 0.6158 0.5563
F1-Score 0.7557 0.8476 0.2957 0.7528 0.6630
VII. DiscussionA. Type Classification AccuraciesWith respect to the type classification testing accuracies
(displayed in Tables 5 and 6), it is clear that the ANNsperformed the best across both datasets. This was expectedas ANNs have been shown to have a better ability to detectpatterns within datasets in comparison to the other ML algo-rithms used in this study (NBCs, SVMs, and Random Forests).More surprising however, is the difference in type classificationaccuracy across the classifiers trained by the KDDCup99 andNSL-KDD datasets. On average, the classifiers trained on

the KDDCup99 dataset displayed a 20.18% greater accuracythan those trained on the NSL-KDD dataset. This accuracydifference can be attributed to the fact that the KDDCup99contains many redundant records which are extremely easyfor classifiers to identify.
B. U2R and R2L Identification
Figures 10 and 11 display the confusion matrices for theANN’s classification results. One unusual aspect about theseconfusion matrices is the difference in the classification accu-racy for R2L and U2R attacks. Specifically, the ANN trainedon the KDDCup99 dataset correctly predicted 2.5% of R2Land 13% of U2R attacks while the ANN trained on the NSL-KDD dataset only predicted 0.73% of R2L and 0% of U2Rattacks. This result goes against one of the primary intentionsof the creation of the NSL-KDD dataset. Namely, the increasedclass balance in the NSL-KDD dataset should have madedetecting these infrequent intrusion types easier, however, ourresults show that it might, in fact, be more difficult. Thissuggests that some of the records that were removed from theKDDCup99 dataset to create the NSL-KDD dataset may havebeen essential to properly distinguishing U2R and R2L attacksfrom the three other intrusion types. Notably, the ANN trainedon the NSL-KDD dataset primarily classified R2L and U2Rattacks as Normal networks. This shows that there may beunderlying problems in the NSL-KDD dataset that is causingthis seemingly irrational judgement.
C. Binary Classification Accuracies
The binary classification task sought to identify whether aparticular network state was normal or was representative of anintrusion attack. Surprisingly, across both the KDDCup99 andNSL-KDD dataset-trained classifiers the SVMs performed thebest with f1-scores of 0.9579 and 0.8476, respectively. Thisresult was surprising because SVMs are not as sophisticatedas Random Forests or ANNs. Looking specifically at precisionand recall values, it is evident that the Random Forests hadthe best precision values while the SVMs had the best recallvalues. The ANNs and Random Forests did not perform thebest in any of the three categories (precision, recall, or f1-score).
More generally, the classifiers trained on the NSL-KDDdataset had an average f1-score of 0.6630 while the classifierstrained on the KDDCup99 dataset had a much higher averagef1-score of 0.9452. A deeper look at this difference revealsthat the primary setback for the NSL-KDD-trained classifierswere their low recall values. Namely, the average KDDCup99classifier recall value was 0.9018 while the average NSL-KDDclassifier recall value was much lower at 0.5563. This meansthat the NSL-KDD classifiers tended to predict many morefalse negatives. Overall, however, the fact that the NSL-KDDclassifiers had a lower performance indicates that the NSL-KDD dataset contains a much more rigorous set of data, whichis essential to the strengthening of IDSs.
Fig. 12. PCA Visualization of KDDCup99 Dataset
Fig. 13. PCA Visualization of NSL-KDD Dataset
D. Principle Component Analysis
Figures 12 and 13 display the Principle Component Analysisplots of a random 0.4% subset of the KDDCup99 dataset anda random 1% subset of the NSL-KDD dataset, respectively.The Principle Component Analysis allowed us to reduce thedimensionality of the datasets so that they could be visualizedon graphs. We observed that the KDDCup99 dataset containeda greater degree of separation between the different intrusiontypes while the NSL-KDD dataset contained much moreoverlap. This is consistent with our results as data that hasa higher degree of separation between classes is easier toclassify. However, this increased spatial separation present inthe KDDCup99 dataset is probably indicative of redundantrecords that are geometrically "overlapping".
VIII. Conclusions & Future Research
The quality of the NSL-KDD dataset is significantly higherthan that of the KDDCup99 dataset. This conclusion is basedoff the metrics used to evaluate the performance of the variousML classifiers.
1) Type classification accuracies: The respective test-ing type classification accuracies of the ML classifierstrained on the NSL-KDD dataset were much lowerthan the classifiers trained on the KDDCup99 dataset.This demonstrates how the redundant records in the

KDDCup99 dataset enables algorithms to perform witha higher accuracy.
2) Binary classification metrics (Precision, Recall, andF1-scores): It was observed that the average f1-score forthe ML classifiers trained on the KDDCup99 dataset,0.9452, was much higher than the F1-score for the MLclassifiers trained on the NSL-KDD dataset, 0.6630.This further indicates that the ML classifiers performbetter on the KDDCup99 dataset due to the redundantand "easy-to-classify" records within it.
One interesting aspect of our results was the relatively lowclassification accuracy of the R2L and U2R intrusion typesby the classifiers trained on the NSL-KDD dataset. Typically,researchers have found that the NSL-KDD dataset allows fora higher classification accuracy for these intrusion types dueto the decreased class imbalance, however, our results showedthe opposite. This is likely due to differences in data samplingor classifier topology/architecture.
In the future, our team plans to develop "stacked" orensemble ML classifiers that are specifically geared towardshaving a higher accuracy on the NSL-KDD dataset as it isof a significantly higher quality than the KDDCup99 dataset.Specifically, we hope to improve the characteristically lowrecall values our classifiers obtained on the NSL-KDD datasetwhich means being able to mitigate the number of falsenegatives. Finally, we hope to expand our comparative analysisto a wider set of ML classification algorithms for greatercompleteness.
AcknowledgmentWe would like to acknowledge the UCI Knowledge Discov-
ery in Databases Archive for providing us with the KDDCup99dataset and the University of New Brunswick Canadian Insti-tute for Cybersecurity for providing us with the NSL-KDDdataset.
References[1] McGonagle J. Naive Bayes Classifier. Brilliant.org. https://brilliant.org/
wiki/naive-bayes-classifier/[2] Loss Functions. https://ml-cheatsheet.readthedocs.io/en/latest/loss_
functions.html[3] D. Kingma and J. Ba. (2017, January). Adam: A Method For Stochastic
Optimization. arXiv. https://arxiv.org/pdf/1412.6980.pdf[4] Ingre B. and Yadav A. (2015, January). Performance analysis of
NSL-KDD dataset using ANN. 2015 International Conferenceon Signal Processing And Communication EngineeringSystems (SPACES). https://www.researchgate.net/profile/Anamika_Yadav2/publication/309698316_Performance_analysis_of_NSL-KDD_dataset_using_ANN/links/5959eceeaca272c78abf14bc/Performance-analysis-of-NSL-KDD-dataset-using-ANN.pdf
[5] Shrivas A. and Dewangan A. (2014, August). An Ensemble Model forClassification of Attacks with Feature Selection based on KDD99 andNSL-KDD Data Set. International Journal of Computer Applications(0975 âĂŞ 8887). http://citeseerx.ist.psu.edu/viewdoc/download?doi=10.1.1.677.7890&rep=rep1&type=pdf
[6] Tavallaee M., Bagheri E., Lu W., and Ghorbani A. (2009, July). ADetailed Analysis of the KDD CUP 99 Data Set. NRC PublicationsArchive (NPArC). https://www.researchgate.net/publication/48446353_A_detailed_analysis_of_the_KDD_CUP_99_data_set
[7] Random Forests. McGill University. http://www.math.mcgill.ca/yyang/resources/doc/randomforest.pdf
[8] Suykens J., Vandewalle J. (1999). Least Squares Support Vector MachineClassifiers. Neural Processing Letters 9: 293âĂŞ300. https://link.springer.com/article/10.1023/A:1018628609742
[9] The UCI KDD Archive. (1999, October). KDD Cup 1999 Data. http://kdd.ics.uci.edu/databases/kddcup99/kddcup99.html
[10] University of New Brunswick Canadian Institute for Cybersecurity.(2009, July). NSL-KDD dataset. https://www.unb.ca/cic/datasets/nsl.html
[11] Bishop C. (2006). Pattern Recognition and Machine Learning.http://users.isr.ist.utl.pt/~wurmd/Livros/school/Bishop%20-%20Pattern%20Recognition%20And%20Machine%20Learning%20-%20Springer%20%202006.pdf
![Rigging & Lifting Handbook [NSL]](https://static.fdocuments.us/doc/165x107/55cf9d1d550346d033ac4bbc/rigging-lifting-handbook-nsl.jpg)