
Arni v Palma
88
Árni Vignir Pálmason REYST report 01-2010 Wind Power Pumped Storage System for Hydropower Plants REYKJAVÍK ENERGY GRADUATE SCHOOL OF SUSTAINABLE SYSTEMS
-
Upload
anand-gautam -
Category
Documents
-
view
233 -
download
2
description
fjyd
Transcript of Arni v Palma
REYST LEI‹ARLÍNUR
Árni Vignir Pálmason
REYST report 01-2010
Árni V
ignir Pálmason W
ind Power Pum
ped Storage System for H
ydropower Plants
RE
YST
report 01-2010
Wind Power Pumped Storage System for Hydropower Plants
REYKJAVÍK ENERGY GRADUATE SCHOOL OF SUSTAINABLE SYSTEMS
Reykjavík Energy Graduate School of Sustainable Systems (REYST) combines the expertise of its partners: Reykjavík Energy, Reykjavík University and the University of Iceland.
Objectives of REYST:Promote education and research in sustainable energyAttract talented graduates into the important field of sustainable energyProvide industry and academia with qualified experts in engineering, business and earth sciences
REYST is an international graduate programme open for students holding BSc degrees in engineering, earth sciences or business.
REYST offers graduate level education with emphasis on practicality , innovation and interdisciplinary thinking.
REYST reports contain the master’s theses of REYST graduates who earn their degrees from the University of Iceland and Reykjavík University.
REYST LEI‹ARLÍNUR
REYST LEI‹ARLÍNUR
Wind power pumped storage system for hydropower plants
Árni Vignir Pálmason
Faculty of Industrial Engineering, Mechanical Engineering and
Computer Science University of Iceland
2010


Wind power pumped storage system for hydropower plants
Árni Vignir Pálmason
30 ECTS thesis submitted in partial fulfillment of a Magister Scientiarum degree in Sustainable Energy Business
Supervisor(s) Halldór Pálsson
Helga Kristjánsdóttir Páll Jensson
Faculty Representative Ágúst Valfells
Faculty of Industrial Engineering, Mechanical Engineering and Computer Science
School of Engineering and Natural Sciences University of Iceland
Reykjavik, 18. December 2009

Wind power pumped storage system for hydropower plants Pumped storage system for hydro power plants 30 ECTS thesis submitted in partial fulfillment of a Magister Scientiarum degree in Sustainable Energy Business Copyright © 2009 Árni Vignir Pálmason All rights reserved Faculty of Industrial Engineering, Mechanical Engineering and Computer Science School of Engineering and Natural Sciences University of Iceland Dunhaga 3 107, Reykjavik Iceland Telephone: 525 4000 Bibliographic information: Árni Vignir Pálmason, 2009, Wind power pumped storage system for hydropower plants, Master’s thesis, Industrial Engineering, Mechanical Engineering and Computer Science, University of Iceland, pp. 73. ISBN XX Printing: Háskólaprent Reykjavik, Iceland, 18. December 2009
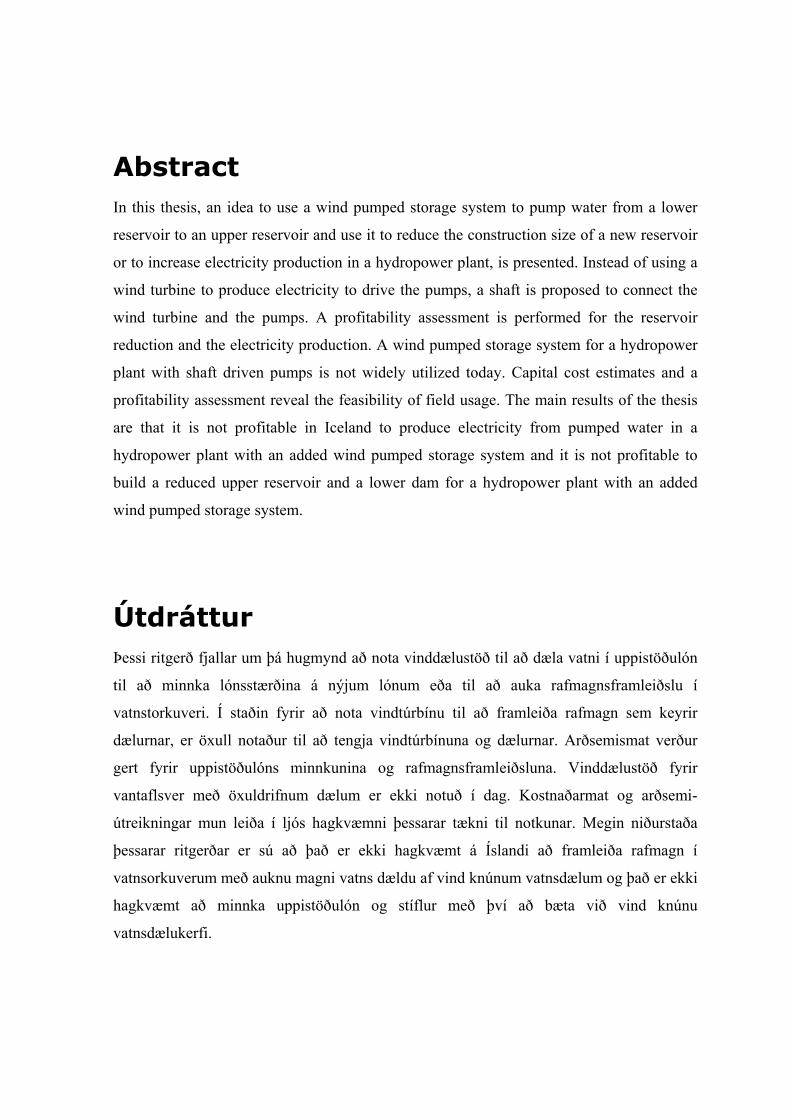
Abstract In this thesis, an idea to use a wind pumped storage system to pump water from a lower
reservoir to an upper reservoir and use it to reduce the construction size of a new reservoir
or to increase electricity production in a hydropower plant, is presented. Instead of using a
wind turbine to produce electricity to drive the pumps, a shaft is proposed to connect the
wind turbine and the pumps. A profitability assessment is performed for the reservoir
reduction and the electricity production. A wind pumped storage system for a hydropower
plant with shaft driven pumps is not widely utilized today. Capital cost estimates and a
profitability assessment reveal the feasibility of field usage. The main results of the thesis
are that it is not profitable in Iceland to produce electricity from pumped water in a
hydropower plant with an added wind pumped storage system and it is not profitable to
build a reduced upper reservoir and a lower dam for a hydropower plant with an added
wind pumped storage system.
Útdráttur Þessi ritgerð fjallar um þá hugmynd að nota vinddælustöð til að dæla vatni í uppistöðulón
til að minnka lónsstærðina á nýjum lónum eða til að auka rafmagnsframleiðslu í
vatnstorkuveri. Í staðin fyrir að nota vindtúrbínu til að framleiða rafmagn sem keyrir
dælurnar, er öxull notaður til að tengja vindtúrbínuna og dælurnar. Arðsemismat verður
gert fyrir uppistöðulóns minnkunina og rafmagnsframleiðsluna. Vinddælustöð fyrir
vantaflsver með öxuldrifnum dælum er ekki notuð í dag. Kostnaðarmat og arðsemi-
útreikningar mun leiða í ljós hagkvæmni þessarar tækni til notkunar. Megin niðurstaða
þessarar ritgerðar er sú að það er ekki hagkvæmt á Íslandi að framleiða rafmagn í
vatnsorkuverum með auknu magni vatns dældu af vind knúnum vatnsdælum og það er ekki
hagkvæmt að minnka uppistöðulón og stíflur með því að bæta við vind knúnu
vatnsdælukerfi.

v
Table of Contents List of Figures .................................................................................................................... vii
List of Tables ..................................................................................................................... viii
Nomenclature ...................................................................................................................... ix
Acknowledgements ............................................................................................................. xi
1 Introduction ..................................................................................................................... 1
2 Pumped storage systems ................................................................................................. 7
3 A wind pumped storage system ..................................................................................... 9
4 A windpump .................................................................................................................. 11
5 Centrifugal pumps and pipelines ................................................................................ 13
6 A wind atlas for Iceland ............................................................................................... 17
7 Wind Power ................................................................................................................... 21
8 Economic feasibility of a windpump ........................................................................... 29
9 Discussion ...................................................................................................................... 35
10 Conclusion ..................................................................................................................... 39
References .......................................................................................................................... 41
Appendix A – Information from automatic weather stations in Iceland ..................... 45
Appendix B – Information for Goulds pumps ................................................................ 47
Appendix C – Calculations of dams, pipes, shafts and wind turbine cost .................... 51
Appendix D – Information about Vestas V80-2.0 MW wind turbine ........................... 53
Appendix E – The Excel Model for the Profitability Assessment ................................. 55
Appendix F – Permissions to use data in the thesis ........................................................ 65
Appendix G – The Profitability Assessment model ........................................................ 69
Appendix H – The SWOT analysis .................................................................................. 71
Appendix I – The leak from the Sigalda dam ................................................................. 73

vi
vii
List of Figures Figure 1. A pumped storage system with wind turbines producing electricity ..................... 2
Figure 2. The SWOT analysis for a wind pumped storage system in Iceland ...................... 4
Figure 3. Horizontal axis wind turbines (Vestas, 2009) ........................................................ 9
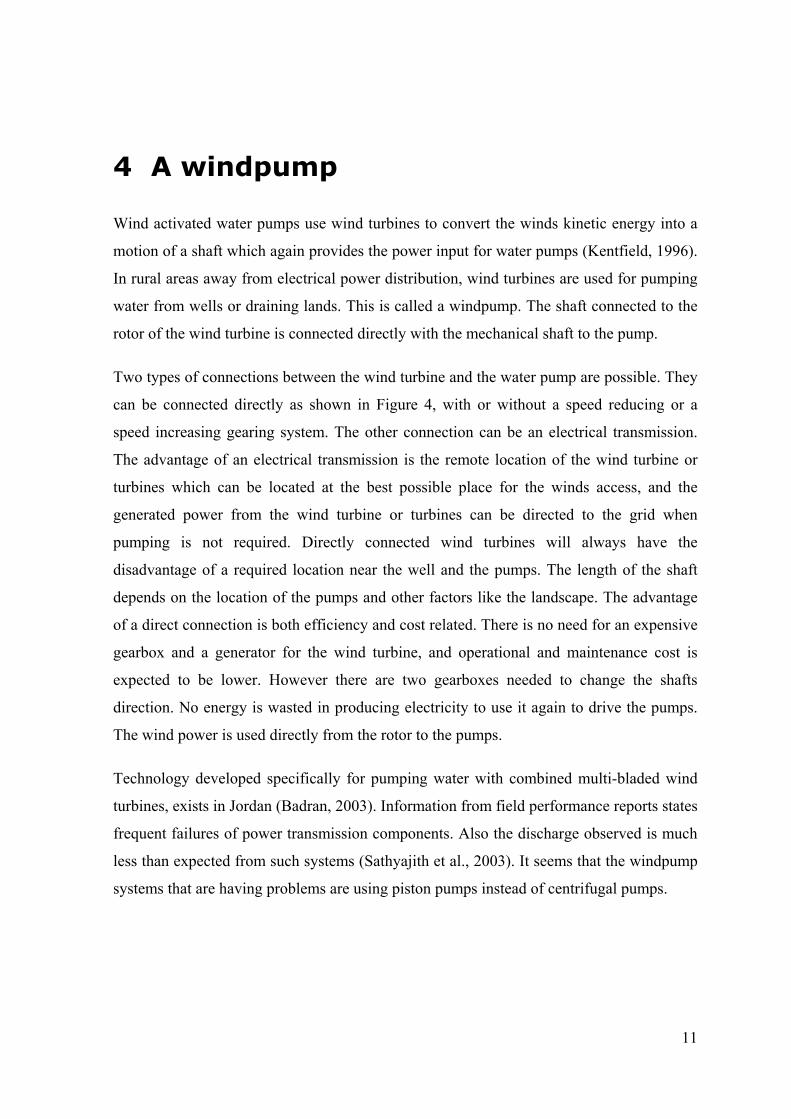
Figure 4. A horizontal axis wind turbine connected directly to a pump ............................. 12
Figure 5. Goulds 316SS Centrifugal Pump 3175 XL (Bid on Equipment, 2009) ............... 13
Figure 6. Landsvirkjun hydropower plants in the Þjórsá area (Windatlas, 2009) ............... 17
Figure 7. A wind turbine producing electricity to pump water ........................................... 24
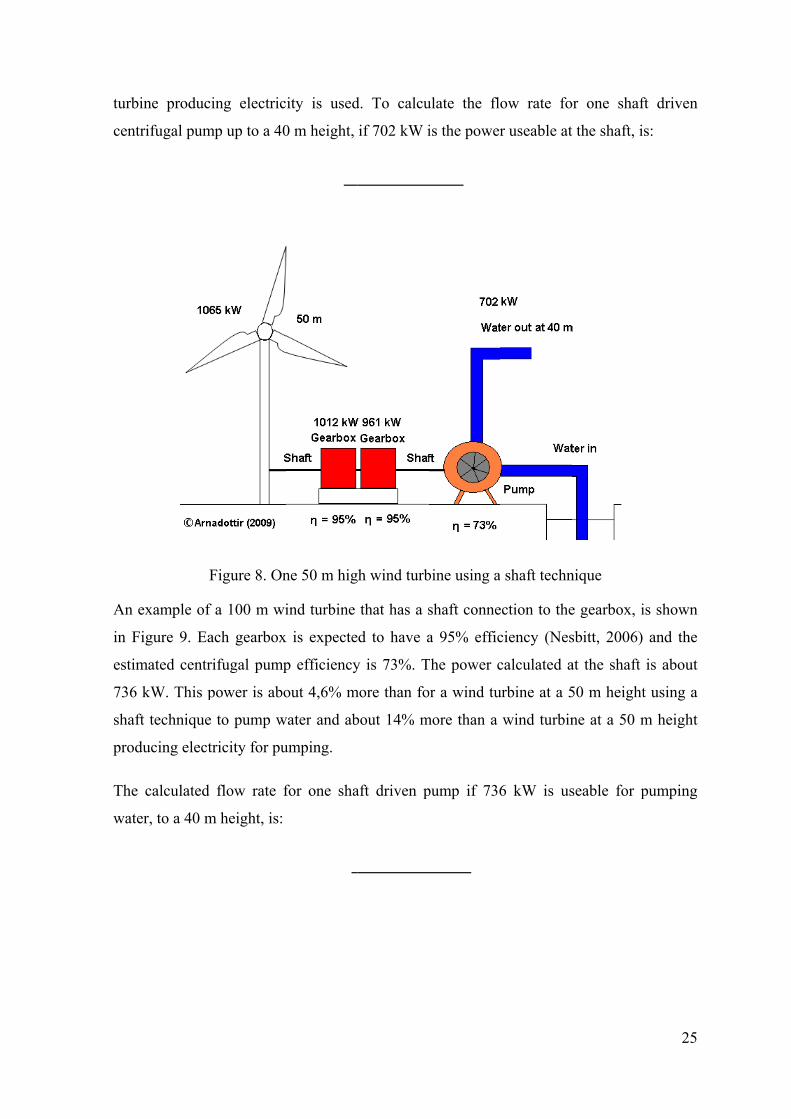
Figure 8. One 50 m high wind turbine using a shaft technique ........................................... 25
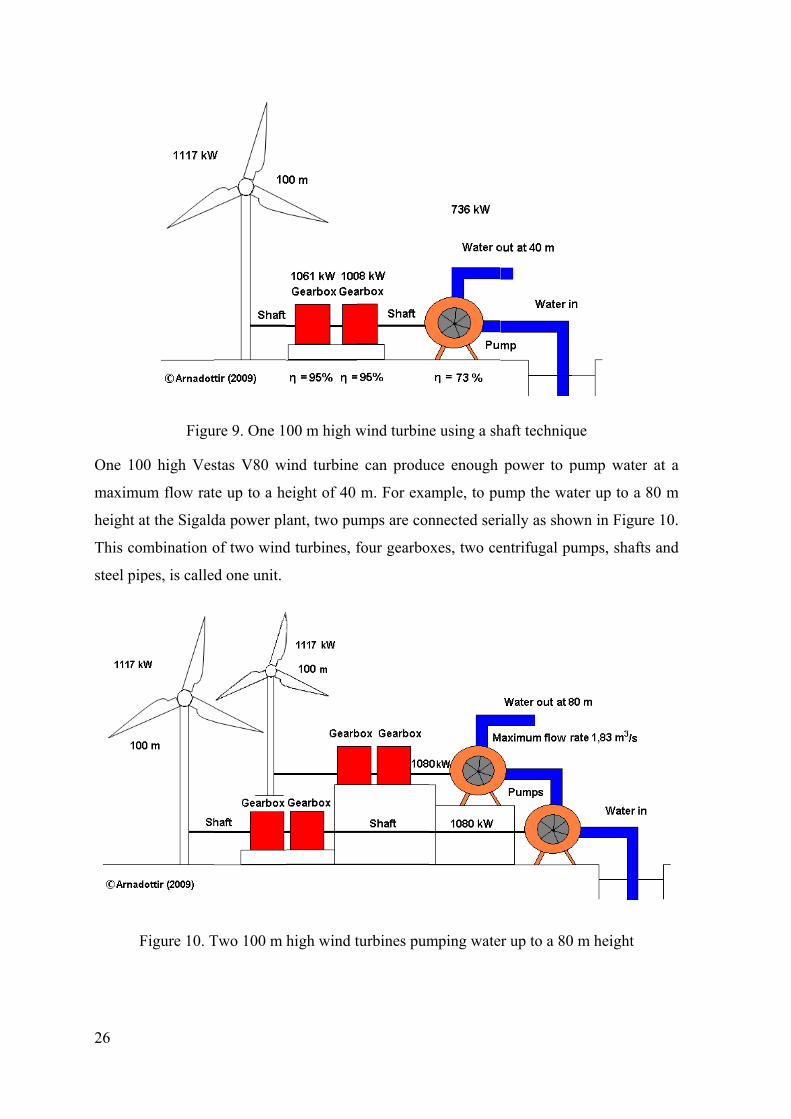
Figure 9. One 100 m high wind turbine using a shaft technique ......................................... 26
Figure 10. Two 100 m high wind turbines pumping water up to a 80 m height ................. 26
Figure 11. The cash flow for the project with eight units ................................................... 32
Figure 12. Accumulated Net Present Value for the eight wind turbine units ...................... 33
Figure 13. Internal Rate of Return for the project with eight units ..................................... 34
Figure 14. Comparing three different interest rates for the eight wind turbine units .......... 34
Figure 15. The leak form the Sigalda dam captured and measured .................................... 36
Figure 16. Water level in Krókslón 2006 (Landsvirkjun, 2009) ......................................... 37

viii
List of Tables Table 1. Wind information from two locations in the Þjórsá area at a 50m height ............ 18
Table 2. Wind information from two locations in the Þjórsá area at a 100m height .......... 19
Table 3. Wind power produce by Vestas V80 calculated at a 50 m height ........................ 22
Table 4 Wind power produce by Vestas V80 calculated at a 100 m height ....................... 23
ix
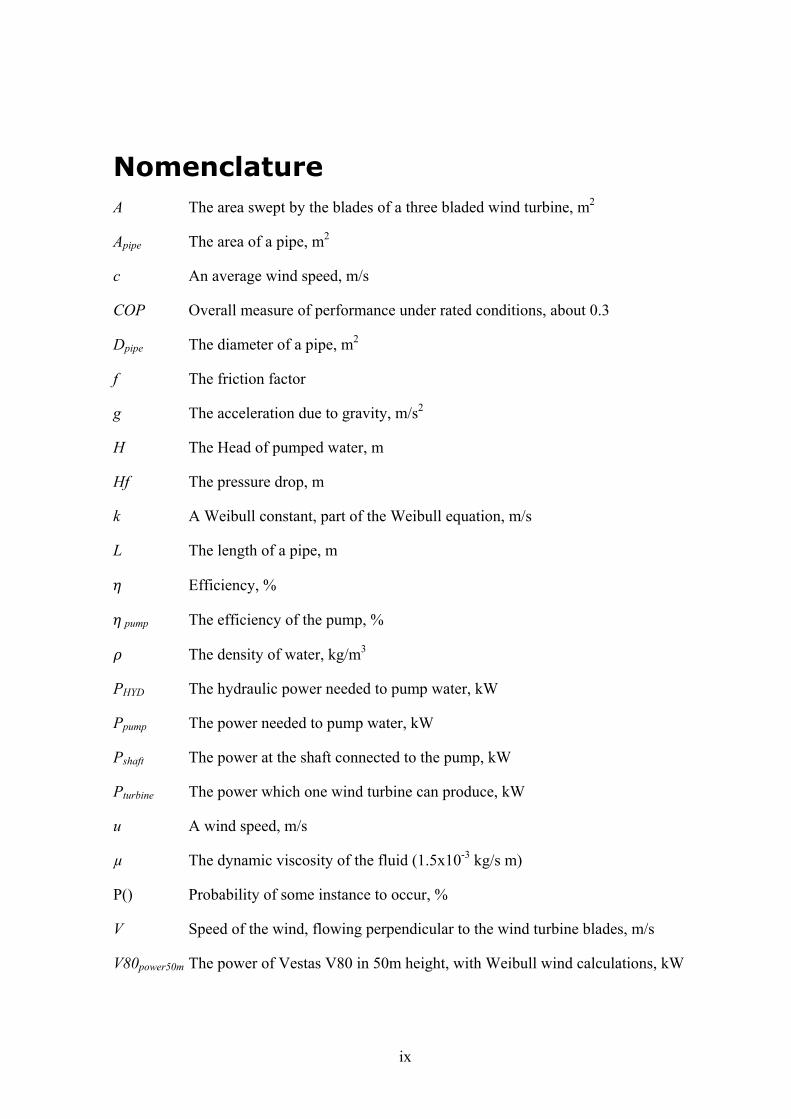
Nomenclature A The area swept by the blades of a three bladed wind turbine, m2
Apipe The area of a pipe, m2
c An average wind speed, m/s
COP Overall measure of performance under rated conditions, about 0.3
Dpipe The diameter of a pipe, m2
f The friction factor
g The acceleration due to gravity, m/s2
H The Head of pumped water, m
Hf The pressure drop, m
k A Weibull constant, part of the Weibull equation, m/s
L The length of a pipe, m
Efficiency, %
pump The efficiency of the pump, %
The density of water, kg/m3
PHYD The hydraulic power needed to pump water, kW
Ppump The power needed to pump water, kW
Pshaft The power at the shaft connected to the pump, kW
Pturbine The power which one wind turbine can produce, kW
u A wind speed, m/s
µ The dynamic viscosity of the fluid (1.5x10⁻³ kg/s m)
P() Probability of some instance to occur, %
V Speed of the wind, flowing perpendicular to the wind turbine blades, m/s
V80power50m The power of Vestas V80 in 50m height, with Weibull wind calculations, kW
x
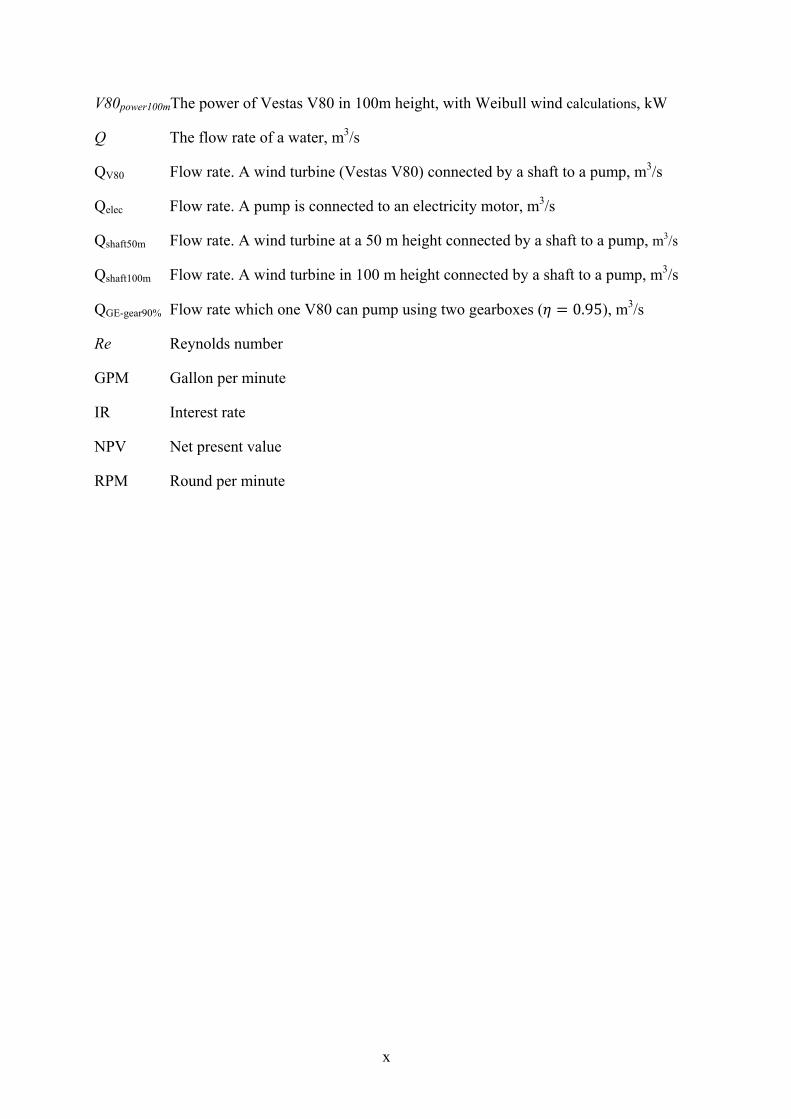
V80power100mThe power of Vestas V80 in 100m height, with Weibull wind calculations, kW
Q The flow rate of a water, m3/s
QV80 Flow rate. A wind turbine (Vestas V80) connected by a shaft to a pump, m3/s
Qelec Flow rate. A pump is connected to an electricity motor, m3/s
Qshaft50m Flow rate. A wind turbine at a 50 m height connected by a shaft to a pump, m3/s
Qshaft100m Flow rate. A wind turbine in 100 m height connected by a shaft to a pump, m3/s
QGE-gear90% Flow rate which one V80 can pump using two gearboxes ( 0.95), m3/s
Re Reynolds number
GPM Gallon per minute
IR Interest rate
NPV Net present value
RPM Round per minute

xi
Acknowledgements Many thanks to my wife, Hrafnhildur, for her assistance and patience during the time I
spent writing this thesis and during my study.
I’d like to thank my supervisors, at the University of Iceland, Halldór, Helga and Páll for
their guidance and invaluable information.
Thanks to Rán Jónsdóttir at Landsvirkjun for her assistance in finding values and prices for
my calculations. I also want to thank Daði Viðar Loftsson and Ingvar Hafsteinsson for a
sightseeing trip to Sigalda hydropower plant in July 2009.
Also, thanks to the academic council of REYST, for giving me the opportunity, at a very
short notice, to study at the REYST School.

1
1 Introduction Iceland is located in the northern Atlantic Ocean. The first hydropower plant for public use
was built in 1904. After the construction of Búrfell hydropower plant in 1969, in relation to
an aluminum smelter in Straumsvík, the electricity usage demand increased rapidly. Most
of it, about 62-65%, has been for the industry sector (Ragnarsson, 2006). Electricity in
Iceland is mostly produced in hydro- and geothermal power plants. Another renewable
energy source that has not been used to produce electricity in Iceland is the wind. Iceland
is located at one of the windiest location on Earth. This renewable resource is especially
high, both in terms of intensity and consistency.
Electricity generated by a wind installation connected to the national grid could be just
about 5% of the current total electricity production in Iceland because of high electricity
usage for heavy industry (Sigurjónsson, 2009). No wind farm is now operating in Iceland
because of a higher capital cost than for hydro- and geothermal power plants, unsecure
electricity production and strong and irregular wind conditions. The interest has been
mostly in utilizing the waterfalls and the heat from geothermal wells.
Icelandic hydropower plants do not use pumped storage systems. The extra electricity
demand in the electricity grid is controlled and balanced by the hydropower plants. Some
of the hydropower plants produce only constant electricity for aluminum smelters since the
demand is always nearly the same. Total electricity usage in Iceland 2008 was 16,468
GWh or 2,130 MW mean power (Orkuspárnefnd, 2009).
The worldwide increasing demand for electricity at peak time has resulted in a greater need
for pumped storage systems. These pumped storage systems use low cost electricity to
pump water to an upper reservoir when electricity demand is low. During peak hours,
when the demand for electricity is high, the water is released to a lower reservoir through a
turbine, to produce electricity.
By considering the cycle of efficiency, about 4 kWh are needed to generate 3 kWh
(Ibrahim et al., 2008). These plants can be designed to use either combined pump-turbines
or distinct generating and pumping equipment (Davison et al., 2009).
2
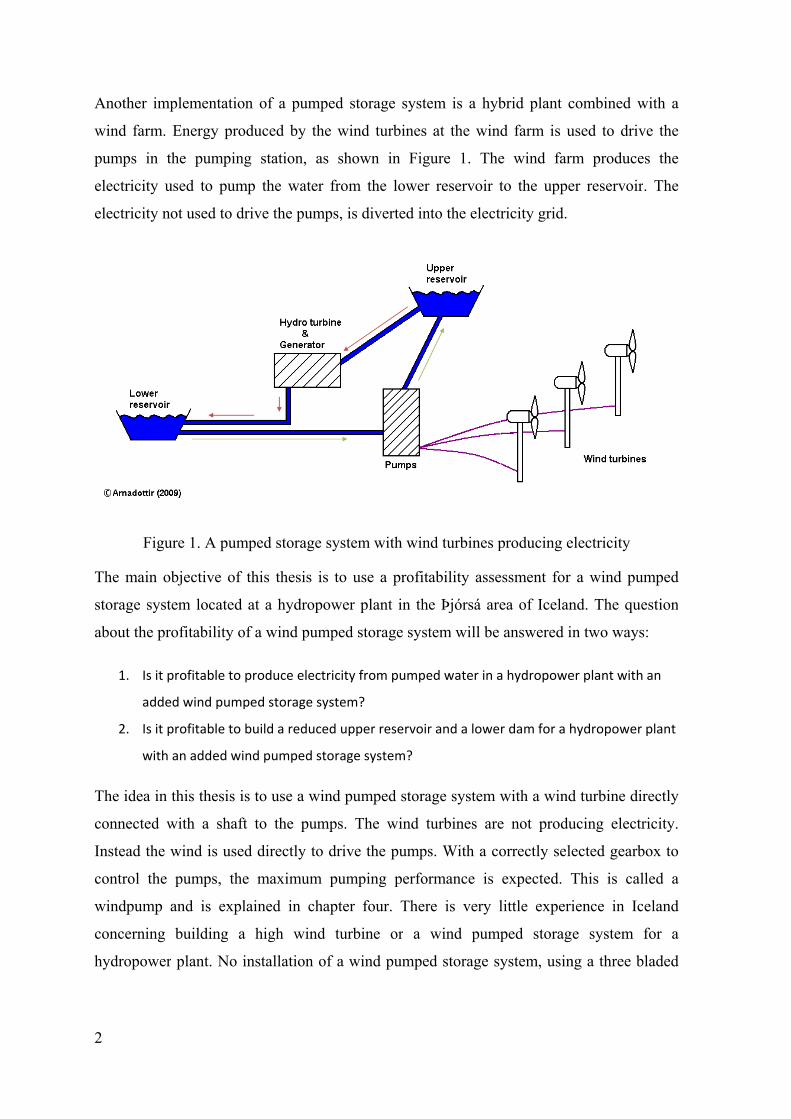
Another
wind fa
pumps
electrici
electrici
The ma
storage
about th
1.
a
2.
w
The ide
connect
Instead
control
windpum
concern
hydropo
r implemen
arm. Energy
in the pum
ity used to
ity not used
Figure 1. A
ain objectiv
system loc
he profitabil
Is it profitab
added wind
Is it profitab
with an adde
a in this the
ted with a
the wind is
the pumps
mp and is
ning buildin
ower plant.
ntation of a
y produced
mping stati
pump the
d to drive th
A pumped st
e of this th
cated at a hy
lity of a win
le to produc
pumped sto
le to build a
ed wind pum
esis is to us
shaft to th
s used direc
s, the maxi
explained
ng a high
No installa
pumped st
by the win
ion, as sho
water from
e pumps, is
torage syste
hesis is to u
ydropower
nd pumped
e electricity
orage system
reduced upp
mped storage
e a wind pu
he pumps. T
ctly to drive
imum pum
in chapter
wind turb
ation of a w
torage syste
nd turbines
own in Fig
m the lower
diverted in
m with win
use a profit
plant in the
storage syst
from pumpe
?
per reservoir
e system?
umped stora
The wind t
e the pumps
mping perfor
four. Ther
bine or a
wind pumpe
em is a hyb
at the wind
gure 1. The
r reservoir t
nto the electr
nd turbines p
ability asse
e Þjórsá are
tem will be
ed water in a
r and a lowe
age system w
turbines are
s. With a co
rmance is
re is very l
wind pump
d storage sy
brid plant c
d farm is u
e wind farm
to the uppe
ricity grid.
producing e
essment for
ea of Icelan
answered i
a hydropowe
r dam for a h
with a wind
e not produ
orrectly sele
expected. T
little experi
ped storag
ystem, usin
combined w
used to driv
m produce
er reservoir
electricity
a wind pu
nd. The que
n two ways
er plant with
hydropower
d turbine dir
ucing electr
ected gearb
This is cal
ience in Ic
e system
ng a three b
with a
ve the
es the
. The
mped
estion
s:
an
plant
rectly
ricity.
box to
lled a
eland
for a
bladed
3
horizontal wind turbine with a direct shaft connection to the pumps, for a hydro power
plant, is known.
The main goal of this thesis is to explain the result from a profitability assessment used to
calculate the profit for a hydropower plant with a wind pumped storage system. A
profitability assessment calculation is used to estimate the profit for a hydropower plant,
using a smaller upper reservoir than it is built for, to generate the same amount of
electricity. A pumped storage system is widely used to create backup power to use at peak
times in the electricity grid. The idea in this thesis is to minimize the land used for a
reservoir and a dam with a pumped storage system and to calculate its profitability.
By gathering information available about the construction cost of a reservoir and a dam,
and the cost of all the items needed for a wind pumped system, installation cost,
maintenance cost, operational cost and other expected costs, an estimate will be found on
profitability. Other costs not officially available will be estimated with a three point
method. The land used for reservoir is not priced.
To explain further this technique, examples will be used. The main profitability assessment
example in this thesis uses eight units. In each unit there are two wind turbines, gearboxes
and pumps with shafts and pipes. The area used in this example is at the Sigalda power
plant in the Þjórsá area, in the south of Iceland. Information from the Windatlas database
of the National Energy Authority (Windatlas, 2009) is used to calculate the average wind
speed at a 50 m and a 100 m height and in further calculations, to estimate the power from
the wind turbines.
Authors like Bueno et al (2006) have pointed out that a system combination of a
hydropower plant, a pumped storage system and a wind turbine producing electricity is
based on a policy promoting clean and renewable energy from renewable energy sources at
a competitive cost if costs arising from damage to health and the environment are taken
into account.
In the paper from Anagnostopoulos et al (2007) it is stated that a pumping station equipped
with a variable-speed pump is the most advantageous configuration and improved pumping
efficiency also results in economical benefits, enhancing the overall financial prospects of
4
the investment. This means that it is absolutely necessary for the pump to have a gearbox
connected to the shaft in direct connection between the wind turbine and the pump.
According to Kazempour et al (2009), when comparing the economic merits of traditional
electric energy storage technologies by their internal rate of returns, it has been shown that
pumped storage plants possess a more economic merit.
A wind pumped storage system for a hydropower plant has more advantages than added
electricity capacity of the power plant. It is also added security for the water level in the
upper reservoir. It can be said that with a hybrid system of a wind pumped storage system
and a hydropower plant, “not all eggs are put in one basket”. Combined pump and turbine
as used in the Limberg II pumped storage hydropower plant in Austria, can cause severely
declined pumped productivity and electricity production, in case of a one pump-turbine
failure.
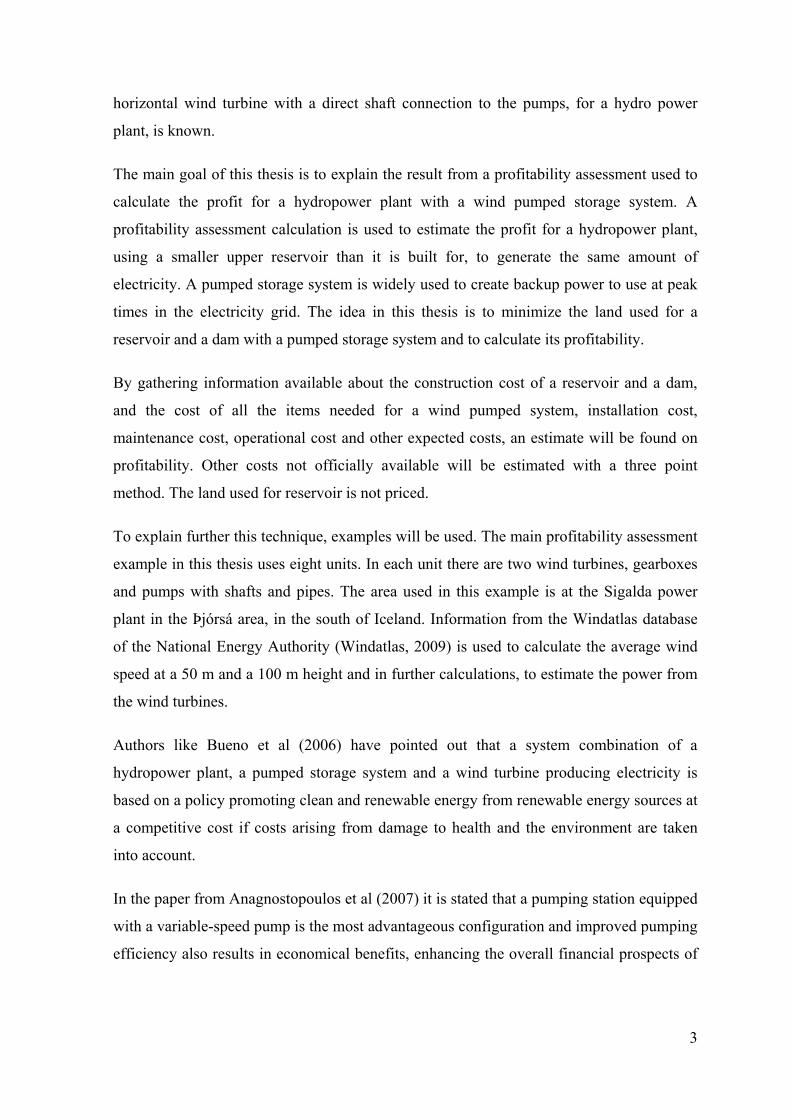
The SWOT analysis for a wind pumped storage system in Iceland is shown in Figure 2 and
Appendix H.
Figure 2. The SWOT analysis for a wind pumped storage system in Iceland
5
The SWOT analysis indicates that Iceland is a very good location for a wind turbine
installation even though strong and irregular winds occur frequently. Wind turbines at a
height of 50 m to 100 m are seen as environmentally friendly and are renewable, but have
not been implemented in Iceland yet. Threats to this project are a new energy tax policy in
Iceland and an unstable political atmosphere because the two leading parties have very
different views to environmental issues and industrialization.
In a location with enough average wind speed and a suitable area for wind turbines, wind
pumped storage system is a good combination with a hydropower plant. If it seems
profitable to use wind turbines to produce power for pumps to pump water to a upper
reservoir, and to make it reusable for hydro power plants, the next step would be to design
such a system and implement it. The future will show us if a windpump system described
in this thesis will be built in Iceland and what problems its designers will face.
This thesis consists of 10 chapters. Chapter 2 is an introduction to a traditional pumped
storage system and how it is used today. In chapter 3, a wind turbine will be added to the
discussion of a pumped storage system, where the electricity from the wind turbine is used
for the pump. Chapter 4 explains a windpump, a pump driven directly with a shaft from a
wind turbine, where the wind is the source of the energy. In chapter 5, the pump used will
be explained and the power usage at the shaft. In chapter 6, the Windatlas located at the
National Energy Authority is explained and the average wind in the Þjórsá is calculated.
Weibull calculations for the stop time of the wind turbine will also be shown. Chapter 7
will explain technical calculations behind the obtained power from a wind turbine, and
pipe diameter calculations are done. In chapter 8, the profitability assessment is explained
and the outcome shown with graphs and photos. Chapter 9 includes more discussing of the
profitability assessment related to electricity price and various usage of this technology.
Chapter 10 completes the thesis, by discussing the main reason for the conclusion and what
is the next step.

7
2 Pumped storage systems According to International Water Power and Dam construction, the oldest pumped storage
hydropower plant is in Schaffhausen, Switzerland (Douglas, 1990). It was started in 1909
and is still in operation. Another old pumped storage power plant that was commissioned
in 1920 is at Walkerburn, in Scotland. A pumped storage system is a child of the twentieth
century. Today there is still continuing interest in building and the usage of pumped
storage systems to load balance electricity for usage at peak times. This will probably be
more important in the future when countries need to balance and guarantee the stability of
electricity production because of increasing installation of unpredictable or irregular
energy resources such as wind and solar power generation.
The complex system of energy production stations and transmission lines has lead to little
use of energy storage in the network, or roughly 2.6% (Ibrahim et al., 2008). Pumped
storage power stations provide high value electricity power for peak hours to the electricity
grid. Of all the countries in the world, USA uses the most of pumped storage plants but
other countries like Japan and Russia are developing it too. One of the biggest stations is
an 1800 MW power station at Dinorwig, U.K. It can supply about 1320 MW in twelve
seconds (Douglas, 1990). A small pumped storage plant can also be useful and one of the
smallest one is in West Germany, with a capacity of about half a megawatt.
At locations where there are storage lakes, a pumped storage station is an attractive option
because of a rising demand for balancing electricity generation at peak times. Pumped
storage stations use low price electricity when the demand is low in the grid, to pump
water from a lower reservoir to an upper reservoir. A pumped storage station for a
hydropower plant is one type of energy storage used to store electricity. This method of
energy storage is in fact to store electricity as potential energy. At higher demands in the
electricity grid, the water in the upper reservoir is released to the lower reservoir through a
hydro turbine, to produce electricity.
A pumped storage station is needed for a hydropower plant station where water shortage
can occur or generation and consumption of electricity is not absolutely synchronous. In all
8
electricity networks there is a surplus or lack of electricity. A pumped storage power
station can control and guarantee a safe operation in the electricity grid.
To stabilize the electricity grid a distinction is made between primary and secondary
control and minute reserve in a pumped storage power station. This depends on the length
of time of the variation when the reaction speed is the most important quality feature
(WorldPumps, 2008). Primary control has the most priority. It restores momentarily the
power balance and the stabilization of a continuous frequency by providing up to 3000
MW within 30 seconds. If not, then malfunctions follow. A primary control is replaced by
a secondary control mode after 30 seconds in the case of variations lasting longer. A
pumped storage power station is extremely well suited to handle minute reserve due to its
broad power range.
In a classical pumped storage power station design, the turbines and the pumps are separate
units. This has many advantages, like better efficiency of the pumps when operated at full
capacity using low cost surplus power. But at the Limberg II power station in Austria, two
combined machine sets of a pump-turbine system are installed. This solution of a
reversible pump-turbine has proven to be very efficient (WorldPumps, 2008). The Limberg
II hydropower station design lead up to a compact power house and thereby reducing
equipment and cost. This arrangement was the best possible return for the operating utility
result in a compact design, and a lower investment cost. Each of the new two machines in
the cavern is rated at 240MW capacity (G. Hinteregger & Söhne, 2007).
Several advantages can be achieved when a wind park is combined with a pumped storage
system. The majority of wind parks combined with pumped storage systems are both
connected to the electricity grid and generate electricity to pump water from a lower
reservoir to an upper reservoir. The electricity generated by the wind turbines, is used
during low consumption hours to pump water to the upper reservoir. It is released again
when there is the need to produce energy at peak times in the electricity network. At high
demand time, when wind power is not available, the water stored in the upper reservoir is
utilized. At locations where variable tariff is applied, there is the possibility to achieve
significant economical benefits by deciding on an optimal turbine and pumping schedule
(Vieira et al., 2008).
9
3 A wind pumped storage system
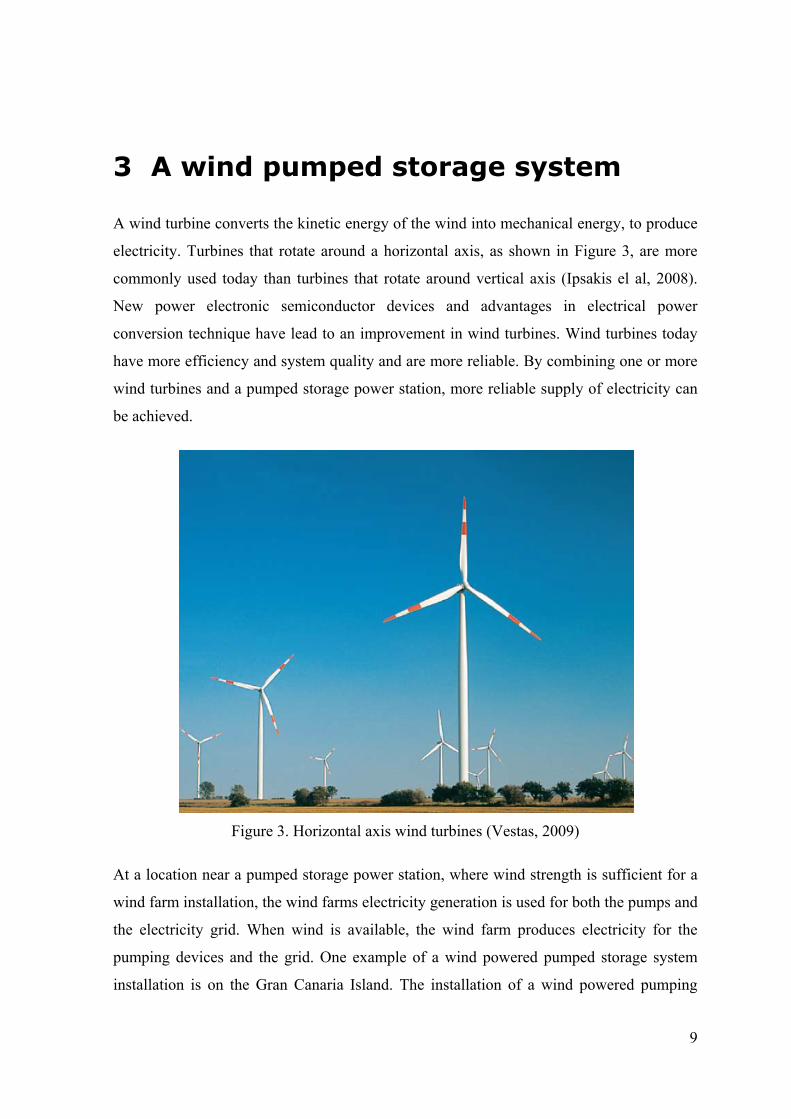
A wind turbine converts the kinetic energy of the wind into mechanical energy, to produce
electricity. Turbines that rotate around a horizontal axis, as shown in Figure 3, are more
commonly used today than turbines that rotate around vertical axis (Ipsakis el al, 2008).
New power electronic semiconductor devices and advantages in electrical power
conversion technique have lead to an improvement in wind turbines. Wind turbines today
have more efficiency and system quality and are more reliable. By combining one or more
wind turbines and a pumped storage power station, more reliable supply of electricity can
be achieved.
Figure 3. Horizontal axis wind turbines (Vestas, 2009)
At a location near a pumped storage power station, where wind strength is sufficient for a
wind farm installation, the wind farms electricity generation is used for both the pumps and
the electricity grid. When wind is available, the wind farm produces electricity for the
pumping devices and the grid. One example of a wind powered pumped storage system
installation is on the Gran Canaria Island. The installation of a wind powered pumping
10
hydro storage system increases the reliability of the electricity produced and the utilization
of the wind energy is connected to the grid. The system promotes clean and renewable
energy (Bueno et al., 2006).
When wind turbines are installed to generate the power for the pumps in a pumped storage
power station, one possibility of a connection is a direct connection with a shaft. It is called
a windpump when a wind turbine is connected with a shaft to one or more pumps. Instead
of converting the energy in the wind to produce electricity, the mechanical power in the
rotational motion of the blades is transferred with a shaft to drive the pump. This technique
is mostly used today to pump water from underground wells in rural areas. Some types of
windpumps produce electricity to pump water. The wind turbines used for this purpose are
multi-bladed. It is not in the scope of this thesis to consider the usages of multi-bladed
windpumps in the area of Iceland.
The commonly used term “windmill” will not be used here because a windmill is literally a
wind driven machine for milling grain or some other substance (Kentfield, 1996).
11
4 A windpump
Wind activated water pumps use wind turbines to convert the winds kinetic energy into a
motion of a shaft which again provides the power input for water pumps (Kentfield, 1996).
In rural areas away from electrical power distribution, wind turbines are used for pumping
water from wells or draining lands. This is called a windpump. The shaft connected to the
rotor of the wind turbine is connected directly with the mechanical shaft to the pump.
Two types of connections between the wind turbine and the water pump are possible. They
can be connected directly as shown in Figure 4, with or without a speed reducing or a
speed increasing gearing system. The other connection can be an electrical transmission.
The advantage of an electrical transmission is the remote location of the wind turbine or
turbines which can be located at the best possible place for the winds access, and the
generated power from the wind turbine or turbines can be directed to the grid when
pumping is not required. Directly connected wind turbines will always have the
disadvantage of a required location near the well and the pumps. The length of the shaft
depends on the location of the pumps and other factors like the landscape. The advantage
of a direct connection is both efficiency and cost related. There is no need for an expensive
gearbox and a generator for the wind turbine, and operational and maintenance cost is
expected to be lower. However there are two gearboxes needed to change the shafts
direction. No energy is wasted in producing electricity to use it again to drive the pumps.
The wind power is used directly from the rotor to the pumps.
Technology developed specifically for pumping water with combined multi-bladed wind
turbines, exists in Jordan (Badran, 2003). Information from field performance reports states
frequent failures of power transmission components. Also the discharge observed is much
less than expected from such systems (Sathyajith et al., 2003). It seems that the windpump
systems that are having problems are using piston pumps instead of centrifugal pumps.
12
A wind
centrifu
The spe
requirem
used to
windpum
diamete
reasona
system
(Sathyaj
of the p
Figure 4
d driven ce
ugal pump w
eed of the
ment of the
match with
mp system
er of the ce
able limit. M
are the sp
ajith et al., 2
ump but the
4. A horizon
entrifugal p
with the pow
rotor of t
e centrifuga
h the speed
(Sathyajith
entrifugal p
Major facto
peed of th
2003). The d
e wind spee
ntal axis win
pump syste
wer transmi
the wind t
al pump, us
d requireme
h et al., 200
ump should
ors influen
e pump, th
designer of
ed and pump
nd turbine c
m consists
ssion mech
turbine is s
sing suitabl
ent of the p
03). Anothe
d be low e
ncing the g
he suction
the system
ping head is
connected d
of the wi
hanism, the
stepped up
le gear mec
pump, will
er importan
enough to r
ear ratio re
head and
has full con
s site charac
directly to a
ind turbine
shaft, as sh
p many tim
chanism. Th
affect the s
nt factor is
restrict the
equired for
the design
ntrol over th
cteristic.
pump
coupled to
own in Figu
mes to mee
his gear sy
simplicity o
that the sp
pumps size
r the windp
n wind vel
he specific s
o the
ure 4.
et the
ystem,
of the
ecific
e to a
pump
locity
speed
13
5 Centrifugal pumps and pipelines
Due to their durability, versatility and simplicity, centrifugal pumps are the most popular
type of pumps (Bolegoh, 2001). Pump efficiency is measured by how much of the power
input to the shaft is converted to useful water pumping by the pump (Lawrence Pumps Inc,
2004). It is therefore not fixed for a centrifugal pump because it is a function of the
discharge and therefore also the operating head and the frequency.
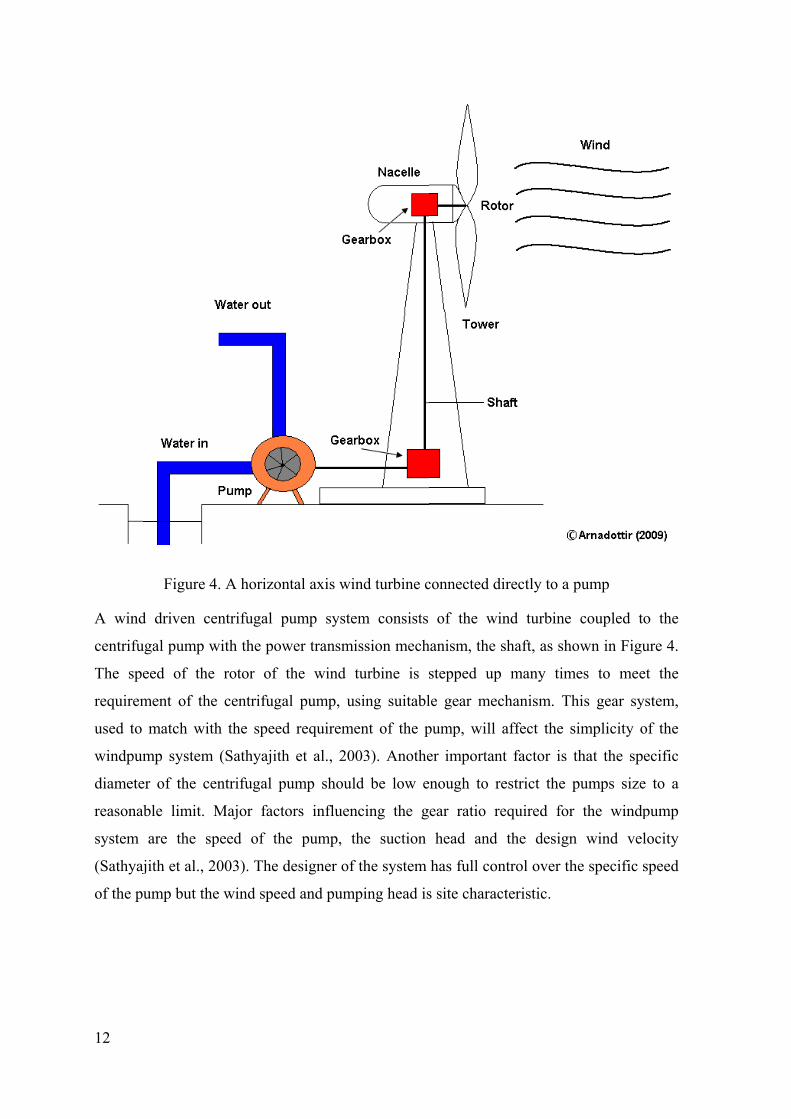
Figure 5. Goulds 316SS Centrifugal Pump 3175 XL (Bid on Equipment, 2009)
The pump will be connected with a shaft to the wind turbine. One of many producers of
pumps is the Goulds pumps Corporation. The Goulds 316SS Centrifugal Pump is shown in
Figure 5. The ideal power used to pump water by a pump in watts, often called hydraulic
power, is as follows:
(1)
14
In equation 1 (Tester et al., 2008), PHYD is the hydraulic power, ρ is the density of the fluid
(water is 1,000 kg/m3), g is the gravitational constant (9.81 m/s2), H is the Head of the
pumped water (m) and Q is the flow rate (m3/s).
For example, the Goulds pump can pump maximum 1.83 m3/s of water up to the height of
40 m. This information is given in the total head and capacity graph and the Goulds
software in Appendix B. This pump was selected as an example, because all necessary
information about the pump was available. The graph shows that a 20x24-28H Goulds
pump, at the height of 40 m, can pump about 29,000 GPM. This is equal to 1.83 m3/s. The
power calculated to operate the pump with a flow rate of 1.83 m3/s and the head equal to
40 m, is now calculated with equation 1:
1000 9.81 40 1.83 718
To pump 1.83 m3/s of water up to a height of 40 m, a minimum power of 718 kW is
needed. Because the pump is not an ideal machine, the pump power is divided by the
pumps efficiency and the shaft power is as follows:
(2)
In equation 2, Pshaft is the power at the shaft where it connects to the pump, Ppump is the
power required to pump water and is the efficiency of the pump.
The manufacturers information, calculated from the Goulds software, shown in Appendix
B, states that the pump power at 885 RPM is 990 kW and the efficiency is 73%. The
efficiency of the pump can also be calculated with the equation 2:
718 990 0.73
The calculated pump efficiency is 0.73 or 73%.
For example, the total hydraulic power required to drive the pump when pumping 1.83
m3/s of water up to a height of 40 m and 0.73, can now be calculated with
equation 2:
15
1000 9.81 40 1.830.73 984 kW
For example, to pump water up to a height of 80 m at Sigalda power plant, two pumps
have to be used and connected serially. The total power at the shaft needed to pump 1.83
m3/s of water up to height of 80 m, with two Goulds 316SS Centrifugal Pump 3175 XL
pumps, is about 2,000 kW.

17
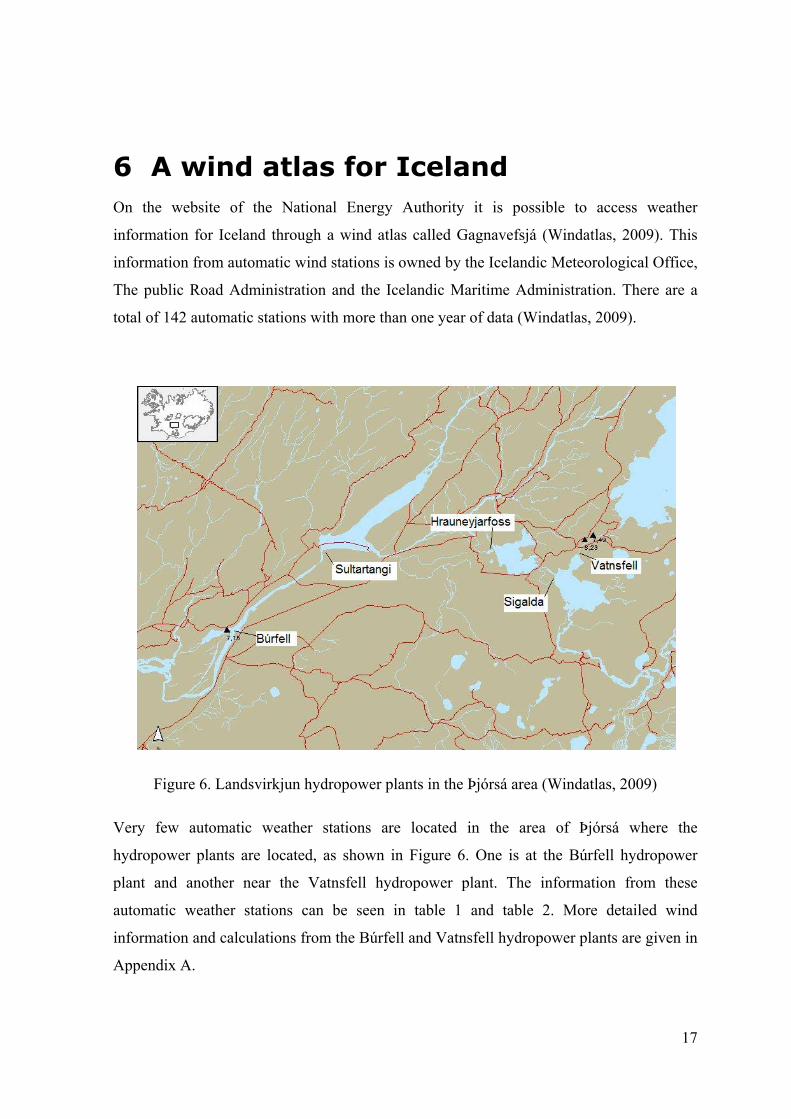
6 A wind atlas for Iceland On the website of the National Energy Authority it is possible to access weather
information for Iceland through a wind atlas called Gagnavefsjá (Windatlas, 2009). This
information from automatic wind stations is owned by the Icelandic Meteorological Office,
The public Road Administration and the Icelandic Maritime Administration. There are a
total of 142 automatic stations with more than one year of data (Windatlas, 2009).
Figure 6. Landsvirkjun hydropower plants in the Þjórsá area (Windatlas, 2009)
Very few automatic weather stations are located in the area of Þjórsá where the
hydropower plants are located, as shown in Figure 6. One is at the Búrfell hydropower
plant and another near the Vatnsfell hydropower plant. The information from these
automatic weather stations can be seen in table 1 and table 2. More detailed wind
information and calculations from the Búrfell and Vatnsfell hydropower plants are given in
Appendix A.
18
From these two automatic wind stations for the area of Þjórsá, the calculated average wind
speed is 11.95 m/s at a 50 m height. This is suitable for a wind turbine installation.
Table 1. Wind information from two locations in the Þjórsá area at a 50m height
Location Measured height (m) Mean wind speed [m/s] (parameter c)
Weibull k (parameter k)
Búrfell 50 11.55 1.96
Vatnsfell 50 12.35 1.84
Mean Value 50 11.95 1.9
Source: Author´s calculations and data based on data from Windatlas (2009)
The two parameter Weibull distribution is used for a statistical study of the winds speed
data and to describe the winds speed frequency curve (Johnson, 2001). For the winds speed
u, the Weibull distribution probability density function is written as:
0, 0, 1 (3)
In equation 3, represent the frequency distribution of the mean speed. The Weibull
parameters c and k are the scale parameter (mean wind speed) and the shape parameter
(Weibull k). As k increases, the peak moves in the direction of a higher wind speed. The
shape parameter k is expected to be in the range of greater or equal to 1.5 and smaller or
equal to 3.0, for most good wind regimes. It can be shown that the scale parameter c is
directly proportional to the mean wind speed for this range of k (Johnson, 2001).
The starting wind speed for Vestas V80 is 4 m/s and the stopping wind speed is 25 m/s. To
estimate how many hours the wind turbine will stop every year, the probability that the
wind speed is greater than or equal to 25 m/s and lower than or equal to 4 m/s is calculated
by using the formula (Johnson, 2001):
1 (4)
19
In equation 4, where F (0) = 0 and F (∞) = 1, it is possible to calculate the Weibull
distribution. For example, to calculate how many hours the Vestas V80 wind turbine will
be stopped in one year at the Þjórsá area at a 50 m height with an average wind speed of
about 11.95 m/s and Weibull parameter k = 1.9:
0 4 011.95 . 411.95 . 0,1175
25 ∞ 2511.95 . ∞11.95 . 0,0172
No wind or too excessive wind in the area of Þjórsá is about 13.5% of the time per year.
The Vestas V80 had to be shut down due to low or excessive wind for about 1,180 hours
per year, or about 49 days every year.
Table 2. Wind information from two locations in the Þjórsá area at a 100m height
Location Measured height (m) Mean wind speed [m/s] (parameter c)
Weibull k (parameter k)
Búrfell 100 12.29 1.96
Vatnsfell 100 13.13 1.85
Mean Value 100 12.71 1.91
Source: Author´s calculations and data based on data from Windatlas (2009)
In Table 2 there is information from the two areas i.e. Búrfell and Vatnsfell, but now for an
average wind speed and a Weibull parameter k at a 100 m height (see Appendix A). The
information about the wind speed and the Weibull parameter k from table 1 and 2 are used
in table 3 and 4 (see chapter 7), where the power production of the Vestas V80 wind
turbine is calculated for a 50 m and a 100 m height (see also Breakdown, Page 3 in
Appendix E).

21
7 Wind Power Today’s wind turbines are based on an aerodynamic lifting. The blades interact with the
wind and use both the drag force and the perpendicular force, namely the lifting forces.
The lifting force is the main driving power of the rotor because it is a multiple of the drag
force. The lifting force of the air flow is intercepted by the rotor blade and causes the
necessary driving torque for the wind turbine (Ackermann, 2005).
Horizontal wind turbines like Vestas V80 consist of a tower, a rotor, blades and a nacelle,
located on top of the tower. The nacelle contains the gearbox and the generator. In big
wind turbines, a wind vane, an anemometer and a controller, control the yaw drive to point
the rotor into or out of the wind. The pitch control controls the blades to capture maximum
power from the wind.
A horizontal axis wind turbine used for electricity production, usually has two or three
blades. A wind turbine with twenty or more blades is normally used for mechanical water
pumping because of a high starting torque.
The power of an air mass captured by the wind turbine can be calculated in watts as
follows:
2 (5)
In equation 5 (Tester et al., 2008), COP is an overall measure of performance under rated
conditions, ρ is the density of the air (air is 1.225 kg/m3), A is the area swept by the blades
(m2) and V is the speed of the wind (m/s).
In 1926, German physicist Albert Betz concluded that no wind turbine can convert more
than the ratio 16/27, or 59.3% of the kinetic energy in the wind. In this thesis, COP is
estimated to be 0.30 or 30% for modern wind turbines (Tester et al., 2008).
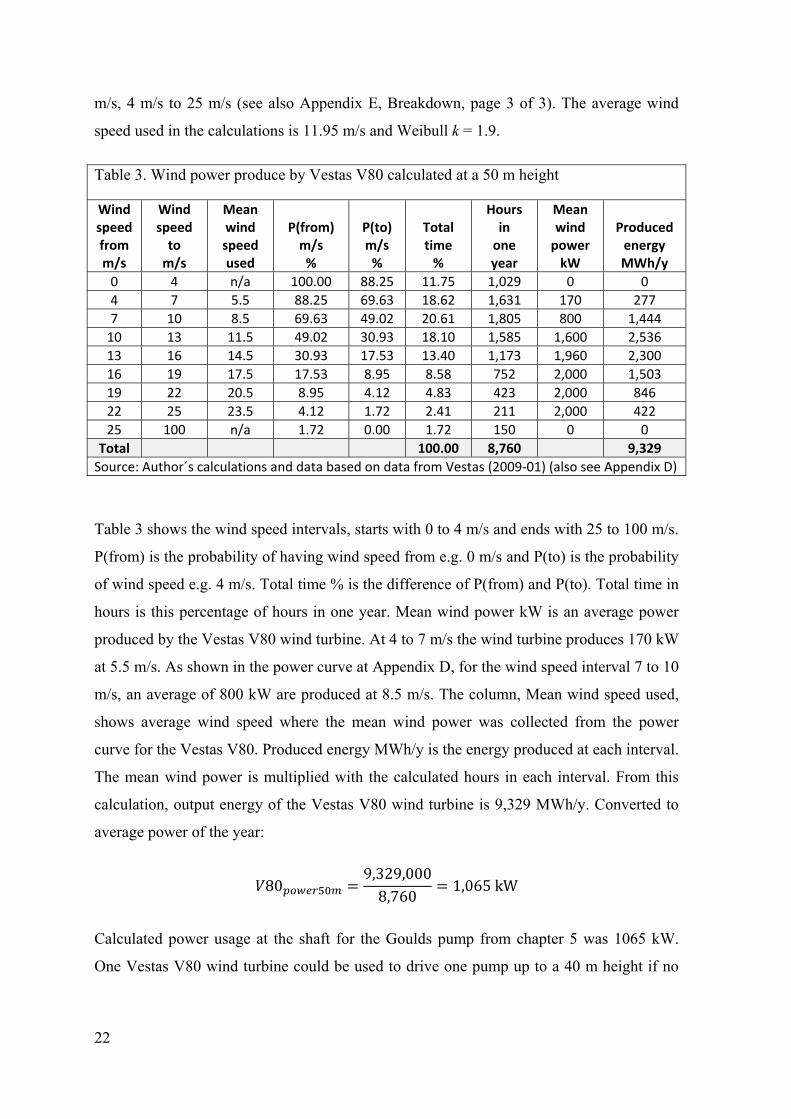
For example, the output power for Vestas V80 was calculated with Weibull formulas for
the wind area at Þjórsá at a 50 m height. Each wind speed interval in table 3, consist of 3
22
m/s, 4 m/s to 25 m/s (see also Appendix E, Breakdown, page 3 of 3). The average wind
speed used in the calculations is 11.95 m/s and Weibull k = 1.9.
Table 3. Wind power produce by Vestas V80 calculated at a 50 m height
Wind speed from m/s
Wind speed
to m/s
Mean wind speed used
P(from)
m/s %
P(to) m/s
%
Total time
%
Hours in
one year
Mean wind
power kW
Produced
energy MWh/y
0 4 n/a 100.00 88.25 11.75 1,029 0 0 4 7 5.5 88.25 69.63 18.62 1,631 170 277 7 10 8.5 69.63 49.02 20.61 1,805 800 1,444
10 13 11.5 49.02 30.93 18.10 1,585 1,600 2,536 13 16 14.5 30.93 17.53 13.40 1,173 1,960 2,300 16 19 17.5 17.53 8.95 8.58 752 2,000 1,503 19 22 20.5 8.95 4.12 4.83 423 2,000 846 22 25 23.5 4.12 1.72 2.41 211 2,000 422 25 100 n/a 1.72 0.00 1.72 150 0 0
Total 100.00 8,760 9,329 Source: Author´s calculations and data based on data from Vestas (2009-01) (also see Appendix D)
Table 3 shows the wind speed intervals, starts with 0 to 4 m/s and ends with 25 to 100 m/s.
P(from) is the probability of having wind speed from e.g. 0 m/s and P(to) is the probability
of wind speed e.g. 4 m/s. Total time % is the difference of P(from) and P(to). Total time in
hours is this percentage of hours in one year. Mean wind power kW is an average power
produced by the Vestas V80 wind turbine. At 4 to 7 m/s the wind turbine produces 170 kW
at 5.5 m/s. As shown in the power curve at Appendix D, for the wind speed interval 7 to 10
m/s, an average of 800 kW are produced at 8.5 m/s. The column, Mean wind speed used,
shows average wind speed where the mean wind power was collected from the power
curve for the Vestas V80. Produced energy MWh/y is the energy produced at each interval.
The mean wind power is multiplied with the calculated hours in each interval. From this
calculation, output energy of the Vestas V80 wind turbine is 9,329 MWh/y. Converted to
average power of the year:
80 9,329,0008,760 1,065 kW
Calculated power usage at the shaft for the Goulds pump from chapter 5 was 1065 kW.
One Vestas V80 wind turbine could be used to drive one pump up to a 40 m height if no
23
power was lost in the gearbox. The power lost by friction of the shafts is not included in
these calculations because the efficiency of the gearbox is estimated.
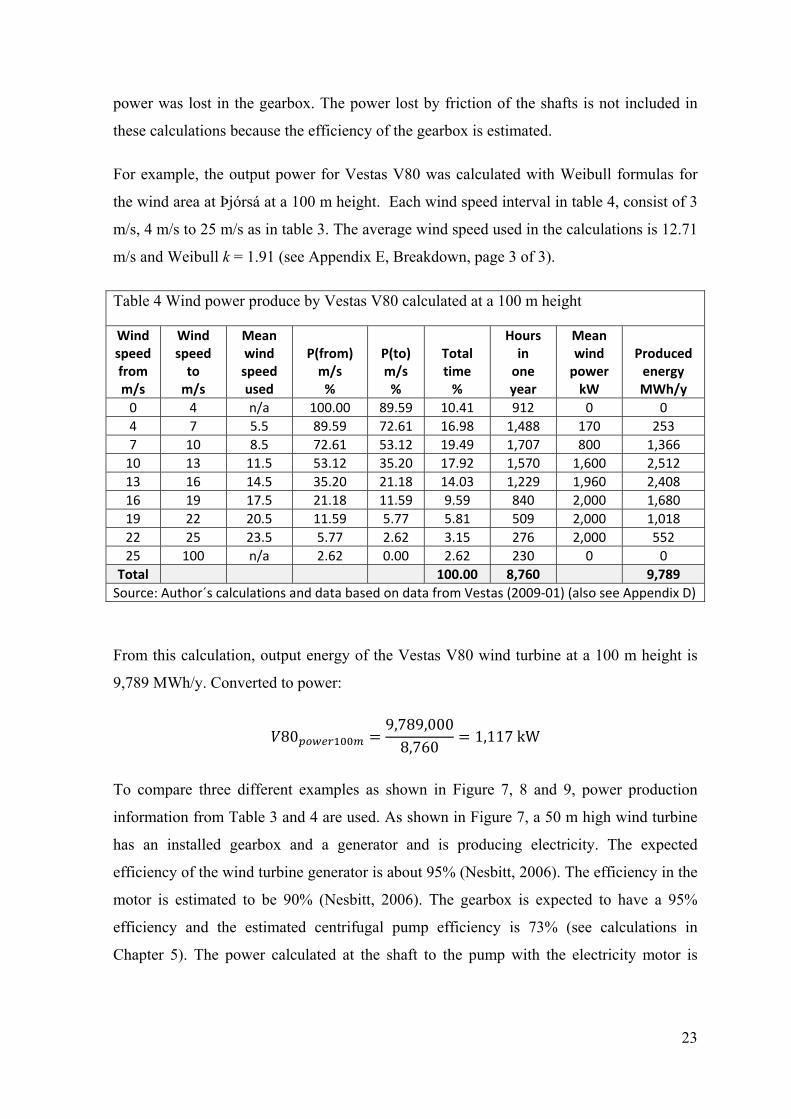
For example, the output power for Vestas V80 was calculated with Weibull formulas for
the wind area at Þjórsá at a 100 m height. Each wind speed interval in table 4, consist of 3
m/s, 4 m/s to 25 m/s as in table 3. The average wind speed used in the calculations is 12.71
m/s and Weibull k = 1.91 (see Appendix E, Breakdown, page 3 of 3).
Table 4 Wind power produce by Vestas V80 calculated at a 100 m height
Wind speed from m/s
Wind speed
to m/s
Mean wind speed used
P(from)
m/s %
P(to) m/s
%
Total time
%
Hours in
one year
Mean wind
power kW
Produced
energy MWh/y
0 4 n/a 100.00 89.59 10.41 912 0 0 4 7 5.5 89.59 72.61 16.98 1,488 170 253 7 10 8.5 72.61 53.12 19.49 1,707 800 1,366
10 13 11.5 53.12 35.20 17.92 1,570 1,600 2,512 13 16 14.5 35.20 21.18 14.03 1,229 1,960 2,408 16 19 17.5 21.18 11.59 9.59 840 2,000 1,680 19 22 20.5 11.59 5.77 5.81 509 2,000 1,018 22 25 23.5 5.77 2.62 3.15 276 2,000 552 25 100 n/a 2.62 0.00 2.62 230 0 0
Total 100.00 8,760 9,789 Source: Author´s calculations and data based on data from Vestas (2009-01) (also see Appendix D)
From this calculation, output energy of the Vestas V80 wind turbine at a 100 m height is
9,789 MWh/y. Converted to power:
80 9,789,0008,760 1,117 kW
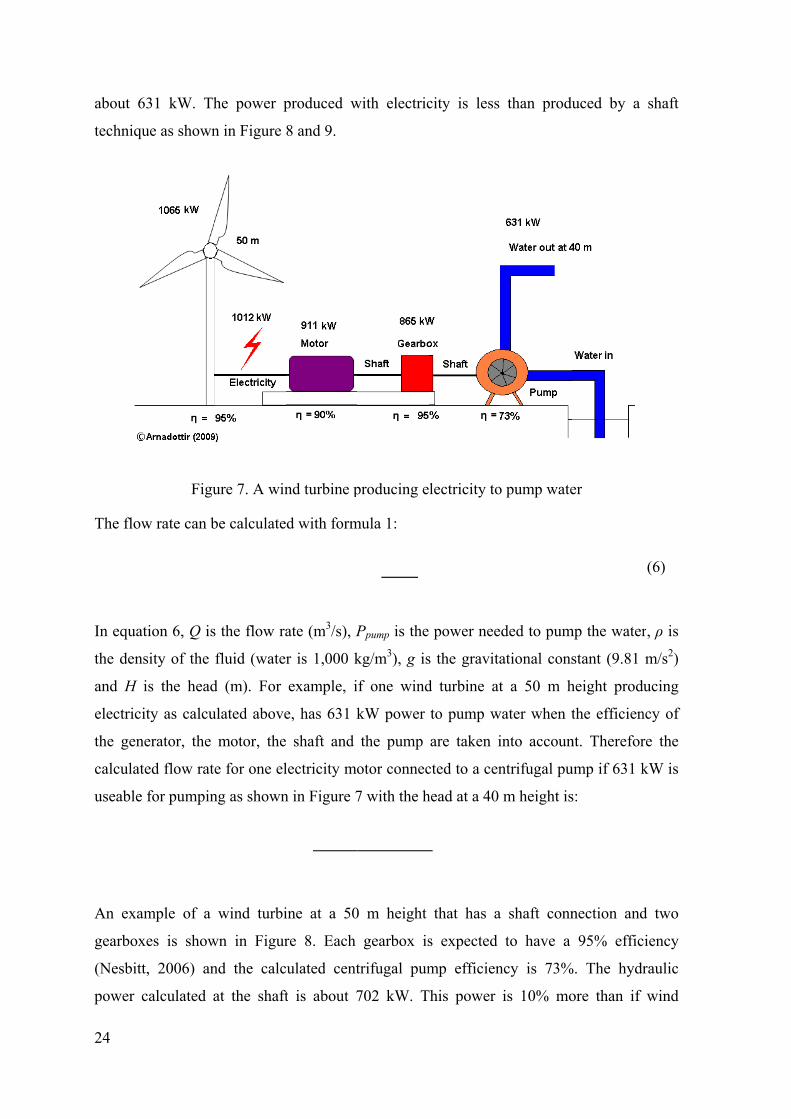
To compare three different examples as shown in Figure 7, 8 and 9, power production
information from Table 3 and 4 are used. As shown in Figure 7, a 50 m high wind turbine
has an installed gearbox and a generator and is producing electricity. The expected
efficiency of the wind turbine generator is about 95% (Nesbitt, 2006). The efficiency in the
motor is estimated to be 90% (Nesbitt, 2006). The gearbox is expected to have a 95%
efficiency and the estimated centrifugal pump efficiency is 73% (see calculations in
Chapter 5). The power calculated at the shaft to the pump with the electricity motor is
24
about 6
techniqu
The flow
In equat
the den
and H
electrici
the gen
calculat
useable
An exa
gearbox
(Nesbitt
power c
631 kW. Th
ue as shown
Figu
w rate can b
tion 6, Q is
sity of the
is the head
ity as calcu
nerator, the
ted flow rat
for pumpin
ample of a
xes is show
t, 2006) an
calculated a
he power p
n in Figure
ure 7. A win
be calculate
s the flow ra
fluid (water
d (m). For
ulated above
motor, the
e for one el
ng as shown
wind turbi
wn in Figur
nd the calc
at the shaft
produced w
8 and 9.
nd turbine p
d with form
ate (m3/s), P
r is 1,000 k
example, i
e, has 631 k
shaft and
lectricity mo
n in Figure 7
ine at a 50
re 8. Each
culated cent
t is about 7
with electric
producing e
mula 1:
Ppump is the
kg/m3), g is
f one wind
kW power
the pump
otor connec
7 with the h
0 m height
gearbox is
trifugal pum
702 kW. T
city is less
lectricity to
power nee
s the gravita
d turbine at
to pump w
are taken i
cted to a cen
head at a 40
that has a
s expected
mp efficien
This power
than produ
o pump wate
ded to pum
ational cons
t a 50 m h
water when t
into accoun
ntrifugal pu
m height is
a shaft conn
to have a
ncy is 73%
is 10% mo
uced by a
er
mp the water
stant (9.81
height produ
the efficien
nt. Therefor
ump if 631 k
s:
nection and
95% effic
%. The hydr
ore than if
shaft
(6)
r, ρ is
m/s2)
ucing
ncy of
re the
kW is
d two
ciency
raulic
wind
turbi
centr
An e
in Fi
estim
736 k
shaft
produ
The
wate
ine produci
rifugal pum
F
example of
igure 9. Ea
mated centri
kW. This p
t technique
ucing electr
calculated
r, to a 40 m
ing electric
mp up to a 40
Figure 8. On
a 100 m wi
ch gearbox
ifugal pump
power is abo
to pump w
ricity for pu
flow rate f
m height, is:
ity is used
0 m height,
ne 50 m hig
ind turbine
x is expecte
p efficiency
out 4,6% m
water and ab
umping.
for one sha
d. To calcu
if 702 kW i
gh wind turb
that has a s
d to have a
y is 73%. T
more than fo
bout 14% m
aft driven p
ulate the flo
is the power
bine using a
shaft conne
a 95% effic
The power c
or a wind tu
more than a
pump if 736
ow rate fo
r useable at
a shaft techn
ection to the
ciency (Nes
calculated a
urbine at a 5
wind turbin
6 kW is us
or one shaf
t the shaft, i
nique
e gearbox, i
sbitt, 2006)
at the shaft
50 m height
ne at a 50 m
seable for p
25
ft driven
s:
is shown
and the
is about
t using a
m height
pumping
26
One 10
maximu
height a
This com
steel pip
F
Figu
0 high Ves
um flow rat
at the Sigald
mbination o
pes, is calle
Figure 10. T
ure 9. One 1
stas V80 w
te up to a he
da power pl
of two wind
d one unit.
Two 100 m
00 m high w
wind turbine
eight of 40
lant, two pu
d turbines, f
high wind t
wind turbin
e can produ
m. For exa
umps are con
four gearbo
turbines pum
ne using a sh
uce enough
ample, to pu
nnected ser
oxes, two ce
mping wate
haft techniqu
power to p
ump the wa
ially as sho
entrifugal pu
r up to a 80
ue
pump water
ater up to a
own in Figur
umps, shaft
0 m height
r at a
80 m
re 10.
ts and
27
When designing a fluid distribution system, three distinct steps are required. The first step
is to establish the design and objectives, the second is the sizing of pipes and ducts, and the
third is the calculation or determination of the pressure drop in the system (Coad, 1985).
To estimate the price for pipes in the installation, calculation of the diameter is necessary.
To calculate the diameter of the pipe, the Reynolds number Re, the friction factor f and the
pressure drop Hf are calculated with equations 7, 8 and 9 and then simplified in equation
10. 4 (7)
In equation 7 (Crowe et al., 2008), Re is the Reynolds number, ρ is the density of the fluid
(water is 1,000 kg/m3), Q is the volume of the flow rate (m3/s), π is equal to 3.1415, µ is
the dynamic viscosity of the fluid (1.5x10⁻³ kg/s m) and D is the diameter of the pipe (m).
To calculate the friction factor (f) which depends on the Reynolds number Re of the pipe
flow, the equation 8 is:
0.316 (8)
In equation 8 (Crowe et al., 2008), f is the friction factor, Re is the Reynolds number from
equation 7. The fluids flow is laminar if the Reynolds number is lower than 2000 in pipes,
but if it is higher than 3000, it is turbulent (efunda, 2009).
To calculate a pressure drop, the equation 9 uses the friction factor f and is: 8
(9)
In equation 9 (Crowe et al., 2008), Hf is the pressure drop, f is the friction factor (equation
8), L is the length of the pipe (m), Q is the volume of the flow rate (m3/s), π is equal to
3.1415, g is the gravitational constant (9.81 m/s2) and D is the diameter of the pipe (m). By
simplifying equation 9, using Q= 1.83 m3/s and L = 80 m, the diameter of the pipe can now
be calculated with equation 10:
28
0.196 14.75
(10)
In equation 10, D is the diameter of the pipe in meters and Hf is the pressure drop. The
pressure drop in equation 10, can now be calculated with equation 11.
(11)
In equation 11 (White, 2002), Hf is the pressure drop in a pipe, is the efficiency (73%), P
is the input horse power at the shaft (961 kW/0.746=1,288 HP) and Q is the volume of the
flow rate (1.83 m3/s = 1,830 l/s). The pressure drop in a pipe can now be calculated with
equation 11: 0.73 12881830 0.5
The pressure drop is about 0.5. The diameter of the pipe can now be calculated by:
0.1960.5 . 0.82
The calculated diameter of the pipe is 0.82 m. The price for one meter of a 820mm steel
pipe is 1,574 US dollars (Geirsson, 2009). If a plastic pipe is used instead, 1.0 m in
diameter, made for 60 N/cm2 pressure, the price is 490 US dollars per meter (Halldórsson,
2009). In the calculations, steel pipes that are about 0.82 m in diameter are used because of
higher pressure capacity. The velocity of the water in the pipe can be calculated with
equation 11: 4 (11)
In equation 11 (LMNO Engineering, 2008), v is the velocity of the water in the pipe (m/s),
Q is the volume of the flow rate (m3/s), π is equal to 3.1415 and D is the diameter of the
pipe (m). With a flow rate of about 1.83 m3/s and a pipe diameter of about 0.82 m, the
velocity of the water is about 3.5 m/s.
29
8 Economic feasibility of a windpump
In the beginning, this thesis was meant to answer the question: “Is it profitable to build a
wind pumped storage system for a hydropower plant in Iceland?” By looking at two
possible usages of a wind pumped storage system, an excel model for profitability
assessment calculations was used. The first usage of the windpump concerned the
production of electricity from the pumped water. The pumped water is used to produce
more electricity from an existing hydropower plant after modification. The second usage of
the windpump looked at the possibility of constructing a smaller reservoir and a dam by
using a wind pumped storage at the hydropower plant. The Excel model calculates whether
or not these are profitable operations. The structure of the Excel model is shown in
Appendix G.
The setup in the profitability assessment uses eight windpump units. One windpump unit
installed includes two V80 wind turbine from Vestas, four gearboxes, two pumps, shafts
and steel pipes. The building needed is a house for the pumps. Other expensive items are
the upper reservoir changes because of the pipes and foundation for the pipes and the
shafts. Other investment costs are installation, designing, constitutional and insurance cost.
In the estimation for the electricity price, when extra water is used to produce the
electricity, modification of environment and the turbine is included within the modification
part in the breakdown sheet.
The Excel model with values is shown in Appendix E. In the breakdown sheet, a three
point estimated method (Goodpasture, 2004) is used to calculate expected costs for the
buildings, the equipments and other investments. The confidence level is 95%. In the three
point method three points are used, most pessimistic costs and optimistic costs that have
some small profitability of happening and most likely costs that has the most likely value
in the mode of the distribution. This three point method uses BETA distribution and
calculates variance and standard deviation (see Appendix E).
For the equipment part, the wind turbine, the shaft and the gearbox costs are estimated.
Installation cost is included in the wind turbine cost. The price for one kg steel type St. 52
30
was known. The weight of one meter of shaft was estimated at 50 kg. The estimated price
of a wind turbine with installation cost for the year 2009, per kW is about 2,120 US
dollars. It is about a 10% higher project cost than the price in 2008 (U.S. Department of
ENERGY, 2008). The estimated calculated price of one Vestas V80 wind turbine is about
4.2 m US dollars. Because a wind turbine gearbox and a generator are not needed for the
wind turbine, the wind turbine and the installation cost was reduced by 40%, to 2.5 m US
dollars (see Appendix C). This is an academic cost reduced estimate by the author, because
the wind turbine producer Vestas refused to give any detailed information about prices for
Vestas models. Three prices for wind turbine were estimated, the optimistic, the most
likely and the pessimistic. Price information for wind turbines from other producers, the
same size as Vestas V80, was not possible to find on the internet. A wind turbine model
V80 from Vestas was used as example in the thesis.
The building cost is mostly based on changes in the reservoir, building a shelter for the
pumps and housing for the shaft from the wind turbine to the pump. Other investment cost
like design cost and all other installation costs without the installation of the wind turbine,
are included in the other investment part. All these estimated costs are used when the
model calculates the reduced reservoir possibility. The modification part in the three point
method is just added into the calculations when the model calculates the price of produced
electricity from pumped water and the profit for the next 40 years. An expected lifetime of
a hydro power plant is from 40 to 70 years (and even 100 years!). An expected lifetime of
a wind power plant is about 20 years (Madlener et al., 2005). A wind turbine with no
gearbox and no generator is expected to last longer due to lower complexity regarding
electricity components and cables. Therefore it is expected that a wind turbine, with shaft
technology, will last 40 years with proper maintenance. Maintenance cost is expected to be
2% annually for the wind pumped storage system.
The wind turbine is the most expensive part in the equipment part of the investment.
Today’s average estimated price for one MW of an installed wind turbine can vary from
one million US dollars to two million US dollars. The expected cost for one Vestas V80
wind turbine is estimated in the equipment part to be 2.5 m US dollars without a gearbox
and a generator. The calculated equipment cost in the Breakdown part of the profitability
assessment shows that the estimated expected price of a wind turbine with installation cost
is about 93% of the expected equipment cost. The gearbox, the shaft, the pumps and the
31
pipes, without installation cost, are just 7% of the expected equipment cost. The
installation cost for this equipment is categorized with other investment and is expected to
be most expensive for the installation of one unit. For one unit installed, the expected
estimated installation cost of the gearboxes, the shafts, the pumps and the pipes is about
34% of these equipment cost. For eight units installed, the cost is estimated about 12%, and
for 20 units installed, the cost is estimated at nearly 8%.
The breakdown sheet also calculates the cost of reducing a reservoir if a wind pumped
storage system is installed. This is only valid in the beginning of the process state, when a
new reservoir is designed. Average capital cost of a reservoir was calculated from the cost
of building four reservoirs in Iceland (Landsvirkjun, 2006). The capital cost for the four
dams in September 2009 was 206,000 US dollars and the total reservoir size is 682 Gl (see
Appendix C). The calculated average price for an average reservoir of a size 171 Gl with a
dam, is 51,554 US dollars. Based on this information, an estimated average price of Gl in
the reservoir and the amount of pumped water into the upper reservoir was used to estimate
in percentages, how much the reservoir could be reduced (see Appendix E). From the
estimated average price of a reservoir and a dam, the value for a reduced cost in a new
project was estimated. The calculation showed that the cost of an additional pumped
storage system is always higher than the reduced cost of constructing a new smaller sized
reservoir and a lower dam.
The profitability assessment calculations for the electricity production of the extra pumped
water are based on the profitability assessment model (see Appendix E). The planned
horizon is 40 years and the loan repayment is made in 20 years. The estimated loan interest
rate is 6%, which is similar to the interest rates that a large domestic energy firm like
Landsvirkjun faces. In Figure 14, the effect of 3, 6 and 9% interest rate and the sales price
on the NPV is compared. Equity is 30% and expected sales price in Iceland for one MWh
is 29 US dollars (mills) as shown with calculation in Appendix C. The discount Rate
(MARR) is 10%. The modification part in the Breakdown sheet calculates the modification
necessary to produce electricity from the extra water added to the reservoir. Modification
like scaling up the hydro turbine and the generator is needed. The main parts are the hydro
turbine, the electricity connection and the house modification. From the wind calculation in
chapter 6, no power production from the wind turbines is expected to be nearly 13.5% of
the year. The model calculates expected sales quantity measured in MWh/y (mills). It is
32
not profitable in Iceland to add a wind pumped storages system to an existing hydropower
plant and to produce electricity from the extra water, based on the information in the
profitability assessment.
For example, a given project of a pumped storage system with eight units, starting with a
forty years lifespan, is considered to be installed at Sigalda hydropower plant in the Þjórsá
area (see also Appendix E). One unit includes two wind turbines like Vestas V80, two
pumps similar to Goulds 316SS, four gearboxes, 330 m of shafts and 160 m of 0.7 m wide
steel pipes. Other investment costs are buildings, installation, design, constitutional and
insurance cost, modification cost on a house and a hydro turbine. The total flow rate from
the sixteen pumps will be about 15 m3/s. The calculated average wind speed at a 100 m
height is 12.71 m/s. The electricity production from this extra water is estimated to be
74,027 MWh/y and the sales price is 29 US dollars for MWh. The size of the added hydro
turbine is about 8 MW and the head is 80 m high.
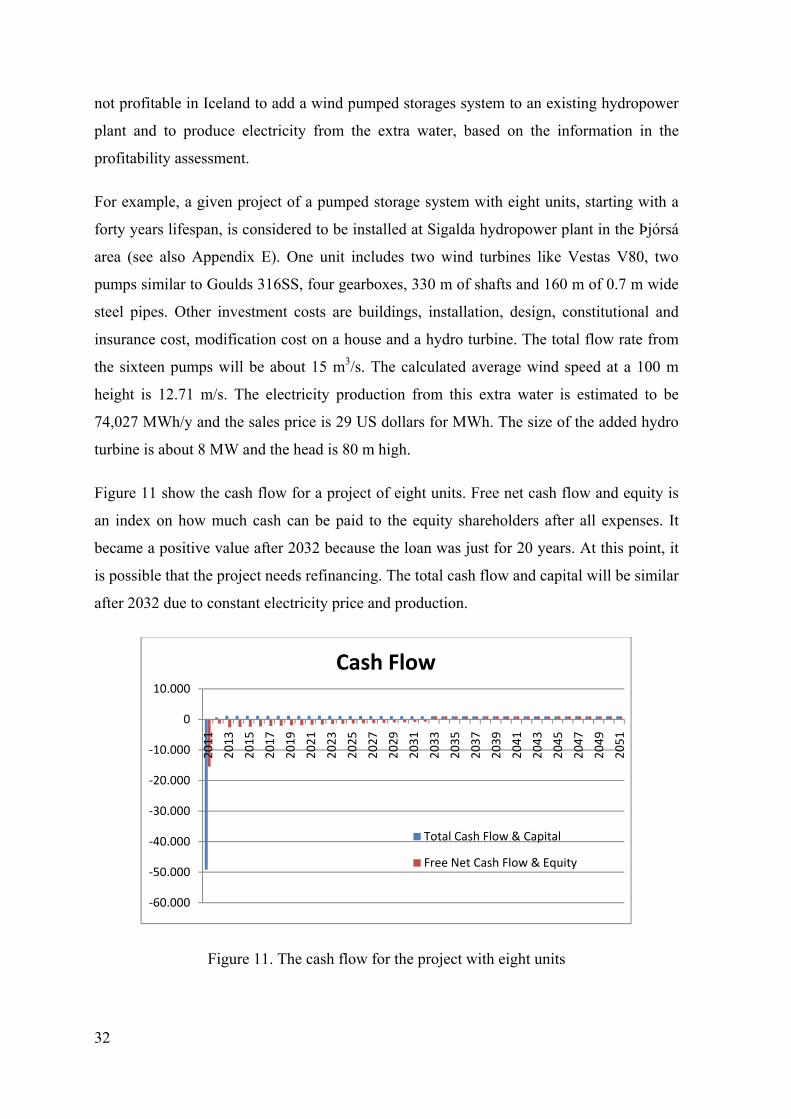
Figure 11 show the cash flow for a project of eight units. Free net cash flow and equity is
an index on how much cash can be paid to the equity shareholders after all expenses. It
became a positive value after 2032 because the loan was just for 20 years. At this point, it
is possible that the project needs refinancing. The total cash flow and capital will be similar
after 2032 due to constant electricity price and production.
Figure 11. The cash flow for the project with eight units
-60.000
-50.000
-40.000
-30.000
-20.000
-10.000
0
10.000
2011
2013
2015
2017
2019
2021
2023
2025
2027
2029
2031
2033
2035
2037
2039
2041
2043
2045
2047
2049
2051
Cash Flow
Total Cash Flow & Capital
Free Net Cash Flow & Equity
33
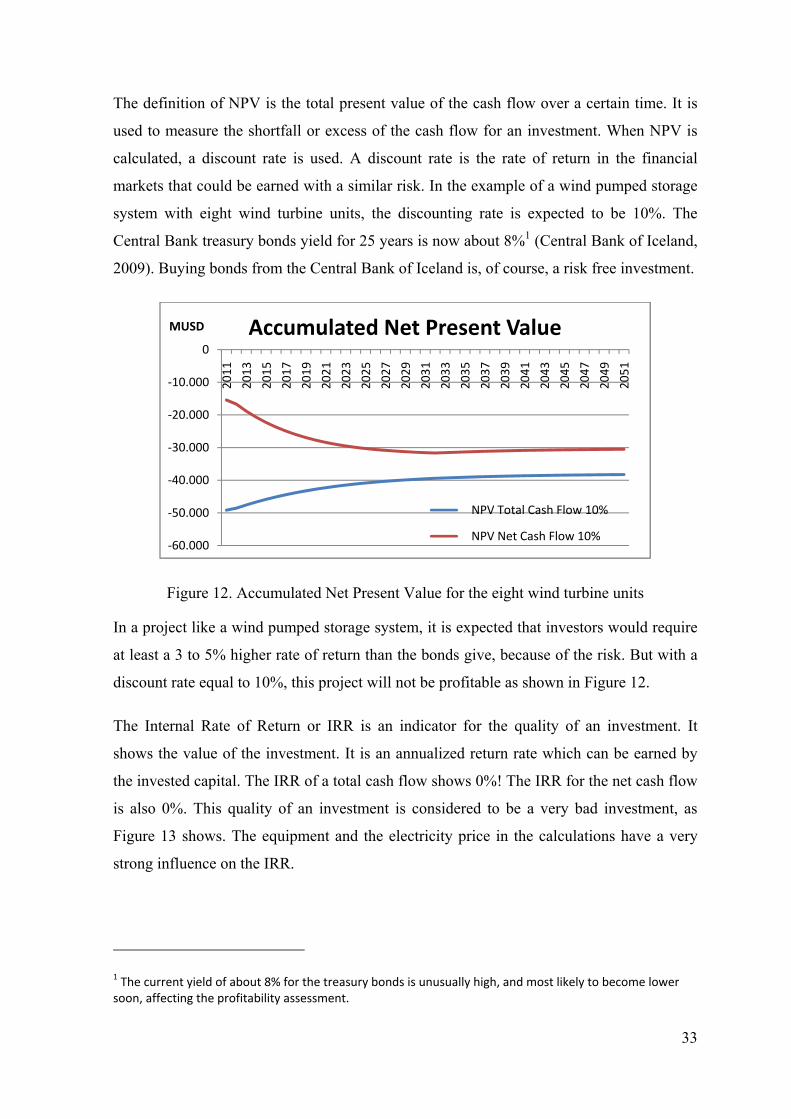
The definition of NPV is the total present value of the cash flow over a certain time. It is
used to measure the shortfall or excess of the cash flow for an investment. When NPV is
calculated, a discount rate is used. A discount rate is the rate of return in the financial
markets that could be earned with a similar risk. In the example of a wind pumped storage
system with eight wind turbine units, the discounting rate is expected to be 10%. The
Central Bank treasury bonds yield for 25 years is now about 8%1 (Central Bank of Iceland,
2009). Buying bonds from the Central Bank of Iceland is, of course, a risk free investment.
Figure 12. Accumulated Net Present Value for the eight wind turbine units
In a project like a wind pumped storage system, it is expected that investors would require
at least a 3 to 5% higher rate of return than the bonds give, because of the risk. But with a
discount rate equal to 10%, this project will not be profitable as shown in Figure 12.
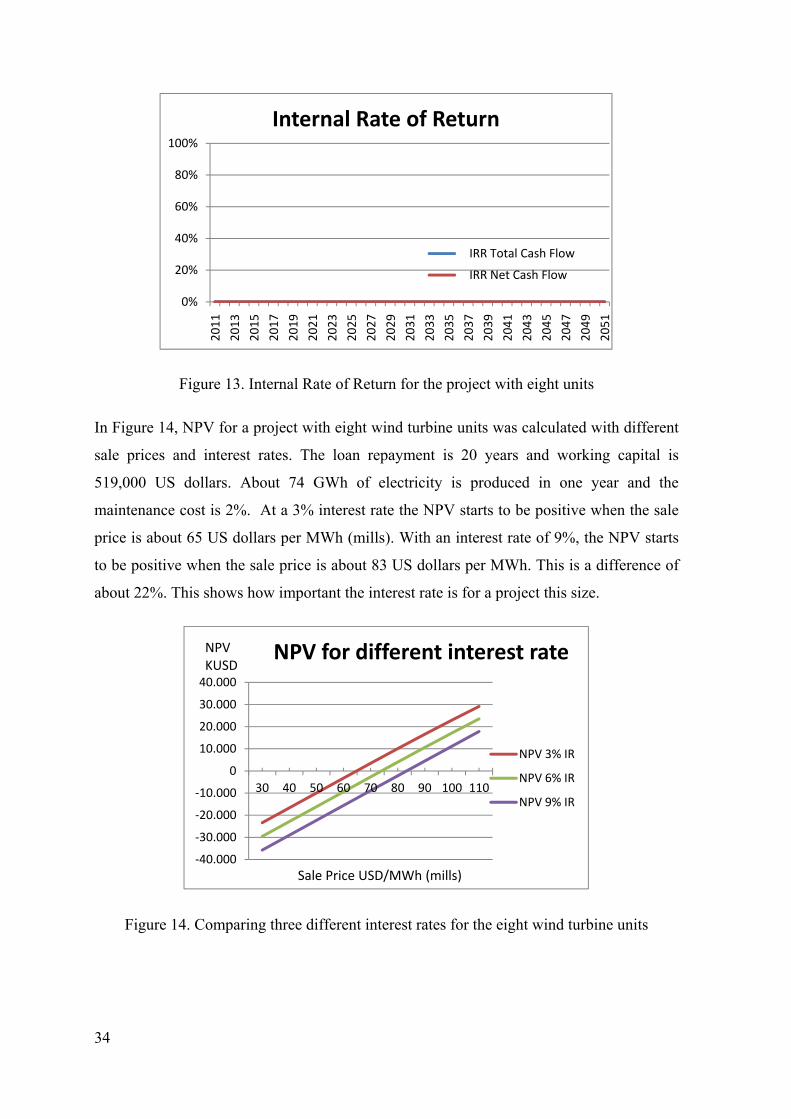
The Internal Rate of Return or IRR is an indicator for the quality of an investment. It
shows the value of the investment. It is an annualized return rate which can be earned by
the invested capital. The IRR of a total cash flow shows 0%! The IRR for the net cash flow
is also 0%. This quality of an investment is considered to be a very bad investment, as
Figure 13 shows. The equipment and the electricity price in the calculations have a very
strong influence on the IRR.
1 The current yield of about 8% for the treasury bonds is unusually high, and most likely to become lower soon, affecting the profitability assessment.
-60.000
-50.000
-40.000
-30.000
-20.000
-10.000
0
2011
2013
2015
2017
2019
2021
2023
2025
2027
2029
2031
2033
2035
2037
2039
2041
2043
2045
2047
2049
2051
MUSD Accumulated Net Present Value
NPV Total Cash Flow 10%
NPV Net Cash Flow 10%
34
Figure 13. Internal Rate of Return for the project with eight units
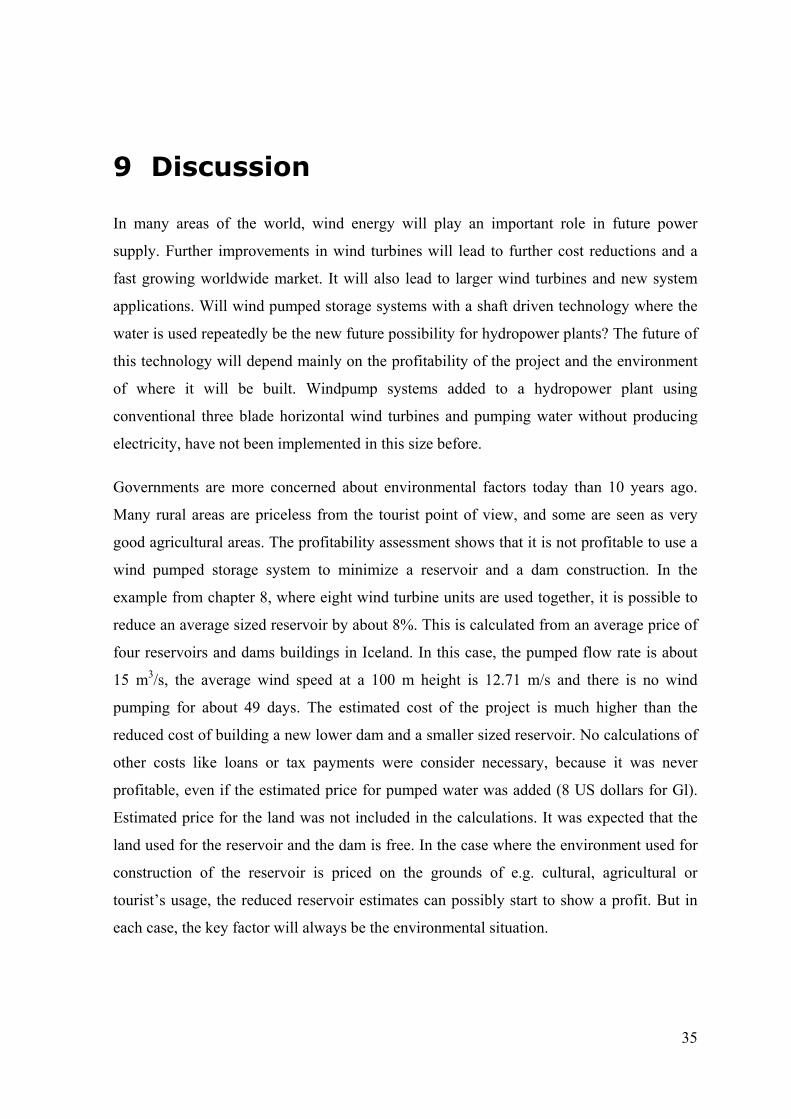
In Figure 14, NPV for a project with eight wind turbine units was calculated with different
sale prices and interest rates. The loan repayment is 20 years and working capital is
519,000 US dollars. About 74 GWh of electricity is produced in one year and the
maintenance cost is 2%. At a 3% interest rate the NPV starts to be positive when the sale
price is about 65 US dollars per MWh (mills). With an interest rate of 9%, the NPV starts
to be positive when the sale price is about 83 US dollars per MWh. This is a difference of
about 22%. This shows how important the interest rate is for a project this size.
Figure 14. Comparing three different interest rates for the eight wind turbine units
0%
20%
40%
60%
80%
100%
2011
2013
2015
2017
2019
2021
2023
2025
2027
2029
2031
2033
2035
2037
2039
2041
2043
2045
2047
2049
2051
Internal Rate of Return
IRR Total Cash Flow
IRR Net Cash Flow
-40.000
-30.000
-20.000
-10.000
0
10.000
20.000
30.000
40.000
30 40 50 60 70 80 90 100 110
NPV for different interest rate
NPV 3% IR
NPV 6% IR
NPV 9% IR
NPVKUSD
Sale Price USD/MWh (mills)
35
9 Discussion
In many areas of the world, wind energy will play an important role in future power
supply. Further improvements in wind turbines will lead to further cost reductions and a
fast growing worldwide market. It will also lead to larger wind turbines and new system
applications. Will wind pumped storage systems with a shaft driven technology where the
water is used repeatedly be the new future possibility for hydropower plants? The future of
this technology will depend mainly on the profitability of the project and the environment
of where it will be built. Windpump systems added to a hydropower plant using
conventional three blade horizontal wind turbines and pumping water without producing
electricity, have not been implemented in this size before.
Governments are more concerned about environmental factors today than 10 years ago.
Many rural areas are priceless from the tourist point of view, and some are seen as very
good agricultural areas. The profitability assessment shows that it is not profitable to use a
wind pumped storage system to minimize a reservoir and a dam construction. In the
example from chapter 8, where eight wind turbine units are used together, it is possible to
reduce an average sized reservoir by about 8%. This is calculated from an average price of
four reservoirs and dams buildings in Iceland. In this case, the pumped flow rate is about
15 m3/s, the average wind speed at a 100 m height is 12.71 m/s and there is no wind
pumping for about 49 days. The estimated cost of the project is much higher than the
reduced cost of building a new lower dam and a smaller sized reservoir. No calculations of
other costs like loans or tax payments were consider necessary, because it was never
profitable, even if the estimated price for pumped water was added (8 US dollars for Gl).
Estimated price for the land was not included in the calculations. It was expected that the
land used for the reservoir and the dam is free. In the case where the environment used for
construction of the reservoir is priced on the grounds of e.g. cultural, agricultural or
tourist’s usage, the reduced reservoir estimates can possibly start to show a profit. But in
each case, the key factor will always be the environmental situation.
36
The profitable assessment calculations show that it is not profitable to build a wind
pumped storage system for more electricity production at existing hydropower plants. Not
included in these calculations is an unforeseen first time design cost. The technique of the
shaft connections is well known today and multi bladed wind turbines are used instead of
three bladed wind turbines. The expected sales price of one MWh of electricity in the
profitability assessment is 29 US dollars. The price of electricity in Iceland for the industry
and household consumers is lower than the electricity price in the EU. In the second
semester 2008, the electricity price without network cost and non-recoverable taxes and
levies for industrial consumers in the EU, with annual consumption between 500 and 2000
MWh, was from 42 US dollars (€2.94) to about 200 US dollars (€14) for one MWh
(Goerten et al., 2009). There is a different energy and supply price for the industry in each
of the member countries and the prices are even higher for household consumers. The ratio
between the energy and supply costs and the network costs can differ. By changing the sale
price from 29 US dollars to 90 US dollars, will have a huge impact on the profitability
calculations. Even with half the pumping flow rate (due to a lower average wind speed),
the same investment cost and the sales price of electricity at about 165 US dollars, the
project with 8 wind turbine units installed will show a profit in the EU. A wind pumped
storage system with a shaft technique for a hydropower plant is profitable in the EU
because of the high electricity price.
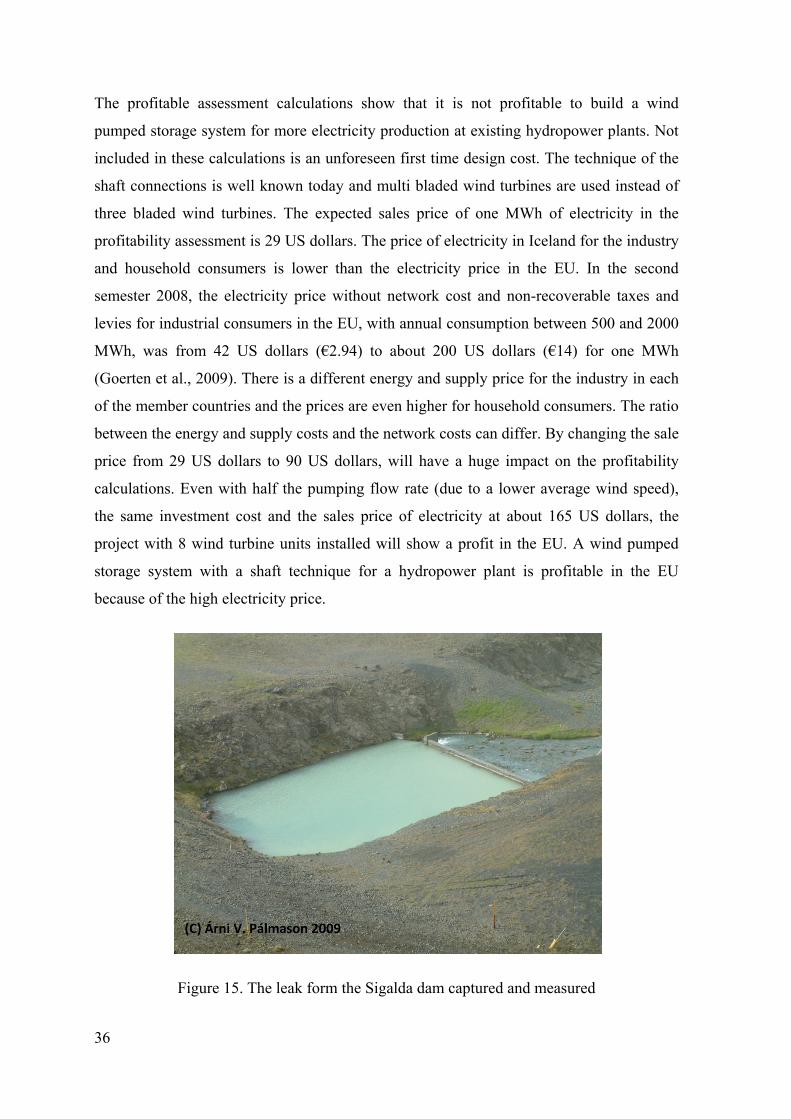
Figure 15. The leak form the Sigalda dam captured and measured
37
A wind pumped storage system can be installed for security reasons. Low status of the
water level in reservoirs, when there is no melting of ice from the glaziers, can occur in the
winter time in Iceland. Krókslón is the reservoir for Sigalda hydropower plant. The
reservoir is at maximum height 498 m over sea level. The lowest height of the water level,
required for electricity production, is 491 m over sea level (Hannesdóttir, 2009). The
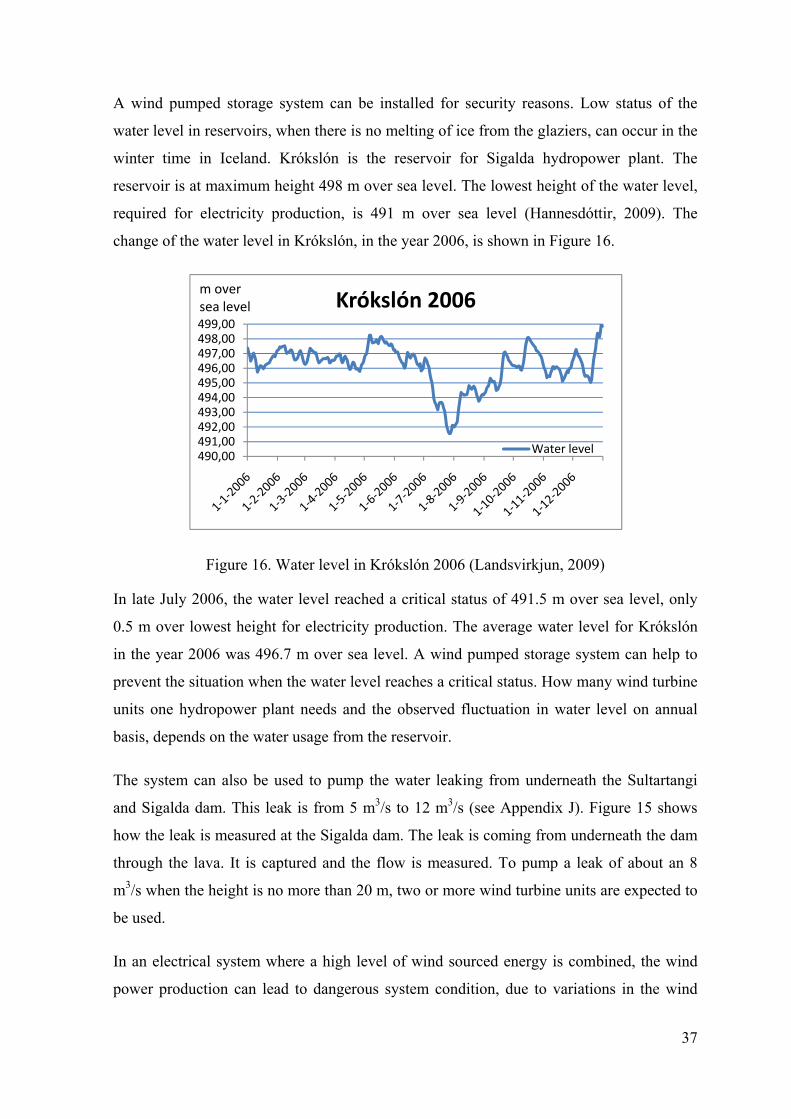
change of the water level in Krókslón, in the year 2006, is shown in Figure 16.
Figure 16. Water level in Krókslón 2006 (Landsvirkjun, 2009)
In late July 2006, the water level reached a critical status of 491.5 m over sea level, only
0.5 m over lowest height for electricity production. The average water level for Krókslón
in the year 2006 was 496.7 m over sea level. A wind pumped storage system can help to
prevent the situation when the water level reaches a critical status. How many wind turbine
units one hydropower plant needs and the observed fluctuation in water level on annual
basis, depends on the water usage from the reservoir.
The system can also be used to pump the water leaking from underneath the Sultartangi
and Sigalda dam. This leak is from 5 m3/s to 12 m3/s (see Appendix J). Figure 15 shows
how the leak is measured at the Sigalda dam. The leak is coming from underneath the dam
through the lava. It is captured and the flow is measured. To pump a leak of about an 8
m3/s when the height is no more than 20 m, two or more wind turbine units are expected to
be used.
In an electrical system where a high level of wind sourced energy is combined, the wind
power production can lead to dangerous system condition, due to variations in the wind
490,00491,00492,00493,00494,00495,00496,00497,00498,00499,00
Krókslón 2006
Water level
m oversea level
38
direction and the speed. In small or medium electrical systems, where the installed wind
source has reached the production limitation, a danger of interference between power
demand and the energy production can occur. In a situation like this it is still possible to
utilize the wind energy by installing a wind pumped storage system with shaft driven
pumps combined with a hydropower plant. This can be utilized at locations where water is
accessible but not in enough quantity for a conventional hydropower plant.
In the case where a wind pumped storage system uses a wind turbine to produce electricity
to drive the pumps, and pumping is not necessary, the electricity is directed to the grid.
This is most common in wind pumped storage systems today. In a system where electricity
is produced with a hydro turbine from the pumped water, the pumps are not expected to
stop except when there is none or to strong a wind, or for maintenance. For example, one
Vestas V80 wind turbine can drive one pump with a shaft connection. The flow rate from
electricity driven pumps will be just about 1.6 m3/s, instead of having the pumping flow
rate about 1.8 m3/s from pumps connected with shafts to the wind turbines. This has an
impact on the profitability assessment and will make this assessment, based on wind
turbine producing electricity, non profitable, unless the electricity sale price for one MWh
is higher than 100 US dollars or 100 mills.
39
10 Conclusion
The main reasons for non profitable use of a wind pumped storage system for extra
electricity production in Iceland are the high price of powerful wind turbines and the low
electricity sale price. In the Icelandic case, where eight units are installed with a flow rate
of about 15 m3/s and electricity price equal to 85 US dollars for MWh, the profitability
assessment started to show profit. In countries where the electricity sale price is higher
than 120 US dollars for one MWh, information from the profitability assessment shows
that it started to be profitable to produce extra electricity with an added wind pumped
storage system, even though the flow rate is 30% lower due to a lower average wind speed.
Producing energy with wind turbines is categorized renewable and has nearly non CO2
emission.
A wind pumped storage system can be used to secure the water level in a reservoir made
for hydropower plants. If the water level in a hydropower plant reservoir is secured, the
electricity supply from the plant is also secured. In locations where electricity sale price is
higher than 90 US dollars it can probably be used with a profit to pump water into a
reservoir for electricity production with hydroelectric turbines. It is also possible to use it
to pump leakage water from a reservoir, where the head is just about 10 m to 25 m high. It
has not been calculated in this thesis, but pumping water for security reasons is likely to be
profitable in locations where a shortage of water in an upper reservoir can occur.
The next step is to design a wind pumped storage system, described in this thesis, where
the wind turbines are connected to the pump with a shaft. Most important is to get a
reliable price for a powerful wind turbine without a gearbox and a generator because with
the installation cost it is about 93% of the equipment part in the profitability assessment. It
is also important to find useable inexpensive plastic pipes to use instead of the steel pipes.
Other very important factors are the sale price for the electricity and the average wind
speed in the area.

41
References
Ackermann, T. (2005). Wind Power in Power Systems. Chichester: John Wiley & Sons Ltd.
Alstom (2009). Alstom Power. Retrieved 21.08.2009, from http://www.power.alstom.com/_eLibrary/presentation/upload_57346.pdf
Anagnostopoulos, J. S., Papantonis, D. E. (2007). Pumping station design for a pumped-storage wind-hydro power plant. Energy Conversion and Management, 48, 3009–3017
AWEA (2009). Resources. Retrieved 17.11.2009, from http://www.awea.org/faq/windpower.html
Badran, O. (2003). Wind turbine utilization for water pumping in Jordan. Journal of Wind Engineering and Industrial Aerodynamics, 91, 1203–1214
Bid On Equipment (2009). GOULDS 316SS Centrifugal Pump 3175 XL 20x24-28. Retrieved 10.10.2009, from http://208.11.143.12/detail~id~46792.htm
Bolegoh, G. S. (2001). Pumps, Reference Guide. Ontario Power Generation
Bueno, C., Carta, J. A. (2006). Wind powered pumped hydro storage systems, a means of increasing the penetration of renewable energy in the Canary Island. Renewable and Sustainable Energy Reviews, 10, 312-340
Central Bank of Iceland (2009). RIKB 25 0612. Retrieved 27.10.2009, from http://www.bonds.is/MarketOverview.aspx?catID=1631&Type=Bond&OrderBookId=66912
Coad, W. J. (1985). Simplified sizing of pipes and ducts. Retrieved 5.10.2009, from http://www.coadengineering.com/articles/198507.pdf
Crowe C.T, Elger D.F, Williams B.C, Roberson J.A. (2008). Engineering Fluid Mechanics (9th ed). Wiley 2010.
Davison M., Zhao G. (2009). Optimal control of hydroelectric facility incorporating pump storage. Renewable Energy, 34, 1064–1077
efunda (2009). Pipe Friction Example. Retrieved 30.11.2009, from http://www.efunda.com/formulae/fluids/calc_pipe_friction.cfm
Douglas, T. H. (1990). Pumped Storage. Thomas Telford Ltd.
42
G. Hinteregger & Söhne (2007). Pumped Storage Power Plant Limberg II. Retrieved 22.08.2009, from http://www.hinteregger.co.at/CMS_Typo3/index.php?id=117&L=1
Geirsson, S. B. (2009, 22. May). Price of pipes and wells. (Pálmason Á. V., Interviewer)
Goodpasture, J. C. (2004). Quantitative Methods in PROJECT MANAGEMENT. Boca Raton: J. Ross Publishing, Inc.
Goerten J., Ganea D.C. (2009, 15. June). Environment and energy
Halldórsson, G. (2009, 18. November). Price of plasticpipes. (Pálmason Á. V., Phonecall 5301700)
Hannesdóttir, L. B. (2009, 28. December). Krókslón reservoir information. (Pálmason Á. V., Phonecall 5159000)
Ibrahim, H., Ilinca, A., Perron, J. (2008). Energy storage systems-Characteristics and comparisons. Renewable and Sustainable Energy Reviews, 12, 1221-1250
Ipsakis, D., Voutetakis, S., Seferils, P., Stergiopoulos, F., Elmasides, C. (2008). Power management strategies for a stand-alone power system using renewable energy source and hydrogen storage. International journal of Hydrogen energy, xxx, 1-15
ITT (2009). Pump Selection System. Reykjavik, Iceland. Available from http://www.gouldspumps.com/pss.html
Jensson, P. (2006). Profitability Assessment Model. Reykjavík, Iceland
Johnson, G. L. (2001). Wind Energy System, Electric Edition. Manhattan
Kazempour, S. J., Moghaddam, M. P., Haghifam, M. R., Yousefi, G. R. (2009). Electric energy storage systems in a market-based economy: Comparison of emerging and traditional technologies. Renewable Energy, xxx, 1-10
Kentfield, J. A. (1996). The Fundamental of Wind-driven Water Pumpers. Amsterdam: Gordon and Breach Science
Landsvirkjun (2008). Annual Report 2008. Reykjavik, Iceland
Landsvirkjun (2006). LV-2006/042. Reykjavik, Iceland
Landsvirkjun (2009). Vatnamælingakerfi Landsvirkjunar. Data given 2009.12.28.
Lawrence Pumps Inc (2009). A newsletter on pumps and reliability. Retrieved 17.11.2009, from http://www.lawrencepumps.com/newsletter/news_v01_i4_Sep.html
LMNO Engineering (2008). Design of Circular Pressurized Water Pipes. Retrieved 05.12.2009, from http://www.lmnoeng.com/HazenWilliamsDesign.htm#Table of HW Coefficients
43
Madlener, R., Stagl, S. (2005). Sustainable-guided promotion of renewable electricity generation. Ecological Economics, 53, 147–167
Merzouk, N. K., Merzouk, M., Messen, N. (2003). A mass consistent model application to the study of phenomenon in advance of sand towards the Algerian High Plains. Renewable Energy, 28, 655–663
Nesbitt, B. (2006). Handbook of Pumps and Pumping. Elsevier Science.
Orkuspárnefnd (2009). Raforkuspá 2009-2030. Reykjavík: Orkustofnun
Ragnarsson, Á. (2006). Orkunotkun á Íslandi. Reykjavík: Landvernd
Sathyajith, M., Pandey, K. P. (2003). Modeling the integrated output of wind-driven roto-dynamic pumps. Renewable Energy, 1143-1155
Sigurjónsson, K. (2009). Vindrafstöðvar á Íslandi. Retrieved 28.12.2009, from http://askja.blog.is/blog/askja/entry/860167/
Tester , J. W., Drake, E. M., Driscoll, M. J., Golay, M. W., Peters, W. A. (2008). Sustainable Energy, Choosing Among Options. The MIT Press, London
U.S. Department of ENERGY (2008). 2008 Wind Technologies Market Report. Retrieved 17.11.2009, from http://www1.eere.energy.gov/windandhydro/pdfs/46026.pdf
Vestas (2009). Vestas V82-1.65 MW. Retrieved 09.09.2009, from http://www.vestas.com/en/wind-power-solutions/wind-turbines/1.65-mw.aspx
Vestas (2009-01). Vestas V80-2.0 MW. Retrieved 09.09.2009, from http://www.vestas.com/en/media/brochures.aspx
Vieira, F., Ramos, H. M. (2008). Hybrid solution and pump-storage optimization in water supply system efficiency: A case study. Energy policy, 36, 4142-4148
White, F. M. (2002). Fluid Mechanics. McGraw-Hill.
Windatlas (2009). Retrieved 23.08.2009, from http://www.os.is/page/gagnavefsja_wind
WorldPumps. (2008, 05). Austrian pumped storage power station supply peak demands. Austria.

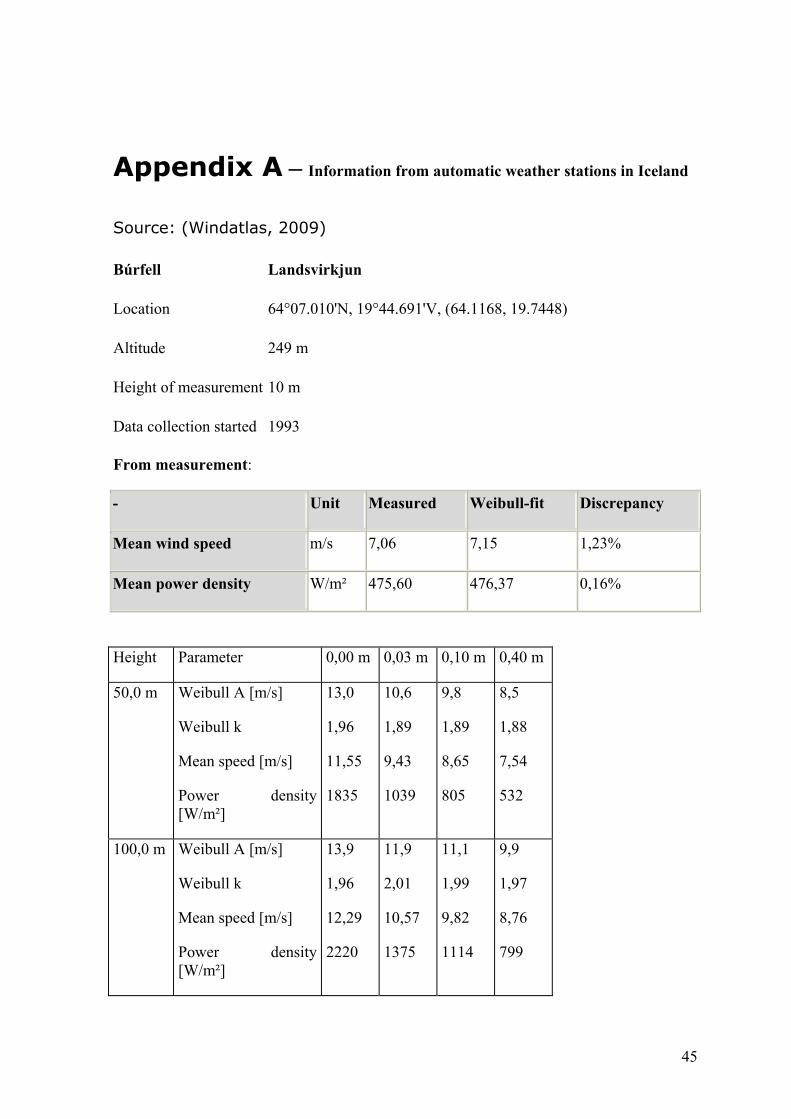
45
Appendix A – Information from automatic weather stations in Iceland
Source: (Windatlas, 2009) Búrfell Landsvirkjun
Location 64°07.010'N, 19°44.691'V, (64.1168, 19.7448)
Altitude 249 m
Height of measurement 10 m
Data collection started 1993
From measurement:
- Unit Measured Weibull-fit Discrepancy
Mean wind speed m/s 7,06 7,15 1,23%
Mean power density W/m² 475,60 476,37 0,16%
Height Parameter 0,00 m 0,03 m 0,10 m 0,40 m
50,0 m Weibull A [m/s]
Weibull k
Mean speed [m/s]
Power density [W/m²]
13,0
1,96
11,55
1835
10,6
1,89
9,43
1039
9,8
1,89
8,65
805
8,5
1,88
7,54
532
100,0 m Weibull A [m/s]
Weibull k
Mean speed [m/s]
Power density [W/m²]
13,9
1,96
12,29
2220
11,9
2,01
10,57
1375
11,1
1,99
9,82
1114
9,9
1,97
8,76
799
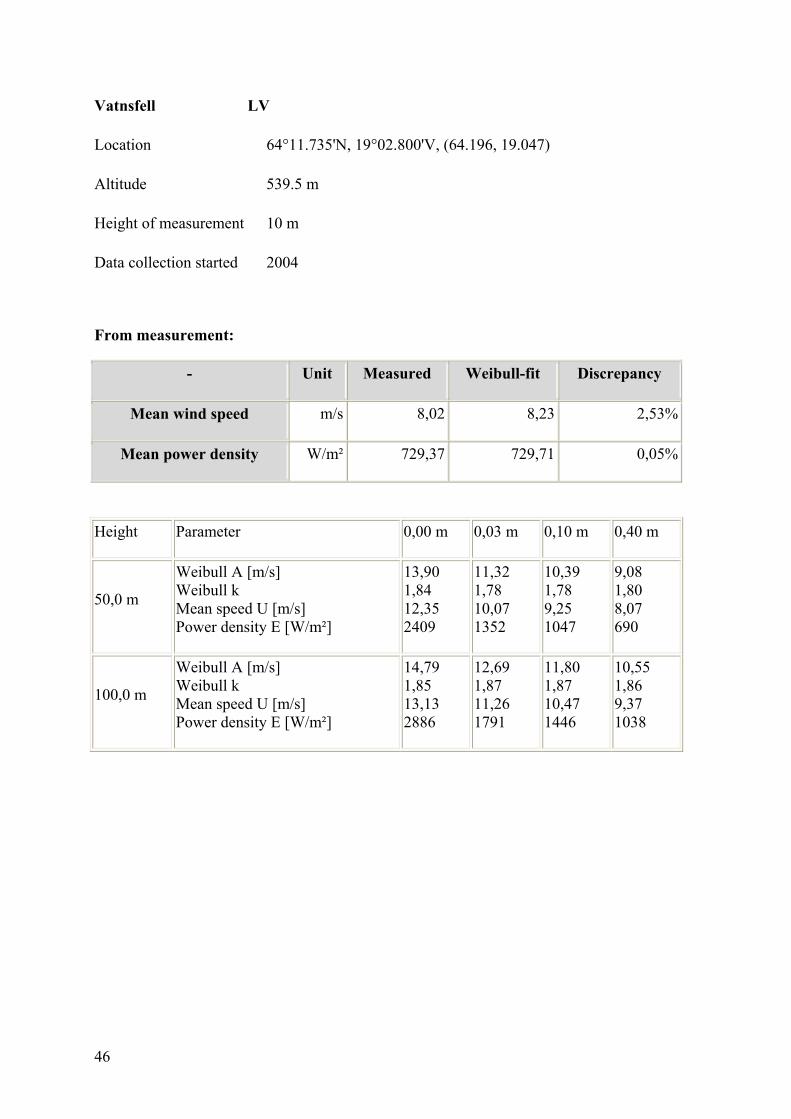
46
Vatnsfell LV
Location 64°11.735'N, 19°02.800'V, (64.196, 19.047)
Altitude 539.5 m
Height of measurement 10 m
Data collection started 2004
From measurement:
- Unit Measured Weibull-fit Discrepancy
Mean wind speed m/s 8,02 8,23 2,53%
Mean power density W/m² 729,37 729,71 0,05%
Height Parameter 0,00 m 0,03 m 0,10 m 0,40 m
50,0 m
Weibull A [m/s] Weibull k Mean speed U [m/s] Power density E [W/m²]
13,90 1,84 12,35 2409
11,32 1,78 10,07 1352
10,39 1,78 9,25 1047
9,08 1,80 8,07 690
100,0 m
Weibull A [m/s] Weibull k Mean speed U [m/s] Power density E [W/m²]
14,79 1,85 13,13 2886
12,69 1,87 11,26 1791
11,80 1,87 10,47 1446
10,55 1,86 9,37 1038

47
Appendix B – Information for Goulds pumps
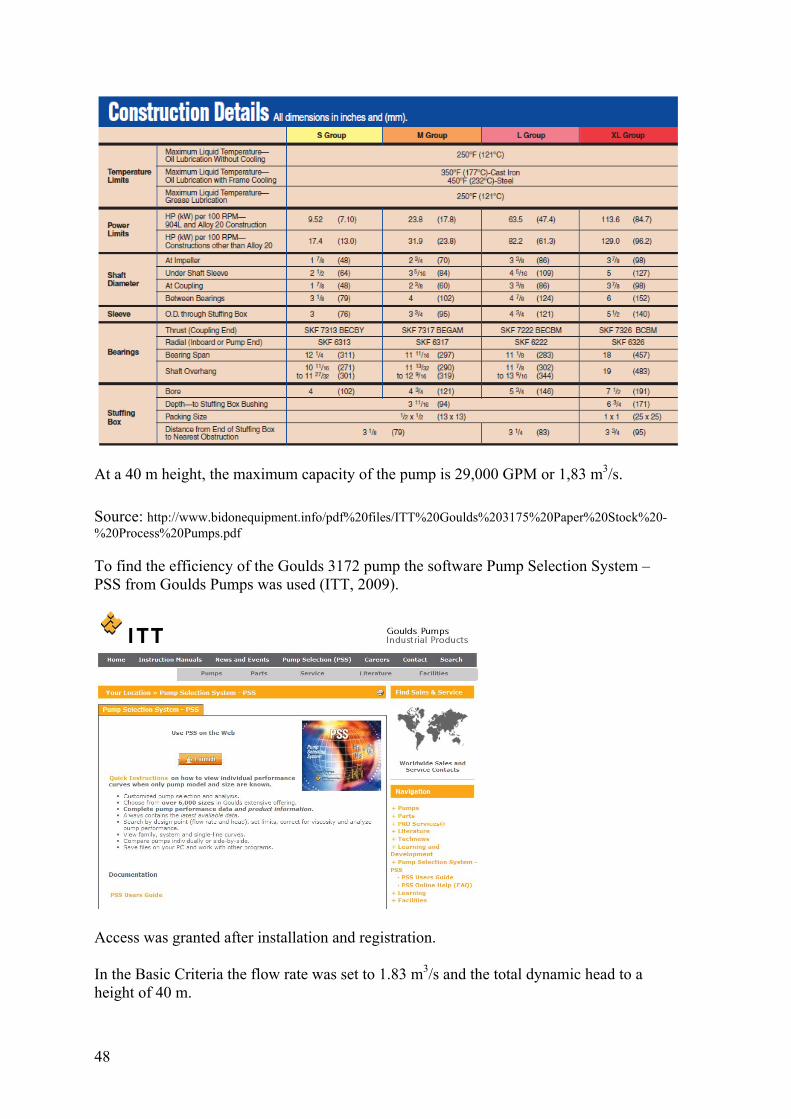
48
At a 40 m height, the maximum capacity of the pump is 29,000 GPM or 1,83 m3/s.
Source: http://www.bidonequipment.info/pdf%20files/ITT%20Goulds%203175%20Paper%20Stock%20-%20Process%20Pumps.pdf
To find the efficiency of the Goulds 3172 pump the software Pump Selection System – PSS from Goulds Pumps was used (ITT, 2009).
Access was granted after installation and registration. In the Basic Criteria the flow rate was set to 1.83 m3/s and the total dynamic head to a height of 40 m.
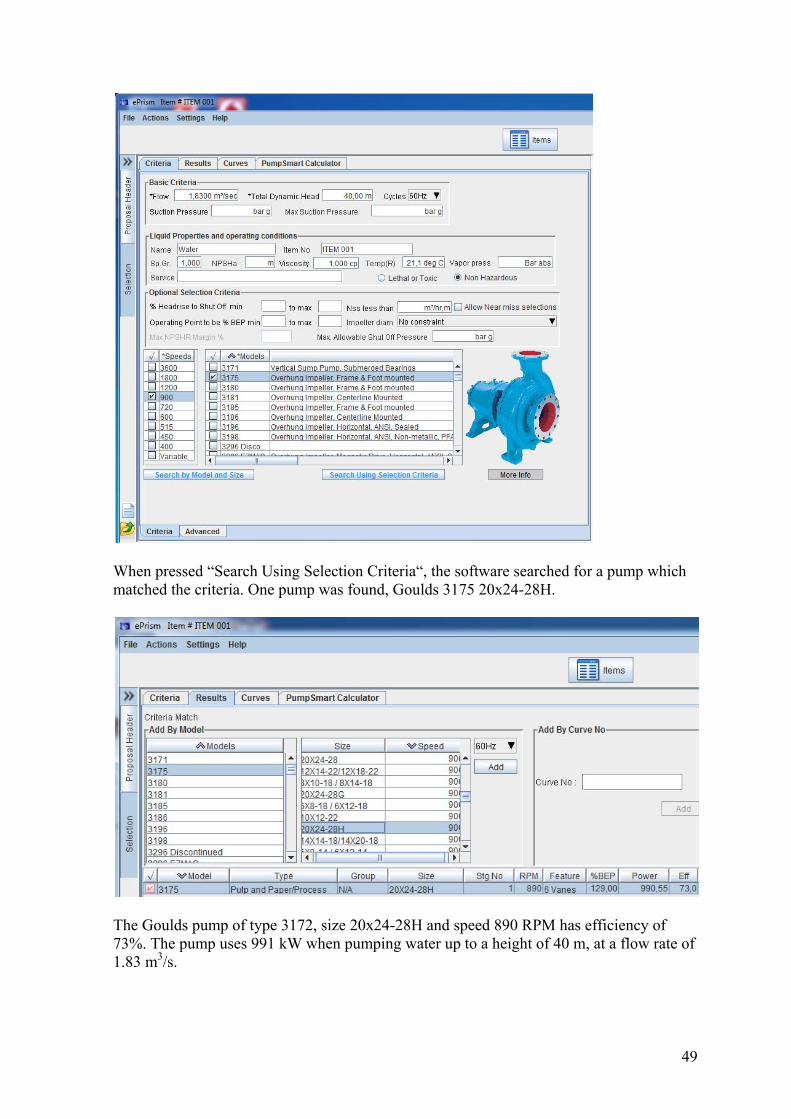
49
When pressed “Search Using Selection Criteria“, the software searched for a pump which matched the criteria. One pump was found, Goulds 3175 20x24-28H.
The Goulds pump of type 3172, size 20x24-28H and speed 890 RPM has efficiency of 73%. The pump uses 991 kW when pumping water up to a height of 40 m, at a flow rate of 1.83 m3/s.
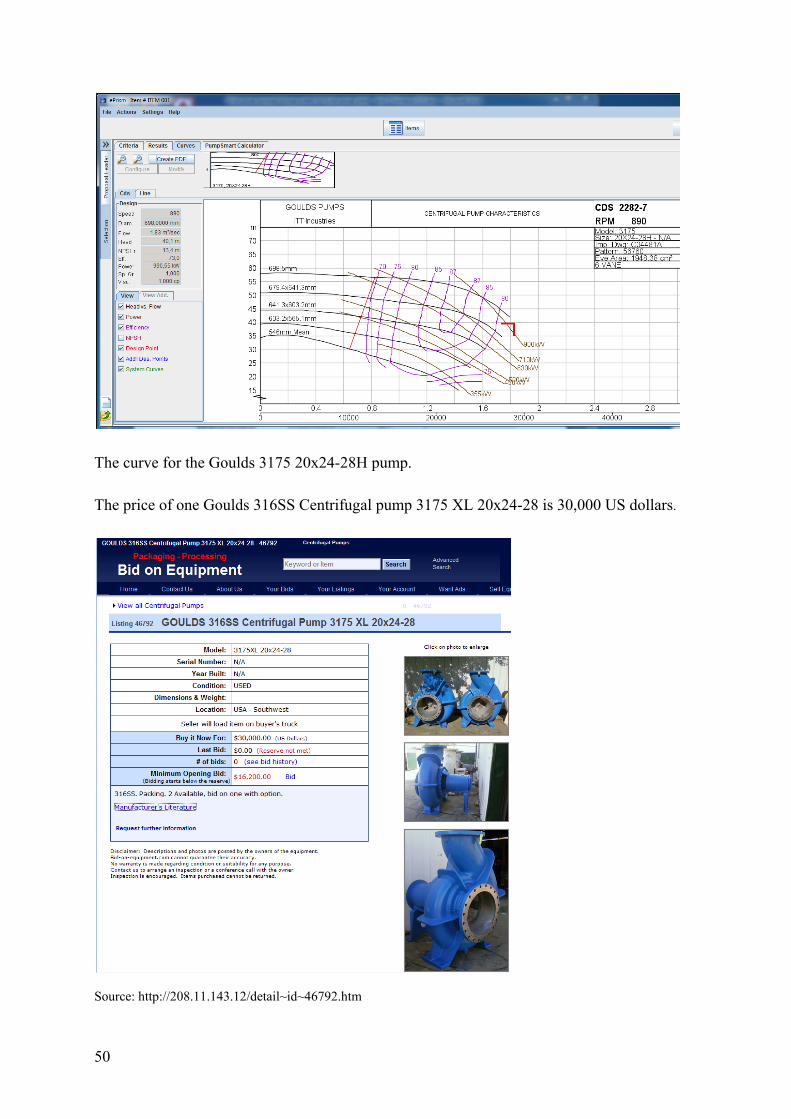
50
The curve for the Goulds 3175 20x24-28H pump.
The price of one Goulds 316SS Centrifugal pump 3175 XL 20x24-28 is 30,000 US dollars.
Source: http://208.11.143.12/detail~id~46792.htm
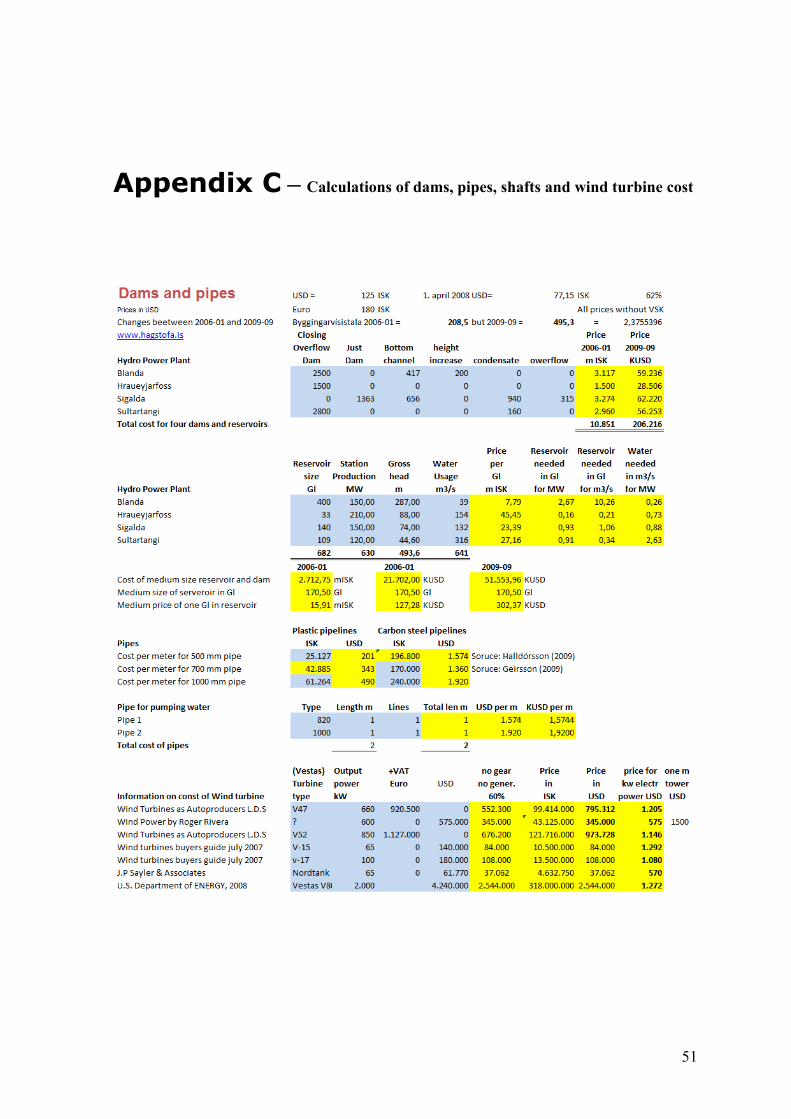
51
Appendix C – Calculations of dams, pipes, shafts and wind turbine cost
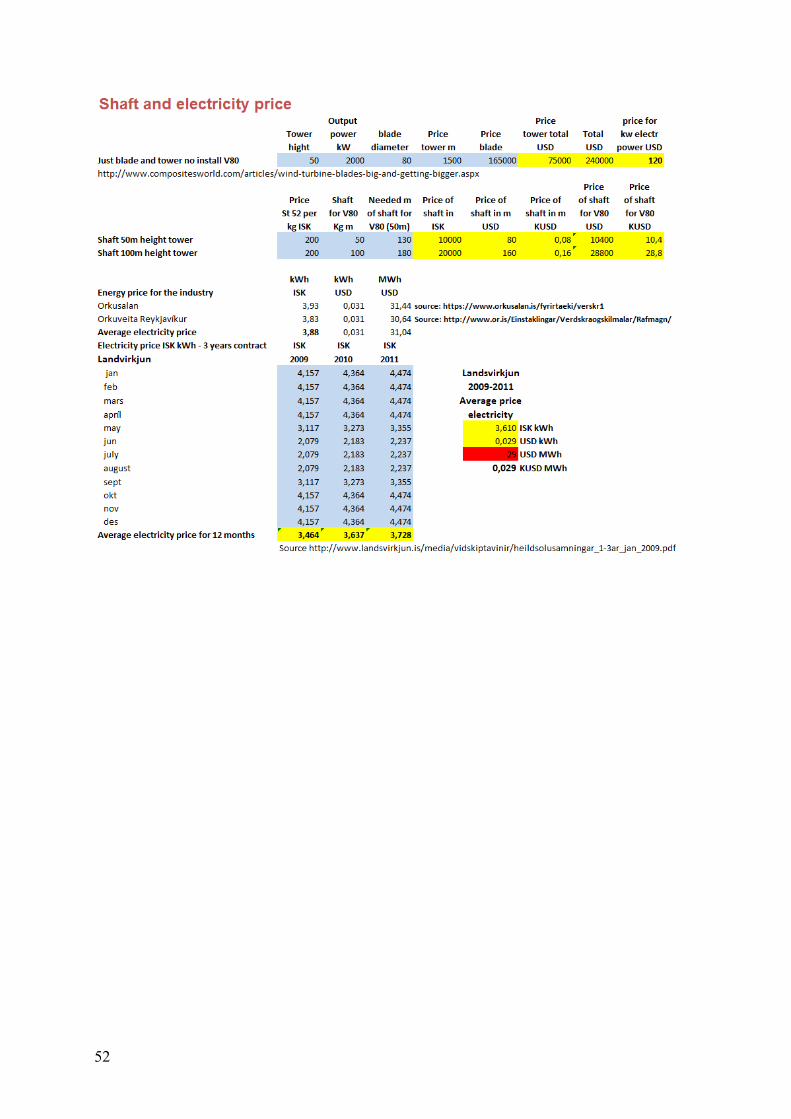
52
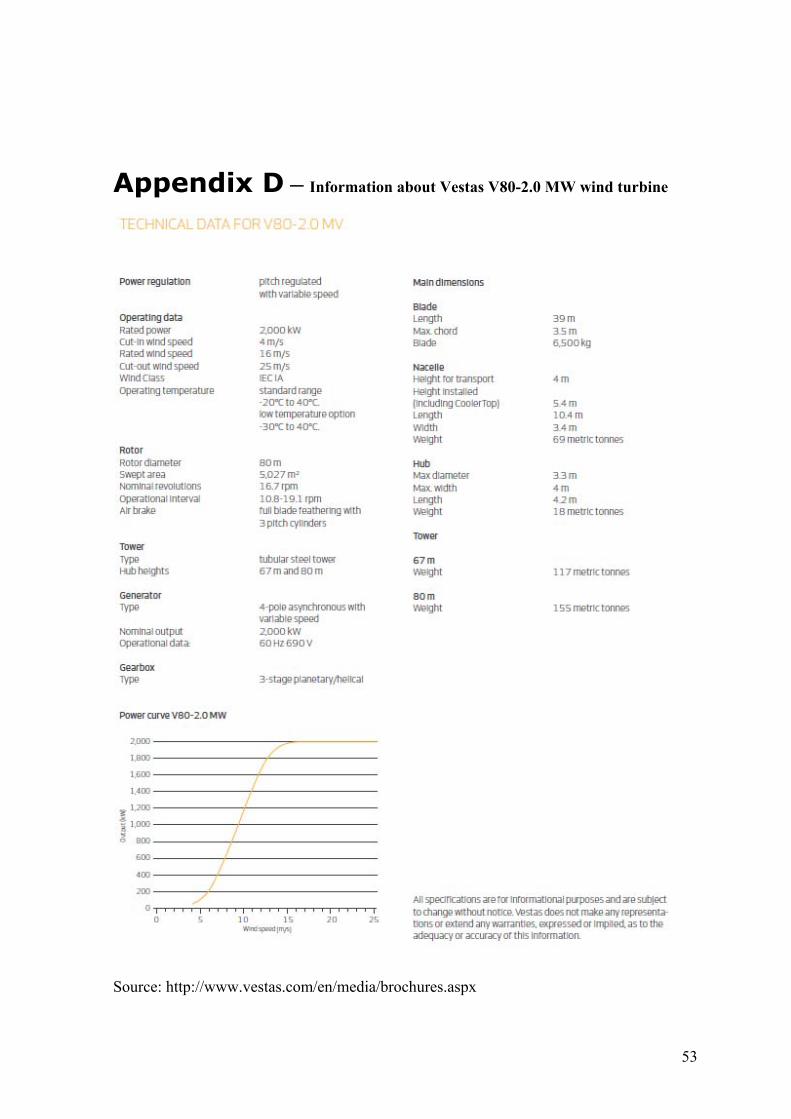
53
Appendix D – Information about Vestas V80-2.0 MW wind turbine
Source: http://www.vestas.com/en/media/brochures.aspx
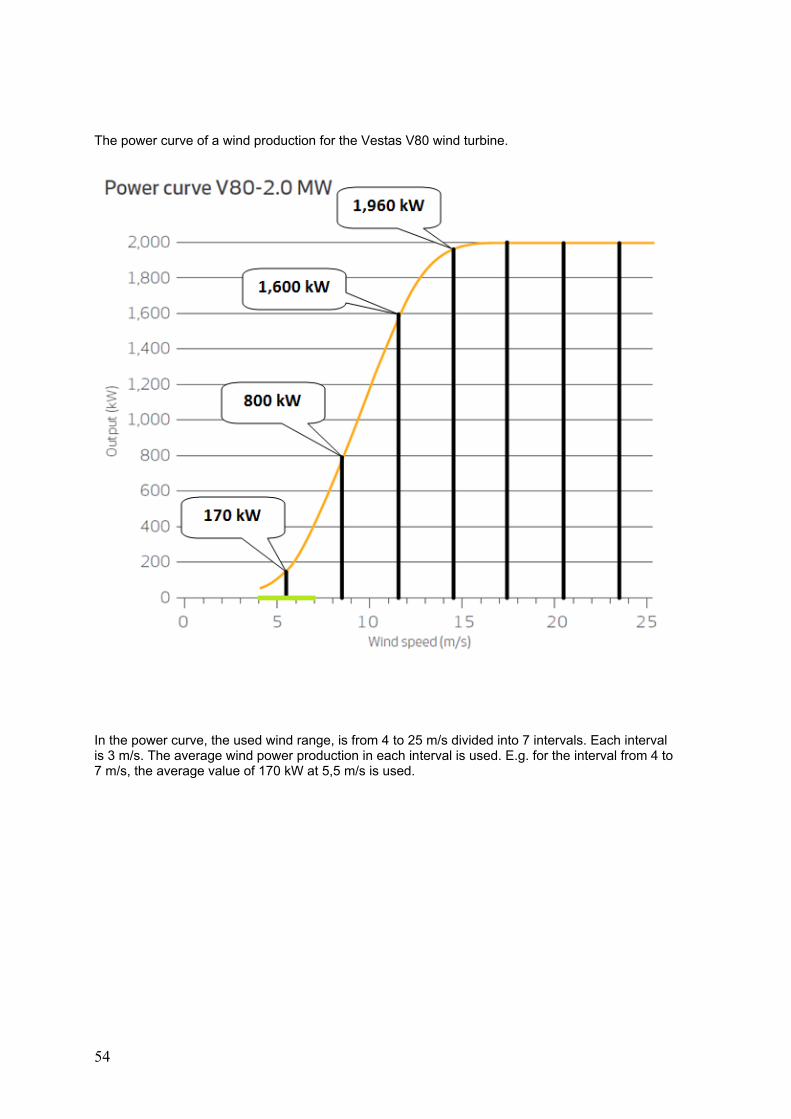
54
The power curve of a wind production for the Vestas V80 wind turbine.
In the power curve, the used wind range, is from 4 to 25 m/s divided into 7 intervals. Each interval is 3 m/s. The average wind power production in each interval is used. E.g. for the interval from 4 to 7 m/s, the average value of 170 kW at 5,5 m/s is used.
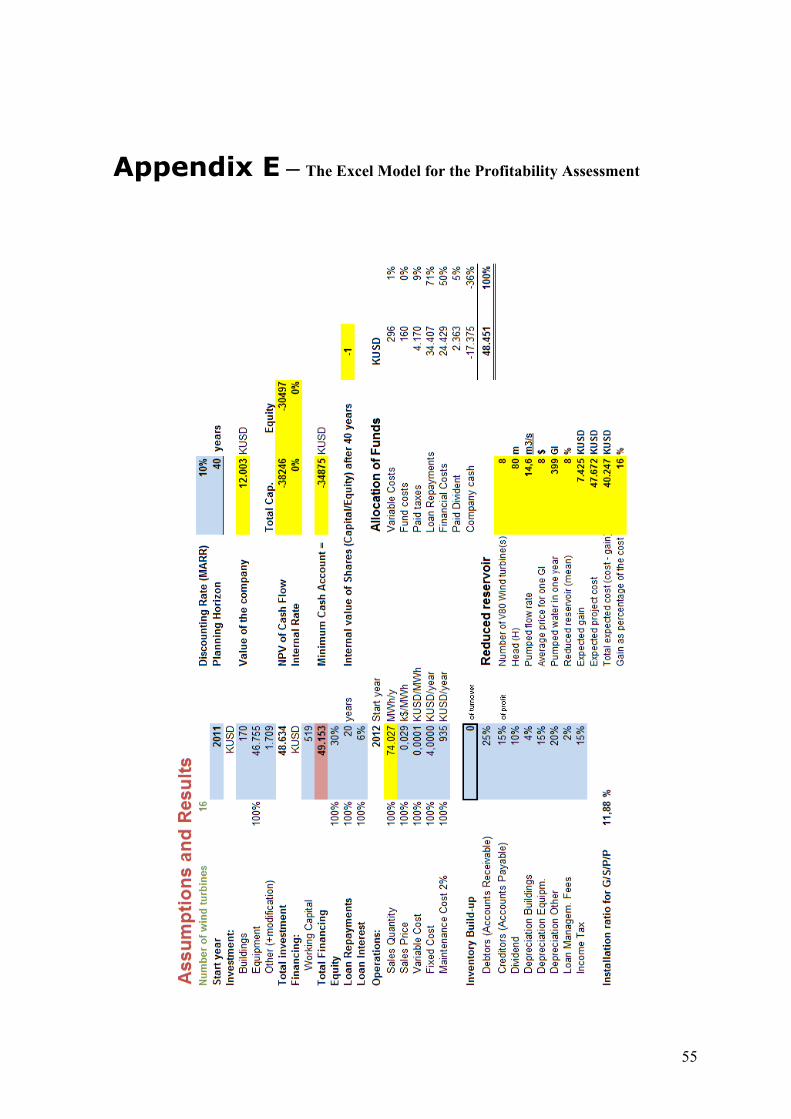
55
Appendix E – The Excel Model for the Profitability Assessment
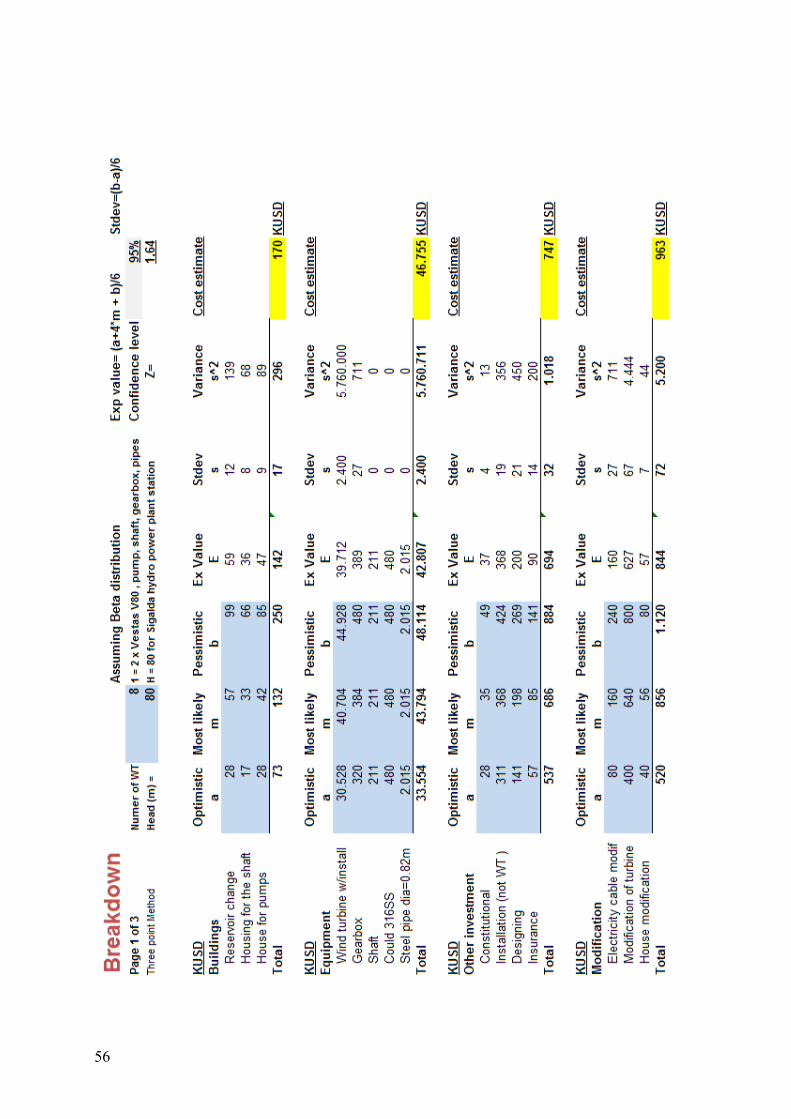
56
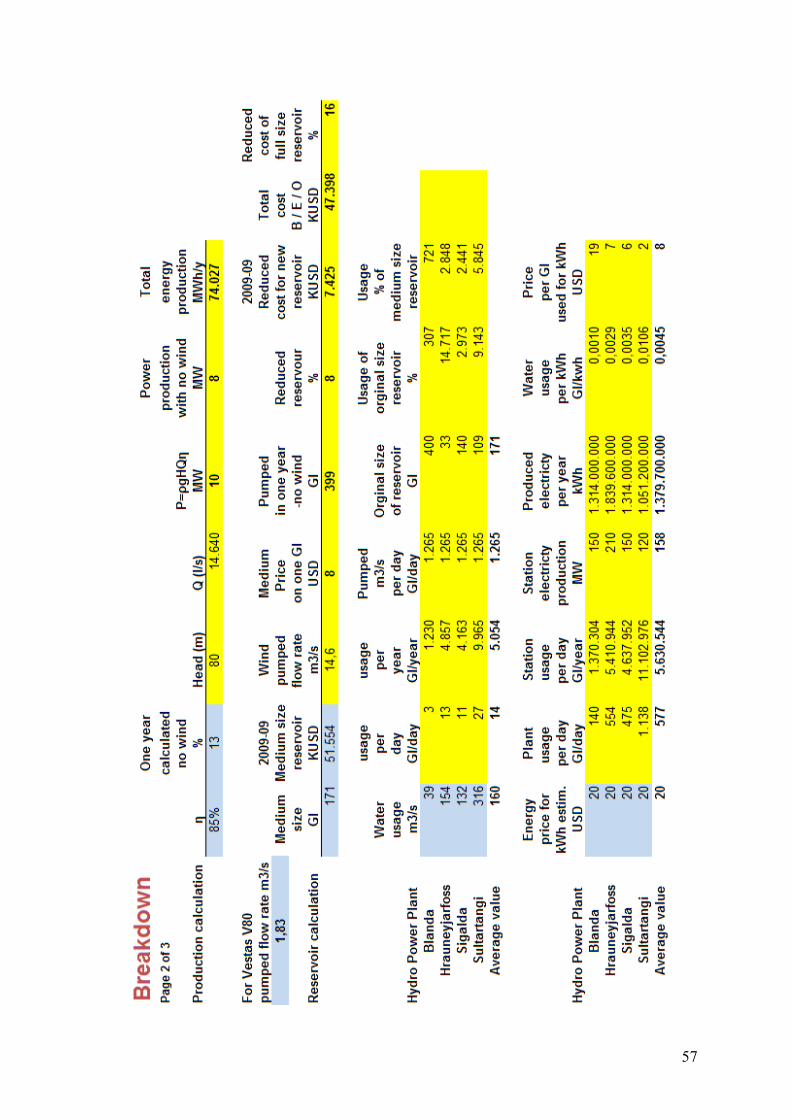
57
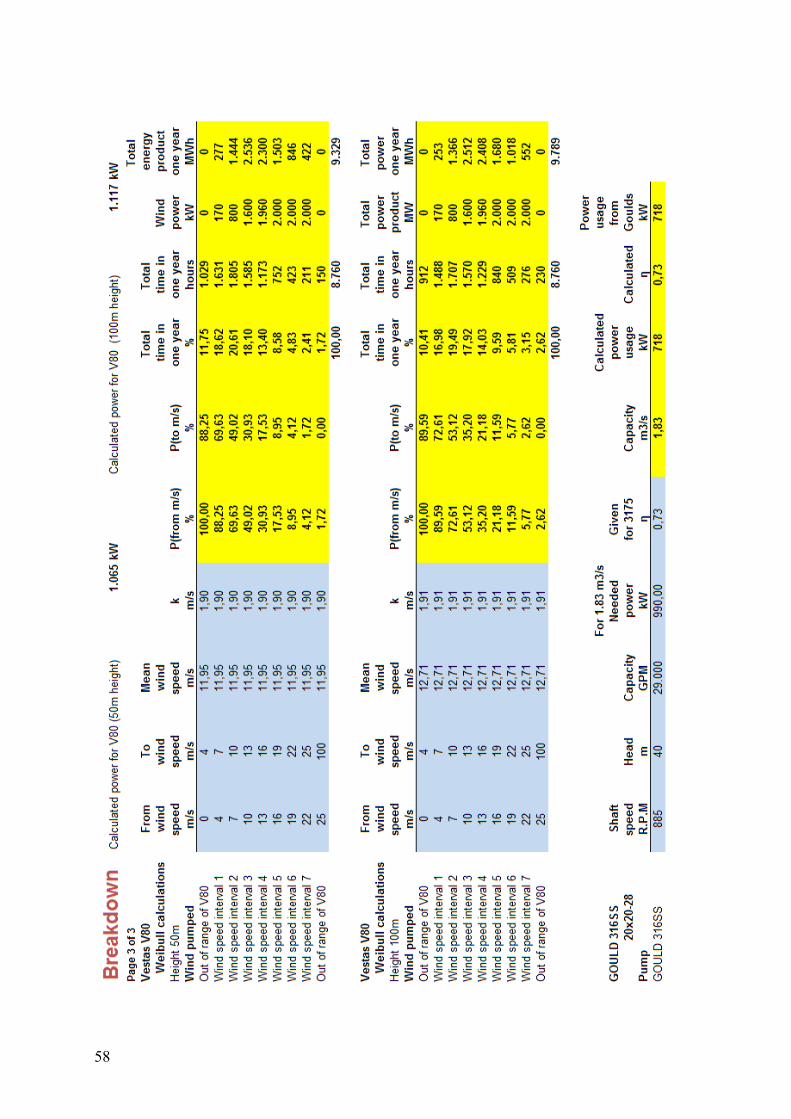
58
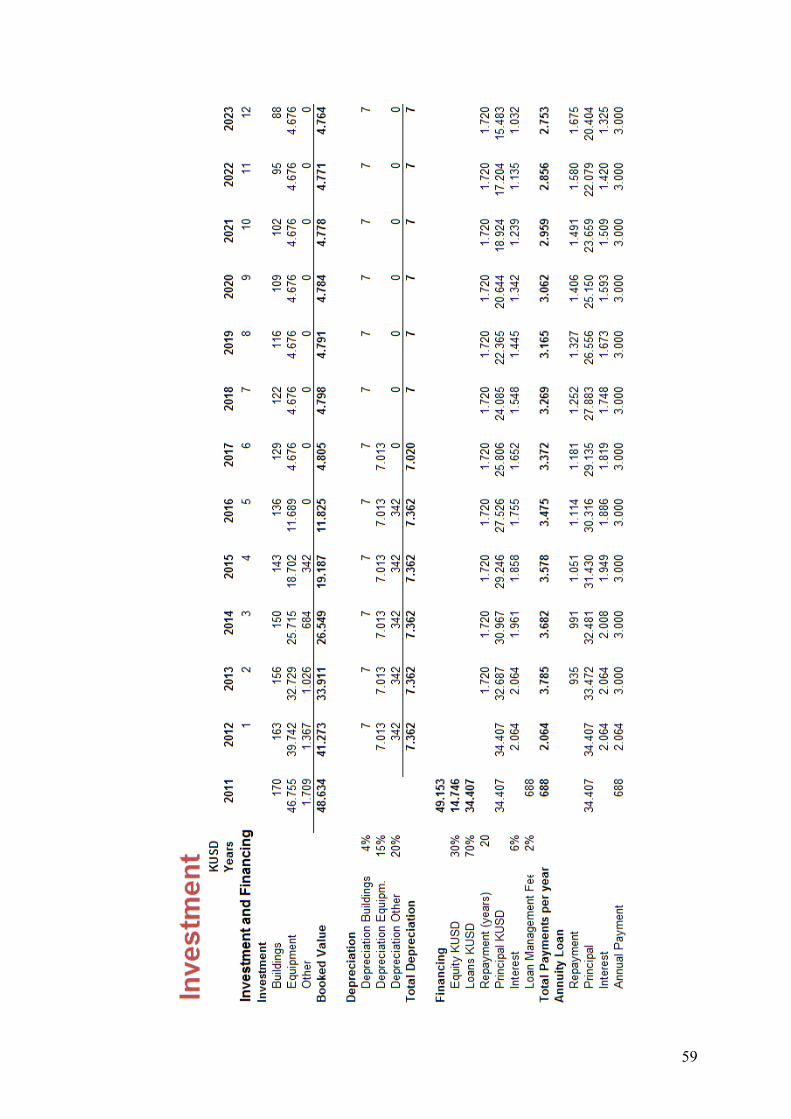
59
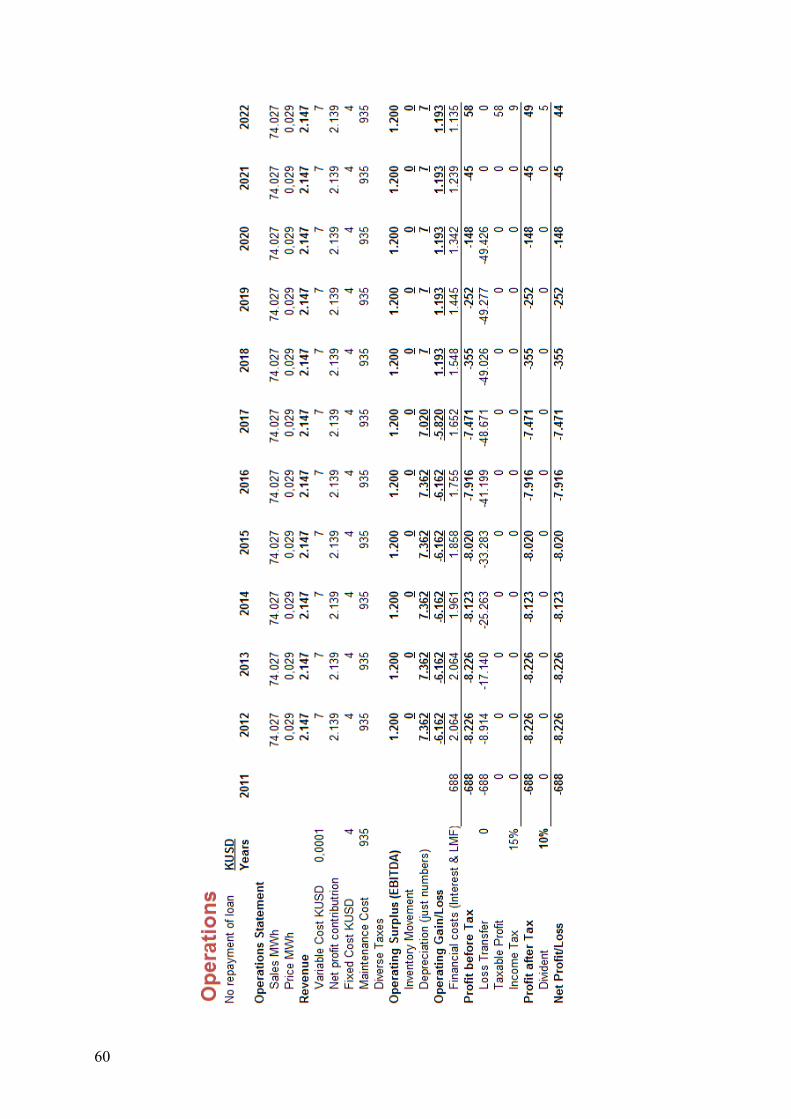
60
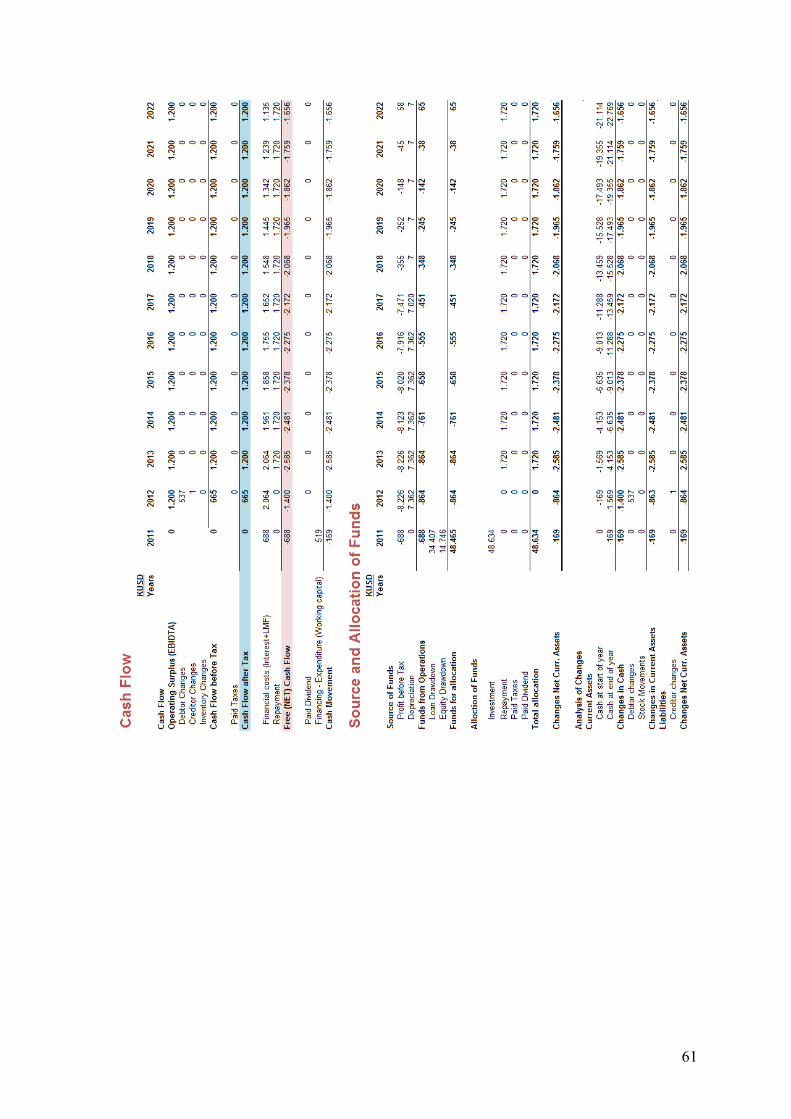
61
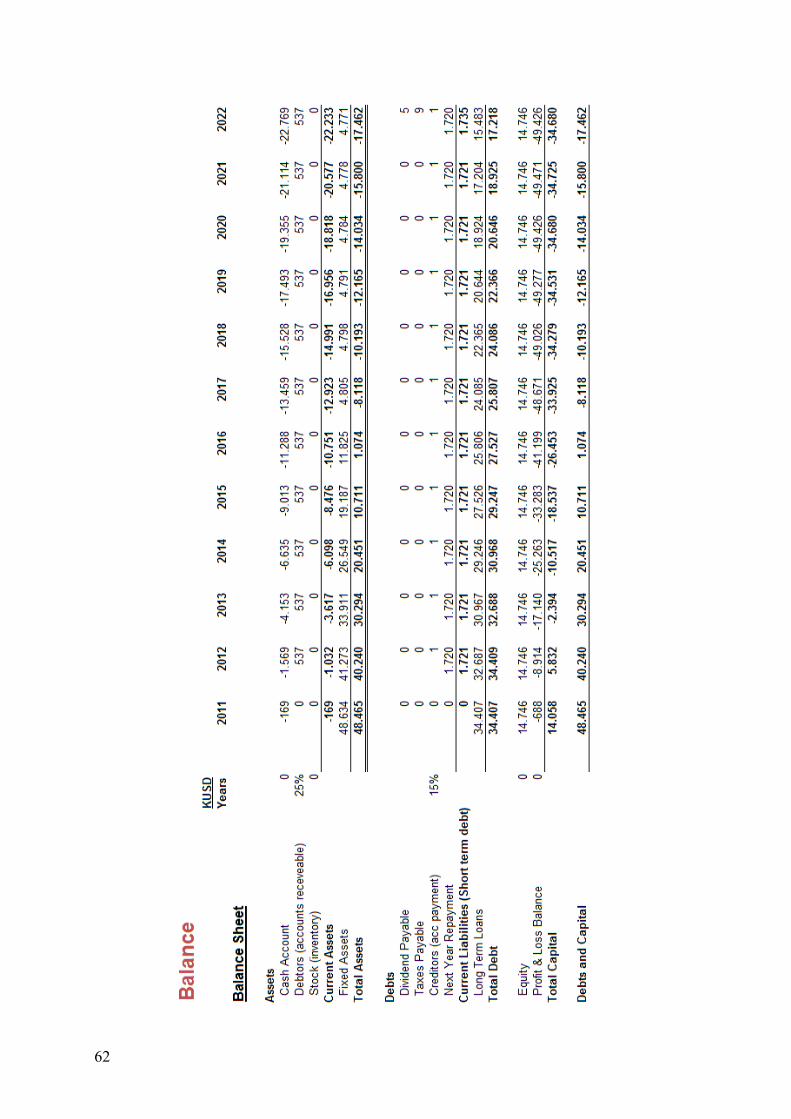
62
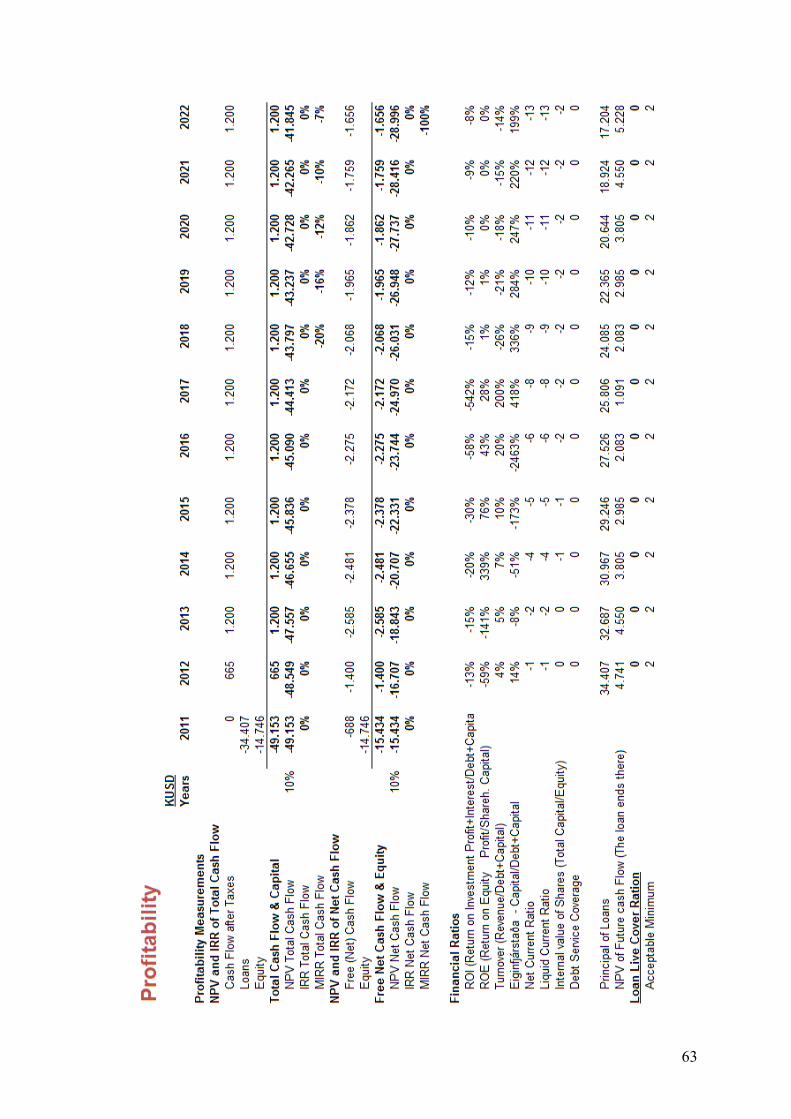
63
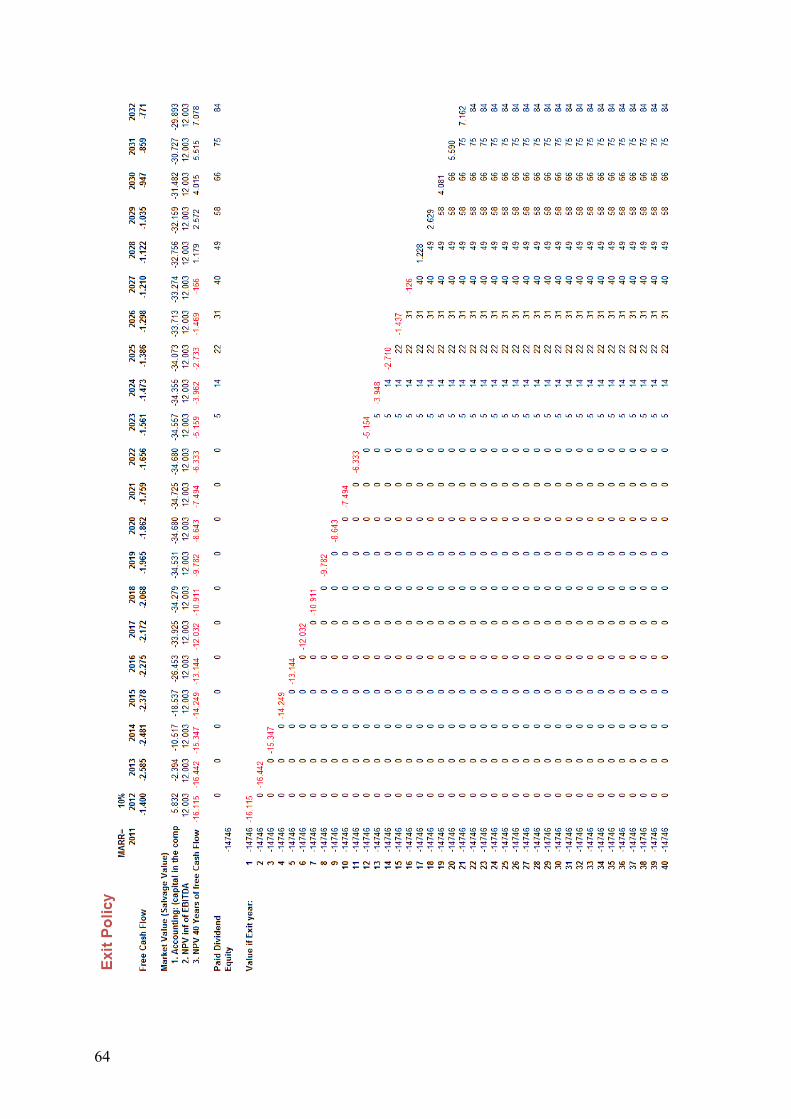
64

65
Appendix F – Permissions to use data in the thesis
Email sent 19.10.2009
From: Sigurður Ingi Friðleifsson [mailto:[email protected]] Sent: 19. október 2009 12:12 To: Árni V. Pálmason Subject: vindaatlas
Sæll Árni Ég veit ekki alveg á hvaða formi þú þarft leyfi til að nýta þessar myndir úr Vindatlasi Orkustofnunar. Það er hinsvegar þannig að Vindatlasinn er ætlaður til almmenra nota óg á að vera opinn fyrir alla. Svo framalega sem vitnað er í heimildir þá er öllum heimil not af Vindatlasi Orkustofnunar Bestu kveðjur / best regards Sigurður Ingi Friðleifsson Framkvæmdarstjóri / Manager ORKUSETUR / Energy Agency Iceland (EAI) Borgir Norðurslóð 600 Akureyri ICELAND Sími: 569 6085 GSM: 863 6085 Fax: 460 5709 www.orkusetur.is [email protected]
Email sent 20.11.2009
From: Sara Árnadóttir [mailto:[email protected]] Sent: 20. nóvember 2009 15:24 To: 'Árni V. Pálmason' Subject: Vegna myndanna
Þú færð leyfi til þess að nota þær myndir sem ég hef teiknað í ritgerðinni þinni.
Þær eru merktar á þennan hátt: © Arnadottir (2009)
Sara Árnadóttir
66
From: Henriette Juul [mailto:[email protected]] Sent: 19. október 2009 06:10 To: Árni V. Pálmason Subject: RE: Price for Vestas wind turbines
Hi again – yes you may! As long as it is published information you may use it for you thesis – once again I wish you good wind!
Yours sincerely / Med venlig hilsen Henriette Juul Marketing Director Marketing Northern Europe Vestas Northern Europe T: +45 97302834 M: +45 23682834 [email protected]
Company reg. name: Vestas Northern Europe AB. This e-mail is subject to our e-mail disclaimer statement. Please refer to www.vestas.com/legal/notice If you have received this e-mail in error please contact the sender.
From: Árni V. Pálmason [mailto:[email protected]] Sent: 17. oktober 2009 15:10 To: Henriette Juul Subject: RE: Price for Vestas wind turbines
Dear Henriette
Can I have permission from Vestas to use photos and informations from brochures at the page http://www.vestas.com/en/media/brochures.aspx in my thesis?
Best regards Kærar kveðjur Árni V. Pálmason MSc í sjálfbærum orkuvísindum Reykjavik Energy Graduate School of Sustainable Systems
--------------------------------------------------------------------
gsm 824 4715
--------------------------------------------------------------------
Email sent 28.12.2009
67
Sæll Árni Nokkrum sinnum hefur vatnshæðin í Sigöldulóni verið lækkun enn neðar en 491 mys eins og gert var í sumar vegna viðgerða. Lægsta rekstrarvatnshæð er 491 mys. Kv. Laufey ---------------------------------------------------------------------------------------------------------- Framangreind gögn eru í samræmi við gagnagrunn Vatnamælingakerfis Landsvirkjunar 28. desember 2009. Landsvirkjun áskilur sér allan rétt til að endurskoða gögnin hvenær sem er. Hvorki gögnum né nöfnum mælistaða má breyta eftir að gögnin hafa verið afgreidd. Vitna má þannig í gögnin: Landsvirkjun, 2009: Vatnamælingakerfi Landsvirkjunar, 2009.12.28. -----------------------------------------------------------------------------------------------------------------
Laufey B. HannesdóttirVatnaverkfræðingur/ Hydrologist Tölvupóstur / e-mail: [email protected] Sími / tel: 515-8975 · Farsími / mobile: 690-2524 Landsvirkjun Power Háaleitisbraut 68 · 103 Reykjavík · Iceland Sími / tel: +354 515 8900 · Fax: +354 515 8905 www.lvpower.is ·

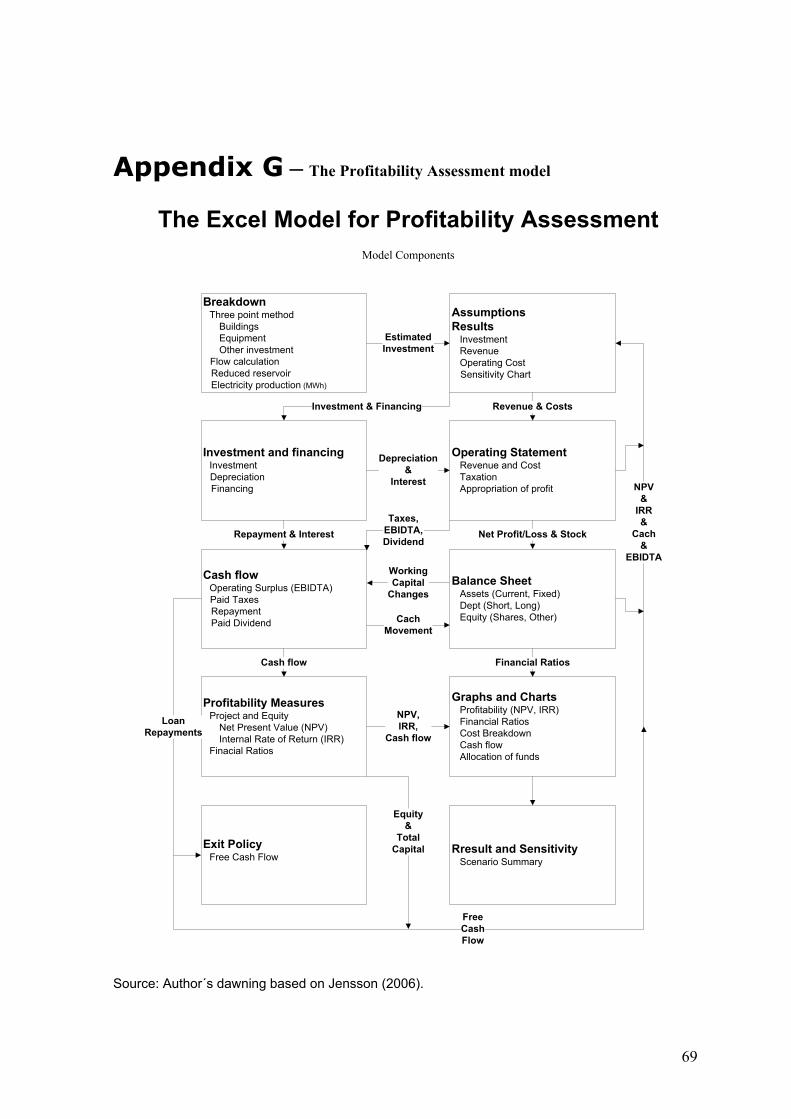
69
Appendix G – The Profitability Assessment model
AssumptionsResults
InvestmentRevenueOperating CostSensitivity Chart
BreakdownThree point method
BuildingsEquipmentOther investment
Flow calculationReduced reservoirElectricity production (MWh)
The Excel Model for Profitability AssessmentModel Components
Operating StatementRevenue and CostTaxationAppropriation of profit
Investment and financingInvestmentDepreciationFinancing
Graphs and ChartsProfitability (NPV, IRR)Financial RatiosCost BreakdownCash flowAllocation of funds
Profitability MeasuresProject and Equity
Net Present Value (NPV)Internal Rate of Return (IRR)
Finacial Ratios
Balance SheetAssets (Current, Fixed)Dept (Short, Long)Equity (Shares, Other)
Cash flowOperating Surplus (EBIDTA)Paid TaxesRepaymentPaid Dividend
Rresult and SensitivityScenario Summary
Exit PolicyFree Cash Flow
Revenue & Costs
EstimatedInvestment
Investment & Financing
Net Profit/Loss & Stock
Depreciation&
Interest
Repayment & InterestTaxes,
EBIDTA,Dividend
Financial RatiosCash flow
CachMovement
NPV, IRR,
Cash flow
LoanRepayments
NPV&
IRR&
Cach&
EBIDTA
Free CashFlow
Equity&
TotalCapital
WorkingCapital
Changes
Source: Author´s dawning based on Jensson (2006).


71
Appendix H – The SWOT analysis
Strengths
It can provide secure water level, if needed. At the Þjórsá area in south Iceland there is a high average wind speed. This gives
more power from a wind turbine. No CO2 emission is from a wind turbine. A wind turbine is a symbol for renewable energy production today and has a
positive global image. There is persistent wind in many places in Iceland. The power comes from renewable energy source.
Weaknesses
No wind turbine in the size of Vestas V80 has been installed in Iceland. There is little knowledge or experiment in this field.
The technique for a pumped storage system with a shaft connecting wind turbine and pumps and using a 3 blade wind turbine has not been implemented yet. First it has to be designed, then built and tested.
It is inevitable to expect an extra implementation cost. Not a profitable project to install a wind pumped storage system, for electricity
production from the extra water, at hydro power plant in Iceland.
Opportunities
The average electricity price in the EU is higher than in Iceland. Building a wind pumped storage system for electricity production from the pumped water will most likely be profitable. It will depend on local situation like average wind speed and head of the water.
Wind power is not always usable because of the reliability on the wind. No wind, no power! But with a windpump and a hydropower plant, hydro turbines produce the electricity but the wind turbine and the pumps provide the water.
Many countries are now focusing on green technology energy production.
Threats
Iceland is on one of the windiest part on earth. This can cause a problem if weather is stormy and causing an irregular wind.
Volcano activity can cause a problem for a wind turbine by damaging the blades. The Icelandic currency is still recovering from the bank crash in 2008. Today there is an uncertainty about new energy taxes in Iceland. The political
atmosphere is adding more risk to the construction of bigger projects, than before.


73
Appendix I – The leak from the Sigalda dam Email sent 10.09.2009
From: Sigurður P Ásólfsson [mailto:[email protected]] Sent: 10. september 2009 14:58 To: Árni V. Pálmason Subject: Re: Leki úr lónum Sultartanga og Sigöldu
Sæll Árni Ég biðst afsökunar hvað ég svara þér seint en ég hef verið á fjöllum. Ég er ekki búinn að afla mér upplýsinga um verð á vatninu en get skoðað það fljótlega .Hvað varðar lekann get ég sagt þér að við Sultartanga er mælanlegur leki í gamla Tungnaár farveginum er hann á bilinu 0,5- 1 m3/s og neðan við Sigöldustíflu er lekinn nálægt 5 m3/s við stífluna en niður við Sigöldufoss er hann 9-12 m3/s. Ég skal leita að verði á þessu vatni fljólega. kv Sig. P. Ásólfsson