
Arm Nerve Conduction Velocity (NCV), Brain NCV, …...INTELLIGENCE 15, 33-47 (1991) Arm Nerve...
15
INTELLIGENCE 15, 33-47 (1991) Arm Nerve Conduction Velocity (NCV), Brain NCV, Reaction Time, and Intelligence T. EDWARO REED University of Toronto ARTHUR R. JENSEN University of California Two hundred California students, 18 to 25 years old, were tested for nerve conduction velocity (NCV) in the arm and in the visual pathway of the brain, simple and choice reaction times, and Raven's Progressive Matrices test for nonverbal intelligence. Contrary to a prediction based on theoretical grounds, and also to one study, arm NCV did not correlate with this intelligence measure. It also did not correlate consistently with the brain NCVs or with reaction time. In contrast, these brain NCVs do correlate positively (as predicted) with this measure of intelligence in this group of subjects and also in each of five electrophysiological studies of mentally retarded or demented subjects (relative to normal controls). A correct interpretation of these results should assist our understanding of the neurophysiological basis for human information processing and intelligence. Nerve conduction velocity (NCV), the speed at which an impulse (action poten- tial) travels along a nerve, is a basic physiological parameter and its measurement in various peripheral nerves is a standard neurological procedure. For a given nerve segment and recording technique, normal persons usually have NCV val- ues which deviate from the mean by less than 10%; significantly low values usually indicate disease or trauma (e.g., Ma & Liveson, 1983; Oh, 1984). From extensive studies in mice (Hegmann, 1972, 1975, 1979; Hegmann, White, & Kater, 1973; Reed, 1983, 1988; White & Hegmann, 1974), NCV, like some other physiological parameters, has been shown to be partly determined by heredity. Narrow-sense heritability (from parent to offspring) was estimated to be .23 -+ .05 in a strain of noninbred mice and is expected to be appreciably greater in humans (Reed, 1988). This study was supported by the Institute for the Study of Educational Differences and the Natural Sciences and Engineering Research Council of Canada. We thank E. Callaway for comments P.A. Vernon and P. Barrett for providing information on their unpublished studies, O. Shears, W. Adam- son, and J. Pavlick for technical assistance, and our assistants for testing. Correspondence and requests for reprints should be sent to T.E. Reed, Department of Zoology, University of Toronto, Toronto, Ontario M5S IAI, Canada 33
Transcript of Arm Nerve Conduction Velocity (NCV), Brain NCV, …...INTELLIGENCE 15, 33-47 (1991) Arm Nerve...

INTELLIGENCE 15, 33-47 (1991)
Arm Nerve Conduction Velocity (NCV), Brain NCV, Reaction Time,
and Intelligence T. EDWARO REED University of Toronto
ARTHUR R. JENSEN
University of California
Two hundred California students, 18 to 25 years old, were tested for nerve conduction velocity (NCV) in the arm and in the visual pathway of the brain, simple and choice reaction times, and Raven's Progressive Matrices test for nonverbal intelligence. Contrary to a prediction based on theoretical grounds, and also to one study, arm NCV did not correlate with this intelligence measure. It also did not correlate consistently with the brain NCVs or with reaction time. In contrast, these brain NCVs do correlate positively (as predicted) with this measure of intelligence in this group of subjects and also in each of five electrophysiological studies of mentally retarded or demented subjects (relative to normal controls). A correct interpretation of these results should assist our understanding of the neurophysiological basis for human information processing and intelligence.
Nerve conduct ion veloci ty (NCV), the speed at which an impulse (action poten-
tial) travels a long a nerve, is a basic physiological parameter and its measurement
in var ious peripheral nerves is a standard neurological procedure. For a g iven
nerve segment and recording technique, normal persons usually have N C V val-
ues which deviate f rom the mean by less than 10%; significantly low values
usually indicate disease or t rauma (e .g . , Ma & Liveson, 1983; Oh, 1984). From
extens ive studies in mice (Hegmann , 1972, 1975, 1979; Hegmann , Whi te , &
Kater, 1973; Reed , 1983, 1988; White & Hegmann , 1974), NCV, like some
other physio logica l parameters , has been shown to be partly determined by
heredity. Narrow-sense heritabili ty (from parent to offspring) was est imated to be
.23 -+ .05 in a strain o f noninbred mice and is expected to be appreciably greater
in humans (Reed, 1988).
This study was supported by the Institute for the Study of Educational Differences and the Natural Sciences and Engineering Research Council of Canada. We thank E. Callaway for comments P.A. Vernon and P. Barrett for providing information on their unpublished studies, O. Shears, W. Adam- son, and J. Pavlick for technical assistance, and our assistants for testing.
Correspondence and requests for reprints should be sent to T.E. Reed, Department of Zoology, University of Toronto, Toronto, Ontario M5S IAI, Canada
33
34 REED AND JENSEN
The concept of possible correlations in normal mammals between peripheral NCV (PNCV) and various behaviors may have been first proposed by Hegmann in 1972 (see also his later papers, especially Hegmann, 1979) for mice. Francis Galton in the last century proposed that higher intelligence is a consequence of faster "mental speed" and suggested testing this belief by measuring reaction time. Although he was not successful in showing a correlation, the negative correlation between choice reaction time and IQ has now been shown in several laboratories (Vernon, 1987).
The concept of a correlation between PNCV and human intelligence may have been first suggested by Reed (1984). This correlation is expected if there is a correlation between PNCV and brain (cortical) NCV (BNCV) because faster BNCV should increase the speed that information (as action potentials) is moved along nerve axons from one region of the cerebral cortex to another. This in- creased speed, in turn, should increase the rate of information processing, which, in turn, appears to be associated with higher intelligence (Reed, 1988). The contrary sequence--decreased speed, decreased rate, and lower intelligence-- should also occur.
The predicted positive correlation between BNCV and intelligence was found in each of five recent electrophysiological studies of mentally retarded or de- mented subjects. Each study found that normal age-matched controls had shorter visual evoked potential latencies (therefore, faster NCV) over the visual pathway (retina to thalamus to primary visual cortex) than did the retarded or demented subjects (Creel & Buehler, 1982; Gasser, Pietz, Schellberg, & K6hler, 1988; Korinthenberg, Ullrich, & Ftillenkemper, 1988; Landi et al., 1987; Pollock et al., 1989). A positive visual pathway NCV-intelligence correlation (r = .26, p < .002) was also found in the normal subjects of the present study (Reed & Jensen, 1989, 1991). This BNCV-intelligence correlation is becoming well established. The question is to be investigated in the present study is the correla- tion between PNCV and BNCV and between PNCV and intelligence.
In addition to the present study, two studies have looked for a PNCV-IQ correlation. Vernon and Mori (1989) determined NCVs for three segments of the median nerve of the arm and a measure of intelligence in 85 Canadian university students. They found a significant positive correlation (.42) between an overall measure of these NCVs and intelligence. Barrett, Daum, and Eysenck (1990) measured median nerve NCV (of the hand-wrist region) and Raven's Advanced Progressive Matrices (RAPM) in 44 British adults. They found no correlation between the NCV and the RAPM score.
The present report is from a study designed to determine possible correlations between various NCVs, in both the peripheral nervous system (PNS) and the central nervous system (CNS), and a measure of intelligence. As noted pre- viously, one result of this study has already been briefly reported. This report will present the results of testing NCV in the median nerve of the arm, various

NERVE CONDUCTION VELOCITY AND INTELLIGENCE 35
reaction times, visual pathway (brain) NCV, and the Otis IQ equivalent of Raven's Progressive Matrices in 200 students in California. The students were from a university and two community colleges. Within populations, no signifi- cant correlations between the median nerve NCV and IQ or visual pathway NCV were found. In the total population there is a small negative correlation between median NCV and IQ, probably due to population stratification. Because of the potential importance of the subject matter--the neurophysiological basis of in- formation processing and intelligence in normal and retarded individuals--the methodology of the present study is presented in detail.
SUBJECTS AND METHODS
Subjects Students from three state-supported postsecondary educational institutions in the eastern San Francisco Bay region of California, who were male, between 18 and 25 years of age, of European ancestry, and in apparent good health, were invited to participate in the study. These institutions included one university (112 stu- dents) and two community colleges (88 students). These colleges are two-year institutions offering both vocational and academic courses. Unlike the university, they admit any high school graduate. Subjects were recruited through advertise- ments and notices and were paid for their participation. All gave their informed consent. Interviews and testing were carried out in the laboratory of the second author (A.R.J.) in 1987 and 1988.
Testing
Personal Data and Intelligence. Subjects were questioned on their age, health status, handedness (preferred hand for writing), visual acuity (all had good vision, some after correction by glasses), and were measured for height, weight, arm span, and head length. (Measurements were made while wearing indoor clothing, without shoes. Height and arm span (arms horizontal) were measured to the nearest centimeter; weight was measured to the noarest kilo- gram. Head length was measured to the nearest millimeter using a cephalometer caliper in the sagittal plane with the blunt tips at the glabella and opisthocranion (Olivier, 1969). The university students were given the Raven's Advanced Pro- gressive Matrices test (Raven, 1983a) while the community college students were given the Raven's Standard Progressive Matrices (Raven, 1983b). (The latter test was thought to be appropriate for the less academically selected college students; the results showed that the advanced version would have been appropri- ate.) These tests were given without a time limit; most subjects took between 30 and 60 min. The Raven's scores were converted to equivalent Otis-Lennon IQ scores using a conversion from a different California college student population given all three tests (Jensen, Saccuzzo, & Larson, 1988).

36 REED AND JENSEN
Reaction Times. Four reaction times (RTs) were determined in one test ses- sion using the Jensen test console (Jensen, 1985). This apparatus consists of a panel of 8 button lights arranged in a semicircle, each 15 cm from a "home" button below them. The subject keeps the home button depressed (with the index finger of the preferred hand) until one or more of the 8 button lights is lighted and then, as quickly as possible, removes the finger from the home button and presses the (one) indicated light. The time from the light onset (stimulus) to the removal of the finger from the home button is the RT.
After practice sessions, the four RT tests (simple, choice-l, Oddman, choice-2) were given in this sequence. Each RT test consists of 20 (simple and choice RT) or 36 (Oddman) presentations. For each presentation, a warning sound is given and, after a random interval of 1 to 4 s, the light(s) come(s) on. For the simple RT, the light can come on only in one position. For choice-I and choice-2 RT, the light can come on at any one of the 8 positions; it comes on in a different position in each trial. For the Oddman RT, three lights come on at once; one (the Oddman) of these three is more distant from the other two and is the one to be pressed. The next presentation has a different pattern; all possible light patterns, in random sequence, are presented. Presentations and scoring are con- trolled by a microcomputer. False responses were not scored, but such trials were repeated at the end of the series so that each subject had the same number of error-free responses. For each subject and RT test the value reported is the median (Jensen, 1985). For each subject, the difference between the Oddman RT median and the simple RT median, O - S, is calculated because, in this para- digm, this time period appears to be the most highly correlated with IQ scores (Jensen & Reed, 1990).
Visual Pathway NCVs, Two visual evoked potentials (VEP), N70 and PI00 (Chiappa, 1983; Lowitzsch, 1989), following pattern reversal stimulation, were measured on a 2-channel test instrument (TD20, TECA Corp., Pleasantville, New York). Stimuli were black and white checkerboard patterns (consisting of squares 12.5 mm on a side, subtending a visual angle of 43 ° at 1 m), reversing at 2 Hz, presented on a video monitor (with visual angles of 14 ° by 18°). Lumi- nance level was constant within and between trials and was in the usual clinical range (W. Adamson, personal communication, 1987).
Each subject was tested while seated comfortably in a quiet, darkened room, with both eyes open and 1 m distant from the center of the monitor (as measured horizontally). After cleaning the scalp with EEG scalp abrasive, standard EEG- type gold cup electrodes, filled with electrode paste, were applied to four sites: Oz, Fz, Cz, and Fpz (10-20 International System). Impedances at these sites were usually below 4 Kohms. Filters were set for a band pass of 2 to 100 Hz. Channel 1 was Oz (neg.) and Fz (pos.); Channel 2 was Cz (neg.) and Fz (pos.); Fpz was neutral. The difference between Channels 1 and 2, approximately equiv- alent to Oz - Cz, where Oz is over the occipital (visual) cortex and Cz is at the
NERVE CONDUCTION VELOCITY AND INTELLIGENCE 37
vertex of the head (both in the sagittal plane), was used to detect N70 and PI00. The subject was instructed to fixate on a spot in the center of the monitor. Typically 100 to 200 pattern reversals (50-100 s) were given for each of two trials, with a rest period of 2 -3 min between tests. Artifactual potentials, from eyeblinks and other sources, were automatically rejected. The signal-averaged output (Oz - Cz) of each test was displayed on a screen and traced onto a chart in a strip printer. The N70 and P100 peaks, the first defined signals recorded at the visual cortex, were scored for latencies to the nearest millisecond by the first author (T.E.R.), using electronic cursor readings, and without knowledge of the subject's previous test scores. Only well-defined peaks were included; this re- quirement resulted in elimination of some subjects. The average of each subject's two scores for N70 and PI00 was used; for this article both N70 and PI00 mean latencies were required to be known. The N70 and PI00 latencies (in millisec- onds) were converted to corresponding visual pathway NCVs, V:N70 and V:P100, by dividing them into the subject's head length (in millimeters). This gives an approximate velocity, between the retina and the primary visual cortex, in meters per second. (These appear to be the first in vivo estimates for brain NCVs in normal humans.) Because head length should be approximately propor- tional to the length of the visual pathway, the correlations of these approximate visual NCVs with IQ should be a useful estimate of the true visual NCV-IQ correlation ( r~ = rex,, where x and y are variables and c is a constant).
Nerve Conduction Tests. NCVs were determined for the wrist-elbow segment of the median nerve of the arm of the preferred hand (for writing). This is a mixed nerve (motor and sensory) which has conduction velocities similar to upper limb sensory nerves (Oh, 1984). The aforementioned T20 test apparatus was used for both electrical stimulation and display and recording of the re- sponse. The skin over the wrist and elbow regions was lightly abraded with very fine sandpaper and cleaned with the recommended skin cleaner electrode paste. TECA Corp. stimulating/recording electrodes (a cathode and an anode, each 10 mm in diameter, with centers 30 mm apart, and set in a rigid plastic mount) were used, with each cathode distal to its paired anode. Impedances between elec- trodes were usually below 5 Kohms. The electrodes were connected (with 76 cm leads) to a preamplifier which connected with the TD20. TD20 filters were set for a band pass of 20 Hz to 2 kHz, with a 6dB/octave rolloff outside this band. A ground electrode was placed midway between the wrist and elbow sites over cleaned prepared skin. A thermistor probe was taped near this site to provide continuous skin temperature readings. Following the NCV measurements an oral temperature was taken.
After locating the subject's optimal stimulating and recording sites, the stim- ulating voltage was slowly increased to determine the lowest supramaximai stimulation level (the level beyond which the amplitude of the nerve action potential no longer increased in the display oscilloscope). (This level insures that
38 REED AND JENSEN
all of the nerve fibers of the median nerve are being stimulated. This procedure was well tolerated by the subjects; only 2 of 213 subjects found it painful.) Using this level, several (3-10 usually) stimulations, at 1 Hz, pulse duration 0.05 ms, were given. The responses were signal averaged and monitored on the screen. This procedure almost always yielded a very clear action potential with very little noise. Electronic cursors were positioned to measure the latencies (from time of stimulus) to the onset (first deviation from baseline), peak, and end (return to baseline) points of the nerve action potential. These data were printed on the strip recorder of the TD20. This procedure was repeated for a second set of values. The intercathode (center to center) distance on the arm was measured at the end of testing. Dividing this distance (in millimeters) by the mean of the two laten- cies (in milliseconds), for a given point of the action potential) gives the NCV for that point. Thus, three NCVs, onset, peak, and end, were obtained for each subject. Onset NCV and peak NCV are both commonly used in clinical work (Ma & Liveson, 1983; Oh, 1984) and measure the conduction speed in the fast- conducting (large diameter) nerve axons and the average-conducting (average diameter) nerve axons, respectively. Because it is easily measured in the same test session, end NCV was also determined; this is the speed of conduction of the slow-conducting (small diameter) axons.
To correct for the known effects of temperature on NCV (Ma & Liveson, 1983; Oh, 1984), as well as for other possibly important covariates, multiple regression of each of the three NCVs on arm temperature, oral temperature, height, weight, arm span, and age was carried out on the total population. For each NCV the regression coefficients for ann temperature and oral temperature were both significant (at the .01 level and below) and positive. No other coeffi- cients were significant at the .02 level in any of the three regressions. The effects of the two temperatures were removed by regressing each subject to the popula- tion temperature means.
Reliability of NCVs. Fourteen subjects were tested again, several days to several weeks after their first test, to determine the repeatability of the NCV values.
RESULTS
Table 1 gives the means and standard deviations for age, physical measurements, and IQ for the two student groups and the total population. As expected, the only large difference is in the equivalent Otis-Lennon IQ scores. The mean for the community college group is 111.6 while that for the university group is 124.0, differing at the .001 level. (All p values are two-tailed). Both means reflect some "ceiling effect" (Table 1). As expected for these selected populations, both standard deviations are reduced from the normal value of 16, being 9.4 and 8.3, respectively. All other mean differences are small and/or nonsignificant. The community college students appear to be slightly larger in size.

TA
BL
E I
D
csc~
pflo
n ~
Su
~
Arm
R
ight
A
rm
Ora
l IQ
Sco
re b
A
ge*
Hei
ght*
W
eigh
t Sp
an a*
H
ande
d T
empe
ratu
re
Tem
pera
ture
***
Equ
ival
ent*
**
(Yrs
) (c
m)
(kg)
(c
m)
(%)
(*C
) (°
C)
So
urc
e N
M
S
D
M
SD
M
S
D
M
SD
M
M
S
D
M
SD
M
S
D
Com
mun
ity
Col
lege
88
20
.0
1.9
179.
6 6.
5 75
.7
10.3
18
1.3
7.6
83.0
32
.80
.96
36.8
9 .2
4 11
1.6
9.4
Uni
vers
ity
112
20.6
2.
1 17
7.2
8.1
73.3
10
.8
178.
9 8.
9 83
.0
32.5
9 1.
12
36.7
6 .2
8 12
4.0
8.3
Tot
al
200
20.3
2.
0 17
8.3
7.5
74.3
10
.6
180.
0 8.
4 83
.0
32.6
8 !.
06
36.8
1 .2
7 11
8.53
10
.7
Not
e. A
ll s
ubje
cts
wer
e w
hite
mal
e st
uden
ts (
com
mun
ity
coll
ege
or u
nive
rsit
y),
18 t
o 25
yea
rs o
f ag
e, f
rom
the
Eas
tern
San
Fra
ncis
co B
ay a
rea
of
Cal
ifor
nia.
aE
xact
p =
.0
498.
bO
tis-
Len
non
IQ e
quiv
alen
t of
Rav
en's
Pro
gres
sive
Mat
rice
s sc
ore
(.le
nsen
, Sac
cuzz
o, &
Lar
son,
198
8).
Tw
o co
lleg
e st
uden
ts a
nd
nine
uni
vers
ity
stud
ents
had
the
hig
hest
pos
sibl
e R
aven
sco
res,
con
sequ
entl
y, t
hese
sco
res
show
som
e "c
eili
ng e
ffec
t".
*p <
.0
5. *
*p <
.0
1. *
**p
< .0
01 (
sign
ific
ant
two-
tail
ed d
iffe
renc
es b
etw
een
mea
ns o
f th
e tw
o st
uden
t gr
oups
).

40 REED AND JENSEN
Mean values for the three nerve conduction velocities, corrected for arm skin temperature and oral temperature, and peak amplitude of nerve action potential (measured peak to peak; Oh, 1984), corrected for weight, are presented in Table 2. For each velocity the community college students are slightly but significantly (p < .01) faster than the university students. The mean amplitudes do not differ significantly. The onset and peak NCV means ( - SLO of the total population, 67.9 --- .3 and 57.2 --- .2 m/s, respectively, agree reasonably well with values reported in the literature for adults. Oh (1984) reports values of 64.5 +_ .7 and 56.0 --- .5 for this segment of the median nerve using similar stimulation and recording for an older population (40 normal adults 20-60 years of age). The mean amplitude for the total population, 38.0 --- 1.2 Ixvolts, also agrees reasona- bly well with the value of 32.0 -4- 2.6 reported by Oh (1984). Repeat determina- tions of peak velocity (corrected for arm temperature) in 14 subjects gave a mean subject difference (repeat NCV - original NCV) value of .89 -+- .42 (SE) m/s, considerably less than the values reported by Ma and Liveson (1983). The correlation between the subject's repeat and original NCVs was .63 (p = .017).
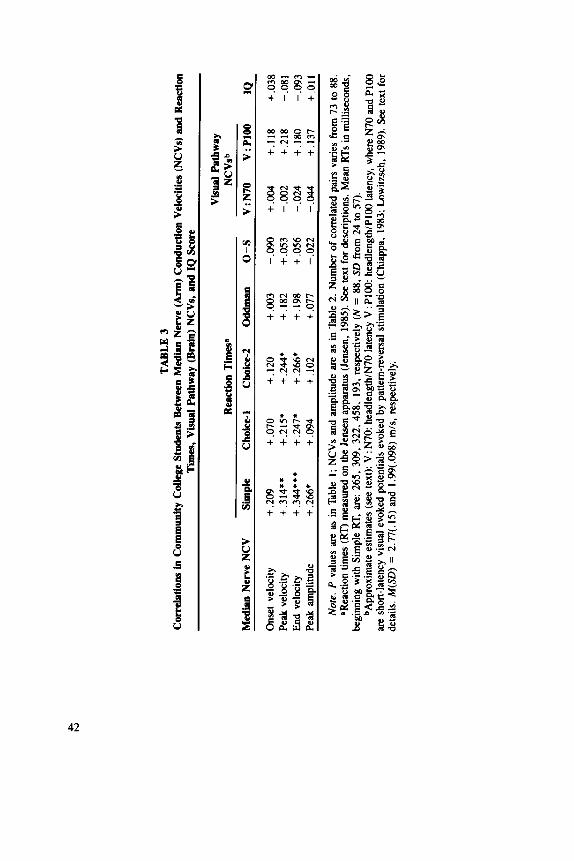
The correlations for community college students between the three velocities and peak amplitude with reaction times, visual pathway NCVs, and IQ score are given in Table 3 (p. 42). Since 32 correlations are reported, single correlations significant at only the .05 level are likely Type 1 errors and are disregarded here. Peak and end NCVs appear to be positively correlated with simple and choice RTs (contrary to expectation) but not with other variables. Peak amplitude does not show a definite correlation with any variable. Most importantly, the visual pathway NCVs and IQ do not show any significant correlations with the NCVs or amplitude; the correlations with IQ are all remarkably low (absolute values less than . 10).
In Table 4 (p. 43) the corresponding correlations for university students are given. In contrast to the community college students, there are no NCV correla- tions but peak amplitude appears to show a consistent, but low, negative correla- tion with all the RTs. Again, there is no correlation between the NCVs or amplitude and visual tract NCVs and IQ.
Since the community college students have a higher mean NCV and a lower mean IQ than do the university students, one could predict that NCV-IQ correla- tions in the combined sample (both groups together) would be negative. This is what was found: The correlations with onset, peak, and end NCVs are - . 14, - . 16, - . 17, respectively, the last two being significant at the .05 level.
DISCUSSION
The close agreement of our mean arm NCVs and peak amplitude with the values reported in the literature (Oh, 1984) for the same nerve segment and technique, and our smaller standard deviations (4.2 vs. 4.3 and 2.8 vs. 3.3, for onset and peak NCVs, respectively), suggests that the NCV technique was satisfactory.

TA
BL
E 2
M
edia
n N
erve
(A
rm)
Con
duct
ion
Vel
ocit
ies
and
Pea
k A
mpl
itud
e
Med
ian
Ner
ve C
ondu
ctio
n V
eloc
itie
s O
nset
**
Pea
k**
End
**
Pea
k A
mpl
itud
e
So
urc
e M
+
- S
E
SD
M
+
- S
E
SD
M
+_
SE
S
D
M
+-
SE
S
D
Com
mun
ity
Col
lege
68
.96
_ .4
6 4.
17
57.8
5 -+
.27
2.
53
50.4
1 +
.23
2.19
35
.64
_+ 1
.56
14.6
U
nive
rsit
y 67
.11
- .4
0 4.
08
56.7
6 -+
- .28
2.
94
49.3
4 _+
.27
2.
82
39.7
7 -+
1.6
6 17
.6
Tot
al
67.9
3 -+
.31
4.
21
57.2
4 -
.20
2.82
49
.81
-+ .
18
2.61
37
.95
_+ 1
.16
16.d
Not
e.
Con
duct
ion
velo
citi
es,
for
the
wri
st-e
lbow
seg
men
t, c
or~
cted
for
arm
tem
pera
ture
and
ora
l te
mpe
ratu
re,
are
in a
m/s
. N
erve
pea
k am
plit
udes
, co
rrec
ted
for
wei
ght,
are
in
Ixvo
lts.
All
sti
mul
atio
ns a
re s
upra
max
imal
; va
lues
are
for
the
mea
n of
tw
o se
ries
of
stim
ulat
ions
. S
tude
nt
num
bers
are
as
in T
able
1,
exce
pt f
or o
nset
vel
ocit
y: 8
2 fr
om C
omm
unit
y C
olle
ge,
103
from
Uni
vers
ity.
P v
alue
s ar
e as
in
Tab
le 1
.
4~
t-
o
TA
BL
E 3
C
orre
lati
ons
in C
omm
unit
y C
olle
ge S
tude
nts
Bet
wee
n M
edia
n N
erve
(A
rm)
Con
duct
ion
Vel
ocit
ies
(NC
Vs)
and
Rea
ctio
n T
imes
, V
isua
l P
athw
ay (
Bra
in)
NC
Vs,
and
IQ
Sco
re
Vis
ual
Pat
hway
R
eact
ion
Tim
es a
NC
Vs b
Med
ian
Ner
ve N
CV
S
impl
e C
hoic
e. 1
C
heic
e-2
Odd
man
O
-S
V:
N70
V
: P
I00
IQ
Ons
et v
eloc
ity
+.2
09
+.0
70
+.!
20
+.0
03
-.0
90
+
.004
+
.118
+
.038
Pe
ak v
eloc
ity
+.3
14"*
+
.215
" +
.244
* +
.182
+
.053
-.
00
2
+.2
18
-.08
1 E
nd v
eloc
ity
+.3
44**
* +
.247
* +
.266
* +
.198
+
.056
-.
02
4
+.1
80
-.0
93
Pe
ak a
mpl
itud
e +
.266
* +
.094
+
. 10
2 +
.077
-.
02
2
-.0
44
+
. 13
7 +
.011
No
te.
P
valu
es a
re a
s in
Tab
le
i; N
CV
s an
d am
plit
ude
are
as i
n T
able
2.
Num
ber
of c
orre
late
d pa
irs
vari
es f
rom
73
to 8
8.
aRea
ctio
n ti
mes
(R
T)
mea
sure
d on
the
Jen
sen
appa
ratu
s (J
ense
n, 1
985)
. Se
e te
xt f
or d
escr
ipti
ons.
Mea
n R
Ts
in m
illi
seco
nds,
be
ginn
ing
wit
h S
impl
e R
T,
are:
265
, 30
9, 3
22,
458,
19
3, r
espe
ctiv
ely
(N =
88
, S
D f
rom
24
to 5
7).
bApp
roxi
mat
e es
tim
ates
(se
e te
xt):
V :
N70
:hea
dlen
gth/
N70
lat
ency
V :
Pi0
0:he
adle
ngth
/PI0
0 la
tenc
y, w
here
N70
and
PI0
0 ar
e sh
ort-
late
ncy
visu
al e
voke
d po
tent
ials
evo
ked
by p
atte
rn-r
ever
sal
stim
ulat
ion
(Chi
appa
, 19
83;
Low
itzs
ch,
1989
). Se
e te
xt f
or
deta
ils.
M(S
D)
=
2.77
(.15
) an
d 1.
99(.
098)
m/s
, re
spec
tive
ly.

TA
BL
E 4
C
orr
elat
ion
s in
Un
iver
sity
Stu
den
ts B
etw
een
Med
ian
Ner
ve (
Arm
) C
on
du
ctio
n V
eloc
itie
s (N
CV
s) a
nd
Rea
ctio
n T
imes
, V
isua
l P
ath
way
NC
Vs,
an
d I
Q S
core
Vis
ual
Pat
hw
ay
Rea
ctio
n T
imes
N
CV
s
Med
ian
Ner
ve
NC
V
Sim
ple
C
hoic
¢-I
Ch
ok
e-2
O
dd
man
O
- S
V :
N70
V
: P
I00
IQ
Ons
et v
eloc
ity
+.
112
--.0
57
- .0
1 !
+ .0
03
-.0
49
-.
22
0
-.2
05
-.
07
4
Peak
vel
ocit
y +
.02
9 -
.093
-
.072
-.
09
5
-. !
14
-. 1
84
-. i
I I
- .0
38
End
vel
ocit
y -.
00
2
-.0
95
-.
08
7
-.0
88
-.
09
1
-.1
43
-.
06
5
-.0
47
Pe
ak
ampl
itud
e -.
21
7"
-.1
89
" -.
21
2"
-.2
10
" -.
11
3
+.0
02
-.
08
9
-.0
26
Not
e. P
val
ues
are
as in
Tab
le 1
; NC
Vs
and
ampl
itud
e at
e as
in T
able
2.
Num
ber o
f co
rrel
ated
pai
rs v
arie
s fr
om 7
7-
! 12
(med
ian
nerv
e N
CV
-IQ
pai
rs,
103-
112)
. R
eact
ion
tim
es a
re a
s in
Tab
le 3
, ex
cept
M =
27
5,3
21
,33
4,
463,
and
188
ms,
res
pect
ivel
y (N
=
112,
SD
32-
69).
Vis
ual
path
way
NC
Vs
are
as i
n T
able
3,
exce
pt M
(SD
) =
2.
77(.
15)
and
2.0
1(.0
88),
res
pect
ivel
y.
4~
44 REED AND JENSEN
The mean peak amplitude of 38 o.V, with a SD of 16 p.V, shows that almost all signals are well above the amplifier noise level of about 5 IxV (Ma & Liveson, 1983), even before signal averaging further reduces this level.
The main result of this study is the lack of correlation, within the two groups, between any arm NCV and the IQ score. The small negative correlation found in the total sample appears to be a simple consequence of population stratification (college students have a higher mean NCV and a lower mean IQ than university students). Therefore, the prediction of a positive correlation between peripheral NCV and intelligence (Reed, 1984) was not confirmed. This lack of correlation is further supported by two other nonsignificant NCV correlations (within groups): (a) visual pathway NCVs which, being within the brain, are expected to correlate positively with intelligence if brain NCV is a component of the rate of information processing; an earlier report from this project found such a visual NCV-IQ correlation (r = .26, p = .0017; Reed & Jensen, 1989, 1991); and (b) Oddman RT and (Oddman - Simple) RT, both of which have been shown to correlate negatively with intelligence (Jensen & Reed, 1990). The relatively low variation among subjects in ann NCV (coefficient of variation for peak NCV, SD/M, is .045) might prevent detection of very small correlations with IQ, but this variation for visual NCV (V:P100) is even smaller (.044) and this was adequate to detect an IQ correlation (r = .26, p = .0017).
Our arm NCV correlation results contrast sharply with those of Vernon and Mori (1989). Testing 85 Canadian university students (summer students, age range 18 to 42 years [M = 24.5], with a mean WAIS equivalent IQ of 107) for peak NCV in three different segments of the median nerve, with supramaximai stimulation, they found an overall NCV-IQ correlation of .42 (p < .01). This correlation was between the first principal component for the three NCVs and the corresponding component for the 10 mental subtests (called "IQ"). Although their subjects differ in mean age and IQ from ours, the NCV techniques were generally similar and it is not obvious why the results differ. There were several technical differences between studies in NCV testing: We measured one median nerve segment (wrist-elbow), controlled both arm temperature and oral tem- perature statistically, and stimulated with 0.05 ms pulses, whereas Vernon and Moil measured wrist-finger, wrist-elbow, wrist-axilla segments and physically controlled the arm temperature within a rather wide range (32-35°C). Their pulses were 0.2 ms, their "average" NCV was a weighted mean of the 3 NCVs, and their wrist-finger NCV was apparently (exact values not given) well above the reported values for this segment (Ma & Liveson, 1983; Oh, 1984). These differences in technique, however, should not produce the large difference in correlation (.42 vs. "not different from zero"). Our IQ score, while not ideal (we had a "ceiling effect"; 11 subjects had the highest possible Raven scores), was adequate, even with our restricted IQ range, to show the expected negative correlation with Oddman RT values (Jensen & Reed, 1990) and it had a very

NERVE CONDUCTION VELOCITY AND INTELLIGENCE 45
significant positive correlation with visual pathway NCVs. These study dif- ferences are puzzling.
The other reported NCV-IQ correlation (Barrett et al., 1990) tested 44 British adults, 18 to 41 years of age; an unspecified number were from an employment agency. They were given Raven's Advanced Progressive Matrices in a 20-minute period, the 30 males having a mean score of 13.2 while the 14 females had a mean of 15.6. The subjects were tested for four peak NCVs of the sensory median nerve of the hand-wrist region (both hands) using submaximal stimula- tion. No significant correlation between NCVs and the Raven's score were found. This negative finding agrees with our findings but its interpretation is open to some question. Barrett et al. did not use the supramaximal stimulation customary for NCV studies (Ma & Liveson, 1983; Oh, 1984); their stimulation was only l or 2 mA above threshold. Without supramaximal stimulation, an unknown and probably varying proportion of nerve axons of the nerve (each axon conducting at a different speed) is excited at each stimulation, and then only in the large diameter axons (Kandel & Schwartz, 1985), giving an atypical NCV. Further, their sample size is relatively small so that their negative finding has little statistical power.
The small but consistent difference between our two subject groups in mean NCVs, in favor of the community college students, was unexpected. This might be due to the slightly larger body size of these students (although not detectable in the regression analysis), because larger size should be associated with larger nerve axons which will conduct more rapidly (Reed, 1988). A more interesting possibility is suggested by extensive NCV studies in mice (Reed, 1988) which showed that the number of cage mates after weaning correlates positively and very significantly (p < .0001) with NCV. An obvious consequence of increased crowding is increased social and physical stimulation. On the average, communi- ty college students are probably more physically active than are university stu- dents (some were sports majors, whereas none of the latter were) and this greater stimulation may lead to increased NCV. Further support for this possibility comes from the finding that the NCV in the median nerve of th~ arm of the dominant (more active) hand appears to be slightly faster than the NCV in the other arm (Ma & Liveson, 1983).
The quite different patterns of NCV-amplitude correlations with reaction times in our two groups have no obvious explanation. Within each group there is some consistency, for example, positive NCV-RT correlations in community college students, negative peak amplitude-RT correlations in university stu- dents. One could speculate that group differences in level of physical activity again might be a factor, but we have no evidence for this.
In conclusion, with a sample size of 200, this study failed to confirm the predicted positive correlation between peripheral nerve conduction velocity and a standard measure of nonverbal intelligence. This NCV also failed to correlate

46 REED AND JENSEN
with a brain NCV or with certain reaction times, each of which shows correlation with intelligence. If these findings are correct, there appears to be a basic dif- ference between peripheral NCV and visual pathway (the latter being in the brain but not in the cerebral cortex) NCV. Only the visual NCV appears to reflect the NCV of the cerebral cortex which is important in information processing. Re- solving these issues will be important for understanding the neurophysiological basis for human information processing and intelligence (Reed, 1984, 1988).
REFERENCES
Barrett, P.T., Danm, 1., & Eysenck, HJ. (1990). Sensory nerve conductance and intelligence: A methodological study. Journal of Psychophysiology, 4, l-13.
Chiappa, K.H. (1983). Evoked potentials in clinical medicine. New York: Raven. Creel, D., & Buehler, B.A. (1982). Pattern evoked potentials in phenylketonuria. Electroen-
cephalography and Clinical Neurophyslology, 53, 220-223. Gasser, T., Pietz, J., Schellberg, D., & K6hler, W. (1988). Visual evoked potentials of mildly
mentally retarded and control children. Developmental Medicine and Child Neurology, 30, 638-645.
Hegmann, J.P. (1972). Physiological function and behavioral genetics: I. Genetic variance for pe- ripheral conduction velocity in mice. Behavior Genetics, 2, 55-67.
Hegmann, LP. (1975). The response to selection for altered conduction velocity in mice. Behavioral Biology, 13, 413-423.
Hegnumn, J.P. (1979). A gene-imposed nervous system difference influencing behavioral covar- iance. Behavior Genetics, 9, 165-175.
Hegmann, J.P., White, J.E., & Kater, S.B. (1973). Physiological function and behavioral genetics: II. Quantitative genetic analysis of conduction velocity of caudal nerves of the mouse, Mus musculus. Behavior Genetics, 3, 121-131.
Jensen, A.R. (1985). Methodological and statistical techniques for the chronometric study of mental abilities. In C.R. Reynolds and V.L. Willson (Eds.), Methodological and statistical advances in the study of individual differences. New York: Plenum.
Jensen, A.R., Saccuzzo, D.P., & Laraon, G.E. (1988). Equating the standard and advanced forms of the Raven Progressive Matrices. Educational and Psychological Measurement, 48, 1091- 1095.
Jensen, A.R., & Reed, T.E. (1990). Simple reaction time as a suppressor variable in the chro- non~tric study of intelligence. Intelligence, 14, 375-388.
Kandel, E.R., & Schwartz, J.H. (1985). Principles of neural science (2nd ed.). New York: Elsevier. Korinthenberg, R., Ullrich, K., & FUllenkemper, F. (1988). Evoked potentials and electroen-
cephalography in adolescents with phenylketonuria. Neuropediatrics, 19, 175-178. Landi, A., Ducati, R., Villani, R.o Longhi, R., Riva, E., Rodocanachi, C., & Giovannini, M.
(1987). Pattern-reversal visual evoked potentials in phenylketonuric children. Child's Nervous System, 3, 278-281.
Lowitzsch, K. (1989). Visual evoked potentials. In K. Mau~r, K. Lowitzsch, and M. St6hr (Eds.), Evoked potentials. Toronto: B.C. Decker.
Ma, D.M., & Liveson, J.A. (1983). Nerve conduction handbook. Philadelphia: F.A. Davis. Oh, S.J. (1984). Clinical electromyography: Nerve conduction studies. Baltimore: University Park
Press. Olivier, G. (1969). Practical anthropology. St. Louis: C.C. Thomas. Pollock, V.E., Schneider, L.S., Chui, H.C., Henderson, V., Zemansky, M., & Sloane, R.B. (1989).
NERVE CONDUCTION VELOCITY AND INTELLIGENCE 47
Visual evoked potentials in dementia: A meta-analysis and empirical study of Alzheimer's disease patients. Biological Psychiatry, 25, 1003-1013.
Raven, J.C. (1983a). Manual for the Advanced Raven Progressive Matrices. London: H.K. Lewis. Raven, J.C. (1983b).Manual for the Standard Progressive Matrices. London: H.K. Lewis. Reed, T.E. (1983). Nerve conduction velocity in mice: A new method with results and analysis of
variation. Behavior Genetics, 13, 257-265. Reed, T.E. (1984). Mechanism for the heritability of intelligence. Nature, 311,417. Reed, T.E. (1988). Narrow-sense heritability estimates for nerve conduction velocity and residual
latency in mice. Behavior Genetics 18, 595-603. Reed, T.E., & Jensen, A.R. (1989). Short latency visual evoked potentials, visual tract speed, and
intelligence: Significant correlations [Abstract]. Behavior Genetics, 19, 772-773. Reed, T.E., & Jensen, A.R. (1991). Conduction velocity in a brain nerve pathway of normal adults
correlates with intelligence level. Manuscript submitted for publication. Vernon, P.A. (1987). Speed of information processing and intelligence. Norwood, NJ: Ablex. Vernon, P.A., & Moil, M. (1989). Intelligence, reaction times, and nerve conduction velocity
[Abstract]. Behavior Genetics, 19, 779. White, J.E., & Hegmann, LP. (1974). Development of nervous system function in mice: Normative
data and gene effects. Behavioral Biology, 11, 83-88.


