ARM Holdings - FYQ4 2011.PDF
23
1 of 23 ARM HOLDINGS PLC REPORTS RESULTS FOR THE FOURTH QUARTER AND FULL YEAR 2011 A presentation of the results will be webcast today at 09:30 GMT at www.arm.com/ir CAMBRIDGE, UK, 31 January 2012— ARM Holdings plc announces its unaudited financial results for the fourth quarter and full year ended 31 December 2011. Q4 2011 – Financial Summary Normalised* IFRS Q4 2011 Q4 2010 % Change Q4 2011 Q4 2010 Revenue ($m) 217.0 179.6 21% 217.0 179.6 Revenue (£m) 137.8 113.9 21% 137.8 113.9 Operating margin 48.2% 41.1% 34.2% 30.1% Profit before tax (£m) 69.0 47.6 45% 49.7 34.9 Earnings per share (pence) 3.71 2.90 28% 2.40 2.19 Net cash generation** 51.5 40.7 Effective revenue fx rate ($/£) 1.58 1.58 FY 2011 – Financial Summary Normalised* IFRS FY 2011 FY 2010 % Change FY 2011 FY 2010 Revenue ($m) 785.0 631.3 24% 785.0 631.3 Revenue (£m) 491.8 406.6 21% 491.8 406.6 Operating margin 45.1% 40.4% 30.3% 26.3% Profit before tax (£m) 229.7 167.4 37% 156.9 110.0 Earnings per share (pence) 12.45 9.34 33% 8.19 6.36 Net cash generation** 203.8 179.9 Effective revenue fx rate ($/£) 1.60 1.55 Progress on key growth drivers in Q4 • Growth in adoption of ARM ® processor technology o 25 processor licenses signed, including the first lead licenses for processors based on the new ARMv8-A architecture o 9 Cortex™-A and 8 Cortex-M family processor licenses signed o Many of the advanced processor licenses signed with companies developing smarter consumer electronics technology such as digital TVs, mobile computers and smartphones • Growth in shipments of chips based on ARM-processor technology o 1.2 billion chips shipped into mobile phones and mobile computers, up 10% year-on-year o 1.0 billion chips shipped into consumer and embedded digital devices, up 40% year-on-year • Growth in outsourcing of new technology o Physical IP: 20nm royalty-bearing platform signed with major foundry and 3 Processor Optimisation Pack (POP) licenses signed for Cortex-A series processors o Mali™ Graphics: 5 Mali licenses signed for digital TV, mobile computing and smartphones Warren East, Chief Executive Officer, said: “In Q4 and throughout 2011 ARM has seen strong licensing growth, driven by market-leading semiconductor companies increasing their commitment to ARM technology, and more new customers choosing ARM technology for the first time. We have also seen our royalty revenue continue to grow faster than industry revenues as the ARM Partnership gains share in our target markets. 2012 will bring exciting opportunities and challenges as ARM enters competitive new markets where we are well positioned to succeed with leading technology, an innovative business model and a thriving ecosystem of Partners. As our customers are designing more ARM technology into their widening product portfolios, ARM is investing in the development of new products. These products will drive further long-term growth in our revenues, profits and cash.” Outlook ARM enters 2012 with a robust opportunity pipeline for licensing and a record order backlog, helped by new product introductions and new markets. In addition, market share gains in long-term growth sectors look set to continue as our Partners introduce new chips based on ARM technology. Given industry analysts are forecasting that semiconductor revenues declined about 10% sequentially in Q4 and given ARM’s very strong license revenues in Q4, we expect group dollar revenues for the first quarter to be in-line with current market expectations of around $200 million. For full-year 2012, the global macro-economic situation remains uncertain and is likely to influence consumer and enterprise spending, thereby potentially impacting semiconductor revenues and industry confidence. Assuming the macroeconomic situation does not deteriorate significantly, we expect group dollar revenues for the full-year to be at least in line with current market expectations of just over $860 million.
-
Upload
hristo-vasilev -
Category
Documents
-
view
239 -
download
1
description
ARm earning report FYQ2014
Transcript of ARM Holdings - FYQ4 2011.PDF

1 of 23
ARM HOLDINGS PLC REPORTS RESULTS FOR THE FOURTH QUARTER AND FULL YEAR 2011 A presentation of the results will be webcast today at 09:30 GMT at www.arm.com/ir CAMBRIDGE, UK, 31 January 2012— ARM Holdings plc announces its unaudited financial results for the fourth quarter and full year ended 31 December 2011.
Q4 2011 – Financial Summary
Normalised* IFRS Q4 2011 Q4 2010 % Change Q4 2011 Q4 2010
Revenue ($m) 217.0 179.6 21% 217.0 179.6 Revenue (£m) 137.8 113.9 21% 137.8 113.9 Operating margin 48.2% 41.1% 34.2% 30.1% Profit before tax (£m) 69.0 47.6 45% 49.7 34.9 Earnings per share (pence) 3.71 2.90 28% 2.40 2.19 Net cash generation** 51.5 40.7 Effective revenue fx rate ($/£) 1.58 1.58 FY 2011 – Financial Summary Normalised* IFRS
FY 2011 FY 2010 % Change FY 2011 FY 2010 Revenue ($m) 785.0 631.3 24% 785.0 631.3 Revenue (£m) 491.8 406.6 21% 491.8 406.6 Operating margin 45.1% 40.4% 30.3% 26.3% Profit before tax (£m) 229.7 167.4 37% 156.9 110.0 Earnings per share (pence) 12.45 9.34 33% 8.19 6.36 Net cash generation** 203.8 179.9 Effective revenue fx rate ($/£) 1.60 1.55
Progress on key growth drivers in Q4 • Growth in adoption of ARM® processor technology
o 25 processor licenses signed, including the first lead licenses for processors based on the new ARMv8-A architecture
o 9 Cortex™-A and 8 Cortex-M family processor licenses signed o Many of the advanced processor licenses signed with companies developing smarter consumer electronics
technology such as digital TVs, mobile computers and smartphones • Growth in shipments of chips based on ARM-processor technology
o 1.2 billion chips shipped into mobile phones and mobile computers, up 10% year-on-year o 1.0 billion chips shipped into consumer and embedded digital devices, up 40% year-on-year
• Growth in outsourcing of new technology o Physical IP: 20nm royalty-bearing platform signed with major foundry and 3 Processor Optimisation Pack (POP)
licenses signed for Cortex-A series processors o Mali™ Graphics: 5 Mali licenses signed for digital TV, mobile computing and smartphones
Warren East, Chief Executive Officer, said: “In Q4 and throughout 2011 ARM has seen strong licensing growth, driven by market-leading semiconductor companies increasing their commitment to ARM technology, and more new customers choosing ARM technology for the first time. We have also seen our royalty revenue continue to grow faster than industry revenues as the ARM Partnership gains share in our target markets. 2012 will bring exciting opportunities and challenges as ARM enters competitive new markets where we are well positioned to succeed with leading technology, an innovative business model and a thriving ecosystem of Partners. As our customers are designing more ARM technology into their widening product portfolios, ARM is investing in the development of new products. These products will drive further long-term growth in our revenues, profits and cash.” Outlook ARM enters 2012 with a robust opportunity pipeline for licensing and a record order backlog, helped by new product introductions and new markets. In addition, market share gains in long-term growth sectors look set to continue as our Partners introduce new chips based on ARM technology. Given industry analysts are forecasting that semiconductor revenues declined about 10% sequentially in Q4 and given ARM’s very strong license revenues in Q4, we expect group dollar revenues for the first quarter to be in-line with current market expectations of around $200 million. For full-year 2012, the global macro-economic situation remains uncertain and is likely to influence consumer and enterprise spending, thereby potentially impacting semiconductor revenues and industry confidence. Assuming the macroeconomic situation does not deteriorate significantly, we expect group dollar revenues for the full-year to be at least in line with current market expectations of just over $860 million.

2 of 23
Q4 2011 – Revenue Analysis Revenue ($m)*** Revenue (£m) Q4 2011 Q4 2010 % Change Q4 2011 Q4 2010 % Change PD
Licensing 67.5 53.8 25% 43.0 34.0 27% Royalties 100.4 81.9 23% 63.6 52.0 22%
Total PD 167.9 135.7 24% 106.6 86.0 24% PIPD
Licensing 11.4 11.6 -2% 7.2 7.4 -3% Royalties1 14.3 12.0 19% 9.1 7.6 19%
Total PIPD 25.7 23.6 9% 16.3 15.0 8% Development Systems 12.7 11.6 9% 8.1 7.4 10% Services 10.7 8.7 24% 6.8 5.5 22%
Total Revenue 217.0 179.6 21% 137.8 113.9 21% 1 Includes catch-up PIPD royalties of $2.2m (£1.4m) in Q4 2011 and $0.4m (£0.2m) in Q4 2010.
FY 2011 – Revenue Analysis Revenue ($m)*** Revenue (£m) FY 2011 FY 2010 % Change FY 2011 FY 2010 % Change PD
Licensing 236.5 166.9 42% 149.3 105.9 41% Royalties 356.9 291.5 22% 222.2 189.4 17%
Total PD 593.4 458.4 29% 371.5 295.3 26% PIPD
Licensing 49.2 41.3 19% 31.2 26.6 17% Royalties1 48.7 43.8 11% 30.2 28.3 7%
Total PIPD 97.9 85.1 15% 61.4 54.9 12% Development Systems 52.4 55.4 -5% 32.9 36.0 -9% Services 41.3 32.4 27% 26.0 20.4 27% Total Revenue 785.0 631.3 24% 491.8 406.6 21%
1 Includes catch-up PIPD royalties $4.5m (£2.8m) in FY 2011 and $1.8m (£1.1m) in FY 2010. * Normalised figures are based on IFRS, adjusted for acquisition-related charges, share-based payment costs, restructuring charges, profit or loss on
disposal and impairment of available-for-sale investments and Linaro™-related charges. For reconciliation of IFRS measures to normalised non-IFRS measures detailed in this document, see notes 8.1 to 8.16.
** Net cash generation is defined as movement on cash, cash equivalents, short-term and long-term deposits, adding back dividend payments, investment and acquisition consideration, restructuring payments, other acquisition-related payments, share-based payroll taxes and Linaro-related charges, and deducting inflows from share option exercises– see notes 8.8 to 8.12.
*** Dollar revenues are based on the Group’s actual dollar invoicing, where applicable, and using the rate of exchange applicable on the date of the transaction for invoicing in currencies other than dollars. Approximately 95% of invoicing is in dollars.
CONTACTS: Sarah West/Daniel Thole Tim Score/Ian Thornton Brunswick ARM Holdings plc +44 (0)207 404 5959 +44 (0)1223 400796

3 of 23
Financial review (IFRS unless otherwise stated) Total revenues Total revenues in Q4 2011 were $217.0 million, up 21% on Q4 2010. Q4 sterling revenues were £137.8 million, up 21% year-on-year. Full-year total revenues were $785.0 million, up 24% on 2010. License revenues Total dollar license revenues in Q4 2011 increased by 21% year-on-year to $78.9m, representing 36% of group revenues. License revenues comprised $67.5 million from PD and $11.4 million from PIPD. During Q4, additional partners entered into long-term commitments to use ARM technology where the revenue associated with these agreements goes into backlog and will be recognised in future quarters as engineering and delivery milestones are achieved. These agreements included the signing of a subscription license by LSI Corporation for access to a broad range of processors, and three lead licenses for processors based on our recently announced ARMv8-A technology. As a result, group backlog at the end of the quarter was up more than 20% sequentially, and up about 35% year-on-year, to a record high. Full-year dollar license revenues were $285.7 million, up 37% on 2010. Royalty revenues Royalties are recognised one quarter in arrears with royalties reported in Q4 generated from semiconductor unit shipments in Q3. Total dollar royalty revenues in Q4 2011 increased 22% to $114.7 million, representing 53% of group revenues. Royalty revenues comprised $100.4 million for PD and $14.3 million for PIPD. PIPD royalties of $14.3 million include $2.2 million of “catch-up” royalties. Underlying royalties for PIPD were up 4% year-on-year to a record high. Full-year dollar royalty revenues were $405.6 million, up 21% on 2010. This compares with industry revenues1
increasing by about 8% in the relevant shipment period (i.e. Q3 2010 to Q3 2011), demonstrating ARM’s continuing market share gains over the last 12 months. Royalty revenues now represent 52% of ARM total revenues, having grown from less than 40% in 2005. It is expected that royalty revenues will become a greater proportion of Group revenues in the future.
Development Systems and Service revenues Sales of development systems were $12.7 million in Q4 2011, up 9% on Q4 2010 and representing 6% of group revenues. Service revenues were $10.7 million in Q4 2011, up 24% and representing 5% of group revenues. Full-year development systems revenues were $52.4 million, down 5% year-on-year. Full-year service revenues were $41.3 million, up 27% on 2010. The decline in development systems revenues is largely due to the growth of Linux-based operating systems, which are supported by free software development tools. ARM is now refocusing this business on microcontroller tools and premium toolkits for multi-core systems. Due to this transition process, we expect that revenues for development systems in 2012 will be broadly flat year-on-year.
1 Source: Semiconductor Industry Association., January 2012. Semiconductor revenues, excluding memory and analog.

4 of 23
Gross margins Gross margin in Q4 2011, excluding share-based payment costs of £1.0 million (see below), was 96.0%, compared to 94.9% in Q4 2010. Full-year gross margin, excluding share-based payment costs of £3.5 million, was 95.1% compared to 94.3% in 2010. The higher gross margin in 2011 compared to 2010 is due primarily to the higher proportion of royalty and licensing revenue compared to development systems and services revenues. Operating expenses and operating margin Normalised Q4 and full-year income statements for 2011 and 2010 are included in notes 8.13 to 8.16 below which reconcile IFRS to the normalised non-IFRS measures referred to in this earnings release. Normalised operating expenses (excluding acquisition-related, share-based payments, and disposal and impairment of investments) in Q4 2011 were £65.8 million compared to £60.5 million in Q3 2011 and £61.2 million in Q4 2010. The increase in operating expenses in the fourth quarter is due primarily to the impact of investing in our research and development teams through 2011 and the net increase arising from higher incentive payments in Q4 offset by a net credit arising on the accounting for derivative instruments. There was also a net credit on the accounting for derivative instruments in Q3 2011. Normalised operating expenses in Q1 2012 (assuming effective exchange rates similar to current levels) are expected to be £64-66 million. Normalised operating margin in Q4 2011 was 48.2%. Normalised operating margin in Q3 2011 and Q4 2010 was 44.6% and 41.1% respectively. Normalised operating margin in the full-year 2011 was 45.1% compared to 40.4% in 2010. Normalised research and development expenses were £31.4 million in Q4 2011, representing 23% of revenues, compared to £29.8 million in Q3 2011 and £29.6 million in Q4 2010. Normalised sales and marketing costs were £17.3 million in Q4 2011, representing 13% of revenues, compared to £15.6 million in Q3 2011 and £15.9 million in Q4 2010. Normalised general and administrative expenses were £17.1 million in Q4 2011, representing 12% of revenues, compared to £15.1 million in Q3 2011 and £15.7 million in Q4 2010. Total IFRS operating expenses in Q4 2011 were £84.1 million (Q4 2010: £73.1 million) including £13.2 million (Q4 2010: £9.9 million) in relation to share-based payments and related payroll taxes, and £5.2 million (Q4 2010: £2.0 million) in relation to amortisation of intangible assets, other acquisition-related charges, disposal and impairment of investments and restructuring charges. Total share-based payments and related payroll tax charges of £14.2 million in Q4 2011 were included within cost of revenues (£1.0 million), research and development (£8.5 million), sales and marketing (£2.7 million) and general and administrative (£2.0 million). Total IFRS operating expenses for full-year 2011 were £315.2 million (2010: £273.6 million), including share-based payments and related payroll taxes of £54.2 million (2010: £39.1 million), amortisation of intangible assets, other acquisition charges, disposal and impairment of investments and restructuring charges of £8.2 million (2010: £11.0 million), and Linaro™-related charges of £6.9 million (2010: £4.5 million). Excluding these charges, operating expenses for the full year were £245.9 million, compared to £219.0 million in 2010. Earnings and taxation Profit before tax was £49.7 million in Q4 2011 compared to £34.9 million in Q4 2010. After adjusting for acquisition-related, share-based payments, and disposal and impairment of investments, normalised profit before tax was £69.0 million in Q4 2011 compared to £47.6 million in Q4 2010. The Group’s effective normalised tax rate in Q4 2011 was 26% (IFRS: 33%) giving a full year normalised tax rate of 25% (IFRS: 28%). In Q4 2011, fully diluted earnings per share prepared under IFRS were 2.40 pence (11.19 cents per ADS2
) compared to earnings per share of 2.19 pence (10.28 cents per ADS) in Q4 2010. Normalised fully diluted earnings per share in Q4 2011 were 3.71 pence per share (17.28 cents per ADS) compared to 2.90 pence per share (13.61 cents per ADS) in Q4 2010.
Full-year 2011 fully diluted earnings per share prepared under IFRS were 8.19 pence compared to earnings per share of 6.36 pence in 2010. Normalised fully diluted earnings per share for 2011 were 12.45 pence per share compared to 9.34 pence per share in 2010.
2 Each American Depositary Share (ADS) represents three shares.

5 of 23
Balance sheet Intangible assets at 31 December 2011 were £554.9 million, comprising goodwill of £542.5 million and other intangible assets of £12.4 million, compared to £532.3 million and £12.1 million respectively at 31 December 2010. The regular review of the carrying value of assets arising on acquisition was performed during Q4 2011 and it was concluded that no impairment was required. Total accounts receivable were £119.6 million at 31 December 2011, comprising £114.7 million of trade receivables and £4.9 million of amounts recoverable on contracts, compared to £105.7 million at 31 December 2010, comprising £97.0 million of trade receivables and £8.7 million of amounts recoverable on contracts. Days sales outstanding (DSOs) were 46 at 31 December 2011 compared to 40 at 30 September 2011 and 41 at 31 December 2010. Cash flow and dividend Total cash (see note 8.6) at 31 December 2011 was £424.0 million compared to £397.2 million at 30 September 2011 and £290.1 million at 31 December 2010. Normalised cash generation in Q4 2011 was £51.5 million. The directors recommend payment of a final dividend in respect of 2011 of 2.09 pence per share, up 20%, which taken together with the interim dividend of 1.39 pence per share paid in October 2011, gives a total dividend in respect of 2011 of 3.48 pence per share, an increase of 20% on the total dividend of 2.90 pence per share in 2010. Subject to shareholder approval, the final dividend will be paid on 18 May 2012 to shareholders on the register on 4 May 2012. Operating review Processor licensing Twenty-five processor licenses were signed in Q4 across a broad range of end markets for use in the simplest of microcontrollers to the most advanced mobile computers. These included: wireless connectivity for Bluetooth and NFC; applications processors for smarter consumer electronic devices such as digital TVs, mobile computers and smartphones; and deeply embedded digital electronics for microcontrollers and smartcards. One of the licenses was a subscription license signed with LSI Corporation giving them access to a broad range of ARM technology. This agreement expands LSI’s long-term strategic relationship with ARM and will enable LSI to develop new networking and cloud computing solutions. All of the licenses signed in Q4 were for ARM’s advanced Cortex and Mali graphics processors. ARM signed licenses for nine Cortex-A family processors, including two agreements with lead Partners for ARM’s next generation of processors based on the ARMv8-A architecture which includes support for 64-bit. There were another eight Cortex-M family licenses taking the total signed to date to 131. ARM signed five licenses for Mali graphics processors for use in digital TV, mobile computing and smartphones, including one for the latest Mali-T658. Two semiconductor companies bought their first Mali licenses, bringing the number of companies using Mali graphics technology to forty-five. Q4 2011 and Cumulative Processor Licensing Analysis Existing
Licensees New
Licensees Quarter Total
Cumulative Total
ARM7™ 171 ARM9™ 270 ARM11™ 79 Cortex-A* 8 1 9 95 Cortex-R 1 1 2 24 Cortex-M 7 1 8 131 Mali 5** 5 58 Other 1 1 21 Total 22 3 25 849 * Includes two lead Partners for the ARMv8-A architecture ** Includes two existing ARM customers each taking their first Mali license

6 of 23
Processor Design Wins and Ecosystem Development Over the last few months many leading technology companies have announced details of their ARM-based product developments. These included: • NVIDIA, Qualcomm and TI demonstrating the latest prototypes of tablets and laptops running Microsoft’s Windows 8
operating systems. • Marvell’s ARM-based chips being designed into the next generation of Google TVs. • Several ARM partners announcing new elements to their microcontroller (MCU) strategies taking the number of ARM
based microcontroller devices to over 1000: o Infineon introduced their first ARM based microcontroller with the XMC family based around Cortex-M4; o Fujitsu added another 54 ARM processor-based microcontrollers to their FM3 family, focusing mainly on
high-performance applications; o NXP announced the LPC4300 as “the fastest ARM Cortex-M4 microcontroller available today” and the
LPC11 microcontroller which integrates USB class drivers alongside a Cortex-M0 processor; o ST announced the STM32 F4 microcontroller family as “the world’s highest performing ARM Cortex-M
microcontroller”. • TI announcing a new series of ARM9 processor-based systems for developing both Smart Grid and smart meter
solutions. • Samsung and LG both announcing new smart TV families based on ARM processors and Mali graphics processors. • SiXiTS announced the release of Eon Sky on Android which is a tangible demonstration of how Mali GPUs can
deliver high-end, console-quality graphics and game-play and is based on the Unity3D game engine. Many more partner announcements can be found on the ARM website at www.arm.com/news. Processor royalties Royalties are recognised one quarter in arrears with royalties reported in Q4 generated from semiconductor unit shipments in Q3. Q4 revenue came from the sales of about 2.2 billion ARM technology-based chips, the highest-ever number of ARM-processor based shipments. ARM gained share in non-mobile end-markets throughout 2011. Shipments of ARM-processor based microcontrollers and smartcards grew about 80% year-on-year, compared to 5% for the overall microcontroller market3
. The embedded market now represents 25% of all ARM-based processor unit shipments, up from 19% in Q4 2010.
The Cortex processor family represents 23% of all units shipped, up from 13% one year ago. This increase is primarily due to shipments of Cortex-M family processor-based microcontrollers and smartcards, and an increase in Cortex-A family processor shipments driven by high-end smartphones and mobile computers adopting smarter applications processors. The average royalty per chip in Q4 2011 was slightly up at 4.5 cents as the strong growth in high-volume low-cost chips, such as microcontrollers, smartcards and wireless connectivity chips was balanced against the growth in Cortex-A processor-based chips, which typically command higher average royalty percentages and are normally associated with higher value chips. The growth in mobile computing and high-end smartphones continues to benefit ARM, with shipments of Cortex-A processor-based wireless and mobile computing chips more than doubling compared to the same quarter last year. For the quarter, ARM achieved an average of 2.5 ARM technology-based chips per mobile handset, up from 2.4 chips per device in Q3 2011. In Q4 2011, ARM’s partners reported a 75% increase in integrated WiFi and Bluetooth chip shipments compared with the same quarter last year. Chips that integrate multiple functions into a single chip often contain several ARM processors. Typically, ARM receives a higher percentage of the chip price when there is more ARM technology integrated into the chip. The benefit arising from the combination of more integrated chips and more Cortex-A family based chips can be seen as, although the number of ARM processor-based chips in mobile devices grew by 10% in Q4 2011 compared with Q4 2010, the value from these chips grew 20%. Q4 2011 Processor Unit Shipment Analysis Processor Family Unit Shipments Market Unit Shipments ARM7 44% Mobile 55% ARM9 24% Enterprise 16% ARM11 9% Home 4% Cortex-A 6% Embedded 25% Cortex-R 2% Cortex-M 15%
3 Source: Semiconductor Industry Association, January 2012

7 of 23
PIPD licensing In Q4, ARM signed a physical IP license with a leading foundry customer for a new 20nm royalty-bearing platform. This platform will target a wide range of applications including high-end smartphones, mobile computers and the next generation of smart digital TVs. This is the third leading-edge foundry customer to take a 22/20nm platform license and shows the increasing importance of ARM’s physical IP in building the next generation of high performance chips. Cumulatively, 91 physical IP platform licenses have now been signed and it is this base of platform licenses that drives ARM’s future royalty potential. ARM’s physical IP is used by fabless semiconductor companies to implement their chip designs. During the quarter, ARM continued to see strong demand from these companies to use physical IP at advanced nodes, with a further semiconductor partner choosing to use ARM’s advanced physical IP at 28nm. As our partners transition from older process technology to more advanced nodes so this progression helps to drive ARM’s future royalty revenue. ARM is also seeing increasing demand for our processor optimisation packs (POPs), which comprise physical IP optimised for use with our advanced Cortex-A family processors. POPs enable the licensee to reproduce a high-performance, low-power processor implementation using pre-built components. During the quarter we signed three licenses for Cortex-A9 and Cortex-A15 POPs at 28nm, 32nm and 40nm nodes, for use in high-end application processors in digital TVs, game consoles and mobile computing. Q4 2011 and Cumulative PIPD Licensing Analysis Process Node Total (nm) New Royalty-Bearing Foundry Platform License
20
1
Total for
Quarter Cumulative
Total Processor Optimisation Packs
3 26
Following a review of the physical IP platform licenses we are restating the number of royalty-bearing physical IP platforms. These changes align the reporting of physical IP platforms with processor licenses. The two major changes are: • Removal of platforms that are no longer expected to generate royalties. • Inclusion of royalty-bearing platforms that were previously excluded as to date they have generated only a small
amount of royalty revenue. Platform analysis
(nm) Royalty-Bearing Foundry Royalty-Bearing Foundry Platforms at Each Node (Previous methodology) Platforms at Each Node
(Restated) 22/20 3 3 32/28 8 9 45/40 8 6
65 12 11 90 11 8
130 19 17 180 to 250 21 37
Total 82 91 PIPD royalties Physical IP royalties are generated mainly from chips manufactured in the world’s major semiconductor foundries. Royalties are recognised one quarter in arrears with royalties reported in Q4 generated from semiconductor unit shipments in Q3. Underlying PIPD royalties in Q4 2011 were $12.1 million, up 4% sequentially to a record high, compared to foundry revenues which declined 4% in the relevant period. Royalty revenue from physical IP at advanced nodes, at 65nm and beyond, continues to increase and now accounts for approximately 45% of royalty revenues. This included the first physical IP royalty revenue from 32nm wafer shipments.

8 of 23
People At 31 December 2011, ARM had 2,116 full-time employees, a net increase of 227 since the start of the year, with 80% being engineers joining ARM’s R&D teams. At the end of Q4, the group had 870 employees based in the UK, 555 in the US, 246 in Continental Europe, 306 in India and 139 in the Asia Pacific region. Given the broad range of opportunities for growth, ARM is investing in its R&D programs and operations, and expects some further recruitment in 2012. Principal risks and uncertainties The principal risks and opportunities faced by the Group are included within the “Risks and risk management” section of the 2010 Annual Report and Accounts filed with Companies House in the UK. Details of other risks and uncertainties faced by the Group are noted within the Annual Report on Form 20-F for the year ended 31 December 2010 which is on file with the Securities and Exchange Commission (the “SEC”) and is available on the SEC’s website at www.sec.gov. There have been no changes to these risks that would materially impact the Group in the foreseeable future. These include but are not limited to: ARM's quarterly results may fluctuate significantly and be unpredictable which could adversely affect the market price of ARM ordinary shares; general economic conditions may reduce ARM's revenues and harm its business; ARM may have to protect its intellectual property or defend ARM’s technology against claims that we have infringed others’ proprietary rights; an infringement claim against ARM’s technology may result in a significant damages award which would adversely impact ARM’s operating results; companies within the semiconductor industry may consolidate reducing the number of customers that ARM may sell its technology to; for ARM to enter new markets or develop new technology may require significant investment and may not result in profitable operations; and ARM competes in the intensely competitive semiconductor market.

9 of 23
ARM Holdings plc Consolidated balance sheet - IFRS
31 December 31 December 2011 2010 Unaudited Audited £’000 £’000 Assets Current assets: Cash and cash equivalents 28,023 29,363 Short-term deposits 317,868 247,466 Embedded derivatives 1,141 2,303 Accounts receivable (see note 4) 119,631 105,668 Prepaid expenses and other assets 30,724 18,431 Current tax assets 6,233 3,646 Inventories: finished goods 2,470 1,784 Total current assets 506,090 408,661 Non-current assets: Available-for-sale financial assets 27,281 20,329 Long-term deposits 83,094 15,000 Loans and receivables 2,018 1,934 Prepaid expenses and other assets 2,322 1,920 Property, plant and equipment 18,141 13,847 Goodwill 542,527 532,285 Other intangible assets 12,444 12,099 Deferred tax assets 105,873 78,587 Total non-current assets 793,700 676,001 Total assets 1,299,790 1,084,662 Liabilities and shareholders’ equity Current liabilities: Accounts payable 8,673 4,305 Fair value of currency exchange contracts 1,530 201 Accrued and other liabilities (see note 4) 84,929 72,028 Current tax liabilities 26,702 20,216 Deferred revenue 102,193 72,049 Total current liabilities 224,027 168,799 Non-current liabilities: Deferred revenue 14,559 20,657 Deferred tax liabilities - 301 Total non-current liabilities 14,559 20,958 Total liabilities 238,586 189,757 Net assets 1,061,204 894,905 Capital and reserves attributable to equity holders of the Company Share capital 676 672 Share premium account 358,170 351,578 Share option reserve 61,474 61,474 Retained earnings 539,641 381,379 Revaluation reserve 271 - Cumulative translation adjustment 100,972 99,802 Total equity 1,061,204 894,905

10 of 23
ARM Holdings plc Consolidated income statement – IFRS
Quarter
ended Quarter
ended
Year ended
Year ended 31 December
2011 31 December
2010 31 December
2011 31 December
2010 Unaudited Unaudited Unaudited Audited £’000 £’000 £'000 £'000
Revenues 137,799 113,946 491,826 406,595 Cost of revenues (6,547) (6,566) (27,687) (26,071) Gross profit 131,252 107,380 464,139 380,524 Research and development (42,935) (36,635) (165,351) (139,750) Sales and marketing (20,186) (19,707) (72,610) (70,108) General and administrative (20,985) (16,792) (77,197) (63,707) Total operating expenses, net (84,106) (73,134) (315,158) (273,565) Profit from operations 47,146 34,246 148,981 106,959 Investment income 2,527 1,240 7,968 3,634 Interest payable and similar charges - (566) - (566) Profit before tax 49,673 34,920 156,949 110,027 Tax (16,599) (5,211) (44,307) (24,053) Profit for the period 33,074 29,709 112,642 85,974 Earnings per share Basic and diluted earnings 33,074 29,709 112,642 85,974 Number of shares (‘000) Basic weighted average number of shares 1,350,706 1,321,629 1,345,034 1,313,186 Effect of dilutive securities: Share options and awards 27,062 36,426 30,939 39,007 Diluted weighted average number of shares 1,377,768 1,358,055 1,375,973 1,352,193 Basic EPS (pence) 2.4 2.2 8.4 6.5 Diluted EPS (pence) 2.4 2.2 8.2 6.4 Diluted earnings per ADS (cents) 11.2 10.3 38.2 29.9 All activities relate to continuing operations. All of the profit for the period is attributable to the equity shareholders of the parent.

11 of 23
ARM Holdings plc Consolidated statement of comprehensive income - IFRS
Quarter
ended Quarter
ended
Year ended
Year ended 31 December
2011 31 December
2010 31 December
2011 31 December
2010 Unaudited Unaudited Unaudited Audited £’000 £’000 £’000 £’000 Profit for the period 33,074 29,709 112,642 85,974 Other comprehensive income: Unrealised holding gain on available-for-sale financial assets (net of tax of £90,000 in 2011
(2010: nil))
271
-
271
155 Currency translation adjustment 535 3,786 1,170 16,624 Other comprehensive income for the period 806 3,786 1,441 16,779 Total comprehensive income for the period 33,880 33,495 114,083 102,753

12 of 23
ARM Holdings plc Consolidated cash flow statement - IFRS
Year ended Year ended 31 December 31 December 2011 2010 Unaudited Audited £’000 £’000 Operating activities Profit before tax 156,949 110,027 Investment income (net) (7,968) (3,068) Profit from operations 148,981 106,959 Depreciation and amortisation of tangible and intangible assets 13,156 19,949 Loss on disposal of property, plant and equipment 2 252 Compensation charge in respect of share-based payments 40,457 27,129 Impairment of available-for-sale financial assets 1,638 - Loss/(profit) on disposal of available-for-sale financial assets 111 (37) Provision for doubtful debts 24 (904) Provision for obsolescence of inventory (59) (199) Non-cash foreign currency gains (2,262) (519) Movement in fair value of currency exchange contracts 1,329 658 Movement in fair value of embedded derivatives 1,162 177 Changes in working capital: Accounts receivable (13,352) (39,942) Inventories (627) 95 Prepaid expenses and other assets (12,317) 4,695 Accounts payable 4,368 2,025 Deferred revenue 23,324 53,594 Accrued and other liabilities 10,229 25,340 Cash generated by operations before tax 216,164 199,272 Income taxes paid (22,356) (22,859) Net cash from operating activities 193,808 176,413 Investing activities Interest received 4,240 2,101 Interest paid - (566) Purchases of property, plant and equipment (12,139) (6,182) Purchases of other intangible assets (831) (1,173) Purchases of available-for-sale financial assets (8,349) (10,997) Proceeds on disposal of property, plant and equipment 27 146 Proceeds on disposal of available-for-sale financial assets 12 142 Purchase of short and long-term deposits (135,221) (153,264) Outflow from provision of long-term loan - (1,934) Purchases of subsidiaries, net of cash acquired (8,942) - Net cash used in investing activities (161,203) (171,727) Financing activities Proceeds received on issuance of shares from treasury 1,917 24,015 Proceeds received on issuance of shares 6,596 - Dividends paid to shareholders (42,166) (34,323) Net cash used in financing activities (33,653) (10,308) Net increase/(decrease) in cash and cash equivalents (1,048) (5,622) Cash and cash equivalents at beginning of year 29,363 34,489 Effect of foreign exchange rate changes (292) 496 Cash and cash equivalents at end of year 28,023 29,363

13 of 23
ARM Holdings plc Consolidated statement of changes in shareholders’ equity – IFRS
Share Share Reval- Cumulative Share premium option Retained -uation translation capital account reserve earnings reserve adjustment Total £’000 £’000 £’000 £’000 £’000 £’000 £’000 At 1 January 2010 (audited) 672 351,578 61,474 241,950 (155) 83,178 738,697 Profit for the year − − − 85,974 − − 85,974 Other comprehensive income: Unrealised holding gain on available-for-sale investment − − − − 155 − 155 Currency translation adjustment − − − − − 16,624 16,624 Total comprehensive income for the year − − − 85,974 155 16,624 102,753 Dividends (see note 3) − − − (34,323) − − (34,323) Credit in respect of employee share schemes − − − 27,129 − − 27,129 Movement on tax arising on share options and awards − − − 36,634 − − 36,634 Proceeds from sale of own shares − − − 24,015 − − 24,015 − − − 53,455 − − 53,455 At 31 December 2010 (audited) 672 351,578 61,474 381,379 − 99,802 894,905 Profit for the year − − − 112,642 − − 112,642 Other comprehensive income: Unrealised holding gain on available-for-sale investments − − − − 271 − 271 Currency translation adjustment − − − − − 1,170 1,170 Total comprehensive income for the year − − − 112,642 271 1,170 114,083 Shares issued on exercise of share options and awards 4 6,592 − − − − 6,596 Dividends (see note 3) − − − (42,166) − − (42,166) Credit in respect of employee share schemes − − − 40,457 − − 40,457 Movement on tax arising on share options and awards − − − 45,412 − − 45,412 Proceeds from sale of own shares − − − 1,917 − − 1,917 4 6,592 − 45,620 − − 52,216 At 31 December 2011 (unaudited) 676 358,170 61,474 539,641 271 100,972 1,061,204

14 of 23
Notes to the Financial Information (1) Basis of preparation The financial information prepared in accordance with the Group's IFRS accounting policies comprises the consolidated balance sheets as of 31 December 2011 and 31 December 2010, consolidated income statements and consolidated statements of comprehensive income for the three months and years ended 31 December 2011 and 2010, and consolidated cash flow statements and consolidated statements of changes in shareholders’ equity for the years ended 31 December 2011 and 2010, together with related notes. This condensed set of consolidated financial information for the year ended 31 December 2011 has been prepared in accordance with the Disclosure and Transparency Rules of the Financial Services Authority and with IAS 34, “Interim financial reporting”, as adopted by the European Union. This financial information should be read in conjunction with the annual financial statements for the year ended 31 December 2010, which have been prepared in accordance with IFRSs as adopted by the European Union. The following amendment to standards is mandatory for the first time in 2011: Amendment to IAS 24 “Related party disclosures” This removes the requirement for government-related entities to disclose details of all transactions with the government and it clarifies and simplifies the definition of a related party. The change in definition has not had an impact on the identification of the Group’s related parties. Published by the IASB in November 2009, this is effective for accounting periods beginning on or after 1 January 2011. This amendment was endorsed by the EU on 19 July 2010.
The following new standards, amendments to standards, or interpretations have been issued but are not effective for the financial year beginning 1 January 2011 and have not been early adopted: IFRS 9 “Financial instruments on classification and measurement” This is the first part of a new standard to replace IAS 39. IFRS 9 has two measurement categories: amortised cost and fair value. All equity instruments are measured at fair value. A debt instrument is measured at amortised cost only if the entity is holding it to collect contractual cash flows and the cash flows represent principal and interest. Otherwise it is measured at fair value through the income statement. This standard is not expected to have a material impact on the results of the Group. Published by the IASB in November 2009, this is effective for accounting periods beginning on or after 1 January 2013. This standard is not yet endorsed by the EU. IFRS 10 “Consolidation” IFRS 10 replaces the guidance on control and consolidation in IAS 27, ‘Consolidated and separate financial statements’, and SIC-12, ‘Consolidation - special purpose entities’ and changes the definition of control so that the same criteria are applied to all entities. The revised definition of control focuses on the need to have both power and variable returns before control is present. Power is the current ability to direct the activities that significantly influence returns. Returns must vary and can be positive, negative or both. This is not currently relevant but could have an impact if there are any changes to the structure of the Group. The standard is effective for annual periods beginning on or after 1 January 2013. It is not yet endorsed by the EU. IFRS 11 “Joint arrangements” Changes in the definitions have reduced the ‘types’ of joint arrangements to two: joint operations and joint ventures. The existing policy choice of proportionate consolidation for jointly controlled entities has been eliminated. Equity accounting is mandatory for participants in joint ventures. Entities that participate in joint operations will follow accounting much like that for joint assets or joint operations today, whereby a joint operator will recognise its interest based on its involvement in the joint operation (that is, based on its direct rights and obligations) rather than on the participation interest it has in the joint arrangement. In contrast, a joint venture does not have rights to individual assets or obligations for individual liabilities of the joint venture. Instead, joint venturers share in the net assets and, in turn, the outcome (profit or loss) of the activity undertaken by the joint venture. This is not currently relevant but could have an impact if there are any changes to the structure of the Group. An entity shall apply this IFRS for annual periods beginning on or after 1 January 2013. The standard is not yet endorsed by the EU. IFRS 12 “Disclosure of interests in other entities” IFRS 12 sets out the required disclosures for entities reporting under the two new standards, IFRS 10, ‘Consolidated financial statements’, and IFRS 11, ‘Joint arrangements’. The new standard, IFRS 12, requires entities to disclose information that helps financial statement readers to evaluate the nature, risks and financial effects associated with the entity’s interests in subsidiaries, associates, joint arrangements and unconsolidated structured entities. This is not currently relevant but could have an impact if there are any changes to the structure of the Group. The standard is effective for annual periods beginning on or after 1 January 2013. The standard is not yet endorsed by the EU. IFRS 13 “Fair value measurement” The requirements, which are largely aligned between IFRS and US GAAP, do not extend the use of fair value accounting but provide guidance on how it should be applied where its use is already required or permitted by other standards. IFRS 13 aims to improve consistency and reduce complexity by providing a precise definition of fair value and a single source of fair value measurement and disclosure requirements for use across IFRSs. This standard is not expected to have a material impact on the results of the Group, but it could have if the Group were to enter into additional transactions that are covered by this standard. The standard is effective for annual periods beginning on or after 1 January 2013. The standard is not yet endorsed by the EU. IAS 19 (revised 2011) “Employee benefits” This amendment makes significant changes to the recognition and measurement of defined benefit pension expense and termination benefits, and to the disclosures for all employee benefits. The distinction between short- and long-term benefits for measurement purposes is based on when payment is expected, not when payment can be demanded. However, the amendment does not alter the balance sheet classification of the liabilities recorded in respect of the benefit obligation. It is considered that this will not have a material impact on the results of the Group. This standard is effective for annual periods beginning on or after 1 January 2013. The standard is not yet endorsed by the EU.

15 of 23
(1) Basis of preparation (continued) IAS 28 (Revised) “Investments in associates and joint ventures” IAS 28 defines ‘significant influence’ and the ‘equity method’ and provides guidance on their practical application. The revised standard incorporates the accounting for joint ventures as well as the consensus from SIC-13. The disclosure requirements have now been relocated to IFRS 12. This new guidance may impact the classification of investments acquired in the future. This is not currently relevant but could have an impact if there are any changes to the structure of the Group. This standard is effective for annual periods beginning on or after 1 January 2013. The standard is not yet endorsed by the EU. (2) Share-based payment costs and acquisition-related expenses Included within the consolidated income statement for the quarter ended 31 December 2011 are total share-based payment costs (including related payroll taxes) of £14.2 million (2010: £10.6 million), allocated £1.0 million (2010: £0.7 million) in cost of revenues, £8.5 million (2010: £6.4 million) in research and development expenses, £2.7 million (2010: £2.0 million) in sales and marketing expenses and £2.0 million (2010: £1.5 million) in general and administrative expenses. Included within the consolidated income statement for the year ended 31 December 2011 are total share-based payment costs (including related payroll taxes) of £57.7 million (2010: £41.9 million), allocated £3.5 million (2010: £2.8 million) in cost of revenues, £34.8 million (2010: £25.2 million) in research and development expenses, £11.3 million (2010: £8.0 million) in sales and marketing expenses and £8.1 million (2010: £5.9 million) in general and administrative expenses. Also included within operating expenses for the quarter ended 31 December 2011 is amortisation of intangibles acquired on business combinations of £0.7 million (2010: £2.3 million), allocated £0.6 million (2010: £0.7 million) in research and development expenses and £0.1 million (2010: £1.6 million) in sales and marketing expenses. Included within operating expenses for the year ended 31 December 2011 is amortisation of intangibles acquired on business combinations of £2.8 million (2010: £10.9 million), allocated £2.4 million (2010: £3.5 million) in research and development expenses and £0.4 million (2010: £7.4 million) in sales and marketing expenses. Included within operating expenses for the quarter ended 31 December 2011 are total acquisition related charges of £2.7 million (including a retention bonus on acquisitions amounting to £2.5 million) (2010: £0.1 million), allocated £2.5 million (2010: £nil) in research and development expenses, £0.1 million (2010: £0.1 million) in sales and marketing expenses, and £0.1 million (2010: £nil) in general and administrative expenses. Included within operating expenses for the year ended 31 December 2011 are total acquisition related charges of £3.6 million (including a retention bonus on acquisitions amounting to £2.5 million) (2010: £0.5 million), allocated £2.5 million (2010: £nil) in research and development expenses, £0.4 million (2010: £0.5 million) in sales and marketing expenses, and £0.7 million (2010: £nil) in general and administrative expenses. (3) Dividends Year ended
31 December 2011 Year ended
31 December 2010 £’000 £’000 Final 2009 paid at 1.45 pence per share - 19,022 Interim 2010 paid at 1.16 pence per share - 15,301 Final 2010 paid at 1.74 pence per share 23,410 - Interim 2011 paid at 1.39 pence per share 18,756 - 42,166 34,323 In respect of the year ended 31 December 2011, the directors are proposing a final dividend of 2.09 pence per share (an estimated cost of £29m). Subject to approval at the 2012 AGM, it will be paid on 18 May 2012 to shareholders who are on the register of members on 4 May 2012. (4) Accounts receivable, and accrued and other liabilities Included within accounts receivable at 31 December 2011 are £4.9 million (31 December 2010: £8.7 million) of amounts recoverable on contracts. Included within accrued and other liabilities at 31 December 2011 are £22.6 million (31 December 2010: £17.7 million) relating to the provision for payroll taxes on share awards, and £23.7 million (31 December 2010: £22.7 million) relating to employee bonus and sales commission provisions. (5) Related party transactions During the year ended 31 December 2011 the Group incurred subscription costs of £6.9 million from Linaro Limited, an associated company of the Group, representing ARM’s committed aggregate contributions to Linaro for the next two years. Linaro-related charges amounted to £4.5 million during the year ended 31 December 2010.

16 of 23
(6) Segmental reporting At 31 December 2011, the Group is organised on a worldwide basis into three main business segments: Processor Division (PD), encompassing those resources that are centred on microprocessor cores, including specific functions such as graphics IP, fabric IP and embedded software and configurable digital signal processing IP. Physical IP Division (PIPD), concerned with the building blocks necessary for translation of a circuit design into actual silicon. Systems Design Division (SDD), focused on the tools and models used to create and debug software and system-on-chip (SoC) designs. This is based upon the Group’s internal organisation and management structure and is the primary way in which the Chief Operating Decision Maker is provided with financial information. Whilst revenues are also reported into four main revenue streams (namely licensing, royalties, development systems and services), the costs, operating results and balance sheets are only analysed into these three divisions. The following analysis is of revenues (in both GBP and USD), operating costs, investment income, profit/(loss) before tax, tax, profit/(loss) for the year, amortisation of intangible assets, other acquisition-related charges, share-based payment costs including payroll taxes, disposal and impairment of investments, Linaro-related charges, goodwill and total assets for each segment and the Group in total.
Year ended 31 December 2011
Processor Division
£’000
Physical IP Division
£’000
Systems Design
Division £’000
Unallocated £’000
Group £’000
Segmental income statement Revenues (GBP) 397,564 61,334 32,928 - 491,826 Operating costs (223,818) (81,076) (41,165) 3,214 (342,845) Investment income - - - 7,968 7,968 Profit/(loss) before tax 173,746 (19,742) (8,237) 11,182 156,949 Tax - - - (44,307) (44,307) Profit/(loss) for the year 173,746 (19,742) (8,237) (33,125) 112,642
Reconciliation to normalised profit/(loss) before tax
Intangible amortisation
1,733 1,036 - - 2,769 Acquisition-related charges 2,906 571 157 - 3,634 Share-based payment costs including payroll taxes 36,952 12,125 8,661 - 57,738 Disposal/impairment of investments (12) 1,635 125 - 1,748 Linaro-related charges 6,851 - - - 6,851 Normalised profit/(loss) before tax 222,176 (4,375) 706 11,182 229,689
Other segmental items Goodwill 143,738 383,871 14,918 - 542,527 Total assets 274,608 419,928 30,870 574,384 1,299,790 Revenues (USD) $ 634,681 $ 97,864 $ 52,459 - $ 785,004

17 of 23
(6) Segmental reporting (continued)
Year ended 31 December 2010
Processor Division
£’000
Physical IP Division
£’000
Systems Design
Division £’000
Unallocated £’000
Group £’000
Segmental income statement Revenues (GBP) 315,747 54,855 35,993 - 406,595 Operating costs (179,224) (82,519) (39,493) 1,600 (299,636) Investment income - - - 3,634 3,634 Interest payable and similar charges - - - (566) (566) Profit/(loss) before tax 136,523 (27,664) (3,500) 4,668 110,027 Tax - - - (24,053) (24,053) Profit/(loss) for the year 136,523 (27,664) (3,500) (19,385) 85,974
Reconciliation to normalised profit/(loss) before tax Intangible amortisation 2,181 8,413 801 - 11,395 Share-based payment costs including payroll taxes 24,969 9,949 6,992 - 41,910 Restructuring (358) - (15) - (373) Linaro-related charges 4,448 - - - 4,448 Normalised profit/(loss) before tax 167,763 (9,302) 4,278 4,668 167,407
Other segmental items Goodwill 139,560 377,767 14,958 - 532,285 Total assets 239,918 414,929 29,820 399,995 1,084,662 Revenues (USD) $ 490,747 $ 85,143 $ 55,417 - $ 631,307 There are no inter-segment revenues. The results of each segment have been prepared using accounting policies consistent with those of the Group as a whole. Unallocated assets include cash and cash equivalents, short- and long-term deposits, available-for-sale investments, loans and receivables, embedded derivatives, current and deferred tax, and VAT. Unallocated operating costs consist of foreign exchange transactions. (7) Acquisitions On 31 October 2011, the Group purchased the entire share capital of Prolific Inc. for $7.7 million in cash. This purchase has been accounted for as an acquisition. Prolific, a company based in Newark California, develops leading-edge IC design optimisation software tools that significantly reduce development time and improve the performance of cell-based designs. The increasing complexity of 20nm and below process technologies is driving the need for automated layout optimisation solutions. This acquisition augments ARM's strategy to provide innovative physical IP products that will enable the ARM partnership to continue to lead in the implementation of highly integrated, low-power system-on-chip solutions. For these reasons, combined with the ability to hire the workforce of Prolific, including the founders and the management team, the Group paid a premium for the company giving rise to goodwill. All intangible assets were recognised at their fair values, with the residual excess over net assets being recognised as goodwill. All of the goodwill recognised is expected to be deductible for income tax purposes. The following table summarises the consideration and provisional fair values of the assets acquired and liabilities assumed as at 1 November 2011. £’000 $’000 Cash and cash equivalents 6 10 Accounts receivable and other current assets 10 16 Property, plant and equipment 3 5 Intangible assets 2,374 3,690 Deferred revenue (195) (304) Accrual and other payables (504) (783) Net assets acquired 1,694 2,634 Goodwill 3,284 5,103 Consideration 4,978 7,737 The consideration was all paid in cash. All transaction expenses incurred by ARM have been charged to the income statement. A further $8.5m is payable as an earn-out to the shareholders subject to them remaining in employment with ARM for up to five years and meeting certain performance criteria.

18 of 23
(7) Acquisitions (continued) From the date of acquisition to 31 December 2011, the acquisition contributed $0.1 million in revenue and incurred a loss of $0.1 million. If Prolific had been consolidated from 1 January 2011, the consolidated income statement would have included $3.1 million of revenue and $1.5 million of pre-tax profit. On 15 June 2011, the Group purchased the entire share capital of Obsidian Software Inc. for $5.6 million in cash, plus a further $9.5 million payable as earn-out to the shareholders subject to them remaining in employment with ARM for up to 3 years and meeting certain performance criteria. This purchase has been accounted for as an acquisition. The details of this acquisition can be found within the half year results as announced on 26 July 2011. (8) Non-GAAP measures The following non-GAAP measures, including reconciliations to the IFRS measures, have been used in this earnings release. These measures have been presented as they allow a clearer comparison of operating results that exclude acquisition-related charges, share-based payment costs, restructuring charges, profit on disposal and impairment of available-for-sale investments, and Linaro-related charges. Full reconciliations of Q4 2011, Q4 2010, FY 2011 and FY 2010, are shown in notes 8.13 to 8.16. All figures in £’000 unless otherwise stated. Summary normalised figures Q4 2011 Q4 2010 Q3 2011 FY 2011 FY 2010 Revenues (£’000) 137,799 113,946 120,167 491,826 406,595 Revenues ($’000) 217,038 179,562 192,310 785,004 631,307 Gross margin 96.0% 94.9% 94.9% 95.1% 94.3% Operating expenses 65,760 61,242 60,462 245,910 219,001 Profit from operations 66,473 46,883 53,615 221,721 164,339 Operating margin 48.2% 41.1% 44.6% 45.1% 40.4% Profit before tax 69,000 47,557 55,760 229,689 167,407 Earnings per share (diluted) 3.71p 2.90p 3.05p 12.45p 9.34p Cash 423,982 290,101 397,173 423,982 290,101 Cash generation 51,536 40,665 43,729 203,825 179,910 (8.1) (8.2) (8.3) (8.4) (8.5) Q4 2011 Q4 2010 Q3 2011 FY 2011 FY 2010 Revenues (£’000) 137,799 113,946 120,167 491,826 406,595 ARM’s effective exchange rate ($/£) 1.58 1.58 1.60 1.60 1.55 Revenues ($’000) 217,038 179,562 192,310 785,004 631,307 (8.6) (8.7) 31 December
2011 31 December
2010 Cash and cash equivalents 28,023 29,363 Short-term deposits 317,868 247,466 Long-term deposits 83,094 15,000 Less: Interest accrued (5,003) (1,728) Normalised cash 423,982 290,101 (8.8) (8.9) (8.10) (8.11) (8.12) Q4 2011 Q4 2010 Q3 2011 FY 2011 FY 2010 Normalised cash at end of period (as above) 423,982 290,101 397,173 423,982 290,101 Less: Normalised cash at beginning of period (397,173) (251,856) (353,841) (290,101) (141,808) Add back: Cash outflow from investments and acquisitions (net of cash acquired)
5,758
2,274
2,176
17,279
10,997
Add back: Cash outflow from acquisition costs 15 - 451 3,154 - Add back: Cash outflow from payment of dividends 18,754 - - 42,166 34,323 Add back: Cash outflow from restructuring payments - 51 - - 4,561 Add back: Cash outflow from share-based payroll taxes 191 193 226 12,393 3,215 Add back: Cash outflow from payments related to Linaro 829 819 829 3,465 2,678 Less: Cash inflow from exercise of share options (820) (880) (3,285) (8,513) (24,015) Less: Cash inflow from sale of available-for-sale investments - (37) - - (142) Normalised cash generation 51,536 40,665 43,729 203,825 179,910

19 of 23
(8.13) Normalised income statement for Q4 2011
Normalised
Share-based
payments
Normalised incl share-
based payments
Intangible amortisa-
tion
Acquisition related charges
Disposal/
Impairment of
investments
IFRS £'000 £'000 £'000 £'000 £'000 £'000 £'000 Revenues 137,799 − 137,799 − − − 137,799 Cost of revenues (5,566) (981) (6,547) − − − (6,547) Gross profit 132,233 (981) 131,252 − − − 131,252 Research and development (31,429) (8,486) (39,915) (550) (2,470) − (42,935) Sales and marketing (17,254) (2,703) (19,957) (115) (114) − (20,186) General and administrative (17,077) (1,983) (19,060) − (165) (1,760) (20,985) Total operating expenses (65,760) (13,172) (78,932) (665) (2,749) (1,760) (84,106) Profit from operations 66,473 (14,153) 52,320 (665) (2,749) (1,760) 47,146 Investment income 2,527 − 2,527 − − − 2,527 Profit before tax 69,000 (14,153) 54,847 (665) (2,749) (1,760) 49,673 Tax (17,946) (192) (18,138) 92 981 466 (16,599) Profit for the period 51,054 (14,345) 36,709 (573) (1,768) (1,294) 33,074 Earnings per share (assuming dilution)
Shares outstanding (‘000) 1,377,768 1,377,768 1,377,768 Earnings per share – pence 3.71 2.66 2.40 ADSs outstanding (‘000) 459,256 459,256 459,256 Earnings per ADS – cents 17.28 12.42 11.19
20 of 23
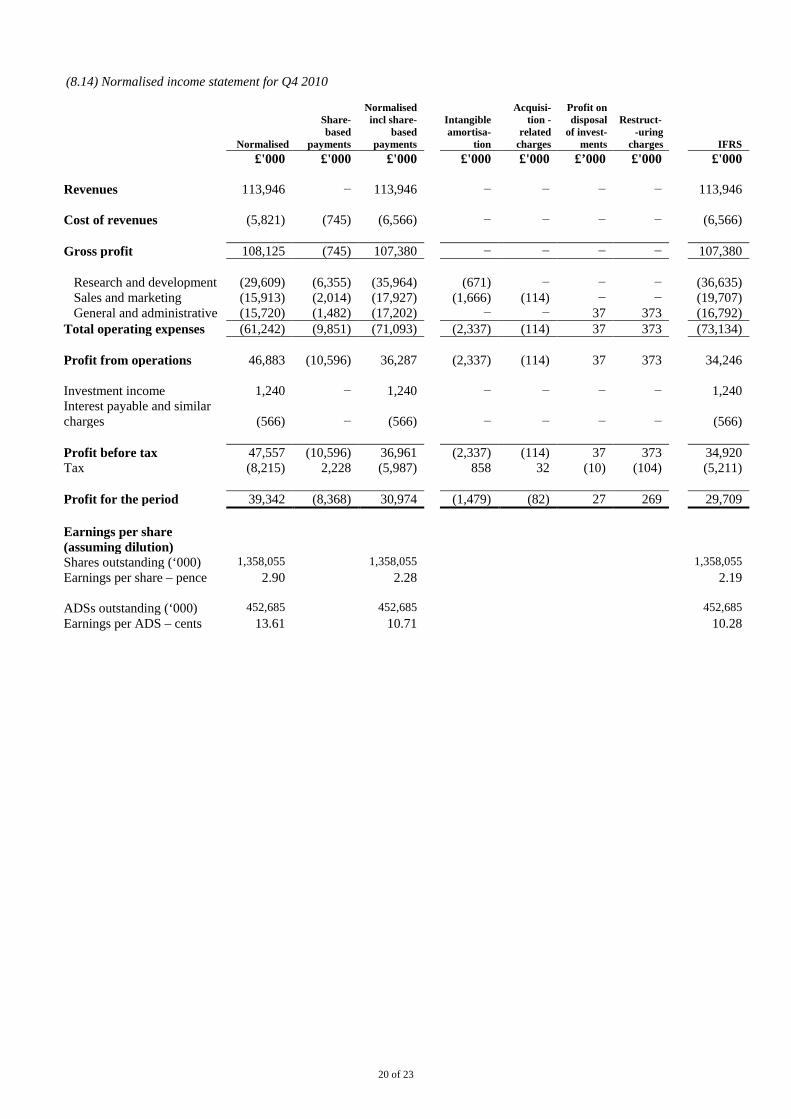
(8.14) Normalised income statement for Q4 2010
Normalised
Share-based
payments
Normalised incl share-
based payments
Intangible amortisa-
tion
Acquisi-
tion -related
charges
Profit on disposal
of invest-ments
Restruct- -uring
charges
IFRS £'000 £'000 £'000 £'000 £'000 £’000 £'000 £'000 Revenues 113,946 − 113,946 − − − − 113,946 Cost of revenues (5,821) (745) (6,566) − − − − (6,566) Gross profit 108,125 (745) 107,380 − − − − 107,380 Research and development (29,609) (6,355) (35,964) (671) − − − (36,635) Sales and marketing (15,913) (2,014) (17,927) (1,666) (114) − − (19,707) General and administrative (15,720) (1,482) (17,202) − − 37 373 (16,792) Total operating expenses (61,242) (9,851) (71,093) (2,337) (114) 37 373 (73,134) Profit from operations 46,883 (10,596) 36,287 (2,337) (114) 37 373 34,246 Investment income 1,240 − 1,240 − − − − 1,240 Interest payable and similar charges
(566)
−
(566)
−
−
−
−
(566)
Profit before tax 47,557 (10,596) 36,961 (2,337) (114) 37 373 34,920 Tax (8,215) 2,228 (5,987) 858 32 (10) (104) (5,211) Profit for the period 39,342 (8,368) 30,974 (1,479) (82) 27 269 29,709 Earnings per share (assuming dilution)
Shares outstanding (‘000) 1,358,055 1,358,055 1,358,055 Earnings per share – pence 2.90 2.28 2.19 ADSs outstanding (‘000) 452,685 452,685 452,685 Earnings per ADS – cents 13.61 10.71 10.28

21 of 23
(8.15) Normalised income statement for FY 2011
Normalised
Share- based
payments
Normalised incl share-
based payments
Intangible amortisa-
tion
Acquisi-
tion -related
charges
Disposal/
Impair-ment of
investments
Linaro -related
charges
IFRS £'000 £'000 £'000 £'000 £'000 £'000 £'000 £'000 Revenues 491,826 − 491,826 − − − − 491,826 Cost of revenues (24,195) (3,492) (27,687) − − − − (27,687) Gross profit 467,631 (3,492) 464,139 − − − − 464,139 Research and development (118,860) (34,803) (153,663) (2,367) (2,470) − (6,851) (165,351) Sales and marketing (60,441) (11,311) (71,752) (402) (456) − − (72,610) General and administrative (66,609) (8,132) (74,741) − (708) (1,748) − (77,197) Total operating expenses (245,910) (54,246) (300,156) (2,769) (3,634) (1,748) (6,851) (315,158) Profit from operations 221,721 (57,738) 163,983 (2,769) (3,634) (1,748) (6,851) 148,981 Investment income 7,968 − 7,968 − − − − 7,968 Profit before tax 229,689 (57,738) 171,951 (2,769) (3,634) (1,748) (6,851) 156,949 Tax (58,442) 10,081 (48,361) 643 1,132 463 1,816 (44,307) Profit for the period 171,247 (47,657) 123,590 (2,126) (2,502) (1,285) (5,035) 112,642 Earnings per share (assuming dilution)
Shares outstanding (‘000) 1,375,973 1,375,973 1,375,973 Earnings per share – pence 12.45 8.98 8.19 ADSs outstanding (‘000) 458,658 458,658 458,658 Earnings per ADS – cents 58.02 41.88 38.17

22 of 23
(8.16) Normalised income statement for FY 2010
Normalised
Share- based
payments
Normalised incl share-
based payments
Intangible amortisa-
tion
Acquisi-
tion -related
charges
Profit on disposal
of invest-ments
Restruc-turing
charges
Linaro -related
charges
IFRS £'000 £'000 £'000 £'000 £'000 £’000 £’000 £'000 £'000 Revenues 406,595 − 406,595 − − − − − 406,595 Cost of revenues (23,255) (2,816) (26,071) − − − − − (26,071) Gross profit 383,340 (2,816) 380,524 − − − − − 380,524 Research and development (107,559) (25,206) (132,765) (3,544) − − − (3,441) (139,750) Sales and marketing (54,101) (8,005) (62,106) (7,395) (456) − − (151) (70,108) General and administrative (57,341) (5,883) (63,224) − − 37 373 (893) (63,707) Total operating expenses (219,001) (39,094) (258,095) (10,939) (456) 37 373 (4,485) (273,565) Profit from operations 164,339 (41,910) 122,429 (10,939) (456) 37 373 (4,485) 106,959 Investment income 3,634 − 3,634 − − − − − 3,634 Interest payable and similar charges
(566)
−
(566)
−
−
−
−
−
(566)
Profit before tax 167,407 (41,910) 125,497 (10,939) (456) 37 373 (4,485) 110,027 Tax (41,085) 11,729 (29,356) 4,033 128 (10) (104) 1,256 (24,053) Profit for the period 126,322 (30,181) 96,141 (6,906) (328) 27 269 (3,229) 85,974 Earnings per share (assuming dilution)
Shares outstanding (‘000) 1,352,193 1,352,193 1,352,193 Earnings per share – pence 9.34 7.11 6.36 ADSs outstanding (‘000) 450,731 450,731 450,731 Earnings per ADS – cents 43.88 33.40 29.86

23 of 23
Notes The results shown for Q4 2011, Q3 2011, Q4 2010, and FY 2011 are unaudited. The statutory accounts of the Company in respect of the financial year ended 31 December 2011 are expected to be approved by the Board of directors during the week commencing 27 February 2012. The results shown for FY 2010 are audited. The consolidated financial information contained in this announcement does not constitute statutory accounts within the meaning of Section 434 of the Companies Act 2006. Statutory accounts of the Company in respect of the financial year ended 31 December 2010 were approved by the Board of directors on 28 February 2011 and delivered to the Registrar of Companies. The report of the auditors on those accounts was unqualified and did not contain an emphasis of matter paragraph nor any statement under Section 498 of the Companies Act 2006. The results for ARM for Q4 2011 and previous quarters as shown reflect the accounting policies as stated in Note 1 to the financial statements in the Annual Report and Accounts filed with Companies House in the UK for the fiscal year ended 31 December 2010 and in the Annual Report on Form 20-F for the fiscal year ended 31 December 2010. This document contains forward-looking statements as defined in section 102 of the Private Securities Litigation Reform Act of 1995. These statements are subject to risk factors associated with the semiconductor and intellectual property businesses. When used in this document, the words “anticipates”, “may”, “can”, “believes”, “expects”, “projects”, “intends”, “likely”, similar expressions and any other statements that are not historical facts, in each case as they relate to ARM, its management or its businesses and financial performance and condition are intended to identify those assertions as forward-looking statements. It is believed that the expectations reflected in these statements are reasonable, but they may be affected by a number of variables, many of which are beyond our control. These variables could cause actual results or trends to differ materially and include, but are not limited to: failure to realize the benefits of acquisitions, unforeseen liabilities arising from acquisitions, price fluctuations, actual demand, the availability of software and operating systems compatible with our intellectual property, the continued demand for products including ARM’s intellectual property, delays in the design process or delays in a customer’s project that uses ARM’s technology, the success of our semiconductor partners, loss of market share and industry competition, exchange and currency fluctuations, any future strategic investments or acquisitions, rapid technological change, regulatory developments, ARM’s ability to negotiate, structure, monitor and enforce agreements for the determination and payment of royalties, actual or potential litigation, changes in tax laws, interest rates and access to capital markets, political, economic and financial market conditions in various countries and regions and capital expenditure requirements. More information about potential factors that could affect ARM’s business and financial results is included in ARM’s Annual Report on Form 20-F for the fiscal year ended 31 December 2010 including (without limitation) under the captions, “Risk Factors”(on pages 4 to 11) which is on file with the Securities and Exchange Commission (the “SEC”) and available at the SEC’s website at www.sec.gov. About ARM ARM designs the technology that lies at the heart of advanced digital products, from wireless, networking and consumer entertainment solutions to imaging, automotive, security and storage devices. ARM’s comprehensive product offering includes 32-bit RISC microprocessors, graphics processors, video engines, enabling software, cell libraries, embedded memories, high-speed connectivity products, peripherals and development tools. Combined with comprehensive design services, training, support and maintenance, and the company’s broad Partner community, they provide a total system solution that offers a fast, reliable path to market for leading electronics companies. More information on ARM is available at http://www.arm.com. ARM is a registered trademarks of ARM Limited. ARM7, ARM9, ARM11, Cortex and Mali are trademarks of ARM Limited. All other brands or product names are the property of their respective holders. “ARM” is used to represent ARM Holdings plc; its operating company ARM Limited; and the regional subsidiaries: ARM Inc.; ARM KK; ARM Korea Ltd.; ARM Taiwan Limited; ARM France SAS; ARM Consulting (Shanghai) Co. Ltd.; ARM Belgium Services BVBA; ARM Germany GmbH; ARM Embedded Technologies Pvt. Ltd.; ARM Norway AS; and ARM Sweden AB.