ARM-ETM Trace - Lauterbach · ARM-ETM Trace 6 ©1989-2019 Lauterbach GmbH Recommendation for Power...
211
ARM-ETM Trace 1 ©1989-2019 Lauterbach GmbH ARM-ETM Trace TRACE32 Online Help TRACE32 Directory TRACE32 Index TRACE32 Documents ...................................................................................................................... ICD In-Circuit Debugger ................................................................................................................ Processor Architecture Manuals .............................................................................................. ARM/CORTEX/XSCALE ........................................................................................................... ARM-ETM Trace .................................................................................................................... 1 History ................................................................................................................................ 5 Installation ......................................................................................................................... 5 Software Installation 5 Recommendation for Starting the Software 5 Recommendation for Power Down 6 Hardware Installation 6 ETM Preprocessor Hardware Versions 7 Preprocessor for ARM-ETM 120 (LA-7889) 10 Preprocessor for ARM-ETM 200 (LA-7921) 11 Preprocessor for ETM 2-MICTOR (LA-7923) 12 Preprocessor for ARM-ETM Autofocus (LA-7991) 13 External Termination PCB (delivered before 2006) 15 Preprocessor for ARM-ETM Autofocus II (LA-7992) 17 Preprocessor for ARM-ETM Autofocus MIPI (LA-7993) 18 Preprocessor for ARM-ETM HSSTP (LA-7988) 19 PowerTrace Serial 4 GigaByte for ARM-ETM HSSTP and PCIe 20 Utilization of the ETM ........................................................................................................ 21 Startup Script 21 Example ETMv1 21 Example HSSTP 22 Loading and Storing Settings 24 Displaying Trace Results 26 Programmer’s Model of the ETM 29 Supported Features 29 ETM Registers 30 Programming 31 ETM Commands ................................................................................................................ 32 ETM Embedded Trace Macrocell (ETM) 32
Transcript of ARM-ETM Trace - Lauterbach · ARM-ETM Trace 6 ©1989-2019 Lauterbach GmbH Recommendation for Power...
ARM-ETM Trace
TRACE32 Online Help
TRACE32 Directory
TRACE32 Index
TRACE32 Documents ......................................................................................................................
ICD In-Circuit Debugger ................................................................................................................
Processor Architecture Manuals ..............................................................................................
ARM/CORTEX/XSCALE ...........................................................................................................
ARM-ETM Trace .................................................................................................................... 1
History ................................................................................................................................ 5
Installation ......................................................................................................................... 5
Software Installation 5
Recommendation for Starting the Software 5
Recommendation for Power Down 6
Hardware Installation 6
ETM Preprocessor Hardware Versions 7
Preprocessor for ARM-ETM 120 (LA-7889) 10
Preprocessor for ARM-ETM 200 (LA-7921) 11
Preprocessor for ETM 2-MICTOR (LA-7923) 12
Preprocessor for ARM-ETM Autofocus (LA-7991) 13
External Termination PCB (delivered before 2006) 15
Preprocessor for ARM-ETM Autofocus II (LA-7992) 17
Preprocessor for ARM-ETM Autofocus MIPI (LA-7993) 18
Preprocessor for ARM-ETM HSSTP (LA-7988) 19
PowerTrace Serial 4 GigaByte for ARM-ETM HSSTP and PCIe 20
Utilization of the ETM ........................................................................................................ 21
Startup Script 21
Example ETMv1 21
Example HSSTP 22
Loading and Storing Settings 24
Displaying Trace Results 26
Programmer’s Model of the ETM 29
Supported Features 29
ETM Registers 30
Programming 31
ETM Commands ................................................................................................................ 32
ETM Embedded Trace Macrocell (ETM) 32
ARM-ETM Trace 1 ©1989-2019 Lauterbach GmbH
ETM.AbsoluteTimestamp Absolute cyclecount pakets 33
ETM.ATBTrigger Use ATB to transfer trace trigger to trace sink 33
ETM.AUXCTLR Set ETMv4 implementation-specific auxiliary control register 36
ETM.BBC Branch address broadcast 36
ETM.BBCExclude Exclude address ranges from branch-broadcasting 37
ETM.BBCInclude Enable branch-broadcasting for dedicated address ranges 37
ETM.CLEAR Clear sequencer settings 38
ETM.CLOCK Set core clock frequency for timing measurements 38
ETM.CORE Select core for ETM 39
ETM.CPRT Monitor coprocessor register transfers 39
ETM.COND Conditional non-branch instructions 40
ETM.ContextID Select the width of the 'ContextID' register 40
ETM.CycleAccurate Cycle accurate tracing 41
ETM.CycleCountThreshold Set granularity for cycle accurate timing info 42
ETM.DataSuppress Suppress data flow to prevent FIFO overflow 42
ETM.DataTrace Configure data-trace 43
ETM.DataTracePrestore Show program trace cycle for data trace cycle 45
ETM.DataViewExclude Suppress data trace for specified address range 46
ETM.DataViewInclude Restrict broadcast of data accesses to range 47
ETM.DBGRQ Debug request control 48
ETM.FifoFullExclude No activation of FIFOFULL in range 48
ETM.FifoFullInclude FIFOFULL only in range 49
ETM.FifoLevel Define FIFO level for FIFOFULL 49
ETM.FunnelHoldTime Define minimum funnel hold time 50
ETM.HalfRate Halfrate mode 50
ETM.LPOVERRIDE Prohibit lower power mode 50
ETM.INSTP0 Load and store instructions 51
ETM.MapDecode Memory map decode control 51
ETM.NoOverflow Enable ETMv4 feature to prevent target FiFo overflows 52
ETM.ON Switch ETM on 52
ETM.OFF Switch ETM off 52
ETM.PortClock Baud rate of serial trace 53
ETM.PortDisable Force trace-port enable signal to zero 54
ETM.PortDisableOnchip Disable ETM trace port when ETB is used 55
ETM.PortFilter Specify utilization of trace memory 55
ETM.PortMode Select ETM mode 56
CoreSight (deprecated) 56
ETM.PortRoute Set up trace hardware 57
ETM.PortSize Define trace port width 57
ETM.PowerUpRequest Power-up request for the ETM by the debugger 58
ETM.ProcID Define 'ProcID' size 58
ETM.PseudoDataTrace Enable pseudo data trace detection 58
ETM.QE Enable Q elements 59
ARM-ETM Trace 2 ©1989-2019 Lauterbach GmbH
ETM.QTraceExclude Prohibit Q trace elements in given address range 60
ETM.QTraceInclude Allow Q trace elements in given address range 60
ETM.RefClock Enable STP reference clock 61
ETM.Register Display the ETM registers 62
ETM.RESet Reset ETM settings 63
ETM.ReserveContextID Reserve special values used with context ID 63
ETM.ReturnStack Enable return stack tracing mode 63
ETM.Set Precise control of ETM trigger events 64
ETM.SmartTrace Configure smart trace 72
ETM.STALL Stall processor to prevent FIFO overflow 75
ETM.state Display ETM settings 76
ETM.StoppingBreakPoints Use ETM comparators for breakpoints 77
ETM.SyncPeriod Set synchronization frequency 80
ETM.TDelay Define trigger delay 80
ETM.TImeMode Improve ETM/PTM timestamp information 81
ETM.TimeStampCLOCK Specify frequency of the global timestamp 86
ETM.TimeStamps Control for global timestamp packets 86
ETM.TimeStampsTrace Specify data trace correlation method (ETMv4) 87
ETM.Trace Control generation of trace information 87
ETM.TraceERRor Force ETM to emit all system error exceptions 88
ETM.TraceExclude Suppress program trace for specified address range 89
ETM.TraceID Change the default ID for an ETM trace source 90
ETM.TraceInclude Restrict program trace to specified address range 90
ETM.TraceNoPCREL No data trace for accesses relative to program counter 91
ETM.TraceNoSPREL No data trace for accesses relative to stack pointer 91
ETM.TracePriority Define priority of ETM 92
ETM.TraceRESet Forces the ETM to emit all core resets 92
ETM.TRCIDR Define TRCIDR register values for simulator 93
ETM.VMID Virtual machine ID tracing 93
Keywords for the Trace Display ....................................................................................... 94
Examples for Trace Controlling 95
Tracing of a Specified Address Range 95
Tracing of Specified Data 95
Trigger at Address Access 95
Tracing of a Defined Amount of Cycles 96
Runtime Measurement of a Function 96
Trace Setup for RealTime OS 97
Basics 97
Trace Setup for LINUX 97
FAQ ..................................................................................................................................... 98
Diagnosis ........................................................................................................................... 101
Error Diagnosis 101
ARM-ETM Trace 3 ©1989-2019 Lauterbach GmbH
Searching for Errors 102
Error Messages 104
HARDERRORS 104
FLOWERRORS 104
FIFOFULL 105
Trace Test Failed Messages 105
Diagnosis Check List 106
Basic Checks 106
Advanced Check for ETMv1.x 113
Advanced Check for ETMv3.x 117
Timing Requirements 120
ARM-ETM (LA-7921, LA-7990) 123
Configuration Test 123
ARM-ETM AUTOFOCUS (LA-7991/LA-7992) 124
Access the Diagnosis Tool 124
Diagnosis Check List 125
How to understand A.ShowFocusEye and A.ShowFocusClockEye 130
ARM-ETM HSSTP (LA-7988) 133
Support Request 134
Recommendations for Target Board Design 135
Technical Data ................................................................................................................... 137
Operation Voltage 137
Operation Frequency 137
Dimensions 160
Adapters 171
Connector Layout 172
ETMv1/2 172
ETMv1/2 with Multiplexed Mode 172
ETMv1/2 with 4 bit Demultiplexed Mode 173
ETMv1/2 with 8/16 bit Demultiplexed Mode 174
Dual ETMv1/2 175
ETMv3 / ETMv4 / PFTv1 176
20 pin JTAG Connector 177
Support ............................................................................................................................... 178
Available Tools 178
Compilers 202
Target Operating Systems 203
3rd-Party Tool Integrations 205
Products ............................................................................................................................. 207
Product Information 207
Order Information 210
ARM-ETM Trace 4 ©1989-2019 Lauterbach GmbH
ARM-ETM Trace
Version 06-Nov-2019
History
01-Aug-2018 Info about PowerTrace Serial HSSTP and PCIe added.
Installation
Software Installation
The TRACE32 software for the ARM debugger includes support for the ETM trace. No extra software installation for the ARM-ETM trace is required.
Recommendation for Starting the Software
• Disconnect the debug cable from the target while the target power is off.
• Connect the host system, the TRACE32 hardware and the debug cable.
• Start the TRACE32 software.
• If possible connect the debug cable directly to the target. If there is no appropriate jack on your target, you can also connect it to the preprocessor.
• Connect the preprocessor to your target's trace port by using the mictor flex extension delivered with your preprocessor. For port sizes greater 16 bit you need to connect port "Trace B" as well, using a second mictor flex extension (LA-7991, LA-7992 and LA-7923 only).
NOTE: The second flex extension has to be ordered additionally.
• Switch the target power ON.
• Run your start-up script.
• If supported by your preprocessor execute Analyzer.AutoFocus
ARM-ETM Trace 5 ©1989-2019 Lauterbach GmbH
Recommendation for Power Down
• Switch off the target power.
• Disconnect the debug cable and mictor flex extension from the target.
Hardware Installation
If a RISC TRACE module is used, please connect the PODBUS IN connector of the RISC TRACE module to the PODBUS OUT connector of the (POWER) DEBUG INTERFACE.
If a POWER TRACE PX or POWER TRACE II is used please connect it to a POWER DEBUG PRO or POWER DEBUG II via the "PODBUS EXPRESS" connectors.
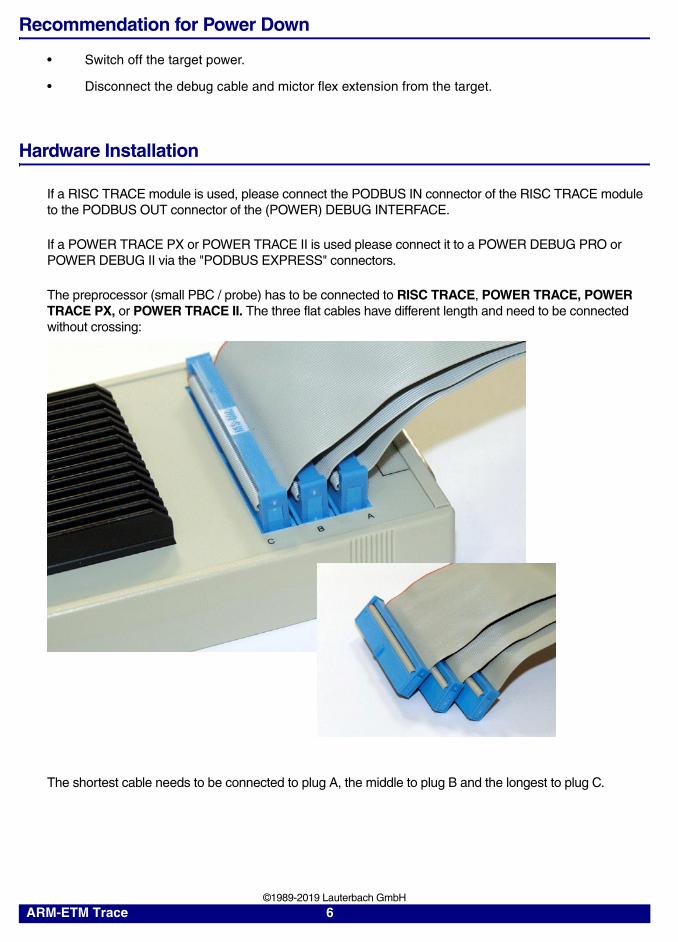
The preprocessor (small PBC / probe) has to be connected to RISC TRACE, POWER TRACE, POWER TRACE PX, or POWER TRACE II. The three flat cables have different length and need to be connected without crossing:
The shortest cable needs to be connected to plug A, the middle to plug B and the longest to plug C.
ARM-ETM Trace 6 ©1989-2019 Lauterbach GmbH
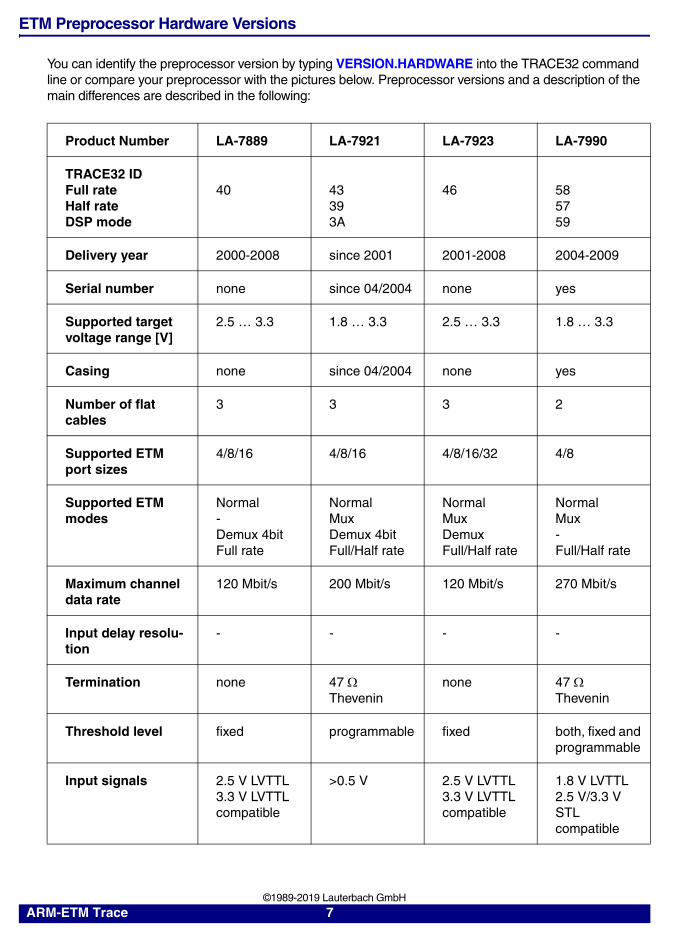
ETM Preprocessor Hardware Versions
You can identify the preprocessor version by typing VERSION.HARDWARE into the TRACE32 command line or compare your preprocessor with the pictures below. Preprocessor versions and a description of the main differences are described in the following:
Product Number LA-7889 LA-7921 LA-7923 LA-7990
TRACE32 IDFull rateHalf rateDSP mode
40 43393A
46 585759
Delivery year 2000-2008 since 2001 2001-2008 2004-2009
Serial number none since 04/2004 none yes
Supported target voltage range [V]
2.5 … 3.3 1.8 … 3.3 2.5 … 3.3 1.8 … 3.3
Casing none since 04/2004 none yes
Number of flat cables
3 3 3 2
Supported ETM port sizes
4/8/16 4/8/16 4/8/16/32 4/8
Supported ETM modes
Normal-Demux 4bitFull rate
NormalMuxDemux 4bitFull/Half rate
NormalMuxDemuxFull/Half rate
NormalMux-Full/Half rate
Maximum channel data rate
120 Mbit/s 200 Mbit/s 120 Mbit/s 270 Mbit/s
Input delay resolu-tion
- - - -
Termination none 47 Thevenin
none 47 Thevenin
Threshold level fixed programmable fixed both, fixed and programmable
Input signals 2.5 V LVTTL 3.3 V LVTTL compatible
>0.5 V 2.5 V LVTTL 3.3 V LVTTL compatible
1.8 V LVTTL 2.5 V/3.3 V STL compatible
ARM-ETM Trace 7 ©1989-2019 Lauterbach GmbH

Product Number LA-7991 LA-7991 LA-7991 LA-7992
TRACE32 ID 70 (OTP) 70 70 71
Delivery year 11/2004-12/2005
06-09/2005 since 08/2005 since 2006
Serial number yes yes yes yes
Supported target voltage range [V]
1.8 … 5 1.8 … 5 1.8 … 3.3 1.8 … 3.3
Casing yes yes yes yes (with fan)
Number of ribbon cables
3 3 3 3
Supported ETM port sizes [bit]
4/8/16/32 4/8/16/32 4/8/16/32 4/8/16/32
Supported ETM modes
NormalMuxDemuxFull/Half rate
NormalMuxDemuxFull/Half rate
NormalMuxDemuxFull/Half rate
NormalMuxDemuxFull/Half rateContinuous
Maximum linedata rate
300 Mbit/s 350 Mbit/s 350 Mbit/s 600 Mbit/s
Input delay resolu-tion
- - 480 ps 78 ps
Termination pluggable pluggable 47 Thevenin
47 Thevenin
Threshold level programmable programmable programmable programmable
Input signals > 0.5 V >0.5V >0.5 V >0.5 V
ARM-ETM Trace 8 ©1989-2019 Lauterbach GmbH
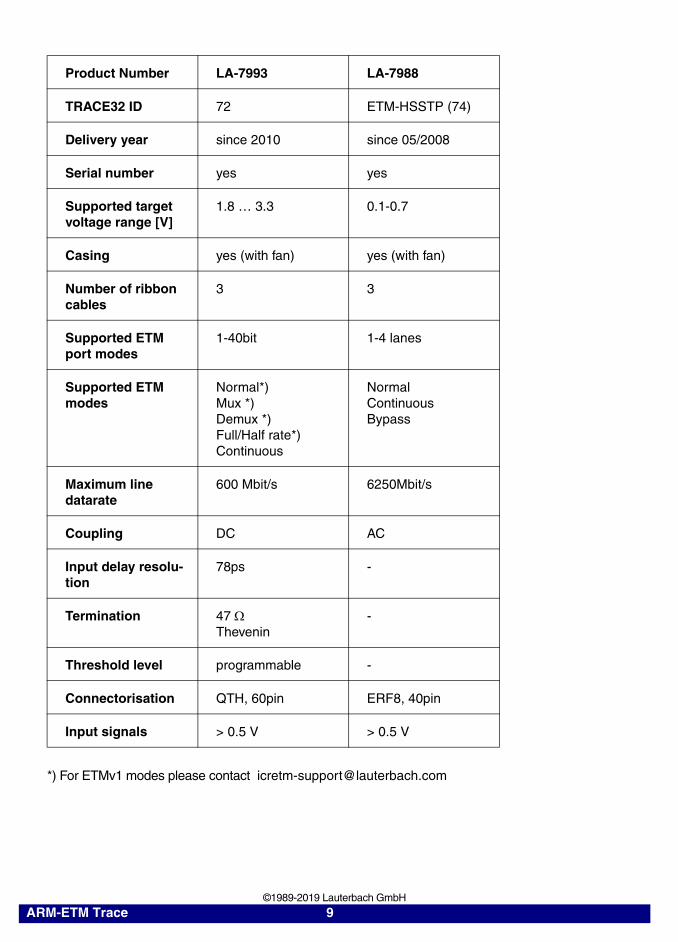
*) For ETMv1 modes please contact [email protected]
Product Number LA-7993 LA-7988
TRACE32 ID 72 ETM-HSSTP (74)
Delivery year since 2010 since 05/2008
Serial number yes yes
Supported target voltage range [V]
1.8 … 3.3 0.1-0.7
Casing yes (with fan) yes (with fan)
Number of ribbon cables
3 3
Supported ETM port modes
1-40bit 1-4 lanes
Supported ETM modes
Normal*)Mux *)Demux *)Full/Half rate*)Continuous
NormalContinuousBypass
Maximum linedatarate
600 Mbit/s 6250Mbit/s
Coupling DC AC
Input delay resolu-tion
78ps -
Termination 47 Thevenin
-
Threshold level programmable -
Connectorisation QTH, 60pin ERF8, 40pin
Input signals > 0.5 V > 0.5 V
ARM-ETM Trace 9 ©1989-2019 Lauterbach GmbH
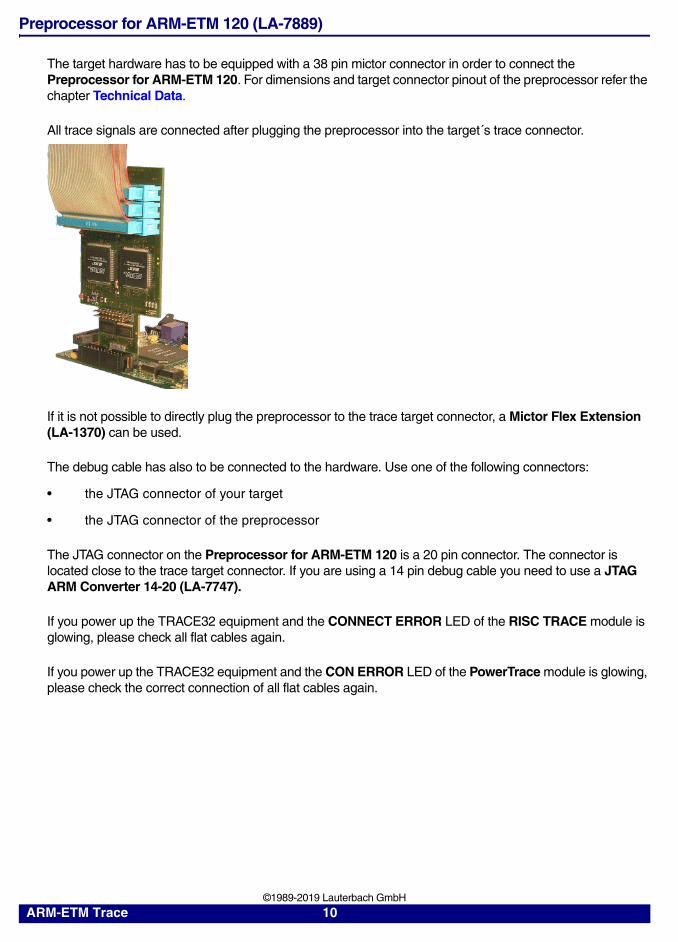
Preprocessor for ARM-ETM 120 (LA-7889)
The target hardware has to be equipped with a 38 pin mictor connector in order to connect the Preprocessor for ARM-ETM 120. For dimensions and target connector pinout of the preprocessor refer the chapter Technical Data.
All trace signals are connected after plugging the preprocessor into the target´s trace connector.
If it is not possible to directly plug the preprocessor to the trace target connector, a Mictor Flex Extension (LA-1370) can be used.
The debug cable has also to be connected to the hardware. Use one of the following connectors:
• the JTAG connector of your target
• the JTAG connector of the preprocessor
The JTAG connector on the Preprocessor for ARM-ETM 120 is a 20 pin connector. The connector is located close to the trace target connector. If you are using a 14 pin debug cable you need to use a JTAG ARM Converter 14-20 (LA-7747).
If you power up the TRACE32 equipment and the CONNECT ERROR LED of the RISC TRACE module is glowing, please check all flat cables again.
If you power up the TRACE32 equipment and the CON ERROR LED of the PowerTrace module is glowing, please check the correct connection of all flat cables again.
ARM-ETM Trace 10 ©1989-2019 Lauterbach GmbH
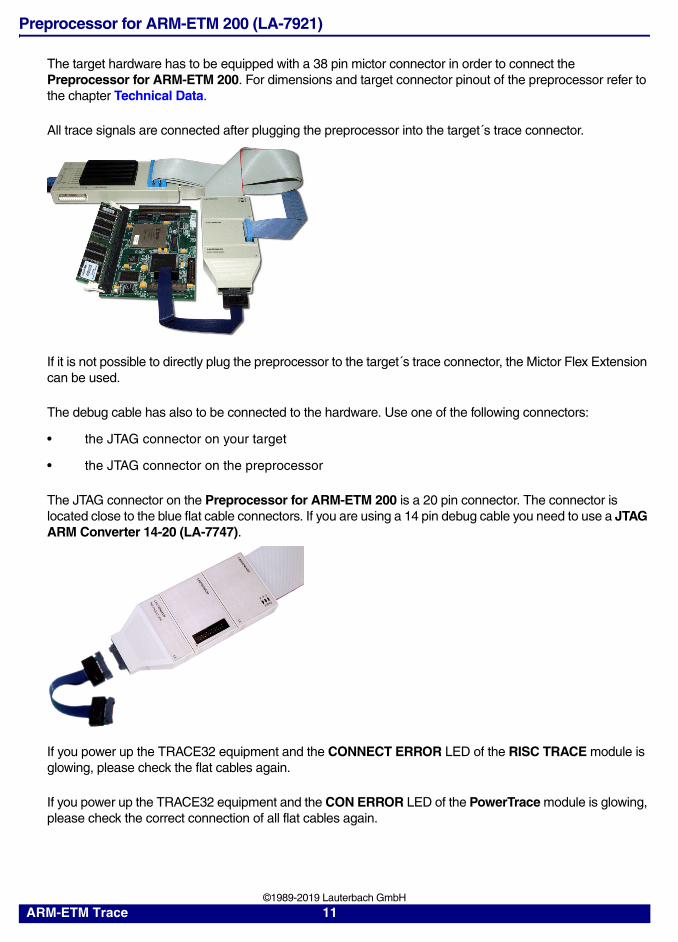
Preprocessor for ARM-ETM 200 (LA-7921)
The target hardware has to be equipped with a 38 pin mictor connector in order to connect the Preprocessor for ARM-ETM 200. For dimensions and target connector pinout of the preprocessor refer to the chapter Technical Data.
All trace signals are connected after plugging the preprocessor into the target´s trace connector.
If it is not possible to directly plug the preprocessor to the target´s trace connector, the Mictor Flex Extension can be used.
The debug cable has also to be connected to the hardware. Use one of the following connectors:
• the JTAG connector on your target
• the JTAG connector on the preprocessor
The JTAG connector on the Preprocessor for ARM-ETM 200 is a 20 pin connector. The connector is located close to the blue flat cable connectors. If you are using a 14 pin debug cable you need to use a JTAG ARM Converter 14-20 (LA-7747).
If you power up the TRACE32 equipment and the CONNECT ERROR LED of the RISC TRACE module is glowing, please check the flat cables again.
If you power up the TRACE32 equipment and the CON ERROR LED of the PowerTrace module is glowing, please check the correct connection of all flat cables again.
ARM-ETM Trace 11 ©1989-2019 Lauterbach GmbH
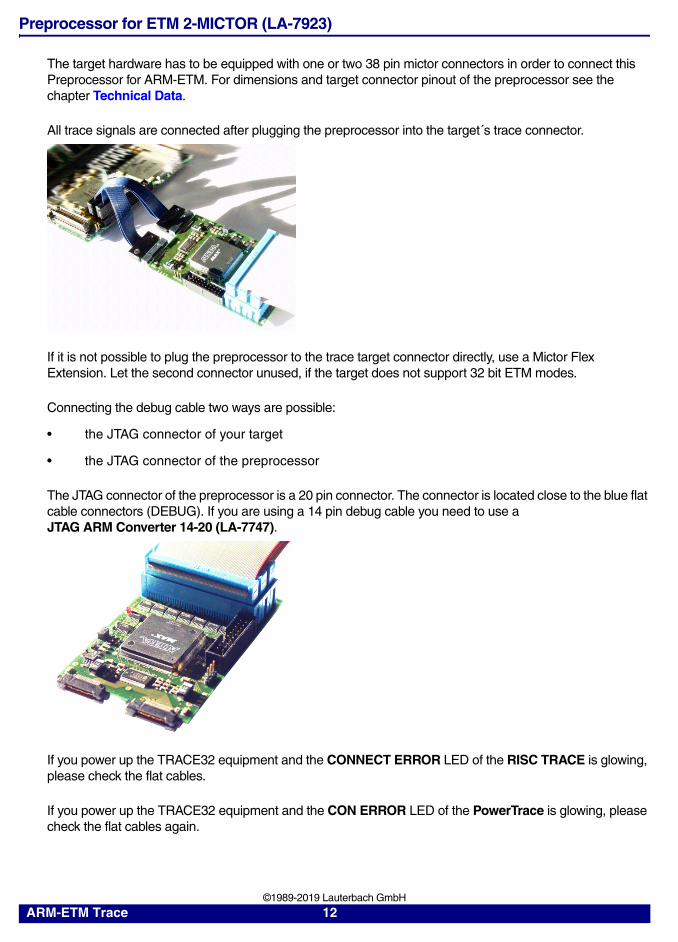
Preprocessor for ETM 2-MICTOR (LA-7923)
The target hardware has to be equipped with one or two 38 pin mictor connectors in order to connect this Preprocessor for ARM-ETM. For dimensions and target connector pinout of the preprocessor see the chapter Technical Data.
All trace signals are connected after plugging the preprocessor into the target´s trace connector.
If it is not possible to plug the preprocessor to the trace target connector directly, use a Mictor Flex Extension. Let the second connector unused, if the target does not support 32 bit ETM modes.
Connecting the debug cable two ways are possible:
• the JTAG connector of your target
• the JTAG connector of the preprocessor
The JTAG connector of the preprocessor is a 20 pin connector. The connector is located close to the blue flat cable connectors (DEBUG). If you are using a 14 pin debug cable you need to use a JTAG ARM Converter 14-20 (LA-7747).
If you power up the TRACE32 equipment and the CONNECT ERROR LED of the RISC TRACE is glowing, please check the flat cables.
If you power up the TRACE32 equipment and the CON ERROR LED of the PowerTrace is glowing, please check the flat cables again.
ARM-ETM Trace 12 ©1989-2019 Lauterbach GmbH
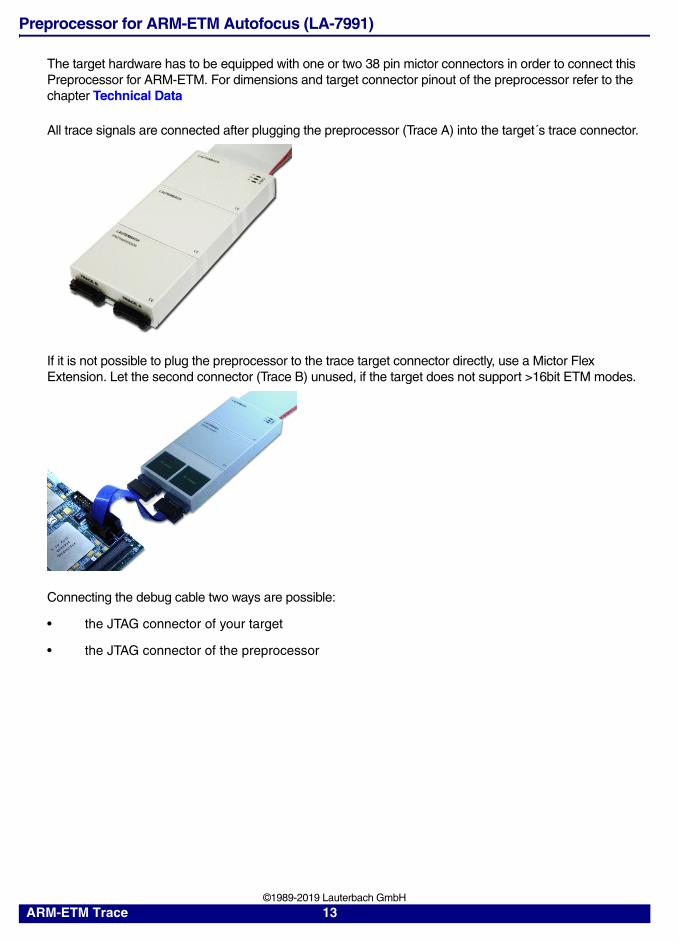
Preprocessor for ARM-ETM Autofocus (LA-7991)
The target hardware has to be equipped with one or two 38 pin mictor connectors in order to connect this Preprocessor for ARM-ETM. For dimensions and target connector pinout of the preprocessor refer to the chapter Technical Data
All trace signals are connected after plugging the preprocessor (Trace A) into the target´s trace connector.
If it is not possible to plug the preprocessor to the trace target connector directly, use a Mictor Flex Extension. Let the second connector (Trace B) unused, if the target does not support >16bit ETM modes.
Connecting the debug cable two ways are possible:
• the JTAG connector of your target
• the JTAG connector of the preprocessor
ARM-ETM Trace 13 ©1989-2019 Lauterbach GmbH
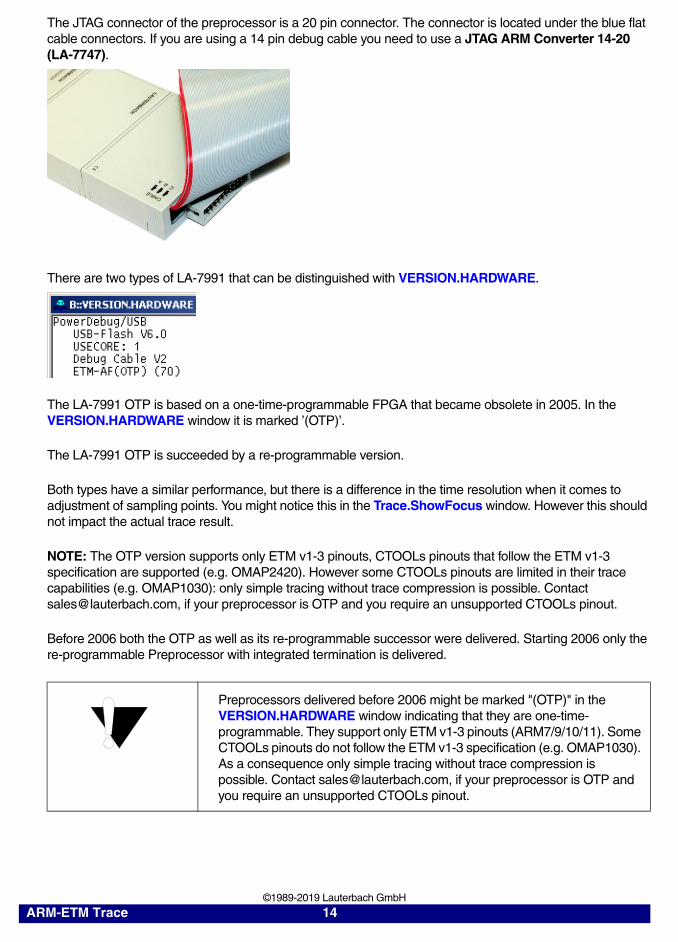
The JTAG connector of the preprocessor is a 20 pin connector. The connector is located under the blue flat cable connectors. If you are using a 14 pin debug cable you need to use a JTAG ARM Converter 14-20(LA-7747).
There are two types of LA-7991 that can be distinguished with VERSION.HARDWARE.
The LA-7991 OTP is based on a one-time-programmable FPGA that became obsolete in 2005. In the VERSION.HARDWARE window it is marked ’(OTP)’.
The LA-7991 OTP is succeeded by a re-programmable version.
Both types have a similar performance, but there is a difference in the time resolution when it comes to adjustment of sampling points. You might notice this in the Trace.ShowFocus window. However this should not impact the actual trace result.
NOTE: The OTP version supports only ETM v1-3 pinouts, CTOOLs pinouts that follow the ETM v1-3 specification are supported (e.g. OMAP2420). However some CTOOLs pinouts are limited in their trace capabilities (e.g. OMAP1030): only simple tracing without trace compression is possible. Contact [email protected], if your preprocessor is OTP and you require an unsupported CTOOLs pinout.
Before 2006 both the OTP as well as its re-programmable successor were delivered. Starting 2006 only the re-programmable Preprocessor with integrated termination is delivered.
Preprocessors delivered before 2006 might be marked "(OTP)" in the VERSION.HARDWARE window indicating that they are one-time-programmable. They support only ETM v1-3 pinouts (ARM7/9/10/11). Some CTOOLs pinouts do not follow the ETM v1-3 specification (e.g. OMAP1030). As a consequence only simple tracing without trace compression is possible. Contact [email protected], if your preprocessor is OTP and you require an unsupported CTOOLs pinout.
ARM-ETM Trace 14 ©1989-2019 Lauterbach GmbH
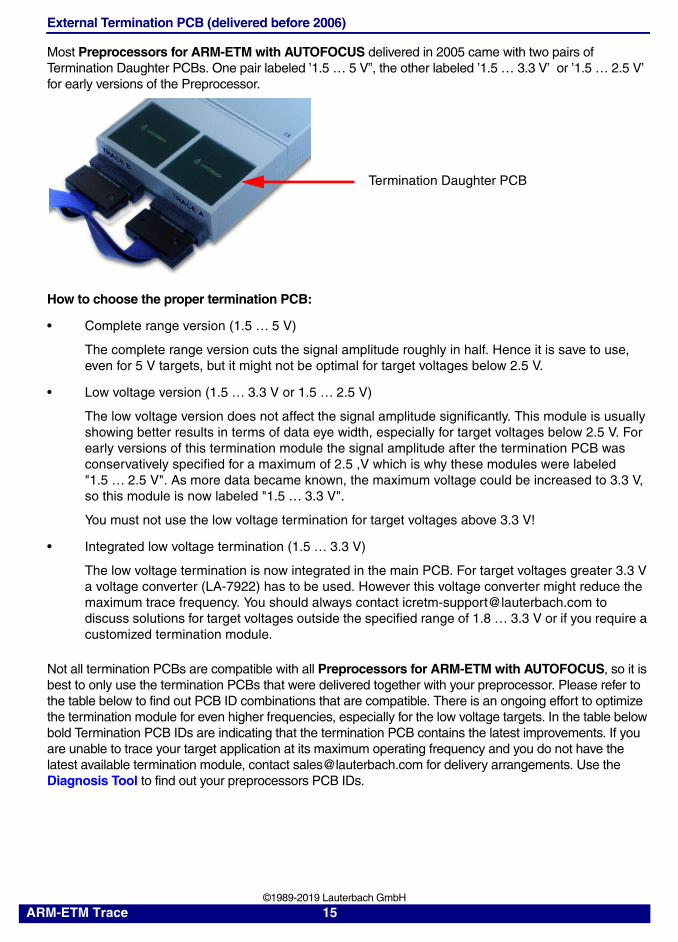
External Termination PCB (delivered before 2006)
Most Preprocessors for ARM-ETM with AUTOFOCUS delivered in 2005 came with two pairs of Termination Daughter PCBs. One pair labeled ’1.5 … 5 V”, the other labeled ’1.5 … 3.3 V’ or ’1.5 … 2.5 V’ for early versions of the Preprocessor.
How to choose the proper termination PCB:
• Complete range version (1.5 … 5 V)
The complete range version cuts the signal amplitude roughly in half. Hence it is save to use, even for 5 V targets, but it might not be optimal for target voltages below 2.5 V.
• Low voltage version (1.5 … 3.3 V or 1.5 … 2.5 V)
The low voltage version does not affect the signal amplitude significantly. This module is usually showing better results in terms of data eye width, especially for target voltages below 2.5 V. For early versions of this termination module the signal amplitude after the termination PCB was conservatively specified for a maximum of 2.5 ,V which is why these modules were labeled "1.5 … 2.5 V". As more data became known, the maximum voltage could be increased to 3.3 V, so this module is now labeled "1.5 … 3.3 V".
You must not use the low voltage termination for target voltages above 3.3 V!
• Integrated low voltage termination (1.5 … 3.3 V)
The low voltage termination is now integrated in the main PCB. For target voltages greater 3.3 V a voltage converter (LA-7922) has to be used. However this voltage converter might reduce the maximum trace frequency. You should always contact [email protected] to discuss solutions for target voltages outside the specified range of 1.8 … 3.3 V or if you require a customized termination module.
Not all termination PCBs are compatible with all Preprocessors for ARM-ETM with AUTOFOCUS, so it is best to only use the termination PCBs that were delivered together with your preprocessor. Please refer to the table below to find out PCB ID combinations that are compatible. There is an ongoing effort to optimize the termination module for even higher frequencies, especially for the low voltage targets. In the table below bold Termination PCB IDs are indicating that the termination PCB contains the latest improvements. If you are unable to trace your target application at its maximum operating frequency and you do not have the latest available termination module, contact [email protected] for delivery arrangements. Use the Diagnosis Tool to find out your preprocessors PCB IDs.
Termination Daughter PCB
ARM-ETM Trace 15 ©1989-2019 Lauterbach GmbH
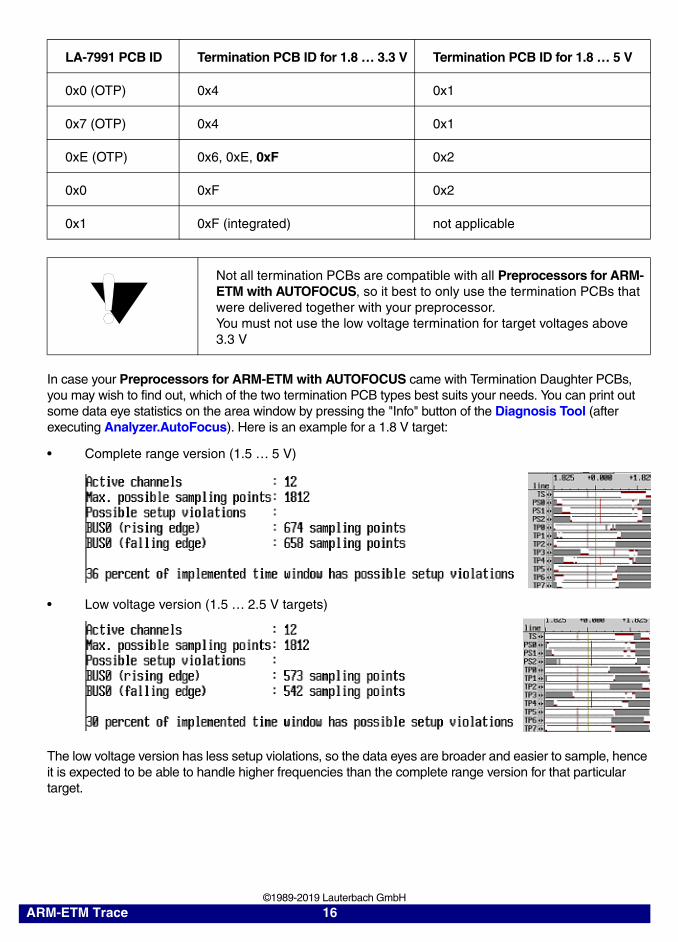
In case your Preprocessors for ARM-ETM with AUTOFOCUS came with Termination Daughter PCBs, you may wish to find out, which of the two termination PCB types best suits your needs. You can print out some data eye statistics on the area window by pressing the "Info" button of the Diagnosis Tool (after executing Analyzer.AutoFocus). Here is an example for a 1.8 V target:
• Complete range version (1.5 … 5 V)
• Low voltage version (1.5 … 2.5 V targets)
The low voltage version has less setup violations, so the data eyes are broader and easier to sample, hence it is expected to be able to handle higher frequencies than the complete range version for that particular target.
LA-7991 PCB ID Termination PCB ID for 1.8 … 3.3 V Termination PCB ID for 1.8 … 5 V
0x0 (OTP) 0x4 0x1
0x7 (OTP) 0x4 0x1
0xE (OTP) 0x6, 0xE, 0xF 0x2
0x0 0xF 0x2
0x1 0xF (integrated) not applicable
Not all termination PCBs are compatible with all Preprocessors for ARM-ETM with AUTOFOCUS, so it best to only use the termination PCBs that were delivered together with your preprocessor.You must not use the low voltage termination for target voltages above 3.3 V
ARM-ETM Trace 16 ©1989-2019 Lauterbach GmbH
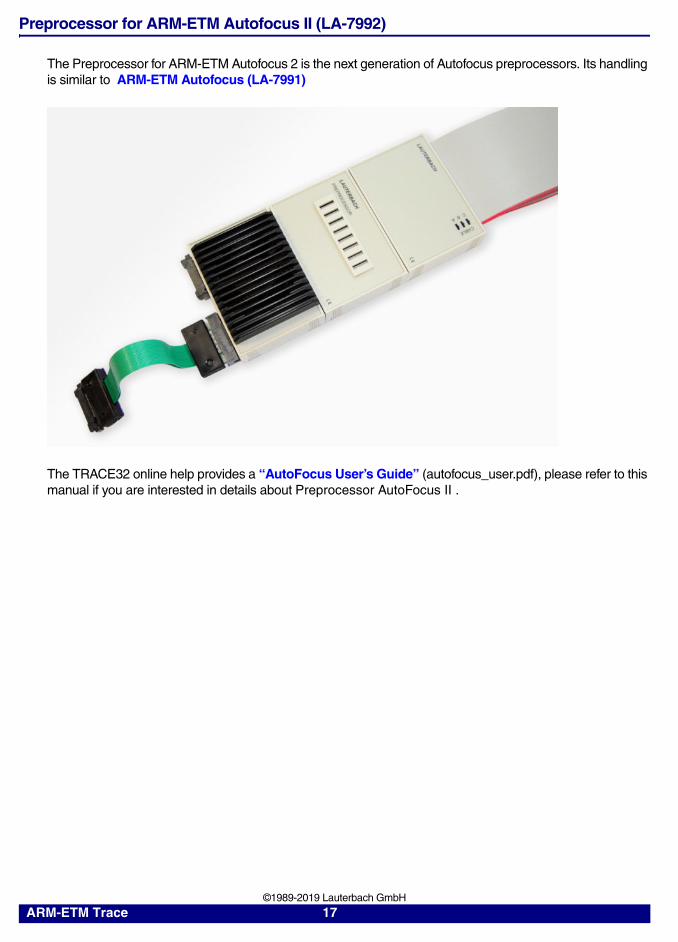
Preprocessor for ARM-ETM Autofocus II (LA-7992)
The Preprocessor for ARM-ETM Autofocus 2 is the next generation of Autofocus preprocessors. Its handling is similar to ARM-ETM Autofocus (LA-7991)
The TRACE32 online help provides a “AutoFocus User’s Guide” (autofocus_user.pdf), please refer to this manual if you are interested in details about Preprocessor AutoFocus II .
ARM-ETM Trace 17 ©1989-2019 Lauterbach GmbH
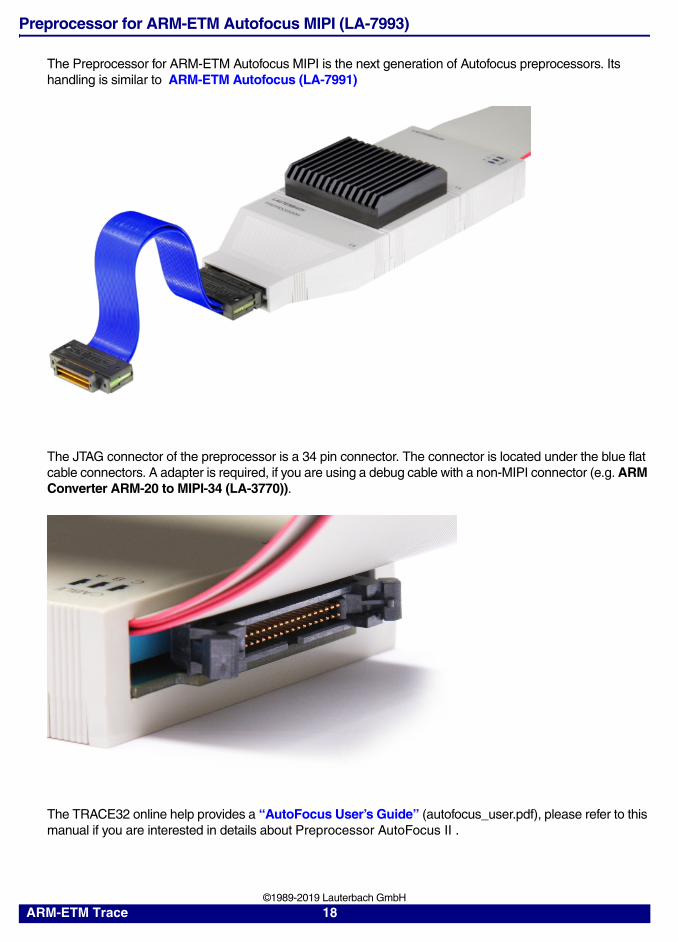
Preprocessor for ARM-ETM Autofocus MIPI (LA-7993)
The Preprocessor for ARM-ETM Autofocus MIPI is the next generation of Autofocus preprocessors. Its handling is similar to ARM-ETM Autofocus (LA-7991)
The JTAG connector of the preprocessor is a 34 pin connector. The connector is located under the blue flat cable connectors. A adapter is required, if you are using a debug cable with a non-MIPI connector (e.g. ARM Converter ARM-20 to MIPI-34 (LA-3770)).
The TRACE32 online help provides a “AutoFocus User’s Guide” (autofocus_user.pdf), please refer to this manual if you are interested in details about Preprocessor AutoFocus II .
ARM-ETM Trace 18 ©1989-2019 Lauterbach GmbH
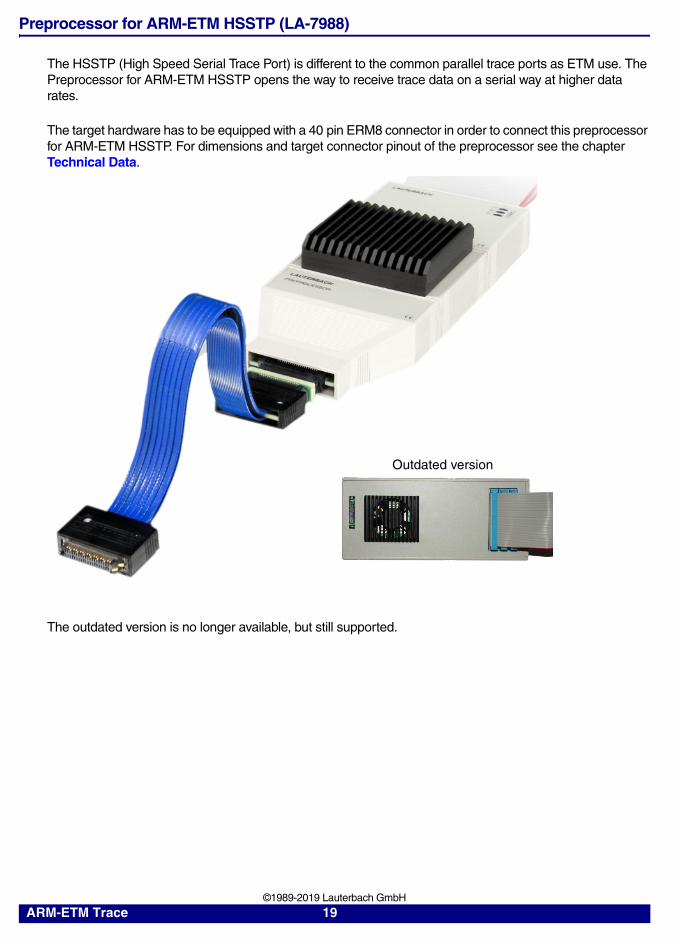
Preprocessor for ARM-ETM HSSTP (LA-7988)
The HSSTP (High Speed Serial Trace Port) is different to the common parallel trace ports as ETM use. The Preprocessor for ARM-ETM HSSTP opens the way to receive trace data on a serial way at higher data rates.
The target hardware has to be equipped with a 40 pin ERM8 connector in order to connect this preprocessor for ARM-ETM HSSTP. For dimensions and target connector pinout of the preprocessor see the chapter Technical Data.
The outdated version is no longer available, but still supported.
Outdated version
ARM-ETM Trace 19 ©1989-2019 Lauterbach GmbH
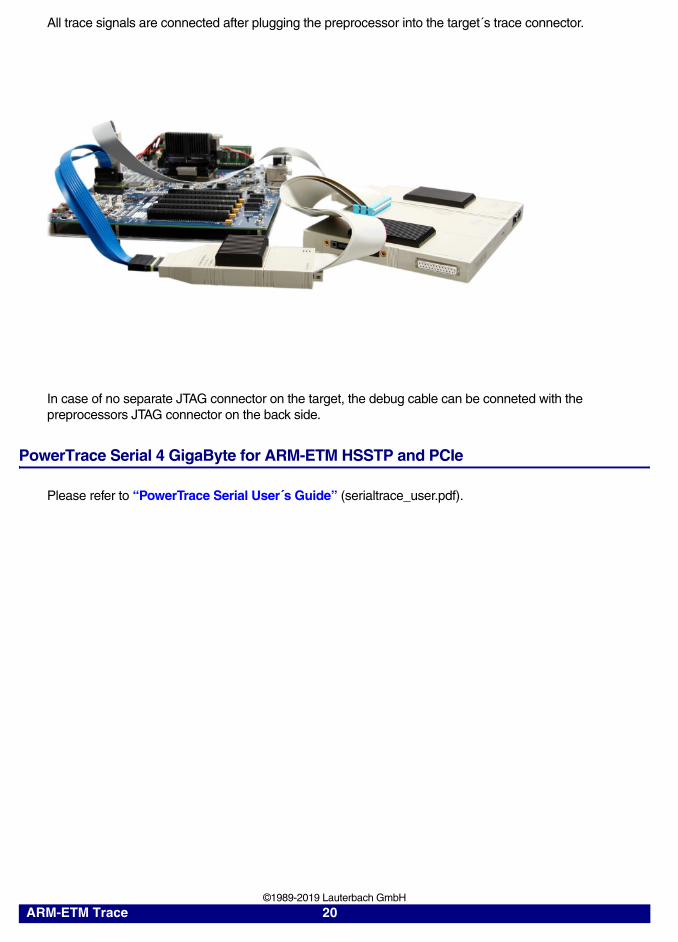
All trace signals are connected after plugging the preprocessor into the target´s trace connector.
In case of no separate JTAG connector on the target, the debug cable can be conneted with the preprocessors JTAG connector on the back side.
PowerTrace Serial 4 GigaByte for ARM-ETM HSSTP and PCIe
Please refer to “PowerTrace Serial User´s Guide” (serialtrace_user.pdf).
ARM-ETM Trace 20 ©1989-2019 Lauterbach GmbH
Utilization of the ETM
Startup Script
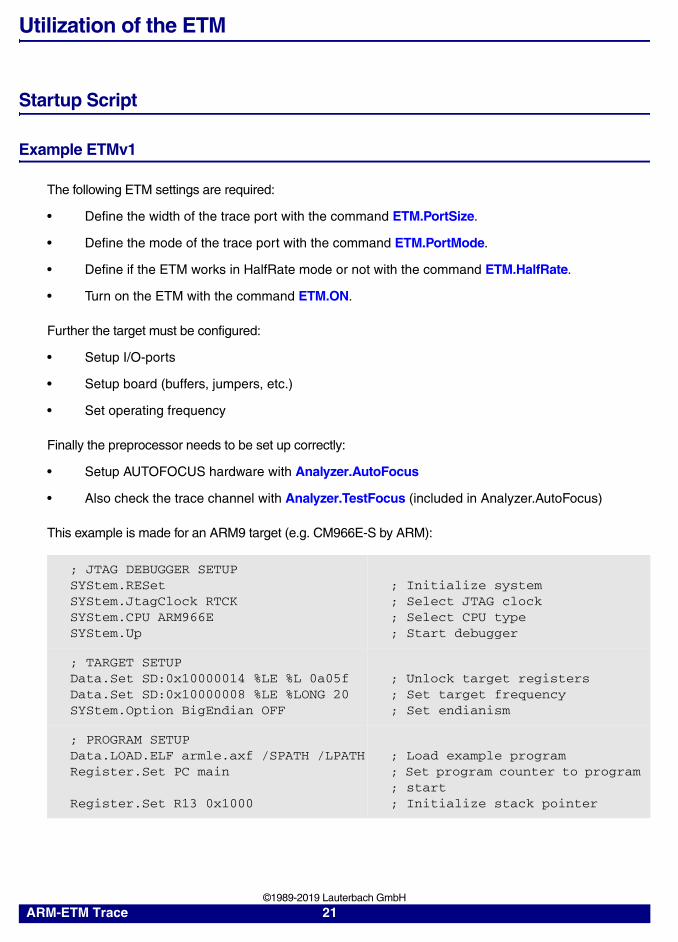
Example ETMv1
The following ETM settings are required:
• Define the width of the trace port with the command ETM.PortSize.
• Define the mode of the trace port with the command ETM.PortMode.
• Define if the ETM works in HalfRate mode or not with the command ETM.HalfRate.
• Turn on the ETM with the command ETM.ON.
Further the target must be configured:
• Setup I/O-ports
• Setup board (buffers, jumpers, etc.)
• Set operating frequency
Finally the preprocessor needs to be set up correctly:
• Setup AUTOFOCUS hardware with Analyzer.AutoFocus
• Also check the trace channel with Analyzer.TestFocus (included in Analyzer.AutoFocus)
This example is made for an ARM9 target (e.g. CM966E-S by ARM):
; JTAG DEBUGGER SETUPSYStem.RESetSYStem.JtagClock RTCKSYStem.CPU ARM966ESYStem.Up
; Initialize system; Select JTAG clock; Select CPU type; Start debugger
; TARGET SETUPData.Set SD:0x10000014 %LE %L 0a05fData.Set SD:0x10000008 %LE %LONG 20SYStem.Option BigEndian OFF
; Unlock target registers; Set target frequency; Set endianism
; PROGRAM SETUPData.LOAD.ELF armle.axf /SPATH /LPATHRegister.Set PC main
Register.Set R13 0x1000
; Load example program; Set program counter to program ; start; Initialize stack pointer
ARM-ETM Trace 21 ©1989-2019 Lauterbach GmbH
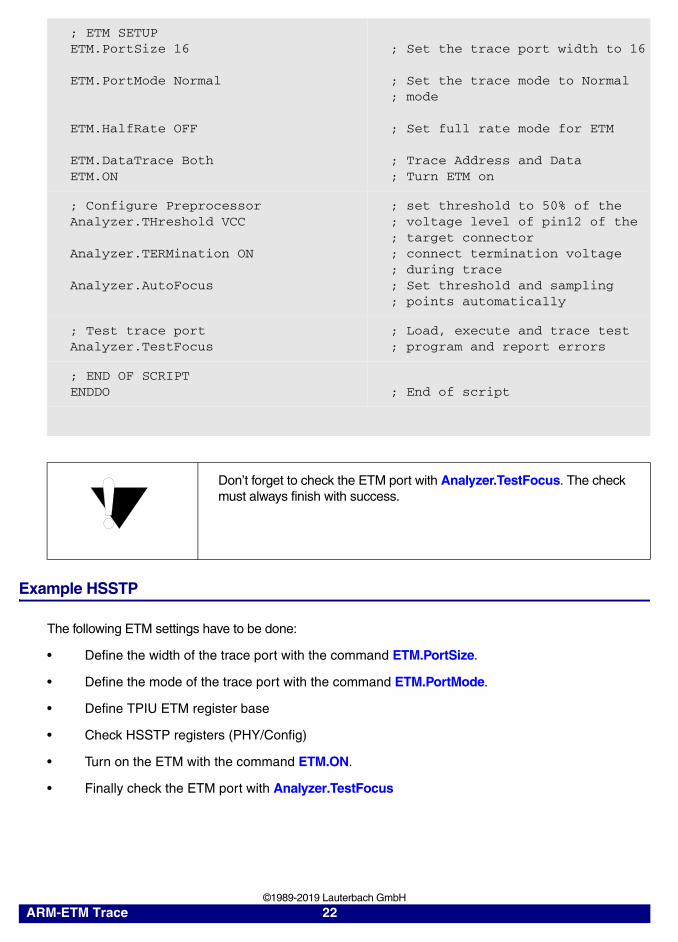
Example HSSTP
The following ETM settings have to be done:
• Define the width of the trace port with the command ETM.PortSize.
• Define the mode of the trace port with the command ETM.PortMode.
• Define TPIU ETM register base
• Check HSSTP registers (PHY/Config)
• Turn on the ETM with the command ETM.ON.
• Finally check the ETM port with Analyzer.TestFocus
; ETM SETUPETM.PortSize 16
ETM.PortMode Normal
ETM.HalfRate OFF
ETM.DataTrace BothETM.ON
; Set the trace port width to 16
; Set the trace mode to Normal; mode
; Set full rate mode for ETM
; Trace Address and Data; Turn ETM on
; Configure PreprocessorAnalyzer.THreshold VCC
Analyzer.TERMination ON
Analyzer.AutoFocus
; set threshold to 50% of the; voltage level of pin12 of the; target connector; connect termination voltage; during trace; Set threshold and sampling; points automatically
; Test trace portAnalyzer.TestFocus
; Load, execute and trace test; program and report errors
; END OF SCRIPTENDDO ; End of script
Don’t forget to check the ETM port with Analyzer.TestFocus. The check must always finish with success.
ARM-ETM Trace 22 ©1989-2019 Lauterbach GmbH
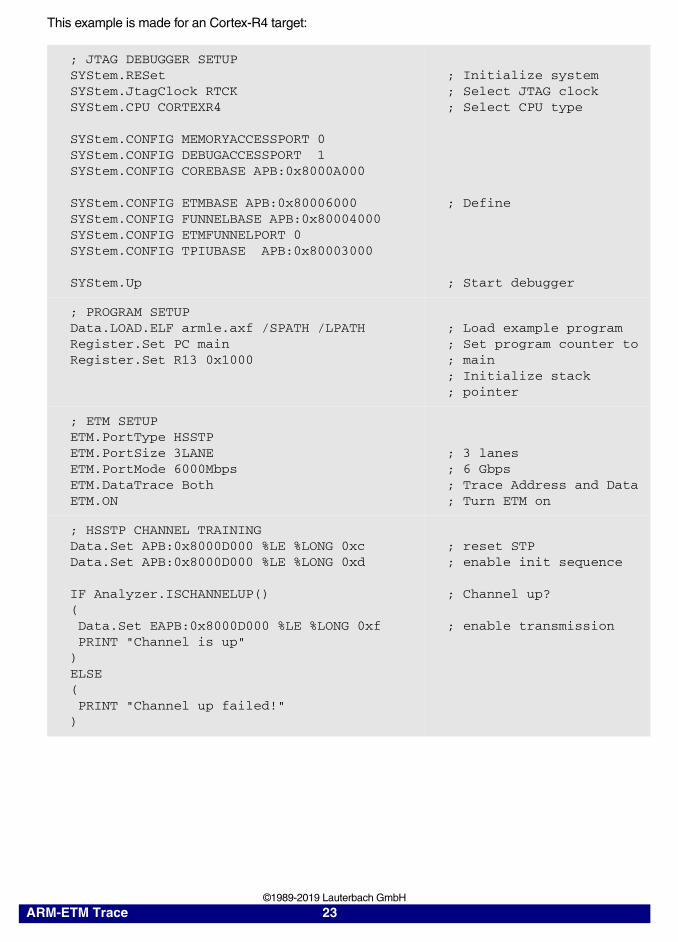
This example is made for an Cortex-R4 target:
; JTAG DEBUGGER SETUPSYStem.RESetSYStem.JtagClock RTCKSYStem.CPU CORTEXR4
SYStem.CONFIG MEMORYACCESSPORT 0SYStem.CONFIG DEBUGACCESSPORT 1SYStem.CONFIG COREBASE APB:0x8000A000
SYStem.CONFIG ETMBASE APB:0x80006000SYStem.CONFIG FUNNELBASE APB:0x80004000SYStem.CONFIG ETMFUNNELPORT 0SYStem.CONFIG TPIUBASE APB:0x80003000
SYStem.Up
; Initialize system; Select JTAG clock; Select CPU type
; Define
; Start debugger
; PROGRAM SETUPData.LOAD.ELF armle.axf /SPATH /LPATHRegister.Set PC mainRegister.Set R13 0x1000
; Load example program; Set program counter to ; main; Initialize stack ; pointer
; ETM SETUPETM.PortType HSSTPETM.PortSize 3LANEETM.PortMode 6000MbpsETM.DataTrace BothETM.ON
; 3 lanes; 6 Gbps; Trace Address and Data; Turn ETM on
; HSSTP CHANNEL TRAININGData.Set APB:0x8000D000 %LE %LONG 0xcData.Set APB:0x8000D000 %LE %LONG 0xd
IF Analyzer.ISCHANNELUP()( Data.Set EAPB:0x8000D000 %LE %LONG 0xf PRINT "Channel is up")ELSE( PRINT "Channel up failed!")
; reset STP; enable init sequence
; Channel up?
; enable transmission
ARM-ETM Trace 23 ©1989-2019 Lauterbach GmbH

Loading and Storing Settings
For the Preprocessors ARM-ETM without AUTOFOCUS at the most two settings need to be stored that enable restoring the previous configuration of the Preprocessor: use Analyzer.TERMination ON | OFF and Trace.THreshold <value> to restore settings from previous sessions.
For Preprocessors for ARM-ETM with AUTOFOCUS you can use the Store and Load buttons in the Trace.ShowFocus window to store settings of the current session or restore settings from a previous session.
Pressing the Store button will call STOre <file> AnalyzerFocus and generate a PRACTICE script similar to this:
In following sessions the settings can be restored either by using the Load… button or simply by including the PRACTICE script in your regular setup script.
B::
IF ANALYZER()(
ANALYZER.TERMINATION ON
ANALYZER.THRESHOLD 1.19 0.99
; connect termination voltage; during trace; clock reference voltage; = 1.19 V; data reference voltage; = 0.99 V
ANALYZER.SAMPLE TS -0.219ANALYZER.SAMPLE PS0 -0.219ANALYZER.SAMPLE PS1 +0.365ANALYZER.SAMPLE PS2 +0.365ANALYZER.SAMPLE TP0 -1.387ANALYZER.SAMPLE TP1 -1.387ANALYZER.SAMPLE TP2 -1.387ANALYZER.SAMPLE TP3 -1.387ANALYZER.SAMPLE TP4 -0.803ANALYZER.SAMPLE TP5 -1.387ANALYZER.SAMPLE TP6 -1.387ANALYZER.SAMPLE TP7 -1.387
)
; Store trace channel sampling; points
ENDDO ; End of script
Trace.ShowFocus as it appears for a re-programmable LA-7991
ARM-ETM Trace 24 ©1989-2019 Lauterbach GmbH
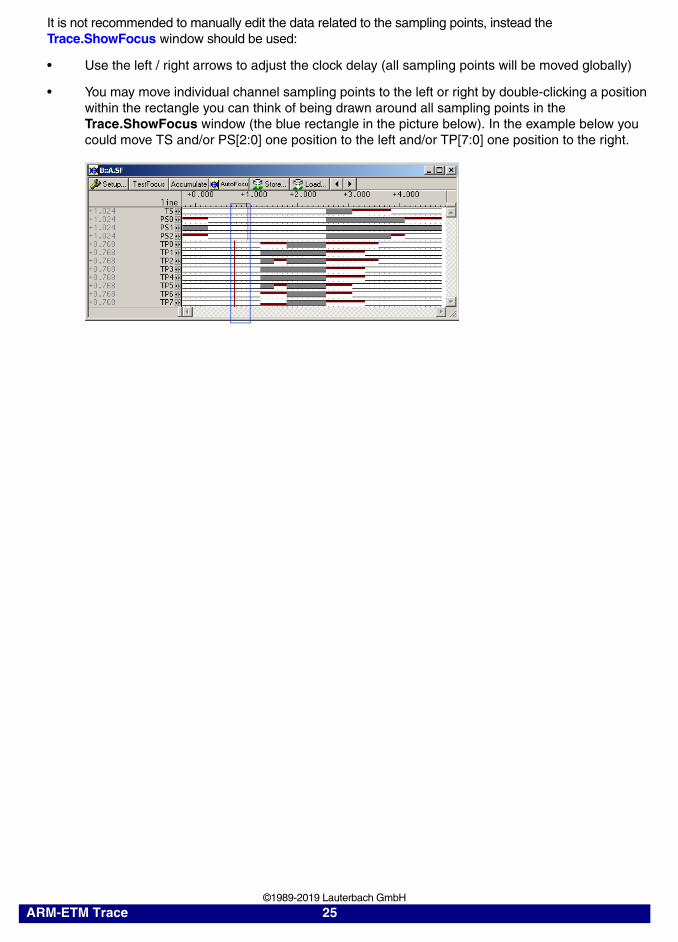
It is not recommended to manually edit the data related to the sampling points, instead the Trace.ShowFocus window should be used:
• Use the left / right arrows to adjust the clock delay (all sampling points will be moved globally)
• You may move individual channel sampling points to the left or right by double-clicking a position within the rectangle you can think of being drawn around all sampling points in the Trace.ShowFocus window (the blue rectangle in the picture below). In the example below you could move TS and/or PS[2:0] one position to the left and/or TP[7:0] one position to the right.
ARM-ETM Trace 25 ©1989-2019 Lauterbach GmbH
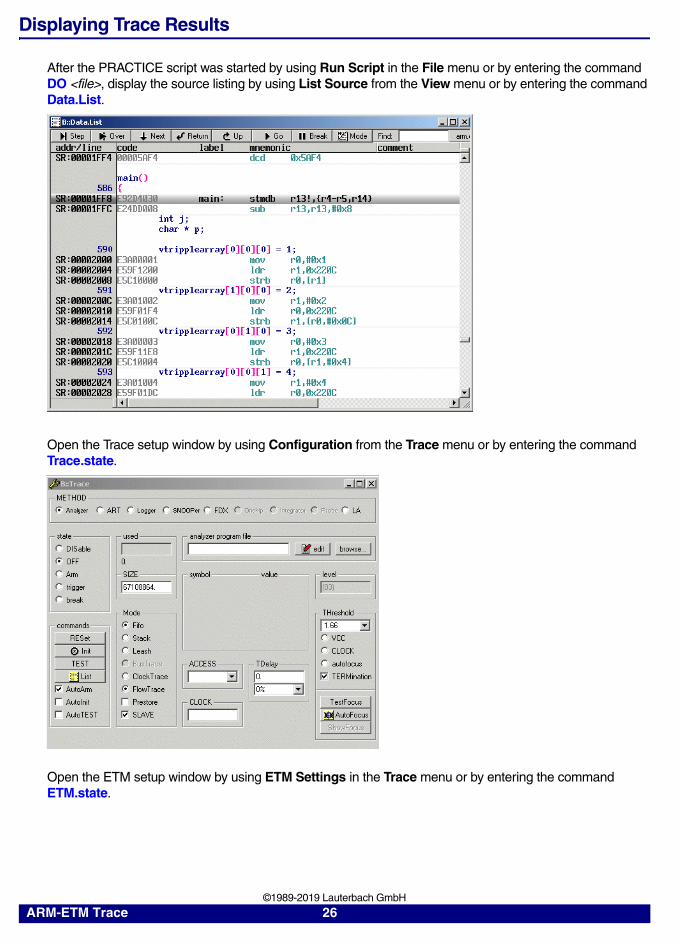
Displaying Trace Results
After the PRACTICE script was started by using Run Script in the File menu or by entering the command DO <file>, display the source listing by using List Source from the View menu or by entering the command Data.List.
Open the Trace setup window by using Configuration from the Trace menu or by entering the command Trace.state.
Open the ETM setup window by using ETM Settings in the Trace menu or by entering the command ETM.state.
ARM-ETM Trace 26 ©1989-2019 Lauterbach GmbH
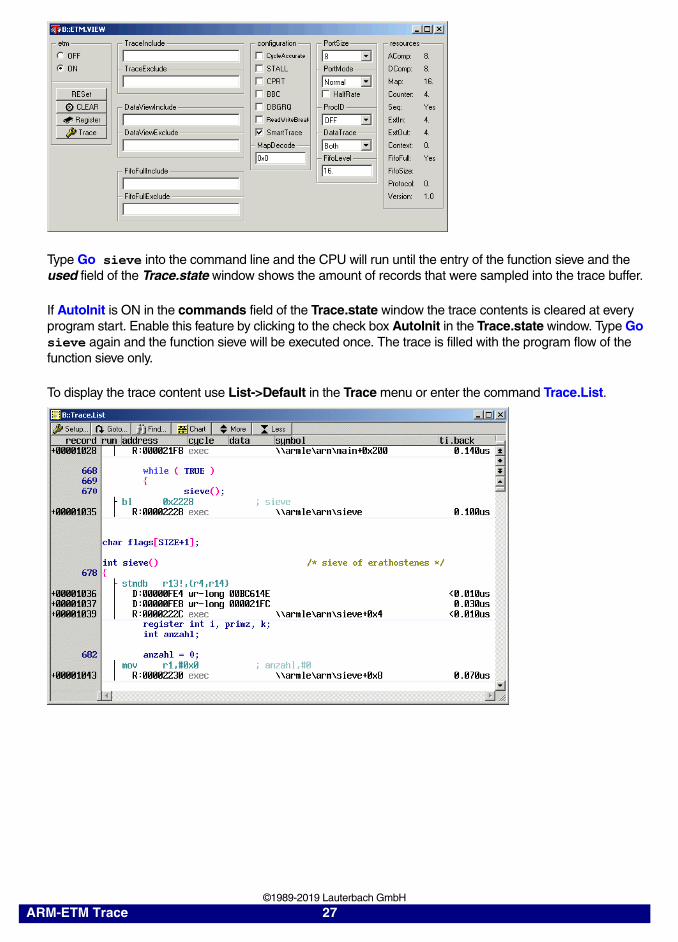
Type Go sieve into the command line and the CPU will run until the entry of the function sieve and the used field of the Trace.state window shows the amount of records that were sampled into the trace buffer.
If AutoInit is ON in the commands field of the Trace.state window the trace contents is cleared at every program start. Enable this feature by clicking to the check box AutoInit in the Trace.state window. Type Go sieve again and the function sieve will be executed once. The trace is filled with the program flow of the function sieve only.
To display the trace content use List->Default in the Trace menu or enter the command Trace.List.
ARM-ETM Trace 27 ©1989-2019 Lauterbach GmbH
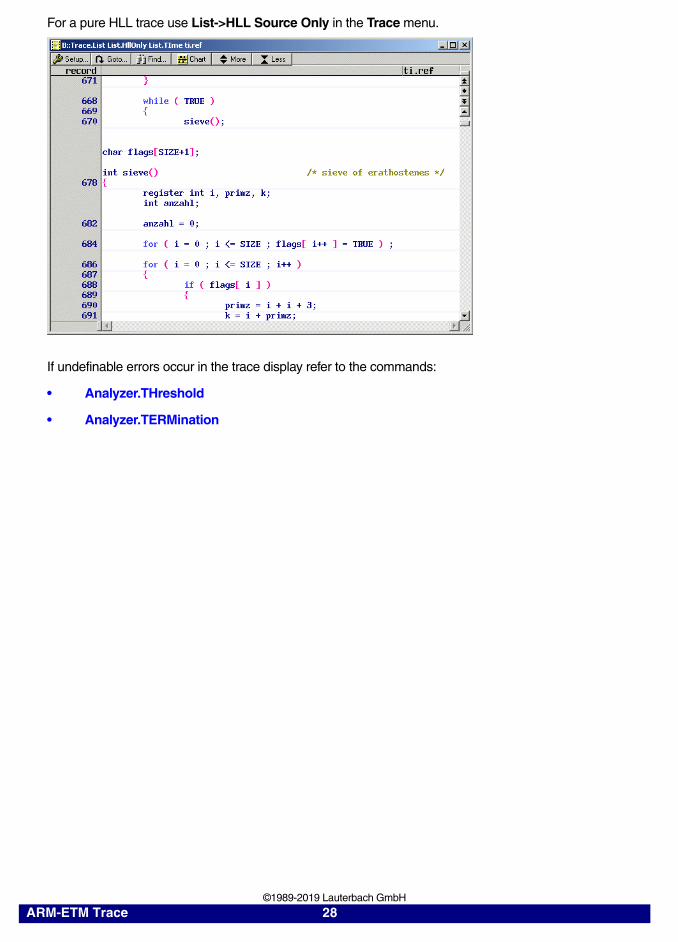
For a pure HLL trace use List->HLL Source Only in the Trace menu.
If undefinable errors occur in the trace display refer to the commands:
• Analyzer.THreshold
• Analyzer.TERMination
ARM-ETM Trace 28 ©1989-2019 Lauterbach GmbH

Programmer’s Model of the ETM
Supported Features
The features of the ARM-ETM trace mainly depend on the implementation of the Embedded Trace Macrocell (ETM). All trigger and filter features are provided by the ETM. To get information about the available resources of the ETM it is possible to read out the configuration register. Use ETM Settings in the Trace menu or enter the command ETM.state to open the ETM.state window.
The right side of the window shows the list of all resources of the ETM:
AComp Number of pairs of address comparators
DComp Number of data comparators
CComp Number of Context ID comparators
Map Number of memory map decoders
Counter Number of counters
Seq Sequencer available
ExtIn Number of external inputs
ExtIntBus Extended external bus
ExtOut Number of external outputs
FifoFull FIFOFULL Logic of ETM available or not
Fifosize Number of bytes of ETM FIFO
Protocol Protocol version
Version ETM version
ARM-ETM Trace 29 ©1989-2019 Lauterbach GmbH
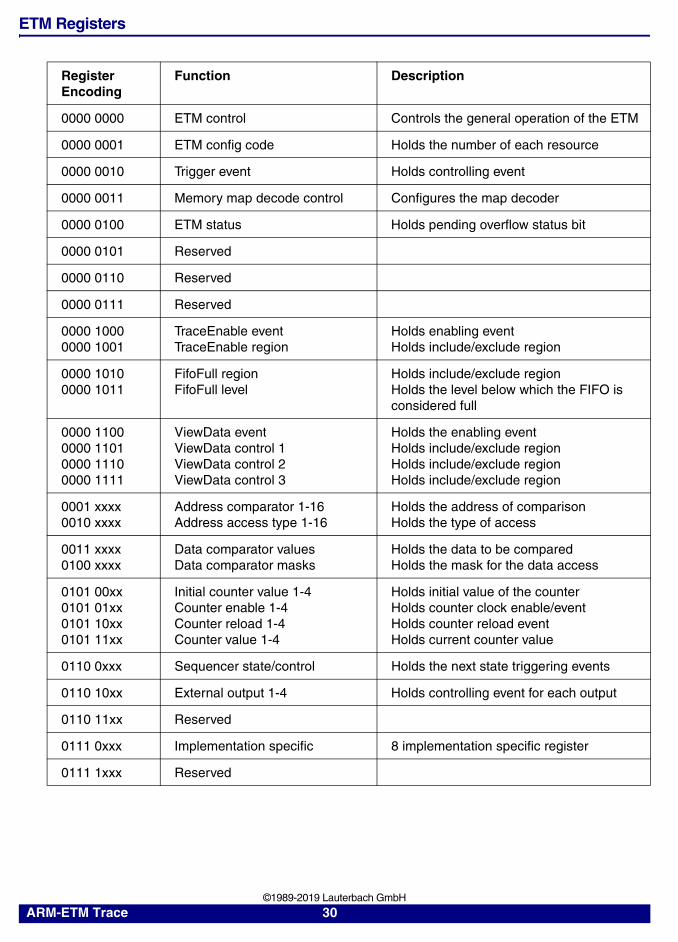
ETM Registers
RegisterEncoding
Function Description
0000 0000 ETM control Controls the general operation of the ETM
0000 0001 ETM config code Holds the number of each resource
0000 0010 Trigger event Holds controlling event
0000 0011 Memory map decode control Configures the map decoder
0000 0100 ETM status Holds pending overflow status bit
0000 0101 Reserved
0000 0110 Reserved
0000 0111 Reserved
0000 10000000 1001
TraceEnable eventTraceEnable region
Holds enabling event Holds include/exclude region
0000 10100000 1011
FifoFull regionFifoFull level
Holds include/exclude regionHolds the level below which the FIFO is considered full
0000 11000000 11010000 11100000 1111
ViewData eventViewData control 1ViewData control 2ViewData control 3
Holds the enabling eventHolds include/exclude regionHolds include/exclude regionHolds include/exclude region
0001 xxxx0010 xxxx
Address comparator 1-16Address access type 1-16
Holds the address of comparisonHolds the type of access
0011 xxxx0100 xxxx
Data comparator valuesData comparator masks
Holds the data to be comparedHolds the mask for the data access
0101 00xx0101 01xx0101 10xx0101 11xx
Initial counter value 1-4Counter enable 1-4Counter reload 1-4Counter value 1-4
Holds initial value of the counterHolds counter clock enable/eventHolds counter reload eventHolds current counter value
0110 0xxx Sequencer state/control Holds the next state triggering events
0110 10xx External output 1-4 Holds controlling event for each output
0110 11xx Reserved
0111 0xxx Implementation specific 8 implementation specific register
0111 1xxx Reserved
ARM-ETM Trace 30 ©1989-2019 Lauterbach GmbH
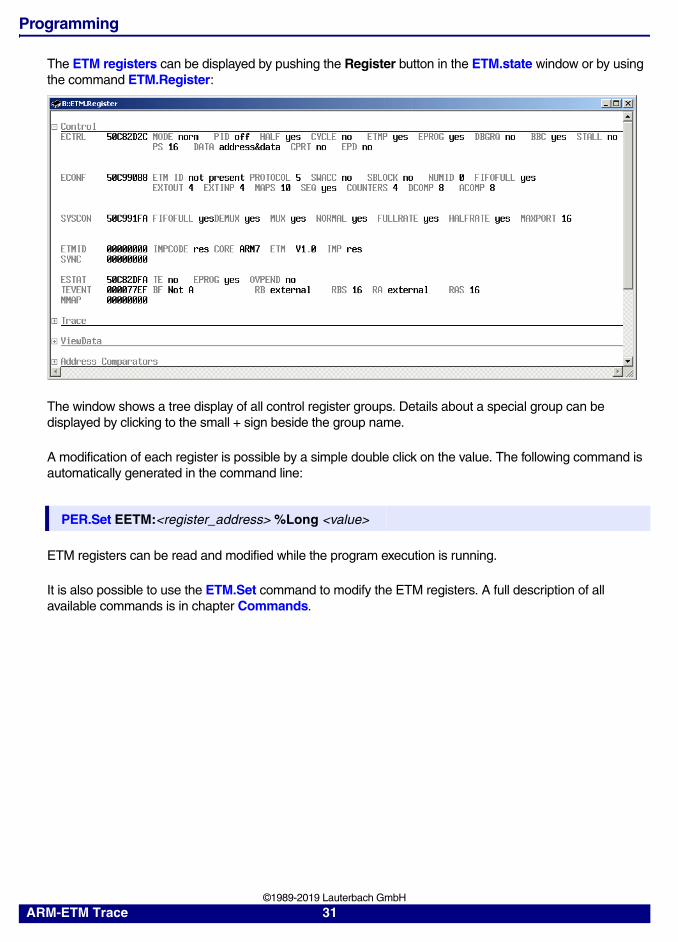
Programming
The ETM registers can be displayed by pushing the Register button in the ETM.state window or by using the command ETM.Register:
The window shows a tree display of all control register groups. Details about a special group can be displayed by clicking to the small + sign beside the group name.
A modification of each register is possible by a simple double click on the value. The following command is automatically generated in the command line:
ETM registers can be read and modified while the program execution is running.
It is also possible to use the ETM.Set command to modify the ETM registers. A full description of all available commands is in chapter Commands.
PER.Set EETM:<register_address> %Long <value>
ARM-ETM Trace 31 ©1989-2019 Lauterbach GmbH
ETM Commands
ETM Embedded Trace Macrocell (ETM)
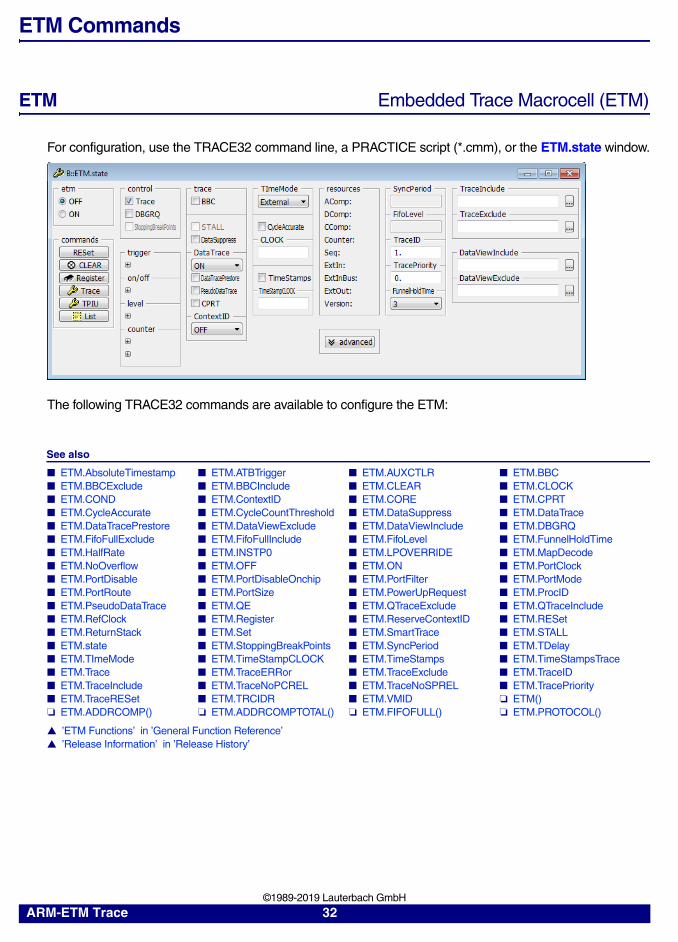
For configuration, use the TRACE32 command line, a PRACTICE script (*.cmm), or the ETM.state window.
The following TRACE32 commands are available to configure the ETM:
See also
■ ETM.AbsoluteTimestamp ■ ETM.ATBTrigger ■ ETM.AUXCTLR ■ ETM.BBC ■ ETM.BBCExclude ■ ETM.BBCInclude ■ ETM.CLEAR ■ ETM.CLOCK ■ ETM.COND ■ ETM.ContextID ■ ETM.CORE ■ ETM.CPRT ■ ETM.CycleAccurate ■ ETM.CycleCountThreshold ■ ETM.DataSuppress ■ ETM.DataTrace ■ ETM.DataTracePrestore ■ ETM.DataViewExclude ■ ETM.DataViewInclude ■ ETM.DBGRQ ■ ETM.FifoFullExclude ■ ETM.FifoFullInclude ■ ETM.FifoLevel ■ ETM.FunnelHoldTime ■ ETM.HalfRate ■ ETM.INSTP0 ■ ETM.LPOVERRIDE ■ ETM.MapDecode ■ ETM.NoOverflow ■ ETM.OFF ■ ETM.ON ■ ETM.PortClock ■ ETM.PortDisable ■ ETM.PortDisableOnchip ■ ETM.PortFilter ■ ETM.PortMode ■ ETM.PortRoute ■ ETM.PortSize ■ ETM.PowerUpRequest ■ ETM.ProcID ■ ETM.PseudoDataTrace ■ ETM.QE ■ ETM.QTraceExclude ■ ETM.QTraceInclude ■ ETM.RefClock ■ ETM.Register ■ ETM.ReserveContextID ■ ETM.RESet ■ ETM.ReturnStack ■ ETM.Set ■ ETM.SmartTrace ■ ETM.STALL ■ ETM.state ■ ETM.StoppingBreakPoints ■ ETM.SyncPeriod ■ ETM.TDelay ■ ETM.TImeMode ■ ETM.TimeStampCLOCK ■ ETM.TimeStamps ■ ETM.TimeStampsTrace ■ ETM.Trace ■ ETM.TraceERRor ■ ETM.TraceExclude ■ ETM.TraceID ■ ETM.TraceInclude ■ ETM.TraceNoPCREL ■ ETM.TraceNoSPREL ■ ETM.TracePriority ■ ETM.TraceRESet ■ ETM.TRCIDR ■ ETM.VMID ❏ ETM() ❏ ETM.ADDRCOMP() ❏ ETM.ADDRCOMPTOTAL() ❏ ETM.FIFOFULL() ❏ ETM.PROTOCOL()
▲ ’ETM Functions’ in ’General Function Reference’▲ ’Release Information’ in ’Release History’
ARM-ETM Trace 32 ©1989-2019 Lauterbach GmbH
ETM.AbsoluteTimestamp Absolute cyclecount pakets
See also
■ ETM ■ ETM.state
ETM.ATBTrigger Use ATB to transfer trace trigger to trace sink
Configures the ETMv4 to drive an ATB trigger on event 0. This means that a trace trigger occurring in the ETM, is transported to the trace sink (TPIU, ETB, ETF, or ETR) via the CoreSight Advanced Trace Bus (ATB). You need to configure this option manually only for advanced operations. (See below.)
• On ARM chips with CoreSight ETMv3 or PTM (e.g. Cortex-A9) ETM.ATBTrigger is not available (or has no effect). Thus (except for Cortex-M) you have to configure the Cross Trigger Interfaces (CTI) manually to transport a trace trigger from the ETM to the trace port (TPIU) or onchip trace buffer (ETB/ETF/ETR) via the CoreSight Cross Trigger Matrix (CTM).
• On ARM chips without CoreSight debug infrastructure (ARM9 / ARM11) this option is not required.
• On ARM chips with ETMv4 (e.g. Cortex-R7/R8/R52, Cortex-A3x/A5x/A7x) setting ETM.ATBTrigger to ON configures the ETM to transport a trace trigger via the CoreSight Advanced Trace Bus (ATB).
You can configured an event causing a trace trigger in the ETM by using the either the command Break.Set /TraceTrigger or the advanced command ETM.Set Trigger. Both commands set automatically ETM.ATBTrigger to ON.
When configuring an ETM trigger with ETM.Set Trigger you may use ETM.ATBTrigger OFF, to disable trigger propagation via ATB. This makes sense, if you prefer to transport you trigger through the cross trigger system (CTI & CTM) e.g. to stop a core directly when an ETM trigger occurs.
Format: ETM.AbsoluteTimestamp [ON | OFF]
OFF Cycle counts in cycle accurate tracing mode are relative (default).
ON Cycle counts in cycle accurate tracing mode are absolute. This is the behavior of some (non ARM) ETM units.
Format: ETM.ATBTrigger [ON | OFF]
NOTE: While normal trace data is usually buffered before it is emitted by the trace port, the ATB trigger is normally not buffered. This means that a trace trigger might be received before the associated trace data is received.
ARM-ETM Trace 33 ©1989-2019 Lauterbach GmbH
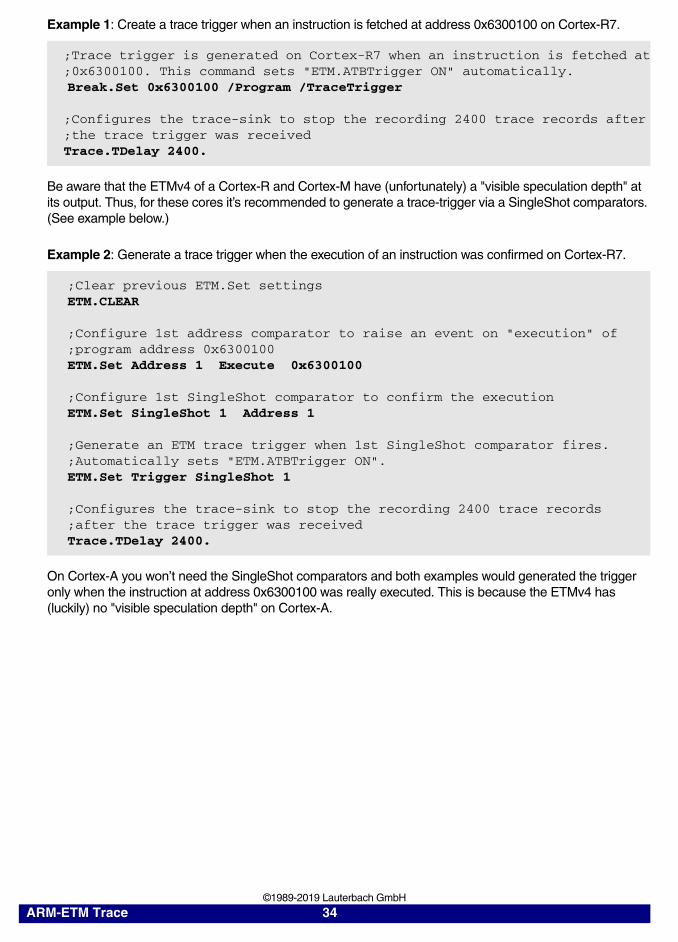
Example 1: Create a trace trigger when an instruction is fetched at address 0x6300100 on Cortex-R7.
Be aware that the ETMv4 of a Cortex-R and Cortex-M have (unfortunately) a "visible speculation depth" at its output. Thus, for these cores it’s recommended to generate a trace-trigger via a SingleShot comparators. (See example below.)
Example 2: Generate a trace trigger when the execution of an instruction was confirmed on Cortex-R7.
On Cortex-A you won’t need the SingleShot comparators and both examples would generated the trigger only when the instruction at address 0x6300100 was really executed. This is because the ETMv4 has (luckily) no "visible speculation depth" on Cortex-A.
;Trace trigger is generated on Cortex-R7 when an instruction is fetched at;0x6300100. This command sets "ETM.ATBTrigger ON" automatically.Break.Set 0x6300100 /Program /TraceTrigger
;Configures the trace-sink to stop the recording 2400 trace records after;the trace trigger was receivedTrace.TDelay 2400.
;Clear previous ETM.Set settingsETM.CLEAR
;Configure 1st address comparator to raise an event on "execution" of;program address 0x6300100ETM.Set Address 1 Execute 0x6300100
;Configure 1st SingleShot comparator to confirm the executionETM.Set SingleShot 1 Address 1
;Generate an ETM trace trigger when 1st SingleShot comparator fires.;Automatically sets "ETM.ATBTrigger ON".ETM.Set Trigger SingleShot 1
;Configures the trace-sink to stop the recording 2400 trace records;after the trace trigger was receivedTrace.TDelay 2400.
ARM-ETM Trace 34 ©1989-2019 Lauterbach GmbH
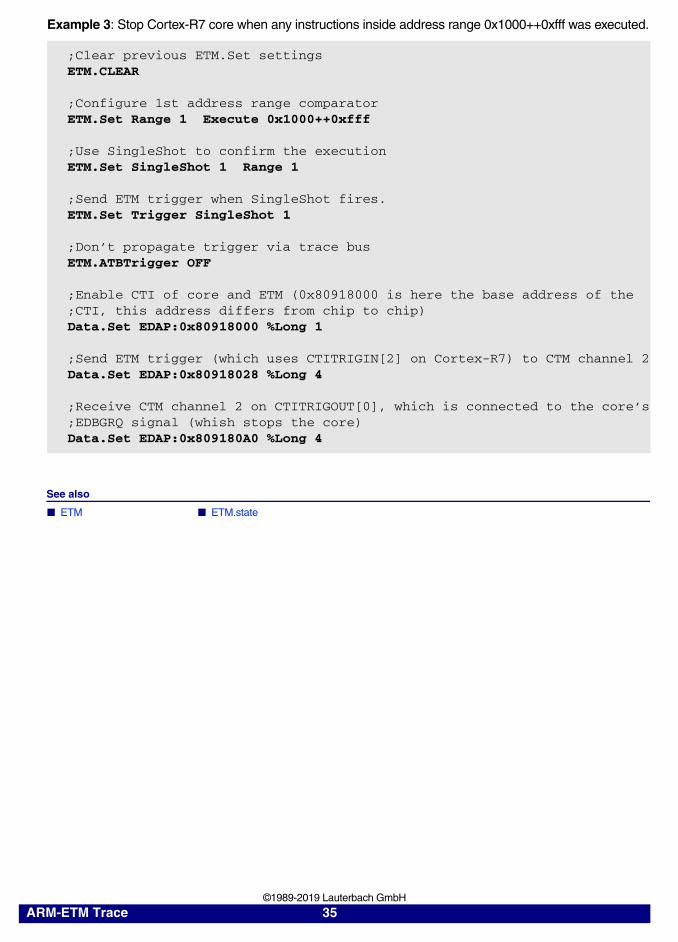
Example 3: Stop Cortex-R7 core when any instructions inside address range 0x1000++0xfff was executed.
See also
■ ETM ■ ETM.state
;Clear previous ETM.Set settingsETM.CLEAR
;Configure 1st address range comparator ETM.Set Range 1 Execute 0x1000++0xfff
;Use SingleShot to confirm the executionETM.Set SingleShot 1 Range 1
;Send ETM trigger when SingleShot fires.ETM.Set Trigger SingleShot 1
;Don’t propagate trigger via trace busETM.ATBTrigger OFF
;Enable CTI of core and ETM (0x80918000 is here the base address of the;CTI, this address differs from chip to chip)Data.Set EDAP:0x80918000 %Long 1
;Send ETM trigger (which uses CTITRIGIN[2] on Cortex-R7) to CTM channel 2Data.Set EDAP:0x80918028 %Long 4
;Receive CTM channel 2 on CTITRIGOUT[0], which is connected to the core’s;EDBGRQ signal (whish stops the core) Data.Set EDAP:0x809180A0 %Long 4
ARM-ETM Trace 35 ©1989-2019 Lauterbach GmbH

ETM.AUXCTLR Set ETMv4 implementation-specific auxiliary control register
Sets the value of the ETMv4 auxiliary control register "TRCAUXCTLR".
The function of this register is not defined by the ETMv4 specification, but can be used by any implementation of the ETMv4 for implementation-specific purposes. E.g.: Bit 0 and 1 are defined for Cortex-R7 (see "CoreSight ETM-R7 Technical Reference Manual")
TRACE32 will only write to the ETMv4 register TRCAUXCTLR, if you have specified a value with ETM.AUXCTLR (and leave it untouched otherwise). After resetting the target chip, TRCAUXCTLR contains 0.
See also
■ ETM ■ ETM.state
ETM.BBC Branch address broadcast
Enable or disable branch-broadcasting globally.
When branch-broadcasting is active, the ETM broadcasts the address information for all branches. This consumes more trace memory and trace port bandwidth. It is usually not required.
See also
■ ETM ■ ETM.state
Format: ETM.AUXCTLR <value> (ETM4.0)
Format: ETM.BBC [ON | OFF]
OFF The ETM broadcasts only the address information when the processor branches to a location that cannot be directly inferred from the source code (default).
ON The ETM broadcasts the address information for all branches. This option has to be ON, if hardware based code coverage with ETMv1 is used.
ARM-ETM Trace 36 ©1989-2019 Lauterbach GmbH
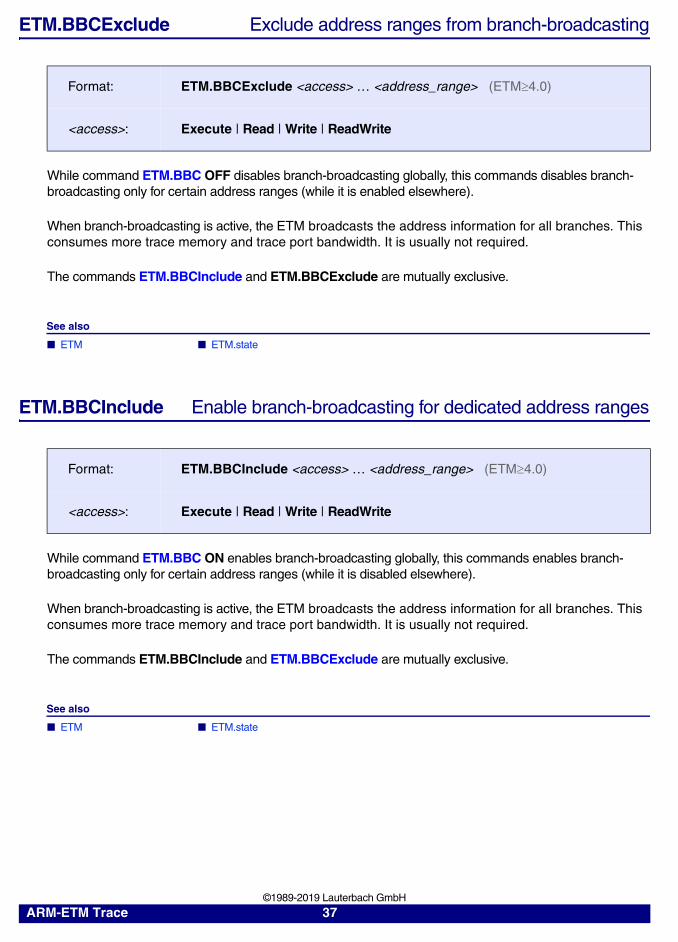
ETM.BBCExclude Exclude address ranges from branch-broadcasting
While command ETM.BBC OFF disables branch-broadcasting globally, this commands disables branch-broadcasting only for certain address ranges (while it is enabled elsewhere).
When branch-broadcasting is active, the ETM broadcasts the address information for all branches. This consumes more trace memory and trace port bandwidth. It is usually not required.
The commands ETM.BBCInclude and ETM.BBCExclude are mutually exclusive.
See also
■ ETM ■ ETM.state
ETM.BBCInclude Enable branch-broadcasting for dedicated address ranges
While command ETM.BBC ON enables branch-broadcasting globally, this commands enables branch-broadcasting only for certain address ranges (while it is disabled elsewhere).
When branch-broadcasting is active, the ETM broadcasts the address information for all branches. This consumes more trace memory and trace port bandwidth. It is usually not required.
The commands ETM.BBCInclude and ETM.BBCExclude are mutually exclusive.
See also
■ ETM ■ ETM.state
Format: ETM.BBCExclude <access> … <address_range> (ETM4.0)
<access>: Execute | Read | Write | ReadWrite
Format: ETM.BBCInclude <access> … <address_range> (ETM4.0)
<access>: Execute | Read | Write | ReadWrite
ARM-ETM Trace 37 ©1989-2019 Lauterbach GmbH
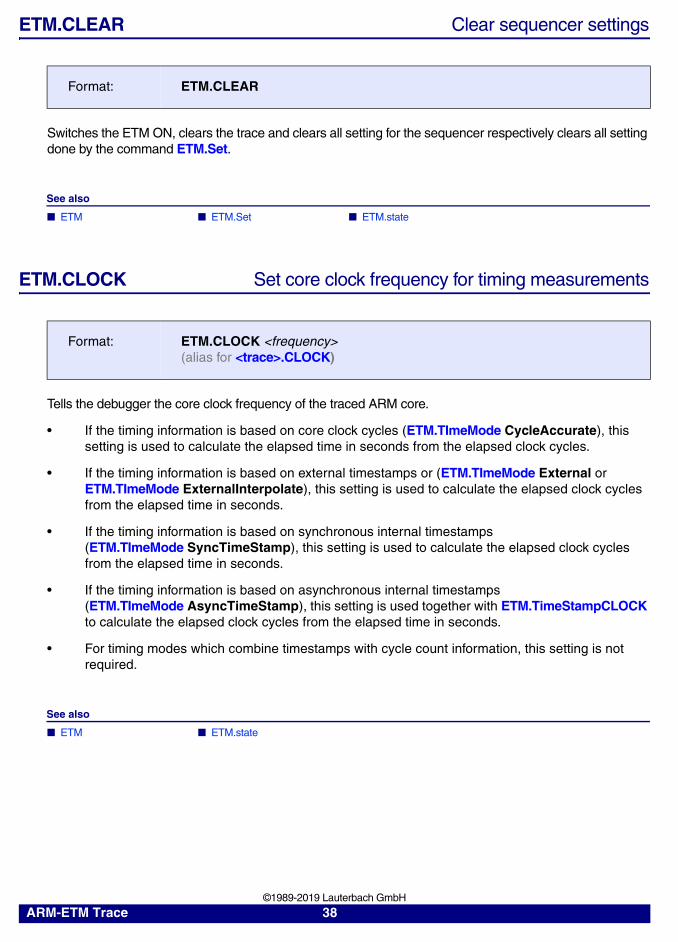
ETM.CLEAR Clear sequencer settings
Switches the ETM ON, clears the trace and clears all setting for the sequencer respectively clears all setting done by the command ETM.Set.
See also
■ ETM ■ ETM.Set ■ ETM.state
ETM.CLOCK Set core clock frequency for timing measurements
Tells the debugger the core clock frequency of the traced ARM core.
• If the timing information is based on core clock cycles (ETM.TImeMode CycleAccurate), this setting is used to calculate the elapsed time in seconds from the elapsed clock cycles.
• If the timing information is based on external timestamps or (ETM.TImeMode External or ETM.TImeMode ExternalInterpolate), this setting is used to calculate the elapsed clock cycles from the elapsed time in seconds.
• If the timing information is based on synchronous internal timestamps (ETM.TImeMode SyncTimeStamp), this setting is used to calculate the elapsed clock cycles from the elapsed time in seconds.
• If the timing information is based on asynchronous internal timestamps (ETM.TImeMode AsyncTimeStamp), this setting is used together with ETM.TimeStampCLOCK to calculate the elapsed clock cycles from the elapsed time in seconds.
• For timing modes which combine timestamps with cycle count information, this setting is not required.
See also
■ ETM ■ ETM.state
Format: ETM.CLEAR
Format: ETM.CLOCK <frequency>(alias for <trace>.CLOCK)
ARM-ETM Trace 38 ©1989-2019 Lauterbach GmbH
ETM.CORE Select core for ETM
Selects the core to be traced when the ETM unit can be connected to multiple cores.
See also
■ ETM ■ ETM.state
ETM.CPRT Monitor coprocessor register transfers
Monitor Coprocessor Register Transfers are traced if ETM.CPRT is set to ON. Default is OFF.
See also
■ ETM ■ ETM.state
Format: ETM.CORE <core_id>
Format: ETM.CPRT [ON | OFF] (ETM3.5)
ARM-ETM Trace 39 ©1989-2019 Lauterbach GmbH
ETM.COND Conditional non-branch instructions
Configures the ETM if information about the execution of conditional non-branch instructions should be included in the trace stream. This gets implicitly enabled if a data trace for loads and/or stores is enabled.
The execution of a conditional branch instruction is always traced. This is a configuration option for ETMv4 on ARMv7-R, ARMv8-R, ARMv7-M and ARMv8-M architecture.
The command is also needed at the time of trace decoding if the Trace Configuration Register (TRCCONFIGR) of the ETMv4 cannot be read (e.g. trace post processing in the TRACE32 simulator).
See also
■ ETM ■ ETM.state
ETM.ContextID Select the width of the "ContextID" register
Select the width of the Context ID register. By setting ETM.ContextID to any value (except OFF), the ETM will emit a trace message containing the value written to the Context ID register.
When tracing a CPU with a target operating system, the trace recording should include information about the active tasks and/or threads. This can be either achieved by using data-trace or by using ETM.ContextID (especially if data-trace is not available (e.g. Cortex-A)). If you are using ETM.ContextID you have to ensure that your target operating systems writes to the Context ID register whenever a context switch (task/thread switched) occurs.
See also
■ ETM ■ ETM.state
Format: ETM.COND OFF | Loads | Stores | LoadsAndStores | ALL (ETM4.0)
OFF Conditional instruction tracing is disabled.
Loads Conditional load instruction are traced.
Stores Conditional store instructions are traced.
LoadsAndStores Conditional load and store instructions are traced.
ALL All conditional instructions are traced.
Format: ETM.ContextID 8 | 16 | 32 | OFF
ARM-ETM Trace 40 ©1989-2019 Lauterbach GmbH
ETM.CycleAccurate Cycle accurate tracing
Enables cycle accurate tracing if ON. Default is OFF.
Cycle accurate tracing can be used to observe the exact number of cycles that a particular code sequence takes to execute. When ETM.CycleAccurate is OFF then the timestamp information from the TRACE32 hardware will be used. These timestamps are generated when the tracepaket is recorded in the tracebuffer. As the packets may be buffered in FIFOs on the chip the packets may get a variable delay between the generation from the ETM and the time the packets is seen on the external trace port. This results in small errors in the timestamps. For most measurements these errors can be discarded when the time taken from the trace is large compared with the error (e.g. taking the time of a larger function). However the errors will become relevant when looking for the time of very small functions or even single instructions. This is the use case for cycle accurate tracing. Cycle accurate tracing must also be used to get any time information from onchip trace buffers. Cycle accurate tracing has two disadvantages: it requires more trace port bandwidth and it takes more time to display the trace. Timestamps are generated based on the CPU clock if the CPU clock is specified with the command Trace.CLOCK <cpu_clock>. It is recommended to reduce the data trace information if cycle accurate tracing is used, because cycle accurate tracing generates extra load on the trace port (not for ETMv1).
Here is a summary of pros and cons for cycle accurate tracing:
+ exact timestamps for small code pieces (or even single instructions)+ timestamps for onchip trace buffers+ trace can show number of clocks even when core clock changes dynamically+ exact time correlation with other cores (when global timestamps are available)
- requires more traceport bandwidth (about four times more) (not ETMv1)- reduced tracing time (more trace packets generated)- longer trace processing time (needs to process whole trace to get timestamp of last record) (not ETMv1)- no time correlation with other cores (except when global timestamps are available)- no time correlation with other trace hardware
See also
■ ETM ■ ETM.DataTrace ■ ETM.state ■ <trace>.CLOCK
Format: ETM.CycleAccurate [ON | OFF]
ARM-ETM Trace 41 ©1989-2019 Lauterbach GmbH
ETM.CycleCountThreshold Set granularity for cycle accurate timing info
Configure the granularity of cycle accurate time information for the ETMv4. (See also command ETM.TImeMode for details about cycle accurate timing information.)
By default the ETM.CycleCountThreshold is set to a low number which ensures that cycle information is provided with (almost) every program trace cycle.
See also
■ ETM ■ ETM.state
ETM.DataSuppress Suppress data flow to prevent FIFO overflow
Allow the ETM to suppress the data flow information if a FIFO overflow is likely to happen.
Example:
See also
■ ETM ■ ETM.state
Format: ETM.CycleCountThreshold <threshold> (ETM4.0)
<threshold> The threshold value sets the minimum number of core clock cycles that need to elapse before a cycle information is emitted on the trace port. Larger numbers reduce the required bandwidth and required trace memory, but make the time information less accurate.
Format: ETM.DataSuppress [ON | OFF]
ETM.FifoLevel 16. ; Select a FifoLevel
ETM.DataSuppress ON
ARM-ETM Trace 42 ©1989-2019 Lauterbach GmbH
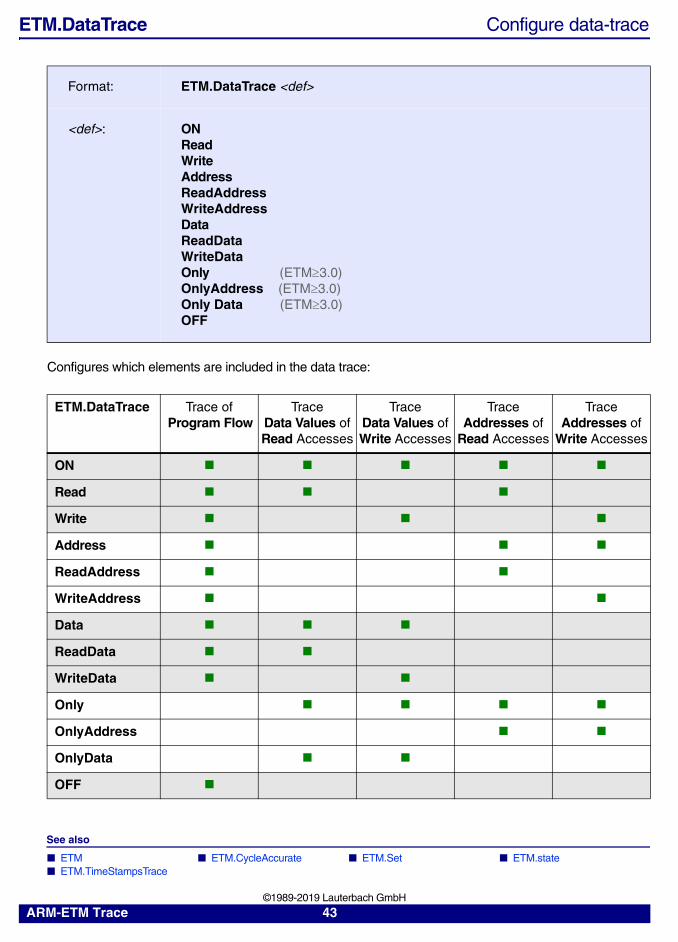
ETM.DataTrace Configure data-trace
Configures which elements are included in the data trace:
See also
■ ETM ■ ETM.CycleAccurate ■ ETM.Set ■ ETM.state ■ ETM.TimeStampsTrace
Format: ETM.DataTrace <def>
<def>: ONReadWriteAddressReadAddressWriteAddressDataReadDataWriteDataOnly (ETM3.0)OnlyAddress (ETM3.0)Only Data (ETM3.0)OFF
ETM.DataTrace Trace ofProgram Flow
Trace Data Values of Read Accesses
Trace Data Values of Write Accesses
Trace Addresses of
Read Accesses
Trace Addresses of
Write Accesses
ON ■ ■ ■ ■ ■
Read ■ ■ ■
Write ■ ■ ■
Address ■ ■ ■
ReadAddress ■ ■
WriteAddress ■ ■
Data ■ ■ ■
ReadData ■ ■
WriteData ■ ■
Only ■ ■ ■ ■
OnlyAddress ■ ■
OnlyData ■ ■
OFF ■
ARM-ETM Trace 43 ©1989-2019 Lauterbach GmbH

▲ ’Release Information’ in ’Release History’
ARM-ETM Trace 44 ©1989-2019 Lauterbach GmbH
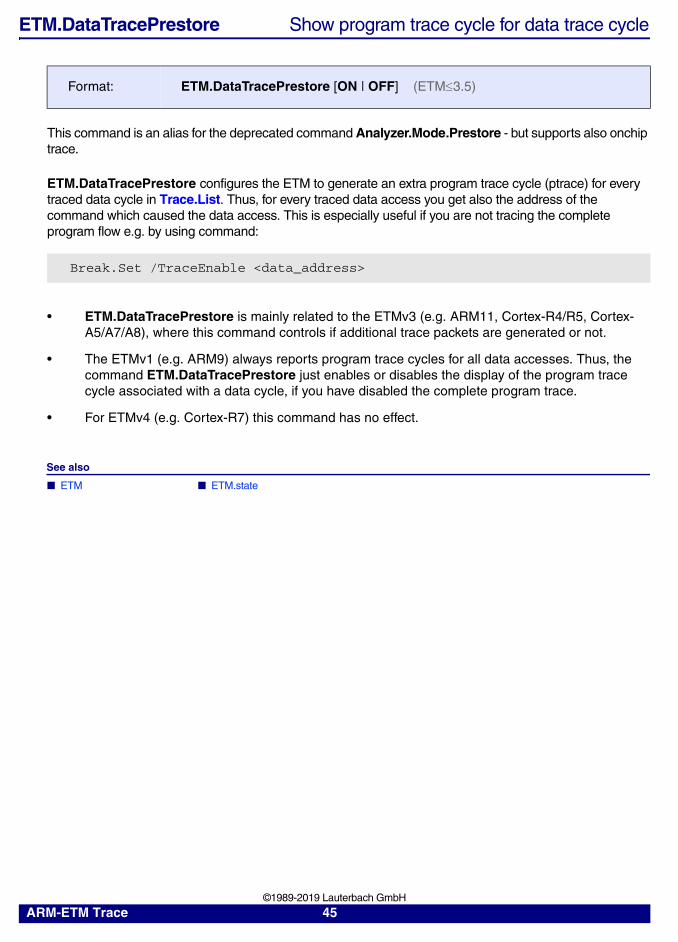
ETM.DataTracePrestore Show program trace cycle for data trace cycle
This command is an alias for the deprecated command Analyzer.Mode.Prestore - but supports also onchip trace.
ETM.DataTracePrestore configures the ETM to generate an extra program trace cycle (ptrace) for every traced data cycle in Trace.List. Thus, for every traced data access you get also the address of the command which caused the data access. This is especially useful if you are not tracing the complete program flow e.g. by using command:
• ETM.DataTracePrestore is mainly related to the ETMv3 (e.g. ARM11, Cortex-R4/R5, Cortex-A5/A7/A8), where this command controls if additional trace packets are generated or not.
• The ETMv1 (e.g. ARM9) always reports program trace cycles for all data accesses. Thus, the command ETM.DataTracePrestore just enables or disables the display of the program trace cycle associated with a data cycle, if you have disabled the complete program trace.
• For ETMv4 (e.g. Cortex-R7) this command has no effect.
See also
■ ETM ■ ETM.state
Format: ETM.DataTracePrestore [ON | OFF] (ETM3.5)
Break.Set /TraceEnable <data_address>
ARM-ETM Trace 45 ©1989-2019 Lauterbach GmbH
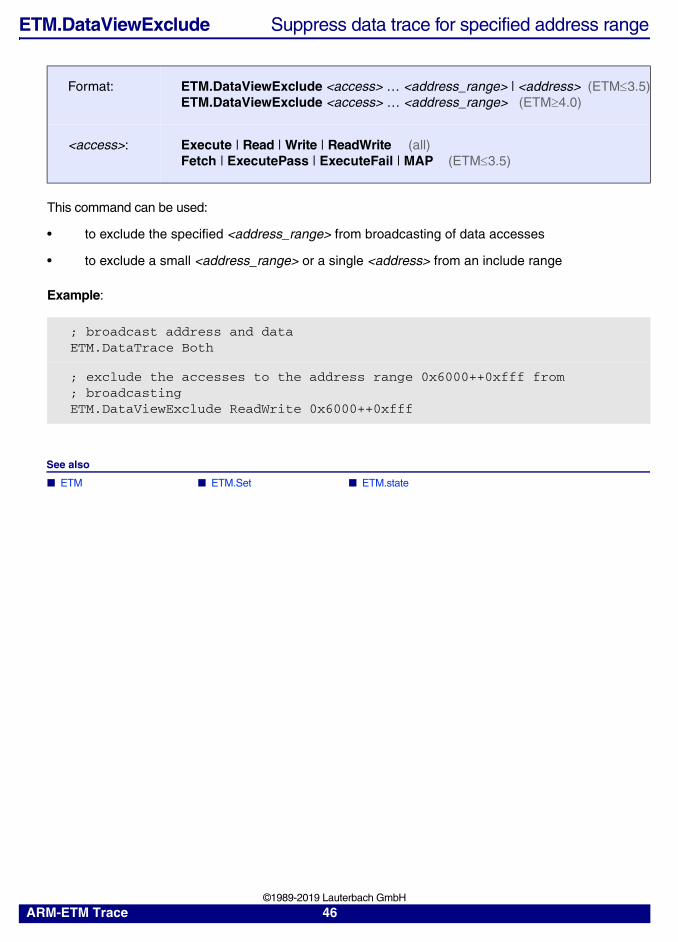
ETM.DataViewExclude Suppress data trace for specified address range
This command can be used:
• to exclude the specified <address_range> from broadcasting of data accesses
• to exclude a small <address_range> or a single <address> from an include range
Example:
See also
■ ETM ■ ETM.Set ■ ETM.state
Format: ETM.DataViewExclude <access> … <address_range> | <address> (ETM3.5)ETM.DataViewExclude <access> … <address_range> (ETM4.0)
<access>: Execute | Read | Write | ReadWrite (all)Fetch | ExecutePass | ExecuteFail | MAP (ETM3.5)
; broadcast address and dataETM.DataTrace Both
; exclude the accesses to the address range 0x6000++0xfff from; broadcastingETM.DataViewExclude ReadWrite 0x6000++0xfff
ARM-ETM Trace 46 ©1989-2019 Lauterbach GmbH
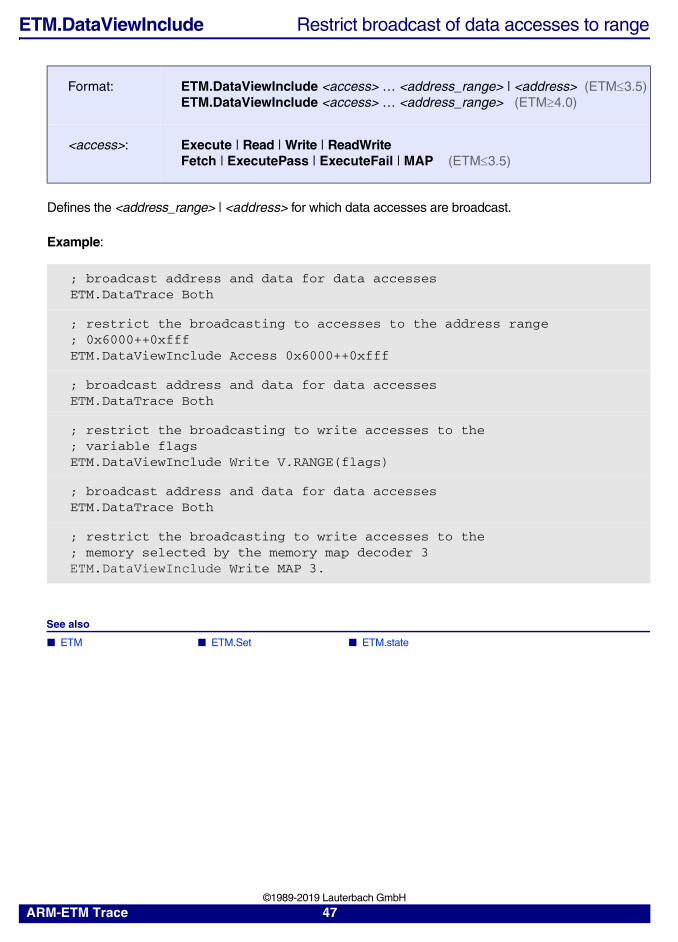
ETM.DataViewInclude Restrict broadcast of data accesses to range
Defines the <address_range> | <address> for which data accesses are broadcast.
Example:
See also
■ ETM ■ ETM.Set ■ ETM.state
Format: ETM.DataViewInclude <access> … <address_range> | <address> (ETM3.5)ETM.DataViewInclude <access> … <address_range> (ETM4.0)
<access>: Execute | Read | Write | ReadWriteFetch | ExecutePass | ExecuteFail | MAP (ETM3.5)
; broadcast address and data for data accessesETM.DataTrace Both
; restrict the broadcasting to accesses to the address range; 0x6000++0xfffETM.DataViewInclude Access 0x6000++0xfff
; broadcast address and data for data accessesETM.DataTrace Both
; restrict the broadcasting to write accesses to the; variable flagsETM.DataViewInclude Write V.RANGE(flags)
; broadcast address and data for data accessesETM.DataTrace Both
; restrict the broadcasting to write accesses to the; memory selected by the memory map decoder 3ETM.DataViewInclude Write MAP 3.
ARM-ETM Trace 47 ©1989-2019 Lauterbach GmbH
ETM.DBGRQ Debug request control
Set debug request control. When set to ON and a trigger occurs the ARM processor can be forced to enter the debug state.
Use this to make a trigger stop the tracing plus the program execution.
See also
■ ETM ■ ETM.state
ETM.FifoFullExclude No activation of FIFOFULL in range
Defines the <address_range> where FIFOFULL will not be generated in the case of a FIFO overflow, so that the processor is not stalled in critical code.
The commands ETM.FifoFullInclude or ETM.FifoFullExclude are mutually exclusive.
Example:
See also
■ ETM ■ ETM.Set ■ ETM.state
Format: ETM.DBGRQ [ON | OFF] (ETM3.5 or PTM)
Format: ETM.FifoFullExclude [<access> … ] <address_range>
<access>: Execute | Read | Write | ReadWrite (all)Fetch | ExecutePass | ExecuteFail | MAP (ETM3.5 or PTM)
; do not generate FIFOFULL in the defined address rangeETM.FifoFullExclude 0x1f20--0x1ff7
; do not generate FIFOFULL for the memory selected by memory map decoder; 3ETM.FifoFullExclude MAP 3.
ARM-ETM Trace 48 ©1989-2019 Lauterbach GmbH
ETM.FifoFullInclude FIFOFULL only in range
Defines the <address_range> where FIFOFULL is generated in the case of a FIFO overflow.
The commands ETM.FifoFullInclude or ETM.FifoFullExclude are mutually exclusive.
Example:
See also
■ ETM ■ ETM.Set ■ ETM.state
ETM.FifoLevel Define FIFO level for FIFOFULL
Defines the FIFO level. If the FIFO has less then <value> number of bytes of space available FIFOFULL is generated if enabled by ETM.FifoFullInclude or ETM.FifoFullExclude.
See also
■ ETM ■ ETM.Set ■ ETM.state
Format: ETM.FifoFullExclude [<access> <address_value> … ]
; generate FIFOFULL in the defined address rangeETM.FifoFullInclude 0x10000++0xffff
; generate FIFOFULL for the memory selected by memory map decoder 3ETM.FifoFullInclude MAP 3.
Format: ETM.FifoLevel <value>
<value>: 1 | 2 … n
ARM-ETM Trace 49 ©1989-2019 Lauterbach GmbH
ETM.FunnelHoldTime Define minimum funnel hold time
Define the minimum Hold Time of all Coresight Funnels that are involved to the ETM trace data.
The formatting scheme of the trace data stream can easily become inefficient if fast switching occurs so where possible this should be minimized. If a source has nothing to transmit then another source will be selected irrespective of the minimum no. of cycles.
See also
■ ETM ■ ETM.state
ETM.HalfRate Halfrate mode
ETM.HalfRate has to be ON if the ETM works in half rate mode, which means that trace data should be captured on both rising and falling edge of the trace clock (aka. "Double Data Rate").
This configuration option is only available for ETMv1. All further ETM versions (including PTM/PFT) operate always in HalfRate mode.
See also
■ ETM ■ ETM.state
ETM.LPOVERRIDE Prohibit lower power mode
ETM.LPOVERRIDE ON configures the ETMv4 not to enter low-power state when the ARM cores enters low-power state.
See also
■ ETM ■ ETM.state
Format: ETM.FunnelHoldTime <value>
<value>: 1 | 2 … 7
Format: ETM.HalfRate [ON | OFF]
Format: ETM.LPOVERRIDE [ON | OFF]
ARM-ETM Trace 50 ©1989-2019 Lauterbach GmbH
ETM.INSTP0 Load and store instructions
Configures the ETMv4 if load and store instructions are included in the program flow trace. This gets implicitly enabled if a data trace for loads and/or stores is enabled.
Branches are always traced. This is a configuration option for ETMv4 on ARMv7-R, ARMv8-R, ARMv7-M and ARMv8-M architecture.
The command is also needed at the time of trace decoding if the Trace Configuration Register (TRCCONFIGR) of the ETMv4 cannot be read (e.g. trace post processing in the TRACE32 simulator).
See also
■ ETM ■ ETM.state
ETM.MapDecode Memory map decode control
Sets the memory map decode control register to <code>.
See also
■ ETM ■ ETM.state
Format: ETM.INSTP0 Branches | Loads | Stores | LoadsAndStores
Branches Do not trace load and store instructions as P0 instructions.
Loads Trace load instructions as P0 instructions.
Stores Trace store instructions as P0 instructions.
LoadsAndStores Trace load and store instructions as P0 instructions.
Format: ETM.MapDecode <code>
ARM-ETM Trace 51 ©1989-2019 Lauterbach GmbH
ETM.NoOverflow Enable ETMv4 feature to prevent target FiFo overflows
Enables (or disables) a mechanism of the ETMv4 to prevent overflows (if supported). Similar to ETM.STALL. Enabling the feature might have a significant performance impact.
See ARM ETMv4 architecture specification for details.
See also
■ ETM ■ ETM.state
ETM.ON Switch ETM on
Enables ETM functionality.
See also
■ ETM ■ ETM.state
ETM.OFF Switch ETM off
Disables ETM functionality.
See also
■ ETM ■ ETM.state
Format: ETM.NoOverflow [ON | OFF]
Format: ETM.ON
Format: ETM.OFF
ARM-ETM Trace 52 ©1989-2019 Lauterbach GmbH
ETM.PortClock Baud rate of serial trace
Sets the baud rate (Mbps, megabit per second) of a serial trace.
Example:
See also
■ ETM ■ ETM.state
Format: ETM.PortClock <baud_rate> (deprecated)Use TPIU.PortClock instead.
ETM.PortClock 3125M
;Alternatively:ETM.PortClock 3125MBPS
ARM-ETM Trace 53 ©1989-2019 Lauterbach GmbH
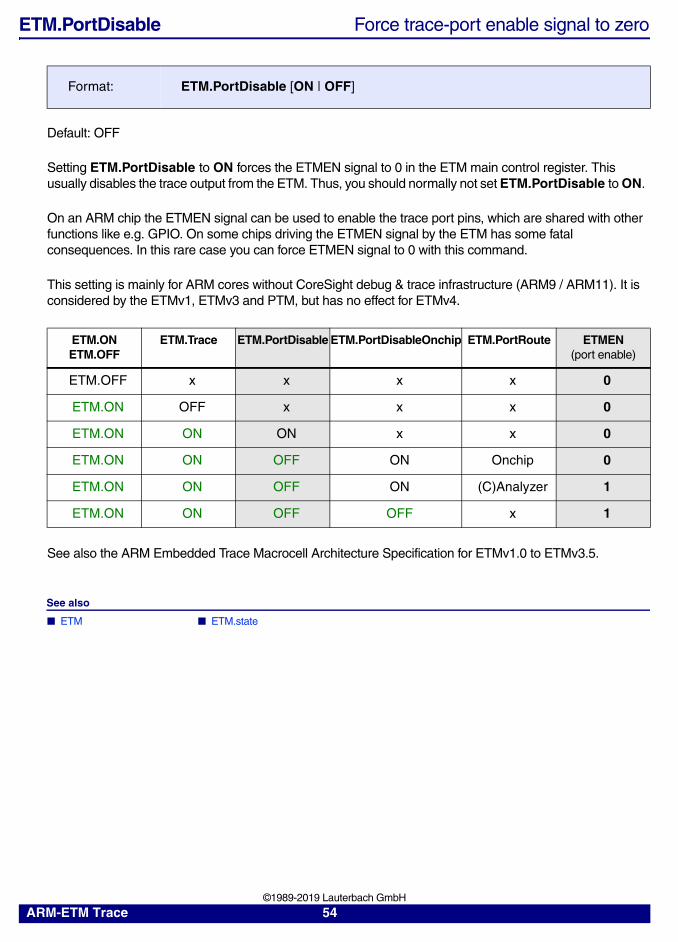
ETM.PortDisable Force trace-port enable signal to zero
Default: OFF
Setting ETM.PortDisable to ON forces the ETMEN signal to 0 in the ETM main control register. This usually disables the trace output from the ETM. Thus, you should normally not set ETM.PortDisable to ON.
On an ARM chip the ETMEN signal can be used to enable the trace port pins, which are shared with other functions like e.g. GPIO. On some chips driving the ETMEN signal by the ETM has some fatal consequences. In this rare case you can force ETMEN signal to 0 with this command.
This setting is mainly for ARM cores without CoreSight debug & trace infrastructure (ARM9 / ARM11). It is considered by the ETMv1, ETMv3 and PTM, but has no effect for ETMv4.
See also the ARM Embedded Trace Macrocell Architecture Specification for ETMv1.0 to ETMv3.5.
See also
■ ETM ■ ETM.state
Format: ETM.PortDisable [ON | OFF]
ETM.ONETM.OFF
ETM.Trace ETM.PortDisable ETM.PortDisableOnchip ETM.PortRoute ETMEN(port enable)
ETM.OFF x x x x 0
ETM.ON OFF x x x 0
ETM.ON ON ON x x 0
ETM.ON ON OFF ON Onchip 0
ETM.ON ON OFF ON (C)Analyzer 1
ETM.ON ON OFF OFF x 1
ARM-ETM Trace 54 ©1989-2019 Lauterbach GmbH
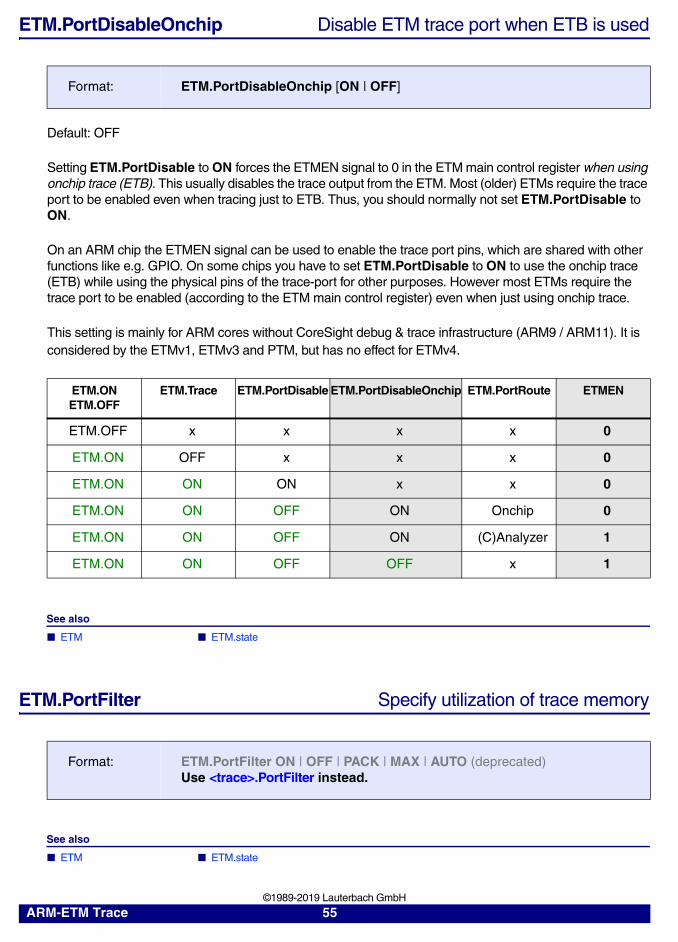
ETM.PortDisableOnchip Disable ETM trace port when ETB is used
Default: OFF
Setting ETM.PortDisable to ON forces the ETMEN signal to 0 in the ETM main control register when using onchip trace (ETB). This usually disables the trace output from the ETM. Most (older) ETMs require the trace port to be enabled even when tracing just to ETB. Thus, you should normally not set ETM.PortDisable to ON.
On an ARM chip the ETMEN signal can be used to enable the trace port pins, which are shared with other functions like e.g. GPIO. On some chips you have to set ETM.PortDisable to ON to use the onchip trace (ETB) while using the physical pins of the trace-port for other purposes. However most ETMs require the trace port to be enabled (according to the ETM main control register) even when just using onchip trace.
This setting is mainly for ARM cores without CoreSight debug & trace infrastructure (ARM9 / ARM11). It is considered by the ETMv1, ETMv3 and PTM, but has no effect for ETMv4.
See also
■ ETM ■ ETM.state
ETM.PortFilter Specify utilization of trace memory
See also
■ ETM ■ ETM.state
Format: ETM.PortDisableOnchip [ON | OFF]
ETM.ONETM.OFF
ETM.Trace ETM.PortDisable ETM.PortDisableOnchip ETM.PortRoute ETMEN
ETM.OFF x x x x 0
ETM.ON OFF x x x 0
ETM.ON ON ON x x 0
ETM.ON ON OFF ON Onchip 0
ETM.ON ON OFF ON (C)Analyzer 1
ETM.ON ON OFF OFF x 1
Format: ETM.PortFilter ON | OFF | PACK | MAX | AUTO (deprecated)Use <trace>.PortFilter instead.
ARM-ETM Trace 55 ©1989-2019 Lauterbach GmbH
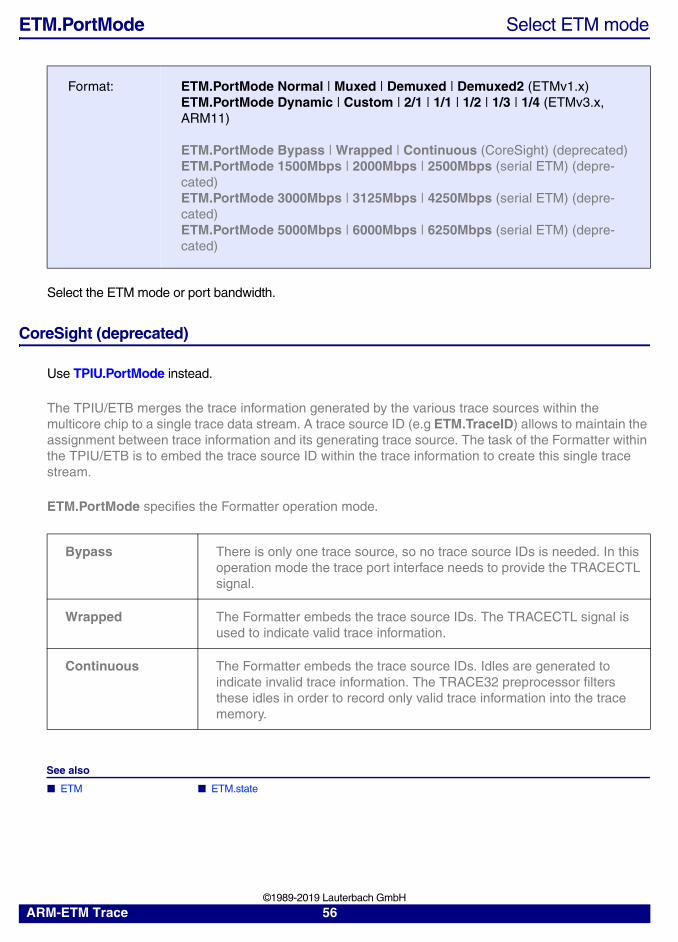
ETM.PortMode Select ETM mode
Select the ETM mode or port bandwidth.
CoreSight (deprecated)
Use TPIU.PortMode instead.
The TPIU/ETB merges the trace information generated by the various trace sources within the multicore chip to a single trace data stream. A trace source ID (e.g ETM.TraceID) allows to maintain the assignment between trace information and its generating trace source. The task of the Formatter within the TPIU/ETB is to embed the trace source ID within the trace information to create this single trace stream.
ETM.PortMode specifies the Formatter operation mode.
See also
■ ETM ■ ETM.state
Format: ETM.PortMode Normal | Muxed | Demuxed | Demuxed2 (ETMv1.x)ETM.PortMode Dynamic | Custom | 2/1 | 1/1 | 1/2 | 1/3 | 1/4 (ETMv3.x, ARM11)
ETM.PortMode Bypass | Wrapped | Continuous (CoreSight) (deprecated)ETM.PortMode 1500Mbps | 2000Mbps | 2500Mbps (serial ETM) (depre-cated)ETM.PortMode 3000Mbps | 3125Mbps | 4250Mbps (serial ETM) (depre-cated)ETM.PortMode 5000Mbps | 6000Mbps | 6250Mbps (serial ETM) (depre-cated)
Bypass There is only one trace source, so no trace source IDs is needed. In this operation mode the trace port interface needs to provide the TRACECTL signal.
Wrapped The Formatter embeds the trace source IDs. The TRACECTL signal is used to indicate valid trace information.
Continuous The Formatter embeds the trace source IDs. Idles are generated to indicate invalid trace information. The TRACE32 preprocessor filters these idles in order to record only valid trace information into the trace memory.
ARM-ETM Trace 56 ©1989-2019 Lauterbach GmbH
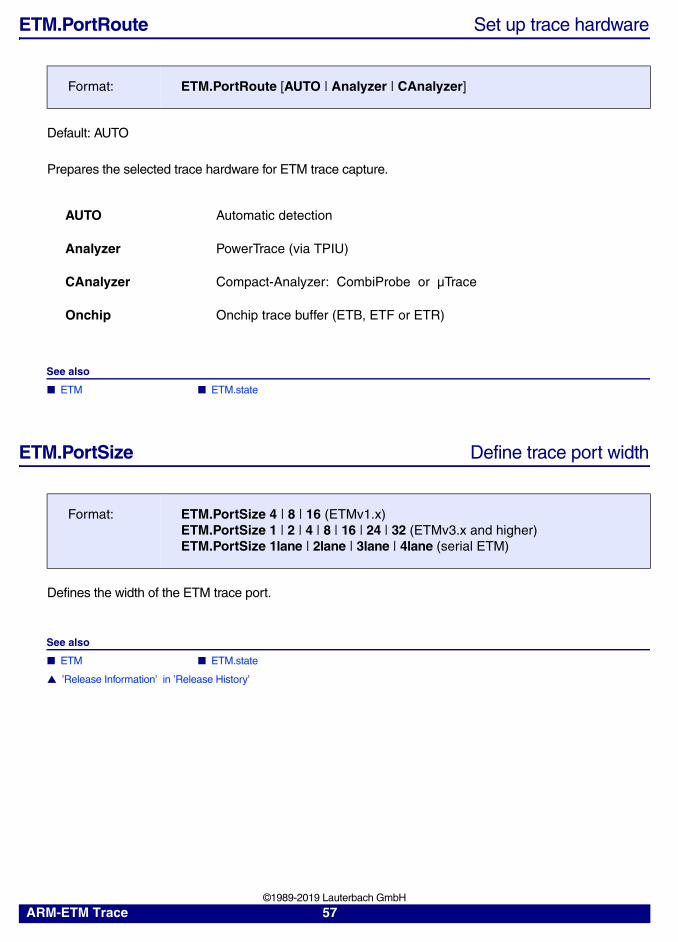
ETM.PortRoute Set up trace hardware
Default: AUTO
Prepares the selected trace hardware for ETM trace capture.
See also
■ ETM ■ ETM.state
ETM.PortSize Define trace port width
Defines the width of the ETM trace port.
See also
■ ETM ■ ETM.state
▲ ’Release Information’ in ’Release History’
Format: ETM.PortRoute [AUTO | Analyzer | CAnalyzer]
AUTO Automatic detection
Analyzer PowerTrace (via TPIU)
CAnalyzer Compact-Analyzer: CombiProbe or µTrace
Onchip Onchip trace buffer (ETB, ETF or ETR)
Format: ETM.PortSize 4 | 8 | 16 (ETMv1.x)ETM.PortSize 1 | 2 | 4 | 8 | 16 | 24 | 32 (ETMv3.x and higher)ETM.PortSize 1lane | 2lane | 3lane | 4lane (serial ETM)
ARM-ETM Trace 57 ©1989-2019 Lauterbach GmbH
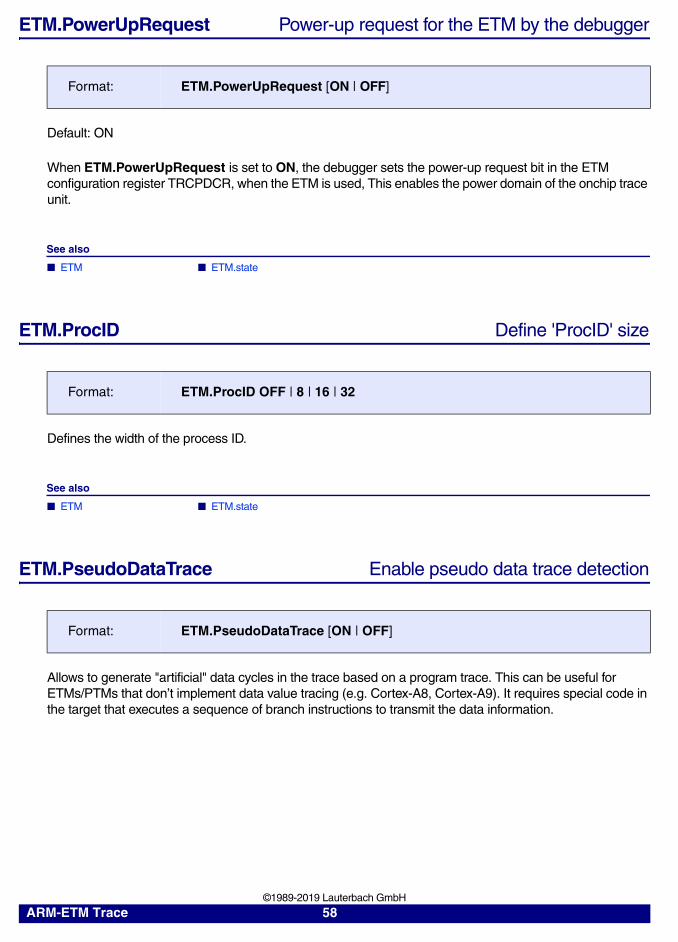
ETM.PowerUpRequest Power-up request for the ETM by the debugger
Default: ON
When ETM.PowerUpRequest is set to ON, the debugger sets the power-up request bit in the ETM configuration register TRCPDCR, when the ETM is used, This enables the power domain of the onchip trace unit.
See also
■ ETM ■ ETM.state
ETM.ProcID Define 'ProcID' size
Defines the width of the process ID.
See also
■ ETM ■ ETM.state
ETM.PseudoDataTrace Enable pseudo data trace detection
Allows to generate "artificial" data cycles in the trace based on a program trace. This can be useful for ETMs/PTMs that don’t implement data value tracing (e.g. Cortex-A8, Cortex-A9). It requires special code in the target that executes a sequence of branch instructions to transmit the data information.
Format: ETM.PowerUpRequest [ON | OFF]
Format: ETM.ProcID OFF | 8 | 16 | 32
Format: ETM.PseudoDataTrace [ON | OFF]
ARM-ETM Trace 58 ©1989-2019 Lauterbach GmbH
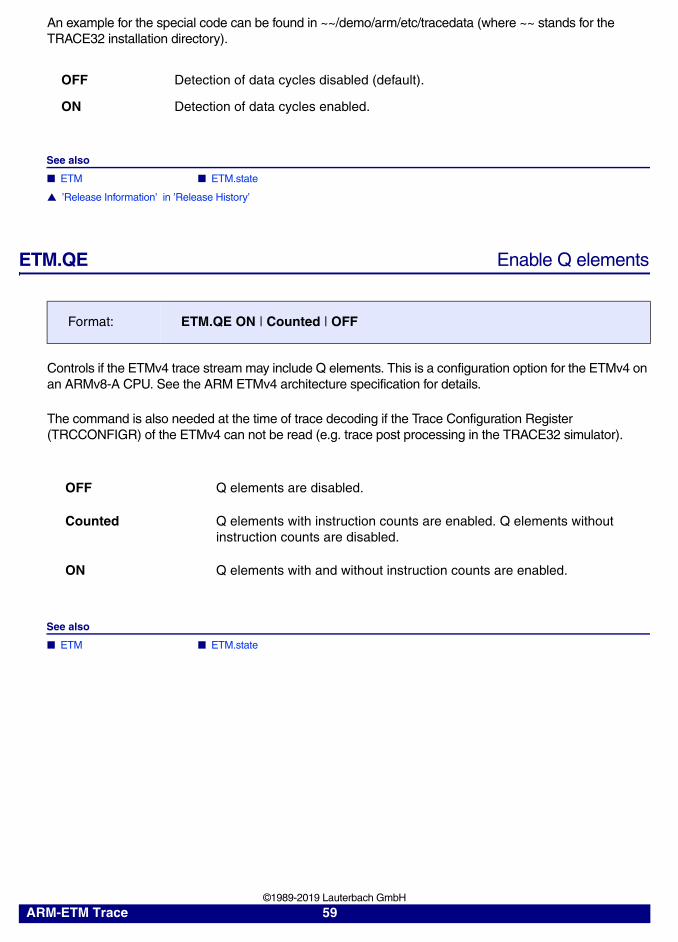
An example for the special code can be found in ~~/demo/arm/etc/tracedata (where ~~ stands for the TRACE32 installation directory).
See also
■ ETM ■ ETM.state
▲ ’Release Information’ in ’Release History’
ETM.QE Enable Q elements
Controls if the ETMv4 trace stream may include Q elements. This is a configuration option for the ETMv4 on an ARMv8-A CPU. See the ARM ETMv4 architecture specification for details.
The command is also needed at the time of trace decoding if the Trace Configuration Register (TRCCONFIGR) of the ETMv4 can not be read (e.g. trace post processing in the TRACE32 simulator).
See also
■ ETM ■ ETM.state
OFF Detection of data cycles disabled (default).
ON Detection of data cycles enabled.
Format: ETM.QE ON | Counted | OFF
OFF Q elements are disabled.
Counted Q elements with instruction counts are enabled. Q elements without instruction counts are disabled.
ON Q elements with and without instruction counts are enabled.
ARM-ETM Trace 59 ©1989-2019 Lauterbach GmbH
ETM.QTraceExclude Prohibit Q trace elements in given address range
While command ETM.QE ON allows the usage of Q elements in the trace stream globally, this commands enables Q elements only for certain address ranges (while they are forbidden elsewhere).
The commands ETM.QTraceInclude and ETM.QTraceExclude are mutually exclusive.
See also
■ ETM ■ ETM.state
ETM.QTraceInclude Allow Q trace elements in given address range
While command ETM.QE ON allows the usage of Q elements in the trace stream globally, this commands enables Q elements only for certain address ranges (while they are forbidden elsewhere).
The commands ETM.QTraceInclude and ETM.QTraceExclude are mutually exclusive.
See also
■ ETM ■ ETM.state
Format: ETM.QTraceExclude <access> <address_range> (ETM4.0)
<access>: Execute | Read | Write | ReadWrite
Format: ETM.QTraceInclude <access> <address_range> (ETM4.0)
<access>: Execute | Read | Write | ReadWrite
ARM-ETM Trace 60 ©1989-2019 Lauterbach GmbH
ETM.RefClock Enable STP reference clock
See also
■ ETM ■ ETM.state
Format: ETM.RefClock [ON | OFF]
OFF (default) Disable reference clock.
ON The STP preprocessor broadcasts a high frequency reference clock signal to the target. The frequency is half the bitrate (ETM.PortMode) in MHz.This option is required to support configuration C as specified in the ARM HSSTP architecture specification and should be disabled in other cases.
ARM-ETM Trace 61 ©1989-2019 Lauterbach GmbH
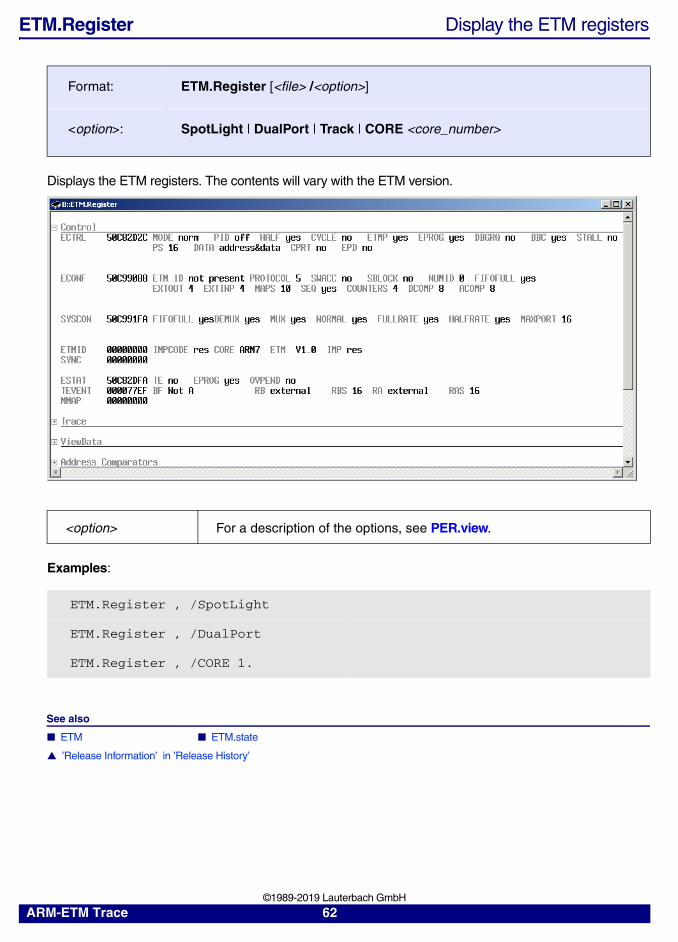
ETM.Register Display the ETM registers
Displays the ETM registers. The contents will vary with the ETM version.
Examples:
See also
■ ETM ■ ETM.state
▲ ’Release Information’ in ’Release History’
Format: ETM.Register [<file> /<option>]
<option>: SpotLight | DualPort | Track | CORE <core_number>
<option> For a description of the options, see PER.view.
ETM.Register , /SpotLight
ETM.Register , /DualPort
ETM.Register , /CORE 1.
ARM-ETM Trace 62 ©1989-2019 Lauterbach GmbH
ETM.RESet Reset ETM settings
Reset of setting of the ETM.state window to default.
See also
■ ETM ■ ETM.state
ETM.ReserveContextID Reserve special values used with context ID
Reserves a range of special values used at the ContextID register for special messages. These special values are not interpreted for task switch or memory space switch detection.
See also
■ ETM ■ ETM.state
ETM.ReturnStack Enable return stack tracing mode
See also
■ ETM ■ ETM.state
▲ ’Release Information’ in ’Release History’
Format: ETM.RESet
Format: ETM.ReserveContextID <range>
Format: ETM.ReturnStack [ON | OFF]
OFF Regular tracing of return instructions. Each return instruction generates indirect branch packets. (default)
ON Return instructions that hit the return stack may be traced as direct branches (PTM and ETMv4 only). This reduces the required trace port bandwidth and can reduce the number of trace port FIFO overflows.
ARM-ETM Trace 63 ©1989-2019 Lauterbach GmbH
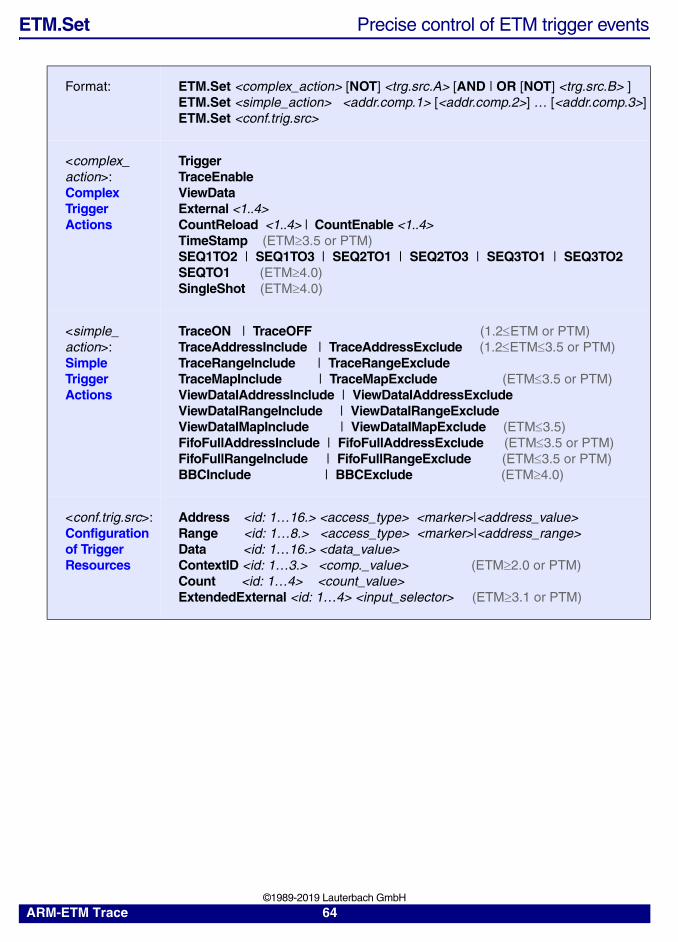
ETM.Set Precise control of ETM trigger events
Format: ETM.Set <complex_action> [NOT] <trg.src.A> [AND | OR [NOT] <trg.src.B> ]ETM.Set <simple_action> <addr.comp.1> [<addr.comp.2>] … [<addr.comp.3>]ETM.Set <conf.trig.src>
<complex_action>:Complex TriggerActions
TriggerTraceEnableViewDataExternal <1..4>CountReload <1..4> | CountEnable <1..4>TimeStamp (ETM3.5 or PTM)SEQ1TO2 | SEQ1TO3 | SEQ2TO1 | SEQ2TO3 | SEQ3TO1 | SEQ3TO2SEQTO1 (ETM4.0)SingleShot (ETM4.0)
<simple_action>:Simple Trigger Actions
TraceON | TraceOFF (1.2ETM or PTM)TraceAddressInclude | TraceAddressExclude (1.2ETM3.5 or PTM)TraceRangeInclude | TraceRangeExcludeTraceMapInclude | TraceMapExclude (ETM3.5 or PTM)ViewDataIAddressInclude | ViewDataIAddressExcludeViewDataIRangeInclude | ViewDataIRangeExcludeViewDataIMapInclude | ViewDataIMapExclude (ETM3.5)FifoFullAddressInclude | FifoFullAddressExclude (ETM3.5 or PTM)FifoFullRangeInclude | FifoFullRangeExclude (ETM3.5 or PTM)BBCInclude | BBCExclude (ETM4.0)
<conf.trig.src>:Configurationof Trigger Resources
Address <id: 1…16.> <access_type> <marker>|<address_value>Range <id: 1…8.> <access_type> <marker>|<address_range>Data <id: 1…16.> <data_value>ContextID <id: 1…3.> <comp._value> (ETM2.0 or PTM)Count <id: 1…4> <count_value>ExtendedExternal <id: 1…4> <input_selector> (ETM3.1 or PTM)
ARM-ETM Trace 64 ©1989-2019 Lauterbach GmbH
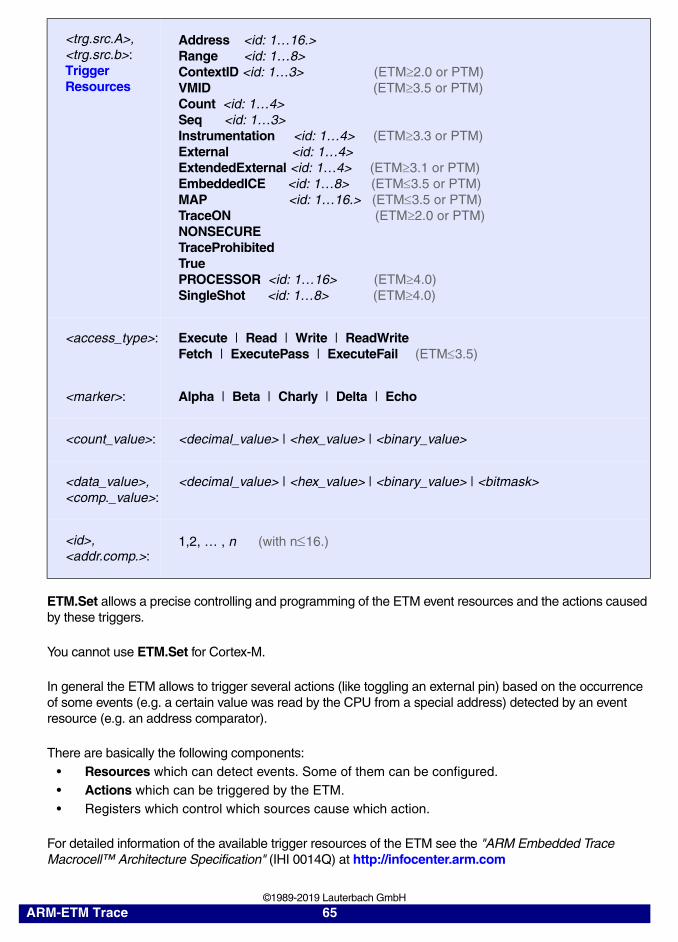
ETM.Set allows a precise controlling and programming of the ETM event resources and the actions caused by these triggers.
You cannot use ETM.Set for Cortex-M.
In general the ETM allows to trigger several actions (like toggling an external pin) based on the occurrence of some events (e.g. a certain value was read by the CPU from a special address) detected by an event resource (e.g. an address comparator).
There are basically the following components:• Resources which can detect events. Some of them can be configured.• Actions which can be triggered by the ETM.• Registers which control which sources cause which action.
For detailed information of the available trigger resources of the ETM see the "ARM Embedded Trace Macrocell™ Architecture Specification" (IHI 0014Q) at http://infocenter.arm.com
<trg.src.A>,<trg.src.b>:Trigger Resources
Address <id: 1…16.>Range <id: 1…8>ContextID <id: 1…3> (ETM2.0 or PTM)VMID (ETM3.5 or PTM)Count <id: 1…4> Seq <id: 1…3> Instrumentation <id: 1…4> (ETM3.3 or PTM)External <id: 1…4> ExtendedExternal <id: 1…4> (ETM3.1 or PTM)EmbeddedICE <id: 1…8> (ETM3.5 or PTM)MAP <id: 1…16.> (ETM3.5 or PTM)TraceON (ETM2.0 or PTM)NONSECURETraceProhibitedTruePROCESSOR <id: 1…16> (ETM4.0)SingleShot <id: 1…8> (ETM4.0)
<access_type>: Execute | Read | Write | ReadWrite Fetch | ExecutePass | ExecuteFail (ETM3.5)
<marker>: Alpha | Beta | Charly | Delta | Echo
<count_value>: <decimal_value> | <hex_value> | <binary_value>
<data_value>,<comp._value>:
<decimal_value> | <hex_value> | <binary_value> | <bitmask>
<id>,<addr.comp.>:
1,2, … , n (with n16.)
ARM-ETM Trace 65 ©1989-2019 Lauterbach GmbH
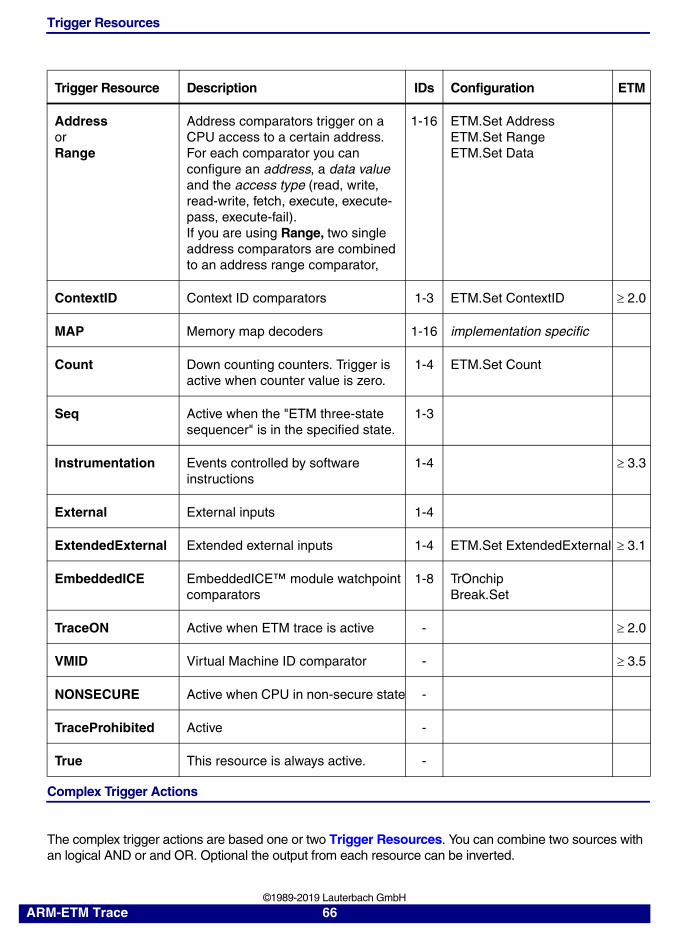
Trigger Resources
Complex Trigger Actions
The complex trigger actions are based one or two Trigger Resources. You can combine two sources with an logical AND or and OR. Optional the output from each resource can be inverted.
Trigger Resource Description IDs Configuration ETM
Address or Range
Address comparators trigger on a CPU access to a certain address. For each comparator you can configure an address, a data value and the access type (read, write, read-write, fetch, execute, execute-pass, execute-fail).If you are using Range, two single address comparators are combined to an address range comparator,
1-16 ETM.Set AddressETM.Set RangeETM.Set Data
ContextID Context ID comparators 1-3 ETM.Set ContextID 2.0
MAP Memory map decoders 1-16 implementation specific
Count Down counting counters. Trigger is active when counter value is zero.
1-4 ETM.Set Count
Seq Active when the "ETM three-state sequencer" is in the specified state.
1-3
Instrumentation Events controlled by software instructions
1-4 3.3
External External inputs 1-4
ExtendedExternal Extended external inputs 1-4 ETM.Set ExtendedExternal 3.1
EmbeddedICE EmbeddedICE™ module watchpoint comparators
1-8 TrOnchipBreak.Set
TraceON Active when ETM trace is active - 2.0
VMID Virtual Machine ID comparator - 3.5
NONSECURE Active when CPU in non-secure state -
TraceProhibited Active -
True This resource is always active. -
ARM-ETM Trace 66 ©1989-2019 Lauterbach GmbH
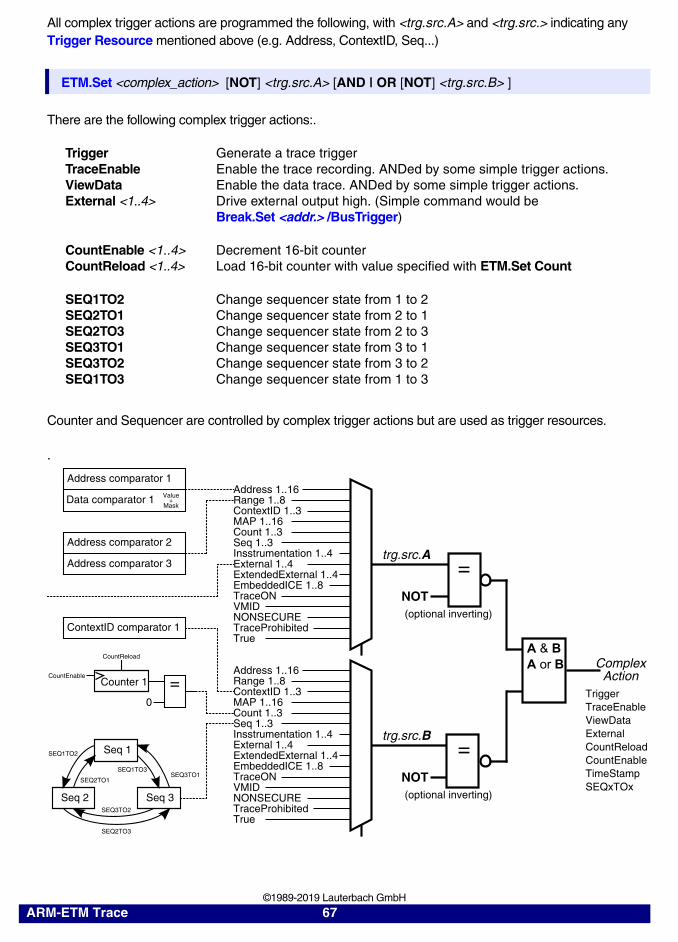
All complex trigger actions are programmed the following, with <trg.src.A> and <trg.src.> indicating any Trigger Resource mentioned above (e.g. Address, ContextID, Seq...)
There are the following complex trigger actions:.
Counter and Sequencer are controlled by complex trigger actions but are used as trigger resources.
.
ETM.Set <complex_action> [NOT] <trg.src.A> [AND | OR [NOT] <trg.src.B> ]
TriggerTraceEnableViewDataExternal <1..4>
Generate a trace triggerEnable the trace recording. ANDed by some simple trigger actions.Enable the data trace. ANDed by some simple trigger actions.Drive external output high. (Simple command would be Break.Set <addr.> /BusTrigger)
CountEnable <1..4>CountReload <1..4>
Decrement 16-bit counterLoad 16-bit counter with value specified with ETM.Set Count
SEQ1TO2SEQ2TO1SEQ2TO3SEQ3TO1SEQ3TO2SEQ1TO3
Change sequencer state from 1 to 2Change sequencer state from 2 to 1Change sequencer state from 2 to 3Change sequencer state from 3 to 1Change sequencer state from 3 to 2Change sequencer state from 1 to 3
A & BA or B
Address 1..16Range 1..8ContextID 1..3MAP 1..16Count 1..3Seq 1..3Insstrumentation 1..4External 1..4ExtendedExternal 1..4EmbeddedICE 1..8TraceONVMIDNONSECURETraceProhibitedTrue
trg.src.A
trg.src.B
=
NOT
(optional inverting)
=
NOT
(optional inverting)
ComplexAction
Address 1..16Range 1..8ContextID 1..3MAP 1..16Count 1..3Seq 1..3Insstrumentation 1..4External 1..4ExtendedExternal 1..4EmbeddedICE 1..8TraceONVMIDNONSECURETraceProhibitedTrue
Data comparator 1 Value
+Mask
Address comparator 1
Address comparator 2
Address comparator 3
Seq 1
Seq 2 Seq 3
SEQ1TO2
SEQ2TO3
SEQ3TO1SEQ2TO1
SEQ3TO2
SEQ1TO3
ContextID comparator 1
Counter 1 CountEnable
=0
CountReload
Trigger
TraceEnable
ViewData
External
CountReload
CountEnable
TimeStamp
SEQxTOx
ARM-ETM Trace 67 ©1989-2019 Lauterbach GmbH

Simple Trigger Actions
The simple trigger actions are based on several address ranges. You can combine all address comparators with a logical OR as a trigger source for a simple action. However the only Trigger Resources you can use for simple triggers are the Address, Range and MAP sources.
All simple trigger actions are programmed the following, with <id> specifying IDs of Address, Range or MAP sources depending on the used simple-action:
The following simple actions enable or disable the trace recording. From the include/exclude triggers you can use either some trace-includes or some of the trace-excludes. But you can’t mix them.
The trace is enabled when it should be enabled according to TraceON/TraceOFF, according to TraceAddress/Range/MapInclude (or TraceAddress/Range/MapExclude) and also according to the complex action trigger ETM.Set TraceEnable. If you don’t configure one resource it fires an enable by default.
ETM.Set <simple_action> <id.1> [<id.2>] … [<id.16>]
TraceON TraceOFF
Select single address(es) where tracing gets enabled.Select single address(es) where tracing gets disabled.
TraceAddressInclude TraceRangeInclude TraceMapInclude
Select single address(es) where tracing is doneSelect address range(s) where tracing is doneSelect memory map decoder regions where tracing is done
TraceAddressExclude TraceRangeExclude TraceMapExclude
Select single address(es) where tracing is disabledSelect address range(s) where tracing is disabledSelect memory map decoder regions where tracing is disabled
ARM-ETM Trace 68 ©1989-2019 Lauterbach GmbH
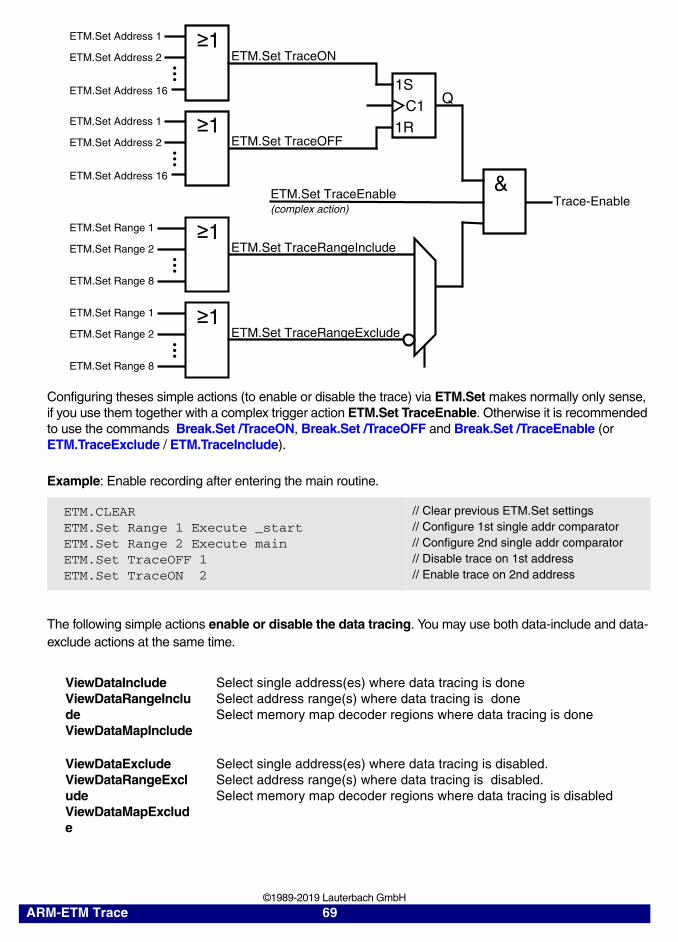
Configuring theses simple actions (to enable or disable the trace) via ETM.Set makes normally only sense, if you use them together with a complex trigger action ETM.Set TraceEnable. Otherwise it is recommended to use the commands Break.Set /TraceON, Break.Set /TraceOFF and Break.Set /TraceEnable (or ETM.TraceExclude / ETM.TraceInclude).
Example: Enable recording after entering the main routine.
The following simple actions enable or disable the data tracing. You may use both data-include and data-exclude actions at the same time.
ETM.CLEARETM.Set Range 1 Execute _startETM.Set Range 2 Execute mainETM.Set TraceOFF 1ETM.Set TraceON 2
// Clear previous ETM.Set settings// Configure 1st single addr comparator// Configure 2nd single addr comparator// Disable trace on 1st address// Enable trace on 2nd address
ViewDataInclude ViewDataRangeInclude ViewDataMapInclude
Select single address(es) where data tracing is doneSelect address range(s) where data tracing is doneSelect memory map decoder regions where data tracing is done
ViewDataExclude ViewDataRangeExclude ViewDataMapExclude
Select single address(es) where data tracing is disabled.Select address range(s) where data tracing is disabled.Select memory map decoder regions where data tracing is disabled
1R
C1Q
1S
ETM.Set TraceON
ETM.Set Address 1
ETM.Set Address 2
ETM.Set Address 16
1
ETM.Set TraceRangeInclude
ETM.Set TraceOFF
Trace-Enable&
ETM.Set Address 1
ETM.Set Address 2
ETM.Set Address 16
1
ETM.Set Range 1
ETM.Set Range 2
ETM.Set Range 8
1
ETM.Set Range 1
ETM.Set Range 2
ETM.Set Range 8
1ETM.Set TraceRangeExclude
ETM.Set TraceEnable(complex action)
ARM-ETM Trace 69 ©1989-2019 Lauterbach GmbH
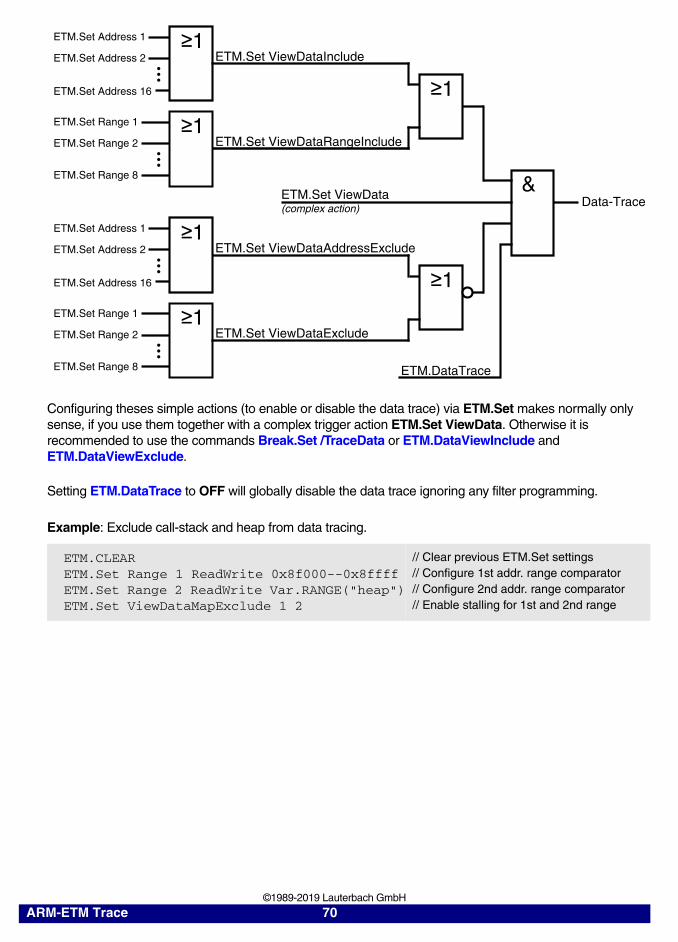
Configuring theses simple actions (to enable or disable the data trace) via ETM.Set makes normally only sense, if you use them together with a complex trigger action ETM.Set ViewData. Otherwise it is recommended to use the commands Break.Set /TraceData or ETM.DataViewInclude and ETM.DataViewExclude.
Setting ETM.DataTrace to OFF will globally disable the data trace ignoring any filter programming.
Example: Exclude call-stack and heap from data tracing.
ETM.CLEARETM.Set Range 1 ReadWrite 0x8f000--0x8ffffETM.Set Range 2 ReadWrite Var.RANGE("heap")ETM.Set ViewDataMapExclude 1 2
// Clear previous ETM.Set settings// Configure 1st addr. range comparator// Configure 2nd addr. range comparator// Enable stalling for 1st and 2nd range
ETM.Set ViewDataInclude
ETM.Set Address 1
ETM.Set Address 2
ETM.Set Address 16
1
ETM.Set ViewDataAddressExclude
ETM.Set ViewDataRangeInclude
Data-Trace&
ETM.Set Address 1
ETM.Set Address 2
ETM.Set Address 16
1
ETM.Set Range 1
ETM.Set Range 2
ETM.Set Range 8
1
ETM.Set Range 1
ETM.Set Range 2
ETM.Set Range 8
1
ETM.Set ViewDataExclude
1
1
ETM.Set ViewData(complex action)
ETM.DataTrace
ARM-ETM Trace 70 ©1989-2019 Lauterbach GmbH
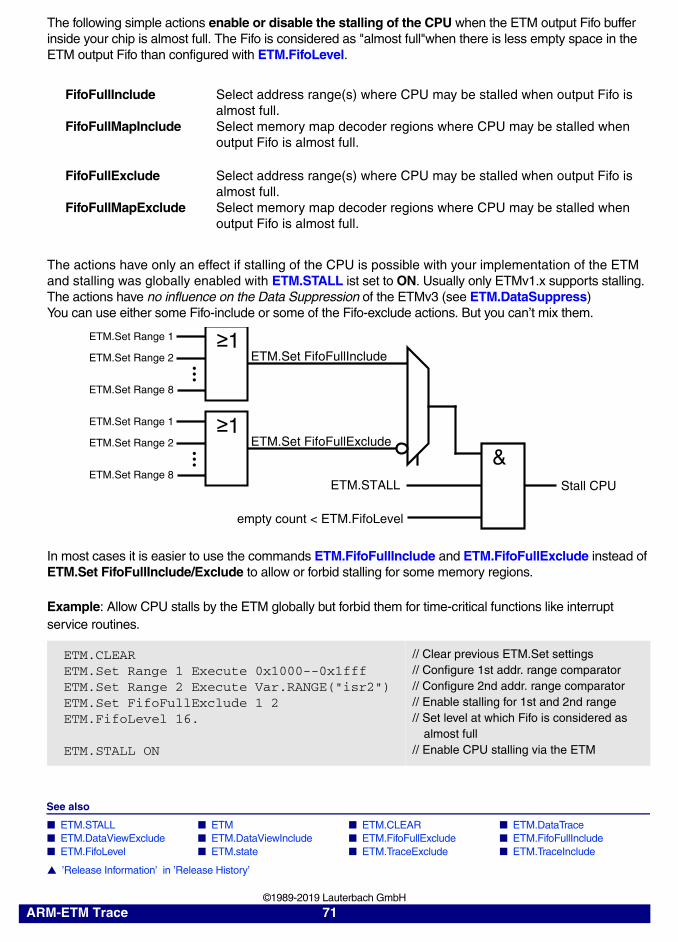
The following simple actions enable or disable the stalling of the CPU when the ETM output Fifo buffer inside your chip is almost full. The Fifo is considered as "almost full"when there is less empty space in the ETM output Fifo than configured with ETM.FifoLevel.
The actions have only an effect if stalling of the CPU is possible with your implementation of the ETM and stalling was globally enabled with ETM.STALL ist set to ON. Usually only ETMv1.x supports stalling. The actions have no influence on the Data Suppression of the ETMv3 (see ETM.DataSuppress)You can use either some Fifo-include or some of the Fifo-exclude actions. But you can’t mix them.
In most cases it is easier to use the commands ETM.FifoFullInclude and ETM.FifoFullExclude instead of ETM.Set FifoFullInclude/Exclude to allow or forbid stalling for some memory regions.
Example: Allow CPU stalls by the ETM globally but forbid them for time-critical functions like interrupt service routines.
See also
■ ETM.STALL ■ ETM ■ ETM.CLEAR ■ ETM.DataTrace ■ ETM.DataViewExclude ■ ETM.DataViewInclude ■ ETM.FifoFullExclude ■ ETM.FifoFullInclude ■ ETM.FifoLevel ■ ETM.state ■ ETM.TraceExclude ■ ETM.TraceInclude
▲ ’Release Information’ in ’Release History’
FifoFullInclude
FifoFullMapInclude
Select address range(s) where CPU may be stalled when output Fifo is almost full.Select memory map decoder regions where CPU may be stalled when output Fifo is almost full.
FifoFullExclude
FifoFullMapExclude
Select address range(s) where CPU may be stalled when output Fifo is almost full.Select memory map decoder regions where CPU may be stalled when output Fifo is almost full.
ETM.CLEARETM.Set Range 1 Execute 0x1000--0x1fffETM.Set Range 2 Execute Var.RANGE("isr2")ETM.Set FifoFullExclude 1 2ETM.FifoLevel 16.
ETM.STALL ON
// Clear previous ETM.Set settings// Configure 1st addr. range comparator// Configure 2nd addr. range comparator// Enable stalling for 1st and 2nd range// Set level at which Fifo is considered as
almost full// Enable CPU stalling via the ETM
ETM.STALL Stall CPU
empty count < ETM.FifoLevel
&
ETM.Set FifoFullInclude
ETM.Set Range 1
ETM.Set Range 2
ETM.Set Range 8
1
ETM.Set Range 1
ETM.Set Range 2
ETM.Set Range 8
ETM.Set FifoFullExclude1
ARM-ETM Trace 71 ©1989-2019 Lauterbach GmbH
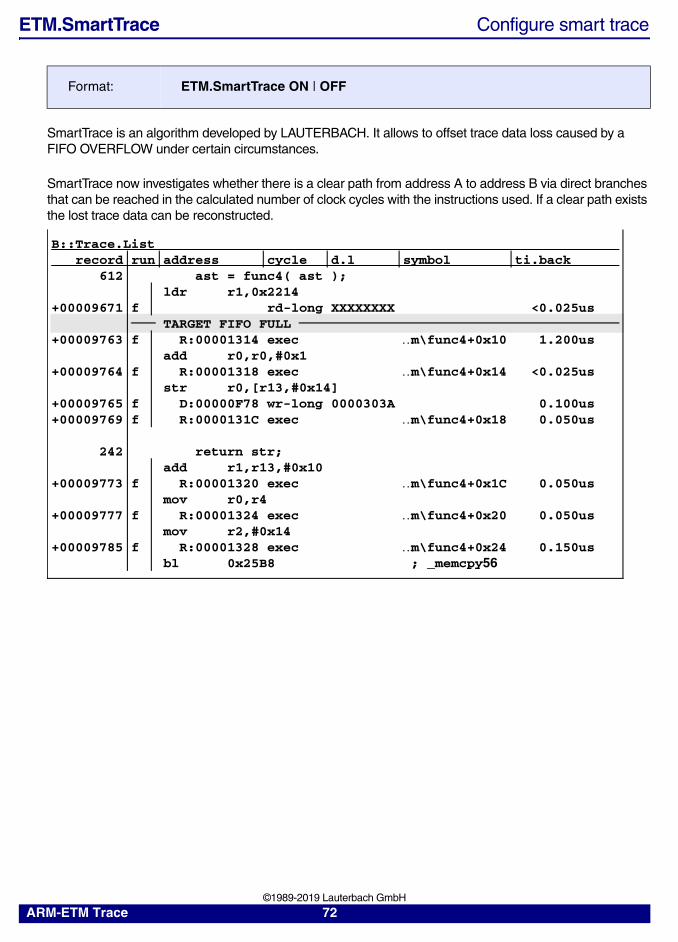
ETM.SmartTrace Configure smart trace
SmartTrace is an algorithm developed by LAUTERBACH. It allows to offset trace data loss caused by a FIFO OVERFLOW under certain circumstances.
SmartTrace now investigates whether there is a clear path from address A to address B via direct branches that can be reached in the calculated number of clock cycles with the instructions used. If a clear path exists the lost trace data can be reconstructed.
Format: ETM.SmartTrace ON | OFF
B::Trace.Listrecord run address cycle d.l symbol ti.back
612 ast = func4( ast );ldr r1,0x2214
+00009671 f rd-long XXXXXXXX <0.025usTARGET FIFO FULL
+00009763 f R:00001314 exec m\func4+0x10 1.200usadd r0,r0,#0x1
+00009764 f R:00001318 exec m\func4+0x14 <0.025usstr r0,[r13,#0x14]
+00009765 f D:00000F78 wr-long 0000303A 0.100us+00009769 f R:0000131C exec m\func4+0x18 0.050us
242 return str;add r1,r13,#0x10
+00009773 f R:00001320 exec m\func4+0x1C 0.050usmov r0,r4
+00009777 f R:00001324 exec m\func4+0x20 0.050usmov r2,#0x14
+00009785 f R:00001328 exec m\func4+0x24 0.150usbl 0x25B8 ; _memcpy56
ARM-ETM Trace 72 ©1989-2019 Lauterbach GmbH
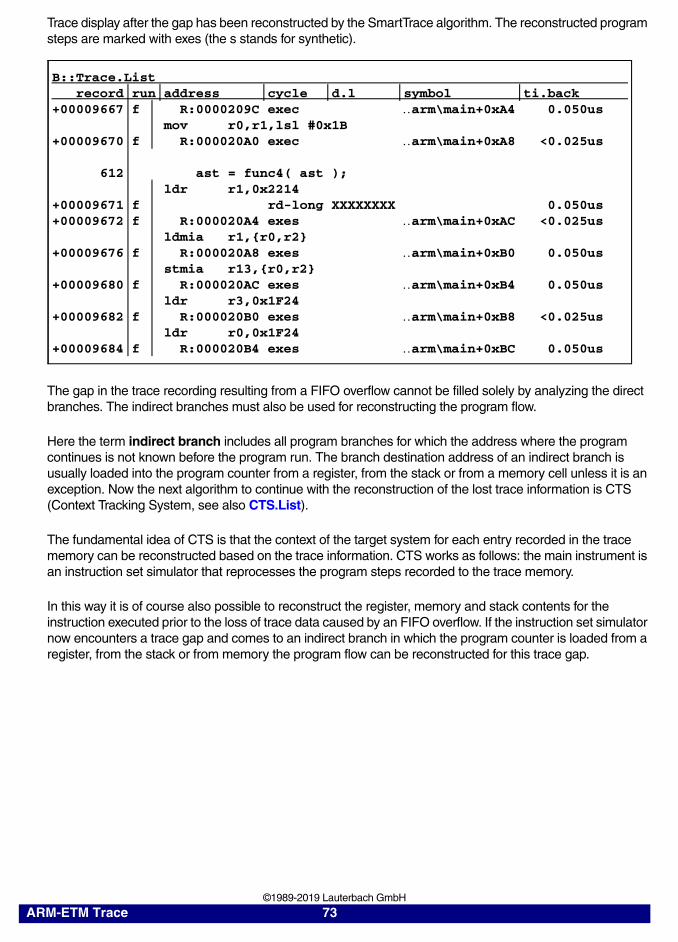
Trace display after the gap has been reconstructed by the SmartTrace algorithm. The reconstructed program steps are marked with exes (the s stands for synthetic).
The gap in the trace recording resulting from a FIFO overflow cannot be filled solely by analyzing the direct branches. The indirect branches must also be used for reconstructing the program flow.
Here the term indirect branch includes all program branches for which the address where the program continues is not known before the program run. The branch destination address of an indirect branch is usually loaded into the program counter from a register, from the stack or from a memory cell unless it is an exception. Now the next algorithm to continue with the reconstruction of the lost trace information is CTS (Context Tracking System, see also CTS.List).
The fundamental idea of CTS is that the context of the target system for each entry recorded in the trace memory can be reconstructed based on the trace information. CTS works as follows: the main instrument is an instruction set simulator that reprocesses the program steps recorded to the trace memory.
In this way it is of course also possible to reconstruct the register, memory and stack contents for the instruction executed prior to the loss of trace data caused by an FIFO overflow. If the instruction set simulator now encounters a trace gap and comes to an indirect branch in which the program counter is loaded from a register, from the stack or from memory the program flow can be reconstructed for this trace gap.
B::Trace.Listrecord run address cycle d.l symbol ti.back
+00009667 f R:0000209C exec arm\main+0xA4 0.050usmov r0,r1,lsl #0x1B
+00009670 f R:000020A0 exec arm\main+0xA8 <0.025us
612 ast = func4( ast );ldr r1,0x2214
+00009671 f rd-long XXXXXXXX 0.050us+00009672 f R:000020A4 exes arm\main+0xAC <0.025us
ldmia r1,{r0,r2}+00009676 f R:000020A8 exes arm\main+0xB0 0.050us
stmia r13,{r0,r2}+00009680 f R:000020AC exes arm\main+0xB4 0.050us
ldr r3,0x1F24+00009682 f R:000020B0 exes arm\main+0xB8 <0.025us
ldr r0,0x1F24+00009684 f R:000020B4 exes arm\main+0xBC 0.050us
ARM-ETM Trace 73 ©1989-2019 Lauterbach GmbH
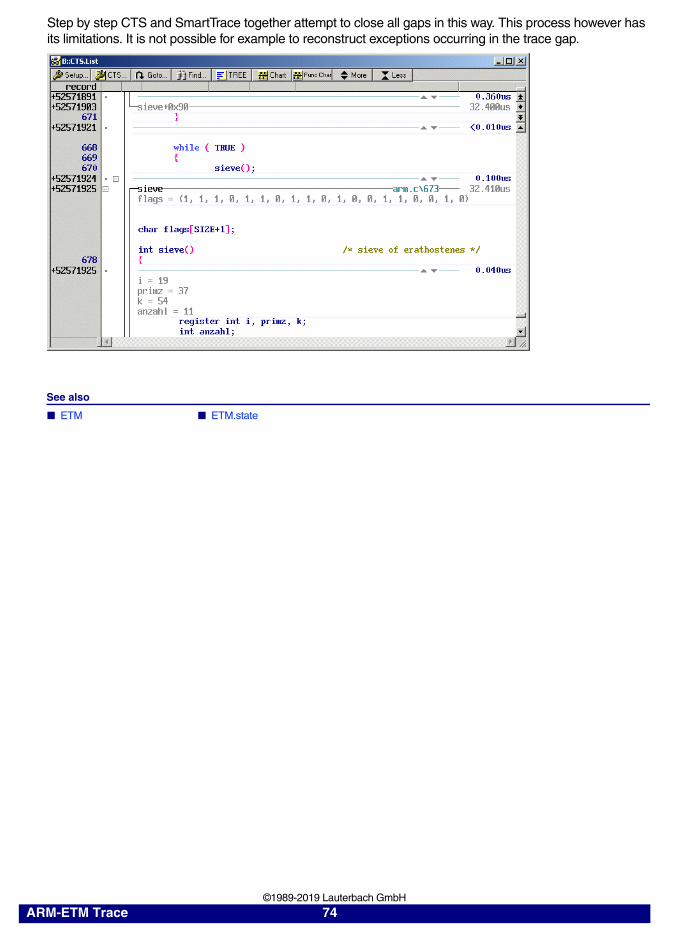
Step by step CTS and SmartTrace together attempt to close all gaps in this way. This process however has its limitations. It is not possible for example to reconstruct exceptions occurring in the trace gap.
See also
■ ETM ■ ETM.state
ARM-ETM Trace 74 ©1989-2019 Lauterbach GmbH
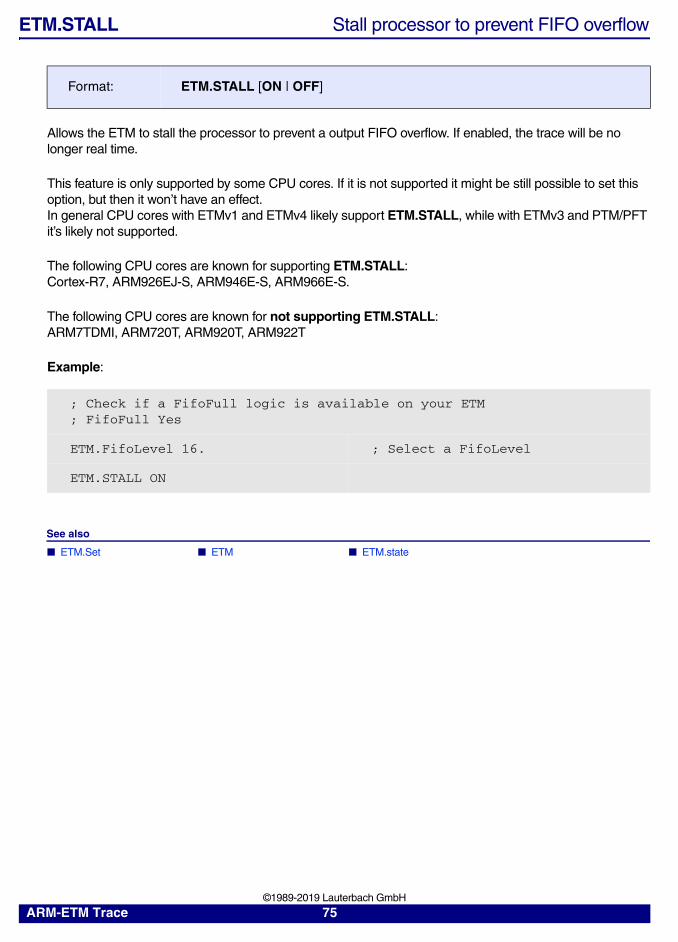
ETM.STALL Stall processor to prevent FIFO overflow
Allows the ETM to stall the processor to prevent a output FIFO overflow. If enabled, the trace will be no longer real time.
This feature is only supported by some CPU cores. If it is not supported it might be still possible to set this option, but then it won’t have an effect.In general CPU cores with ETMv1 and ETMv4 likely support ETM.STALL, while with ETMv3 and PTM/PFT it’s likely not supported.
The following CPU cores are known for supporting ETM.STALL: Cortex-R7, ARM926EJ-S, ARM946E-S, ARM966E-S.
The following CPU cores are known for not supporting ETM.STALL: ARM7TDMI, ARM720T, ARM920T, ARM922T
Example:
See also
■ ETM.Set ■ ETM ■ ETM.state
Format: ETM.STALL [ON | OFF]
; Check if a FifoFull logic is available on your ETM; FifoFull Yes
ETM.FifoLevel 16. ; Select a FifoLevel
ETM.STALL ON
ARM-ETM Trace 75 ©1989-2019 Lauterbach GmbH
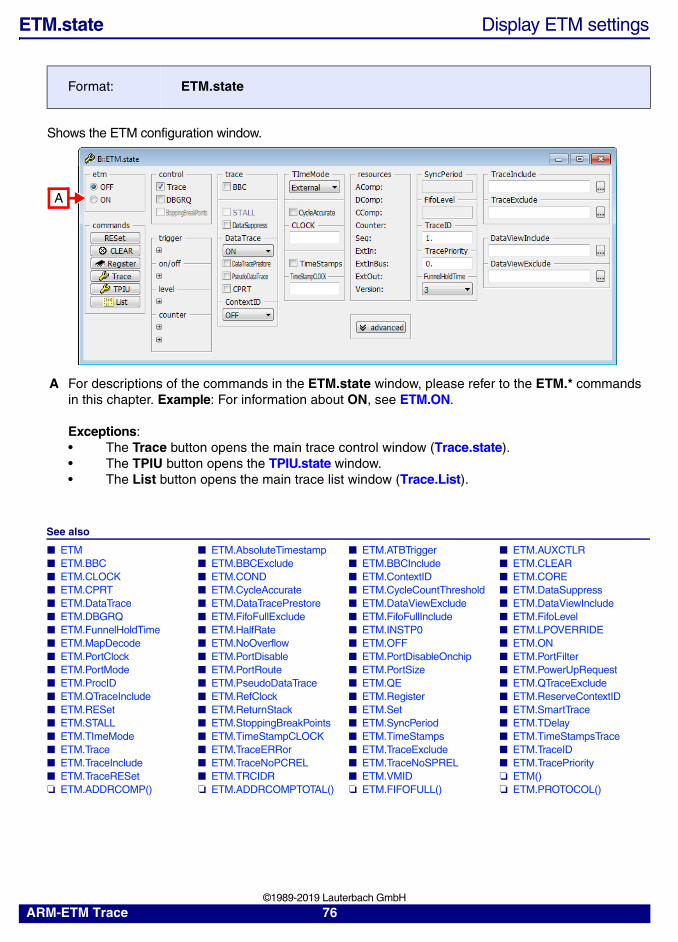
ETM.state Display ETM settings
Shows the ETM configuration window.
See also
■ ETM ■ ETM.AbsoluteTimestamp ■ ETM.ATBTrigger ■ ETM.AUXCTLR ■ ETM.BBC ■ ETM.BBCExclude ■ ETM.BBCInclude ■ ETM.CLEAR ■ ETM.CLOCK ■ ETM.COND ■ ETM.ContextID ■ ETM.CORE ■ ETM.CPRT ■ ETM.CycleAccurate ■ ETM.CycleCountThreshold ■ ETM.DataSuppress ■ ETM.DataTrace ■ ETM.DataTracePrestore ■ ETM.DataViewExclude ■ ETM.DataViewInclude ■ ETM.DBGRQ ■ ETM.FifoFullExclude ■ ETM.FifoFullInclude ■ ETM.FifoLevel ■ ETM.FunnelHoldTime ■ ETM.HalfRate ■ ETM.INSTP0 ■ ETM.LPOVERRIDE ■ ETM.MapDecode ■ ETM.NoOverflow ■ ETM.OFF ■ ETM.ON ■ ETM.PortClock ■ ETM.PortDisable ■ ETM.PortDisableOnchip ■ ETM.PortFilter ■ ETM.PortMode ■ ETM.PortRoute ■ ETM.PortSize ■ ETM.PowerUpRequest ■ ETM.ProcID ■ ETM.PseudoDataTrace ■ ETM.QE ■ ETM.QTraceExclude ■ ETM.QTraceInclude ■ ETM.RefClock ■ ETM.Register ■ ETM.ReserveContextID ■ ETM.RESet ■ ETM.ReturnStack ■ ETM.Set ■ ETM.SmartTrace ■ ETM.STALL ■ ETM.StoppingBreakPoints ■ ETM.SyncPeriod ■ ETM.TDelay ■ ETM.TImeMode ■ ETM.TimeStampCLOCK ■ ETM.TimeStamps ■ ETM.TimeStampsTrace ■ ETM.Trace ■ ETM.TraceERRor ■ ETM.TraceExclude ■ ETM.TraceID ■ ETM.TraceInclude ■ ETM.TraceNoPCREL ■ ETM.TraceNoSPREL ■ ETM.TracePriority ■ ETM.TraceRESet ■ ETM.TRCIDR ■ ETM.VMID ❏ ETM() ❏ ETM.ADDRCOMP() ❏ ETM.ADDRCOMPTOTAL() ❏ ETM.FIFOFULL() ❏ ETM.PROTOCOL()
Format: ETM.state
A For descriptions of the commands in the ETM.state window, please refer to the ETM.* commands in this chapter. Example: For information about ON, see ETM.ON.
Exceptions:• The Trace button opens the main trace control window (Trace.state).• The TPIU button opens the TPIU.state window. • The List button opens the main trace list window (Trace.List).
A
ARM-ETM Trace 76 ©1989-2019 Lauterbach GmbH
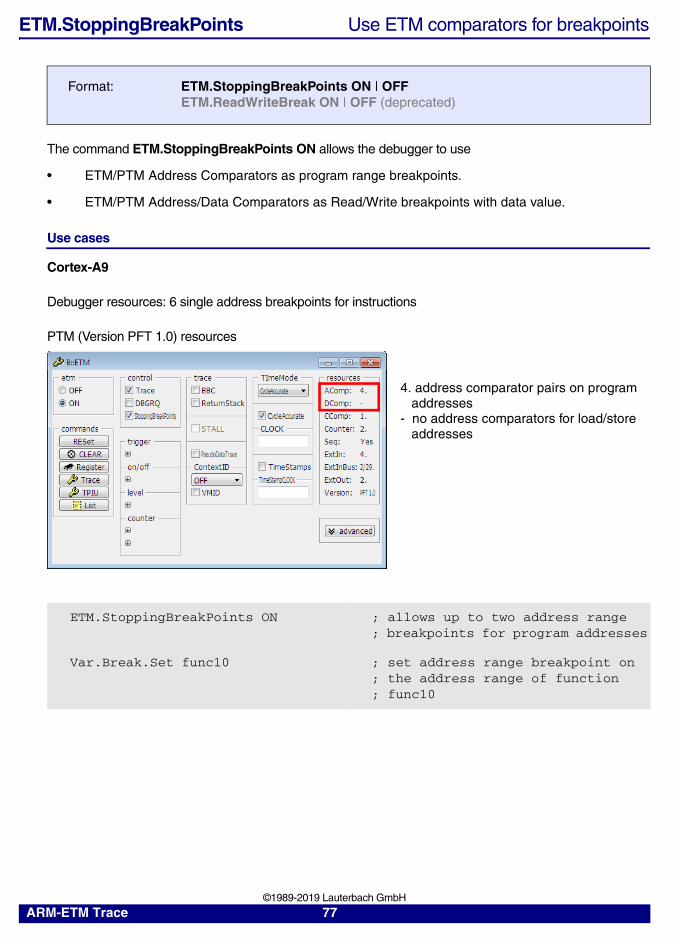
ETM.StoppingBreakPoints Use ETM comparators for breakpoints
The command ETM.StoppingBreakPoints ON allows the debugger to use
• ETM/PTM Address Comparators as program range breakpoints.
• ETM/PTM Address/Data Comparators as Read/Write breakpoints with data value.
Use cases
Cortex-A9
Debugger resources: 6 single address breakpoints for instructions
PTM (Version PFT 1.0) resources
Format: ETM.StoppingBreakPoints ON | OFFETM.ReadWriteBreak ON | OFF (deprecated)
ETM.StoppingBreakPoints ON ; allows up to two address range; breakpoints for program addresses
Var.Break.Set func10 ; set address range breakpoint on ; the address range of function; func10
4. address comparator pairs on program addresses- no address comparators for load/store addresses
ARM-ETM Trace 77 ©1989-2019 Lauterbach GmbH
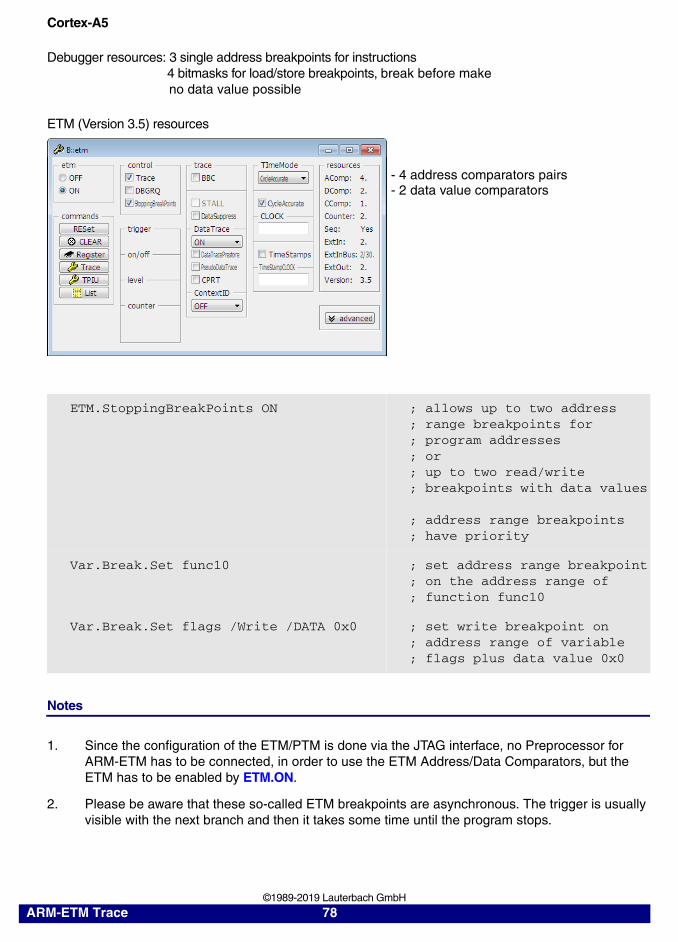
Cortex-A5
Debugger resources: 3 single address breakpoints for instructions 4 bitmasks for load/store breakpoints, break before make no data value possible
ETM (Version 3.5) resources
Notes
1. Since the configuration of the ETM/PTM is done via the JTAG interface, no Preprocessor for ARM-ETM has to be connected, in order to use the ETM Address/Data Comparators, but the ETM has to be enabled by ETM.ON.
2. Please be aware that these so-called ETM breakpoints are asynchronous. The trigger is usually visible with the next branch and then it takes some time until the program stops.
ETM.StoppingBreakPoints ON ; allows up to two address ; range breakpoints for; program addresses; or; up to two read/write; breakpoints with data values
; address range breakpoints; have priority
Var.Break.Set func10 ; set address range breakpoint; on the address range of; function func10
Var.Break.Set flags /Write /DATA 0x0 ; set write breakpoint on; address range of variable; flags plus data value 0x0
- 4 address comparators pairs- 2 data value comparators
ARM-ETM Trace 78 ©1989-2019 Lauterbach GmbH
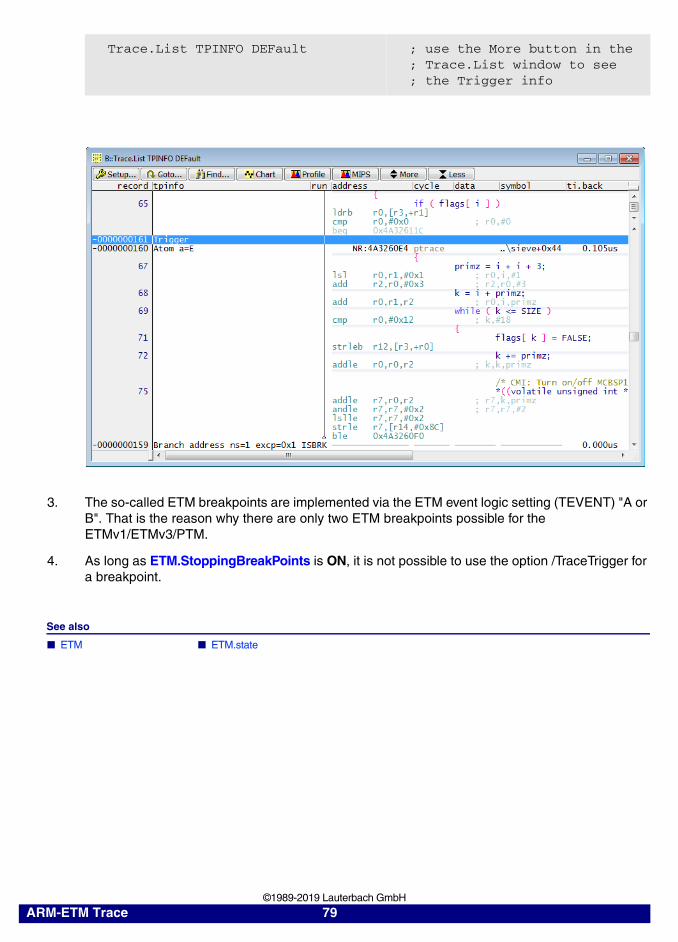
3. The so-called ETM breakpoints are implemented via the ETM event logic setting (TEVENT) "A or B". That is the reason why there are only two ETM breakpoints possible for the ETMv1/ETMv3/PTM.
4. As long as ETM.StoppingBreakPoints is ON, it is not possible to use the option /TraceTrigger for a breakpoint.
See also
■ ETM ■ ETM.state
Trace.List TPINFO DEFault ; use the More button in the; Trace.List window to see; the Trigger info
ARM-ETM Trace 79 ©1989-2019 Lauterbach GmbH
ETM.SyncPeriod Set synchronization frequency
Synchronisation and timestamp packets are generated periodically. The default frequency is 1024 clock or 1024 bytes.
The command ETM.SyncPeriod allows to change this value. Please refer to your ETM/PTM manuals for details (ETMSYNCFR register).
See also
■ ETM ■ ETM.state
ETM.TDelay Define trigger delay
Please use Analyzer.TDelay.
See also
■ ETM ■ ETM.state
Format: ETM.SyncPeriod [<period>]
Format: ETM.TDelay <value> (deprecated)
ARM-ETM Trace 80 ©1989-2019 Lauterbach GmbH
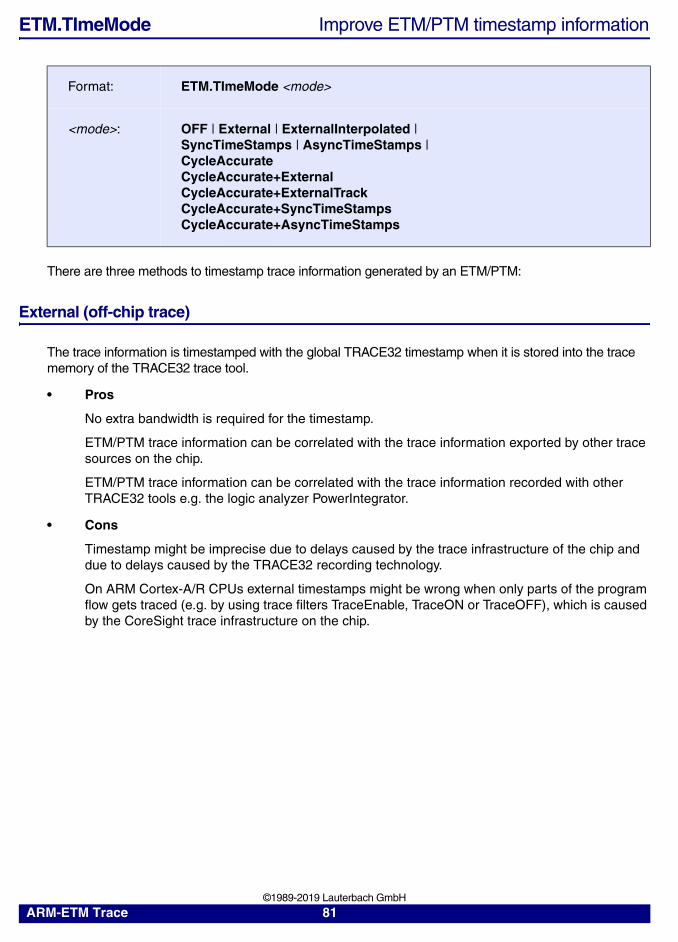
ETM.TImeMode Improve ETM/PTM timestamp information
There are three methods to timestamp trace information generated by an ETM/PTM:
External (off-chip trace)
The trace information is timestamped with the global TRACE32 timestamp when it is stored into the trace memory of the TRACE32 trace tool.
• Pros
No extra bandwidth is required for the timestamp.
ETM/PTM trace information can be correlated with the trace information exported by other trace sources on the chip.
ETM/PTM trace information can be correlated with the trace information recorded with other TRACE32 tools e.g. the logic analyzer PowerIntegrator.
• Cons
Timestamp might be imprecise due to delays caused by the trace infrastructure of the chip and due to delays caused by the TRACE32 recording technology.
On ARM Cortex-A/R CPUs external timestamps might be wrong when only parts of the program flow gets traced (e.g. by using trace filters TraceEnable, TraceON or TraceOFF), which is caused by the CoreSight trace infrastructure on the chip.
Format: ETM.TImeMode <mode>
<mode>: OFF | External | ExternalInterpolated | SyncTimeStamps | AsyncTimeStamps | CycleAccurateCycleAccurate+ExternalCycleAccurate+ExternalTrackCycleAccurate+SyncTimeStampsCycleAccurate+AsyncTimeStamps
ARM-ETM Trace 81 ©1989-2019 Lauterbach GmbH
CycleAccurate (on-chip and off-chip trace)
The ETM/PTM protocol provides the number of core clock cycles that were needed by an instruction or an instruction range.
• Pros
Provides accurate core clock cycle information.
Accurate time information can be calculated, if the core clock was constant while recording the trace information.
• Cons
Cycle accurate tracing requires up to 4 times more bandwidth.
ETM/PTM trace information can not be correlated with any other trace information.
Trace information has to be processed always from the start of the trace memory. "Tracking" indicates that the display of the trace information might need some time.
TimeStamps (on-chip and off-chip trace)
Timestamp Packets are exported by the ETM/PTM.
• Pros
ETM/PTM trace information can be correlated with the trace information exported by other trace sources on the chip.
• Cons
Timestamp Packets are not generated too often. Thus, only a rather inaccurate time information is possible.
Timestamp Packets require some bandwidth.
ARM-ETM Trace 82 ©1989-2019 Lauterbach GmbH
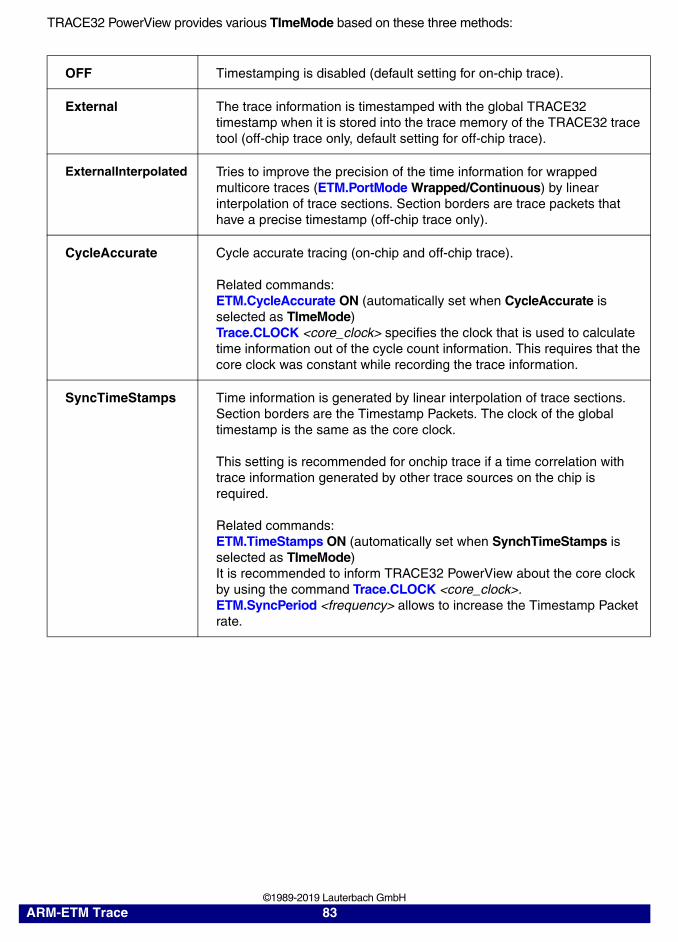
TRACE32 PowerView provides various TImeMode based on these three methods:
OFF Timestamping is disabled (default setting for on-chip trace).
External The trace information is timestamped with the global TRACE32 timestamp when it is stored into the trace memory of the TRACE32 trace tool (off-chip trace only, default setting for off-chip trace).
ExternalInterpolated Tries to improve the precision of the time information for wrapped multicore traces (ETM.PortMode Wrapped/Continuous) by linear interpolation of trace sections. Section borders are trace packets that have a precise timestamp (off-chip trace only).
CycleAccurate Cycle accurate tracing (on-chip and off-chip trace).
Related commands:ETM.CycleAccurate ON (automatically set when CycleAccurate is selected as TImeMode)Trace.CLOCK <core_clock> specifies the clock that is used to calculate time information out of the cycle count information. This requires that the core clock was constant while recording the trace information.
SyncTimeStamps Time information is generated by linear interpolation of trace sections. Section borders are the Timestamp Packets. The clock of the global timestamp is the same as the core clock.
This setting is recommended for onchip trace if a time correlation with trace information generated by other trace sources on the chip is required.
Related commands:ETM.TimeStamps ON (automatically set when SynchTimeStamps is selected as TImeMode)It is recommended to inform TRACE32 PowerView about the core clock by using the command Trace.CLOCK <core_clock>.ETM.SyncPeriod <frequency> allows to increase the Timestamp Packet rate.
ARM-ETM Trace 83 ©1989-2019 Lauterbach GmbH
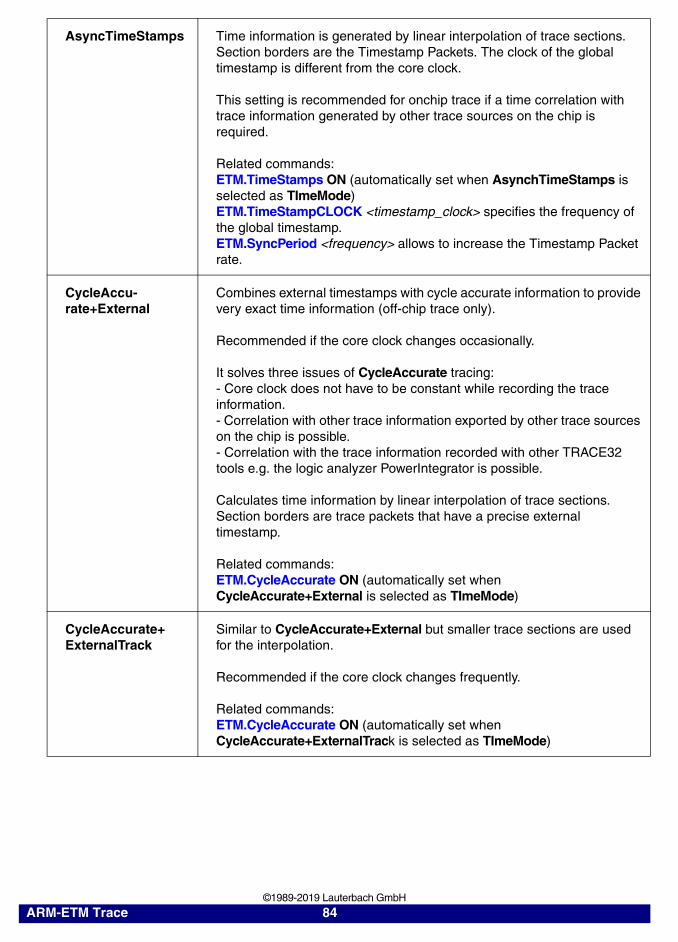
AsyncTimeStamps Time information is generated by linear interpolation of trace sections. Section borders are the Timestamp Packets. The clock of the global timestamp is different from the core clock.
This setting is recommended for onchip trace if a time correlation with trace information generated by other trace sources on the chip is required.
Related commands:ETM.TimeStamps ON (automatically set when AsynchTimeStamps is selected as TImeMode)ETM.TimeStampCLOCK <timestamp_clock> specifies the frequency of the global timestamp.ETM.SyncPeriod <frequency> allows to increase the Timestamp Packet rate.
CycleAccu-rate+External
Combines external timestamps with cycle accurate information to provide very exact time information (off-chip trace only).
Recommended if the core clock changes occasionally.
It solves three issues of CycleAccurate tracing:- Core clock does not have to be constant while recording the trace information.- Correlation with other trace information exported by other trace sources on the chip is possible.- Correlation with the trace information recorded with other TRACE32 tools e.g. the logic analyzer PowerIntegrator is possible.
Calculates time information by linear interpolation of trace sections. Section borders are trace packets that have a precise external timestamp.
Related commands:ETM.CycleAccurate ON (automatically set when CycleAccurate+External is selected as TImeMode)
CycleAccurate+ExternalTrack
Similar to CycleAccurate+External but smaller trace sections are used for the interpolation.
Recommended if the core clock changes frequently.
Related commands:ETM.CycleAccurate ON (automatically set when CycleAccurate+ExternalTrack is selected as TImeMode)
ARM-ETM Trace 84 ©1989-2019 Lauterbach GmbH
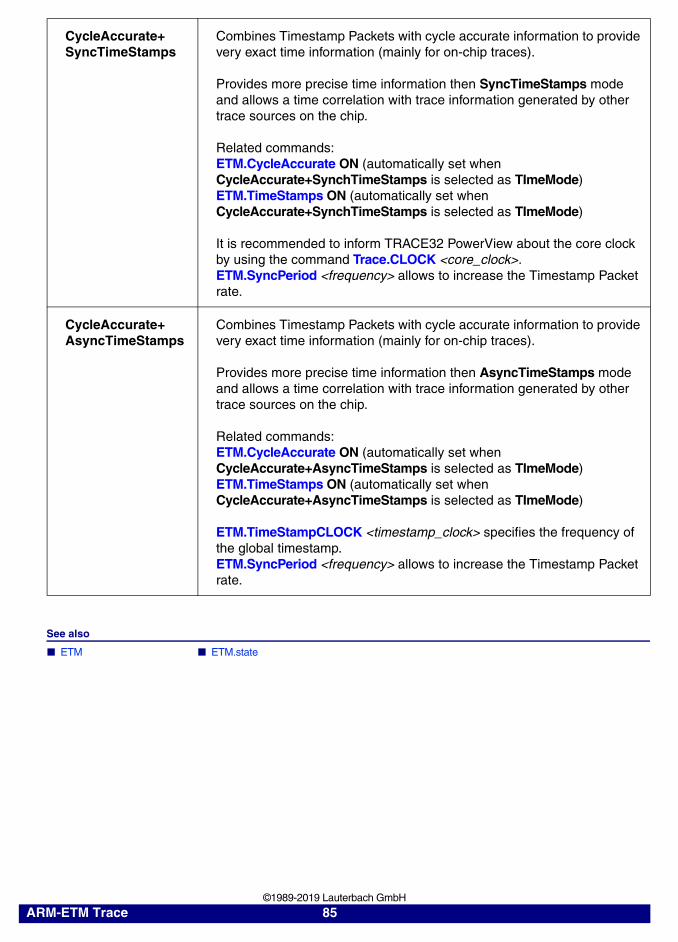
See also
■ ETM ■ ETM.state
CycleAccurate+SyncTimeStamps
Combines Timestamp Packets with cycle accurate information to provide very exact time information (mainly for on-chip traces).
Provides more precise time information then SyncTimeStamps mode and allows a time correlation with trace information generated by other trace sources on the chip.
Related commands:ETM.CycleAccurate ON (automatically set when CycleAccurate+SynchTimeStamps is selected as TImeMode)ETM.TimeStamps ON (automatically set when CycleAccurate+SynchTimeStamps is selected as TImeMode)
It is recommended to inform TRACE32 PowerView about the core clock by using the command Trace.CLOCK <core_clock>.ETM.SyncPeriod <frequency> allows to increase the Timestamp Packet rate.
CycleAccurate+AsyncTimeStamps
Combines Timestamp Packets with cycle accurate information to provide very exact time information (mainly for on-chip traces).
Provides more precise time information then AsyncTimeStamps mode and allows a time correlation with trace information generated by other trace sources on the chip.
Related commands:ETM.CycleAccurate ON (automatically set when CycleAccurate+AsyncTimeStamps is selected as TImeMode)ETM.TimeStamps ON (automatically set when CycleAccurate+AsyncTimeStamps is selected as TImeMode)
ETM.TimeStampCLOCK <timestamp_clock> specifies the frequency of the global timestamp.ETM.SyncPeriod <frequency> allows to increase the Timestamp Packet rate.
ARM-ETM Trace 85 ©1989-2019 Lauterbach GmbH
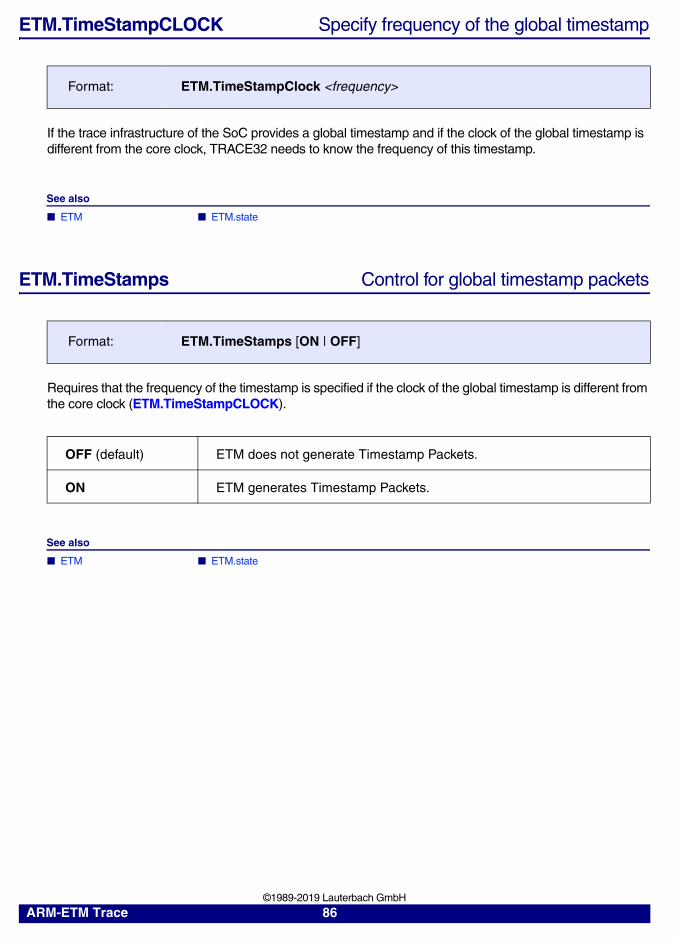
ETM.TimeStampCLOCK Specify frequency of the global timestamp
If the trace infrastructure of the SoC provides a global timestamp and if the clock of the global timestamp is different from the core clock, TRACE32 needs to know the frequency of this timestamp.
See also
■ ETM ■ ETM.state
ETM.TimeStamps Control for global timestamp packets
Requires that the frequency of the timestamp is specified if the clock of the global timestamp is different from the core clock (ETM.TimeStampCLOCK).
See also
■ ETM ■ ETM.state
Format: ETM.TimeStampClock <frequency>
Format: ETM.TimeStamps [ON | OFF]
OFF (default) ETM does not generate Timestamp Packets.
ON ETM generates Timestamp Packets.
ARM-ETM Trace 86 ©1989-2019 Lauterbach GmbH
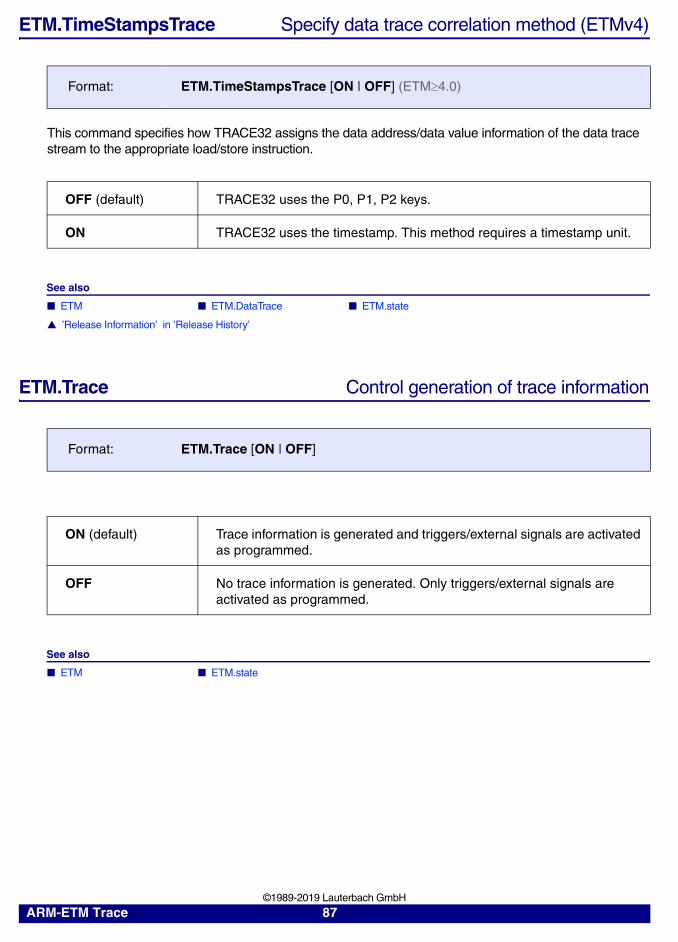
ETM.TimeStampsTrace Specify data trace correlation method (ETMv4)
This command specifies how TRACE32 assigns the data address/data value information of the data trace stream to the appropriate load/store instruction.
See also
■ ETM ■ ETM.DataTrace ■ ETM.state
▲ ’Release Information’ in ’Release History’
ETM.Trace Control generation of trace information
See also
■ ETM ■ ETM.state
Format: ETM.TimeStampsTrace [ON | OFF] (ETM4.0)
OFF (default) TRACE32 uses the P0, P1, P2 keys.
ON TRACE32 uses the timestamp. This method requires a timestamp unit.
Format: ETM.Trace [ON | OFF]
ON (default) Trace information is generated and triggers/external signals are activated as programmed.
OFF No trace information is generated. Only triggers/external signals are activated as programmed.
ARM-ETM Trace 87 ©1989-2019 Lauterbach GmbH
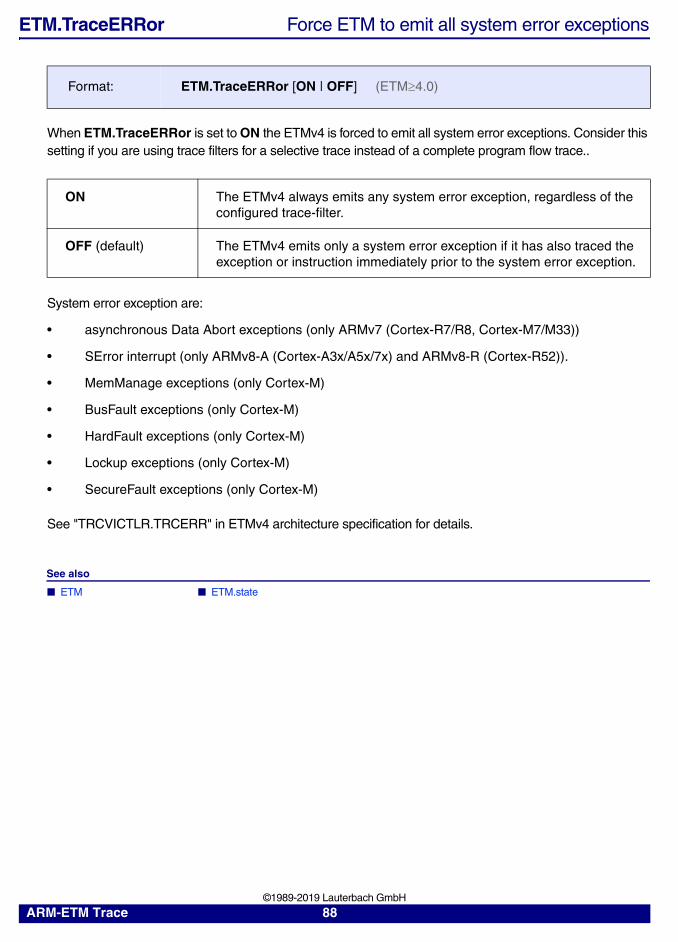
ETM.TraceERRor Force ETM to emit all system error exceptions
When ETM.TraceERRor is set to ON the ETMv4 is forced to emit all system error exceptions. Consider this setting if you are using trace filters for a selective trace instead of a complete program flow trace..
System error exception are:
• asynchronous Data Abort exceptions (only ARMv7 (Cortex-R7/R8, Cortex-M7/M33))
• SError interrupt (only ARMv8-A (Cortex-A3x/A5x/7x) and ARMv8-R (Cortex-R52)).
• MemManage exceptions (only Cortex-M)
• BusFault exceptions (only Cortex-M)
• HardFault exceptions (only Cortex-M)
• Lockup exceptions (only Cortex-M)
• SecureFault exceptions (only Cortex-M)
See "TRCVICTLR.TRCERR" in ETMv4 architecture specification for details.
See also
■ ETM ■ ETM.state
Format: ETM.TraceERRor [ON | OFF] (ETM4.0)
ON The ETMv4 always emits any system error exception, regardless of the configured trace-filter.
OFF (default) The ETMv4 emits only a system error exception if it has also traced the exception or instruction immediately prior to the system error exception.
ARM-ETM Trace 88 ©1989-2019 Lauterbach GmbH
ETM.TraceExclude Suppress program trace for specified address range
Configures the ETM to generate a program trace for all addresses except for the specified address range(s).
The commands ETM.TraceInclude or ETM.TraceExclude are mutually exclusive.
Example:
See also
■ ETM ■ ETM.Set ■ ETM.state
Format: ETM.TraceExclude <access> … <address_range> | <address> (1.2ETM3.5)ETM.TraceExclude <access> … <address_range> (PTM or ETM4.0)
<access>: Execute | Read | Write | ReadWrite (all)Fetch | ExecutePass | ExecuteFail | MAP (PTM or ETM3.5)
; exclude program flow in the specified address range from broadcastingETM.TraceExclude 0x1f20--0x1ff7
; exclude program flow for the memory selected by memory map decoder 3; from broadcastingETM.TraceExclude MAP 3.
ARM-ETM Trace 89 ©1989-2019 Lauterbach GmbH
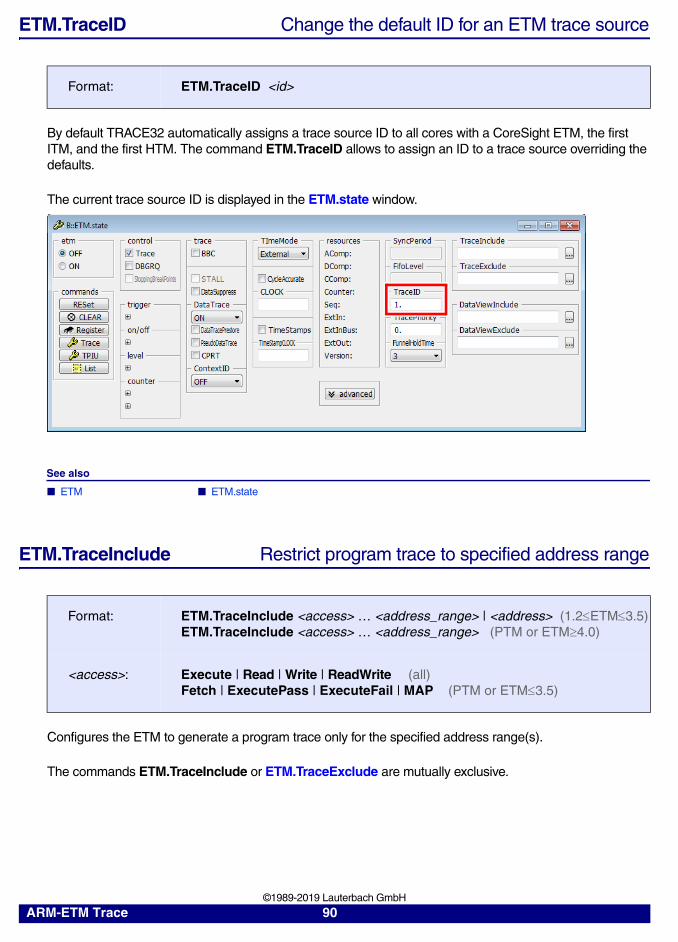
ETM.TraceID Change the default ID for an ETM trace source
By default TRACE32 automatically assigns a trace source ID to all cores with a CoreSight ETM, the first ITM, and the first HTM. The command ETM.TraceID allows to assign an ID to a trace source overriding the defaults.
The current trace source ID is displayed in the ETM.state window.
See also
■ ETM ■ ETM.state
ETM.TraceInclude Restrict program trace to specified address range
Configures the ETM to generate a program trace only for the specified address range(s).
The commands ETM.TraceInclude or ETM.TraceExclude are mutually exclusive.
Format: ETM.TraceID <id>
Format: ETM.TraceInclude <access> … <address_range> | <address> (1.2ETM3.5)ETM.TraceInclude <access> … <address_range> (PTM or ETM4.0)
<access>: Execute | Read | Write | ReadWrite (all)Fetch | ExecutePass | ExecuteFail | MAP (PTM or ETM3.5)
ARM-ETM Trace 90 ©1989-2019 Lauterbach GmbH
Example:
See also
■ ETM ■ ETM.Set ■ ETM.state
ETM.TraceNoPCREL No data trace for accesses relative to program counter
If enabled, the ETMv4 does not provide a data trace for read/write accesses relative to the program counter.
See also
■ ETM ■ ETM.state
ETM.TraceNoSPREL No data trace for accesses relative to stack pointer
If enabled, the ETMv4 does not provide a data trace for read/write accesses relative to the stack pointer.
See also
■ ETM ■ ETM.state
ETM.TraceInclude 0x1f20--0x1ff7 ; broadcast only program flow in; the specified address range
ETM.TraceInclude MAP 3. ; broadcast only program flow for; memory selected by memory map; decoder 3
Format: ETM.TraceNoPCREL [ON | OFF] (ETM4.0)
Format: ETM.TraceNoSPREL [ON | OFF] (ETM4.0)
ARM-ETM Trace 91 ©1989-2019 Lauterbach GmbH
ETM.TracePriority Define priority of ETM
The CoreSight Trace Funnel combines 2 to 8 ATB input ports to a single ATB output. An arbiter determines the priority of the ATB input port. Port 0 has the highest priority (0) and port 7 the lowest priority (7) by default.
The command ETM.TracePriority allows to change the default priority of an ATB input port.
See also
■ ETM ■ ETM.state
ETM.TraceRESet Forces the ETM to emit all core resets
When ETM.TraceRESet is set to ON the ETMv4 is forced to emit all reset exceptions. Consider this setting if you are using trace filters for a selective trace instead of a complete program flow trace..
See "TRCVICTLR.TRCRESET" in ARM ETMv4 architecture specification for details.
See also
■ ETM ■ ETM.state
Format: ETM.TracePriority <priority>
Format: ETM.TraceRESet [ON | OFF] (ETM4.0)
ON The ETMv4 always emits any reset exception, regardless of the configured trace-filter.
OFF (default) The ETMv4 emits only a reset exception if it has also traced the exception or instruction immediately prior to the reset error exception.
ARM-ETM Trace 92 ©1989-2019 Lauterbach GmbH
ETM.TRCIDR Define TRCIDR register values for simulator
Sets the values of the registers TRCIDR8, TRCIDR9, TRCIDR10, TRCIDR11, TRCIDR12, TRCIDR13, TRCIDR0 in the simulator.
They are needed for offline analysis of traces with ETMv4 of custom cores (with LA.IMPORT command).
See also
■ ETM ■ ETM.state
ETM.VMID Virtual machine ID tracing
The command ETM.VMID configures, if the ETM should emit Virtual Machine IDs to the trace stream. This command has an effect on Cortex-A (32- or 64-bit) target systems supporting virtualization (hypervisor), e.g. Cortex-A15 or Cortex-A57.
See also
■ ETM ■ ETM.state
Format: ETM.TRCIDR <spec_max> <p0_key_max> <p1_key_max> <p1_special_key_max> <cond_key_max> <cond_special_key_max> <id0>ETM.TRCIDR <trcidr8> <trcidr9> <trcidr10> <trcidr11> <trcidr12> <trcidr13> <trcidr0>
Format: ETM.VMID [ON | OFF]
ON Enables Virtual Machine ID tracing. The VMID option shall be switched on when the hypervisor is used to switch between different guest operating systems on the target. Then special trace packages will be generated whenever the Virtual Machine ID (VMID) changes. This ensures the trace analysis tool knows about the complete context before decompressing any instructions.
OFF (default) Disables Virtual Machine ID tracing.
ARM-ETM Trace 93 ©1989-2019 Lauterbach GmbH

Keywords for the Trace Display
OOO Out-of-order data packet
CORECLOCK
ARM-ETM Trace 94 ©1989-2019 Lauterbach GmbH
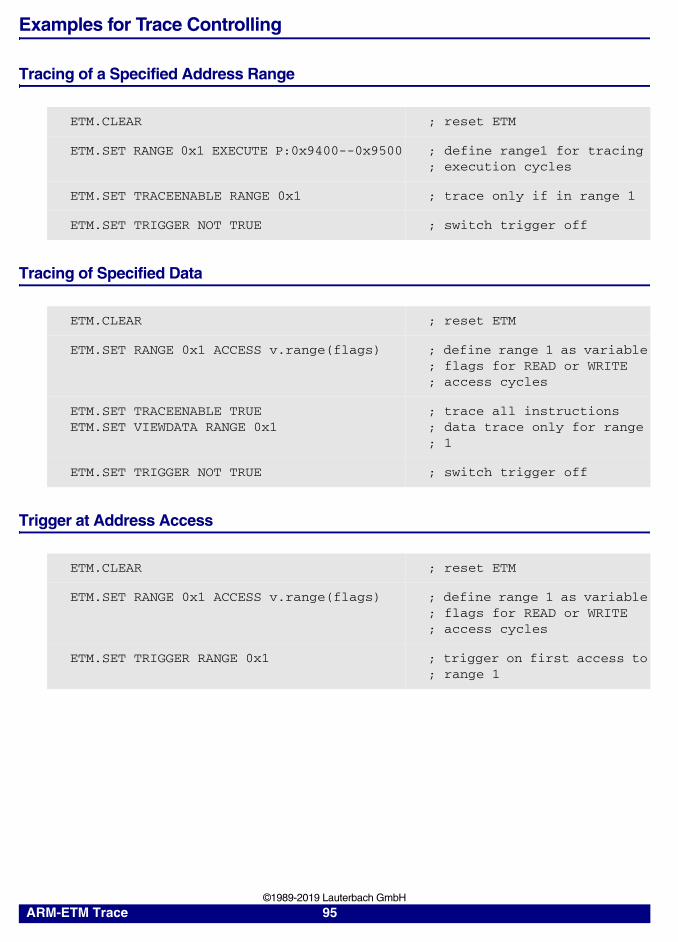
Examples for Trace Controlling
Tracing of a Specified Address Range
Tracing of Specified Data
Trigger at Address Access
ETM.CLEAR ; reset ETM
ETM.SET RANGE 0x1 EXECUTE P:0x9400--0x9500 ; define range1 for tracing; execution cycles
ETM.SET TRACEENABLE RANGE 0x1 ; trace only if in range 1
ETM.SET TRIGGER NOT TRUE ; switch trigger off
ETM.CLEAR ; reset ETM
ETM.SET RANGE 0x1 ACCESS v.range(flags) ; define range 1 as variable; flags for READ or WRITE; access cycles
ETM.SET TRACEENABLE TRUEETM.SET VIEWDATA RANGE 0x1
; trace all instructions; data trace only for range; 1
ETM.SET TRIGGER NOT TRUE ; switch trigger off
ETM.CLEAR ; reset ETM
ETM.SET RANGE 0x1 ACCESS v.range(flags) ; define range 1 as variable; flags for READ or WRITE; access cycles
ETM.SET TRIGGER RANGE 0x1 ; trigger on first access to; range 1
ARM-ETM Trace 95 ©1989-2019 Lauterbach GmbH
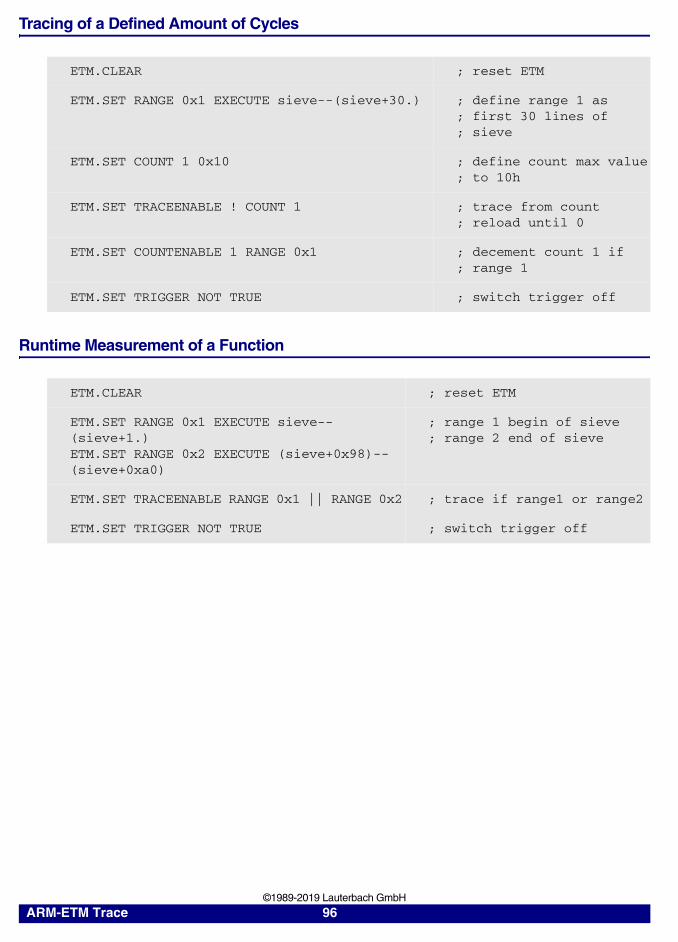
Tracing of a Defined Amount of Cycles
Runtime Measurement of a Function
ETM.CLEAR ; reset ETM
ETM.SET RANGE 0x1 EXECUTE sieve--(sieve+30.) ; define range 1 as; first 30 lines of; sieve
ETM.SET COUNT 1 0x10 ; define count max value; to 10h
ETM.SET TRACEENABLE ! COUNT 1 ; trace from count; reload until 0
ETM.SET COUNTENABLE 1 RANGE 0x1 ; decement count 1 if; range 1
ETM.SET TRIGGER NOT TRUE ; switch trigger off
ETM.CLEAR ; reset ETM
ETM.SET RANGE 0x1 EXECUTE sieve--(sieve+1.)ETM.SET RANGE 0x2 EXECUTE (sieve+0x98)--(sieve+0xa0)
; range 1 begin of sieve; range 2 end of sieve
ETM.SET TRACEENABLE RANGE 0x1 || RANGE 0x2 ; trace if range1 or range2
ETM.SET TRIGGER NOT TRUE ; switch trigger off
ARM-ETM Trace 96 ©1989-2019 Lauterbach GmbH
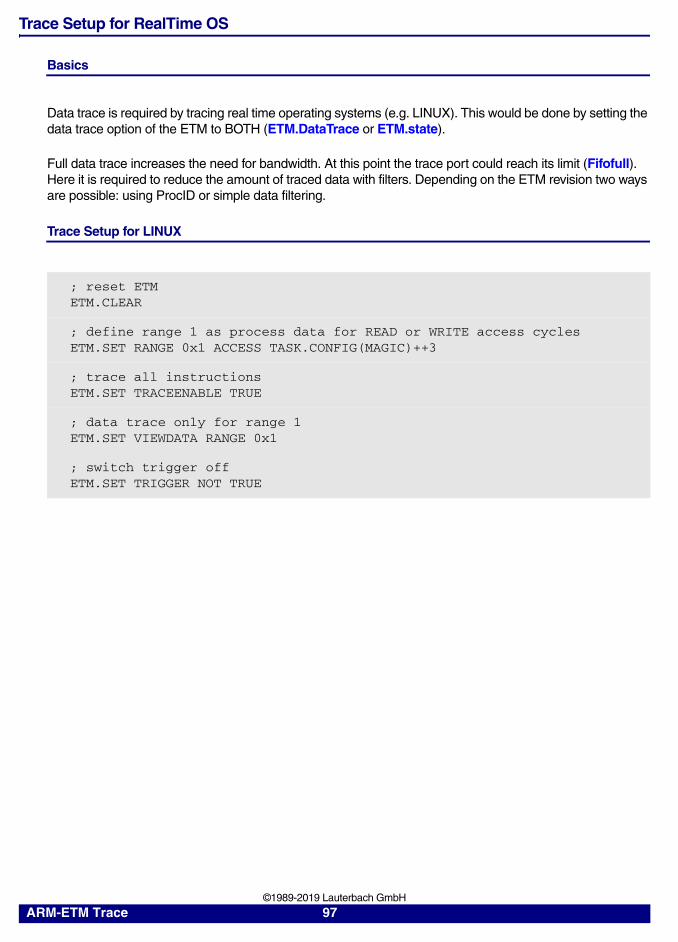
Trace Setup for RealTime OS
Basics
Data trace is required by tracing real time operating systems (e.g. LINUX). This would be done by setting the data trace option of the ETM to BOTH (ETM.DataTrace or ETM.state).
Full data trace increases the need for bandwidth. At this point the trace port could reach its limit (Fifofull). Here it is required to reduce the amount of traced data with filters. Depending on the ETM revision two ways are possible: using ProcID or simple data filtering.
Trace Setup for LINUX
; reset ETMETM.CLEAR
; define range 1 as process data for READ or WRITE access cyclesETM.SET RANGE 0x1 ACCESS TASK.CONFIG(MAGIC)++3
; trace all instructionsETM.SET TRACEENABLE TRUE
; data trace only for range 1ETM.SET VIEWDATA RANGE 0x1
; switch trigger offETM.SET TRIGGER NOT TRUE
ARM-ETM Trace 97 ©1989-2019 Lauterbach GmbH
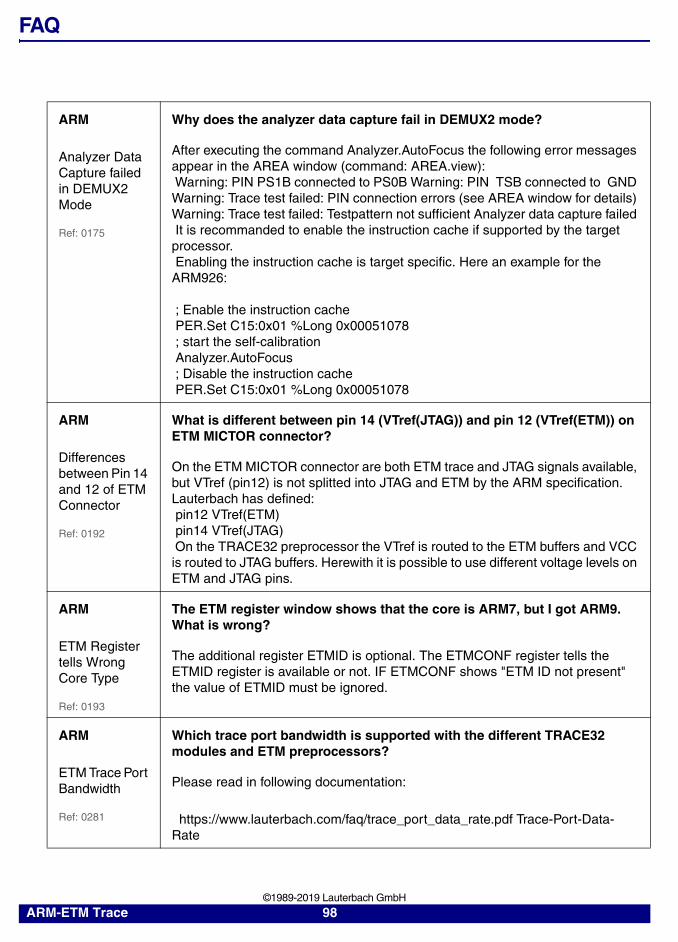
FAQ
ARM
Analyzer Data Capture failed in DEMUX2 Mode
Ref: 0175
Why does the analyzer data capture fail in DEMUX2 mode?
After executing the command Analyzer.AutoFocus the following error messages appear in the AREA window (command: AREA.view): Warning: PIN PS1B connected to PS0B Warning: PIN TSB connected to GND Warning: Trace test failed: PIN connection errors (see AREA window for details) Warning: Trace test failed: Testpattern not sufficient Analyzer data capture failed It is recommanded to enable the instruction cache if supported by the target processor. Enabling the instruction cache is target specific. Here an example for the ARM926: ; Enable the instruction cache PER.Set C15:0x01 %Long 0x00051078 ; start the self-calibration Analyzer.AutoFocus ; Disable the instruction cache PER.Set C15:0x01 %Long 0x00051078
ARM
Differences between Pin 14 and 12 of ETM Connector
Ref: 0192
What is different between pin 14 (VTref(JTAG)) and pin 12 (VTref(ETM)) on ETM MICTOR connector?
On the ETM MICTOR connector are both ETM trace and JTAG signals available, but VTref (pin12) is not splitted into JTAG and ETM by the ARM specification. Lauterbach has defined: pin12 VTref(ETM) pin14 VTref(JTAG) On the TRACE32 preprocessor the VTref is routed to the ETM buffers and VCC is routed to JTAG buffers. Herewith it is possible to use different voltage levels on ETM and JTAG pins.
ARM
ETM Register tells Wrong Core Type
Ref: 0193
The ETM register window shows that the core is ARM7, but I got ARM9. What is wrong?
The additional register ETMID is optional. The ETMCONF register tells the ETMID register is available or not. IF ETMCONF shows "ETM ID not present" the value of ETMID must be ignored.
ARM
ETM Trace Port Bandwidth
Ref: 0281
Which trace port bandwidth is supported with the different TRACE32 modules and ETM preprocessors?
Please read in following documentation:
https://www.lauterbach.com/faq/trace_port_data_rate.pdf Trace-Port-Data-Rate
ARM-ETM Trace 98 ©1989-2019 Lauterbach GmbH
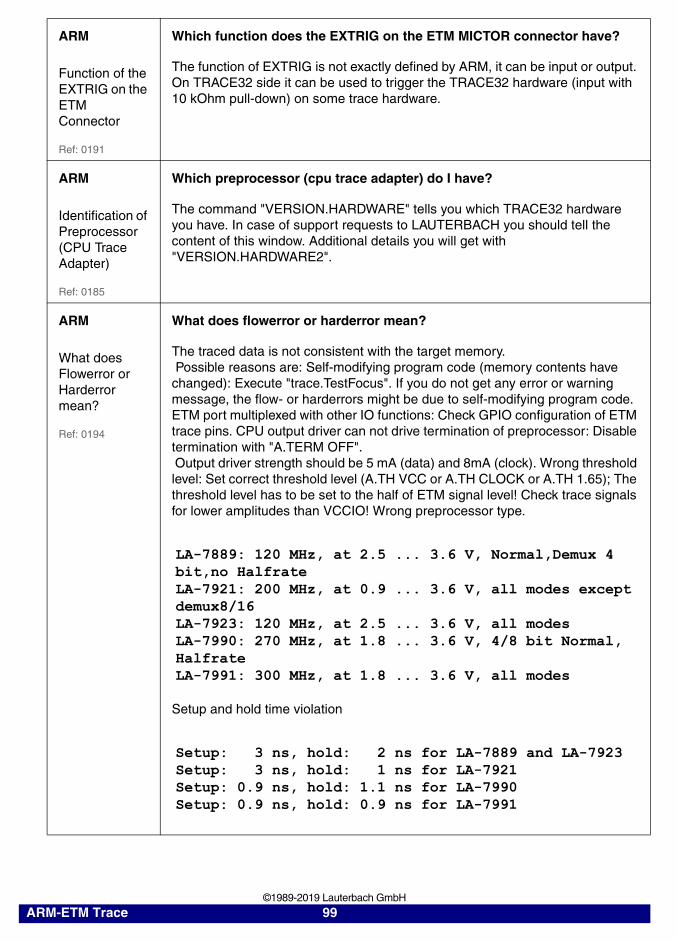
ARM
Function of the EXTRIG on the ETM Connector
Ref: 0191
Which function does the EXTRIG on the ETM MICTOR connector have?
The function of EXTRIG is not exactly defined by ARM, it can be input or output. On TRACE32 side it can be used to trigger the TRACE32 hardware (input with 10 kOhm pull-down) on some trace hardware.
ARM
Identification of Preprocessor (CPU Trace Adapter)
Ref: 0185
Which preprocessor (cpu trace adapter) do I have?
The command "VERSION.HARDWARE" tells you which TRACE32 hardware you have. In case of support requests to LAUTERBACH you should tell the content of this window. Additional details you will get with "VERSION.HARDWARE2".
ARM
What does Flowerror or Harderror mean?
Ref: 0194
What does flowerror or harderror mean?
The traced data is not consistent with the target memory. Possible reasons are: Self-modifying program code (memory contents have changed): Execute "trace.TestFocus". If you do not get any error or warning message, the flow- or harderrors might be due to self-modifying program code. ETM port multiplexed with other IO functions: Check GPIO configuration of ETM trace pins. CPU output driver can not drive termination of preprocessor: Disable termination with "A.TERM OFF". Output driver strength should be 5 mA (data) and 8mA (clock). Wrong threshold level: Set correct threshold level (A.TH VCC or A.TH CLOCK or A.TH 1.65); The threshold level has to be set to the half of ETM signal level! Check trace signals for lower amplitudes than VCCIO! Wrong preprocessor type.
LA-7889: 120 MHz, at 2.5 ... 3.6 V, Normal,Demux 4 bit,no HalfrateLA-7921: 200 MHz, at 0.9 ... 3.6 V, all modes except demux8/16LA-7923: 120 MHz, at 2.5 ... 3.6 V, all modesLA-7990: 270 MHz, at 1.8 ... 3.6 V, 4/8 bit Normal, HalfrateLA-7991: 300 MHz, at 1.8 ... 3.6 V, all modes
Setup and hold time violation
Setup: 3 ns, hold: 2 ns for LA-7889 and LA-7923Setup: 3 ns, hold: 1 ns for LA-7921Setup: 0.9 ns, hold: 1.1 ns for LA-7990Setup: 0.9 ns, hold: 0.9 ns for LA-7991
ARM-ETM Trace 99 ©1989-2019 Lauterbach GmbH
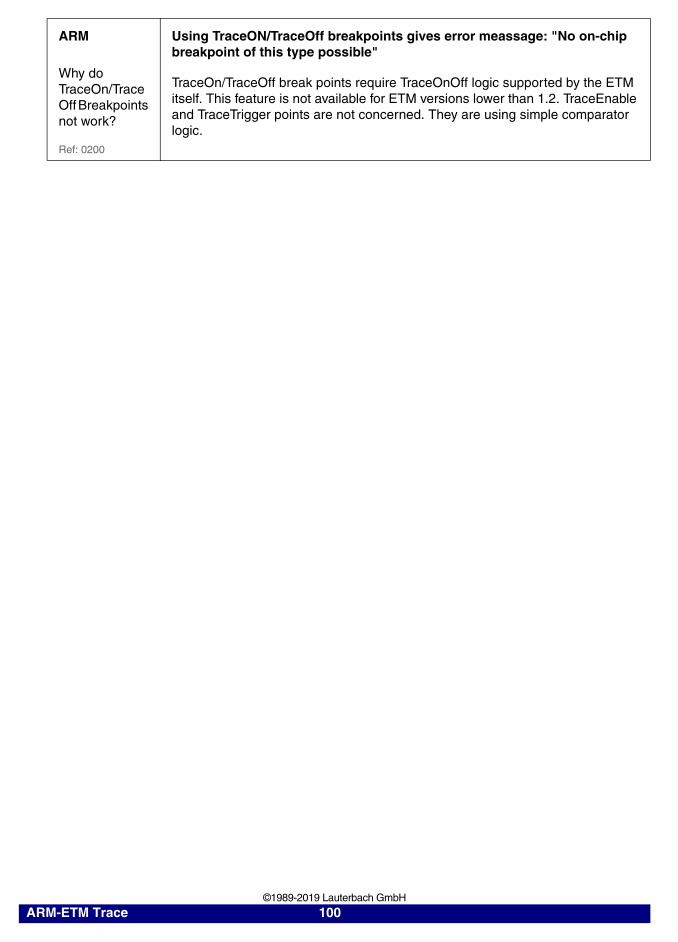
ARM
Why do TraceOn/TraceOff Breakpoints not work?
Ref: 0200
Using TraceON/TraceOff breakpoints gives error meassage: "No on-chip breakpoint of this type possible"
TraceOn/TraceOff break points require TraceOnOff logic supported by the ETM itself. This feature is not available for ETM versions lower than 1.2. TraceEnable and TraceTrigger points are not concerned. They are using simple comparator logic.
ARM-ETM Trace 100 ©1989-2019 Lauterbach GmbH
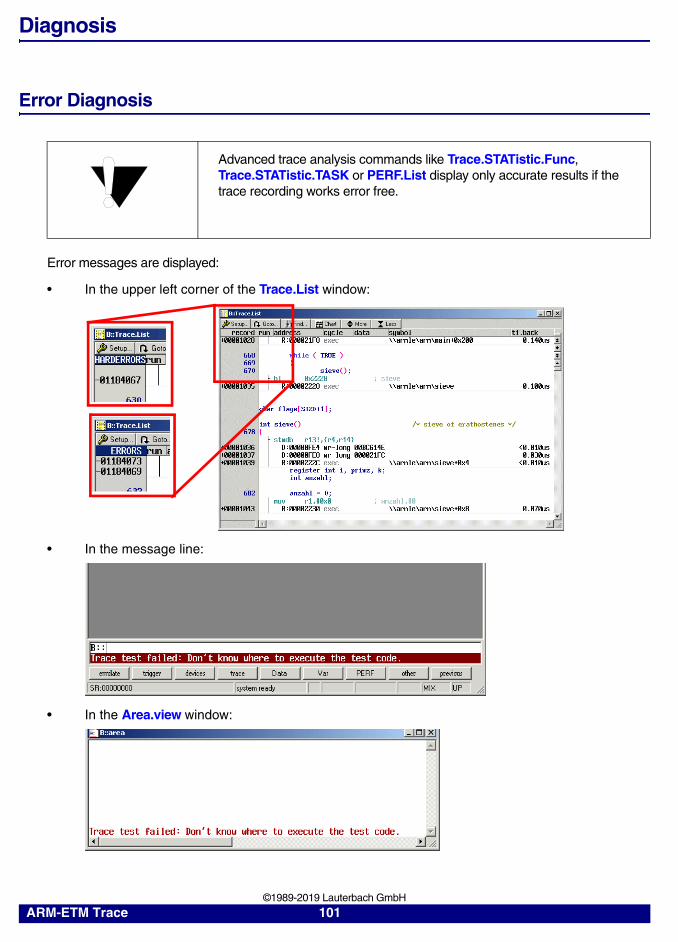
Diagnosis
Error Diagnosis
Error messages are displayed:
• In the upper left corner of the Trace.List window:
• In the message line:
• In the Area.view window:
Advanced trace analysis commands like Trace.STATistic.Func, Trace.STATistic.TASK or PERF.List display only accurate results if the trace recording works error free.
ARM-ETM Trace 101 ©1989-2019 Lauterbach GmbH
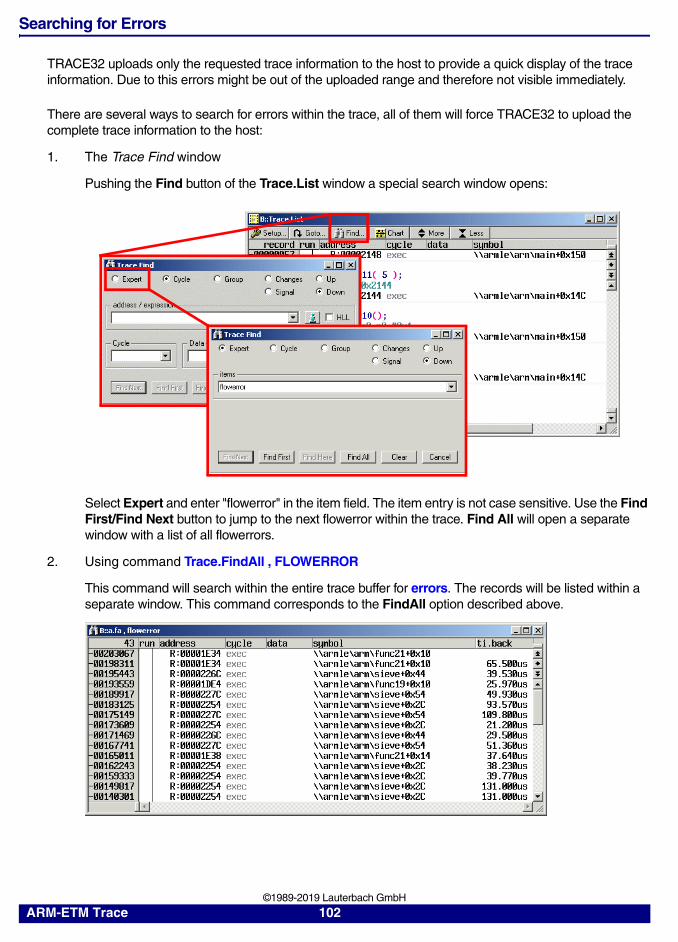
Searching for Errors
TRACE32 uploads only the requested trace information to the host to provide a quick display of the trace information. Due to this errors might be out of the uploaded range and therefore not visible immediately.
There are several ways to search for errors within the trace, all of them will force TRACE32 to upload the complete trace information to the host:
1. The Trace Find window
Pushing the Find button of the Trace.List window a special search window opens:
Select Expert and enter "flowerror" in the item field. The item entry is not case sensitive. Use the Find First/Find Next button to jump to the next flowerror within the trace. Find All will open a separate window with a list of all flowerrors.
2. Using command Trace.FindAll , FLOWERROR
This command will search within the entire trace buffer for errors. The records will be listed within a separate window. This command corresponds to the FindAll option described above.
ARM-ETM Trace 102 ©1989-2019 Lauterbach GmbH
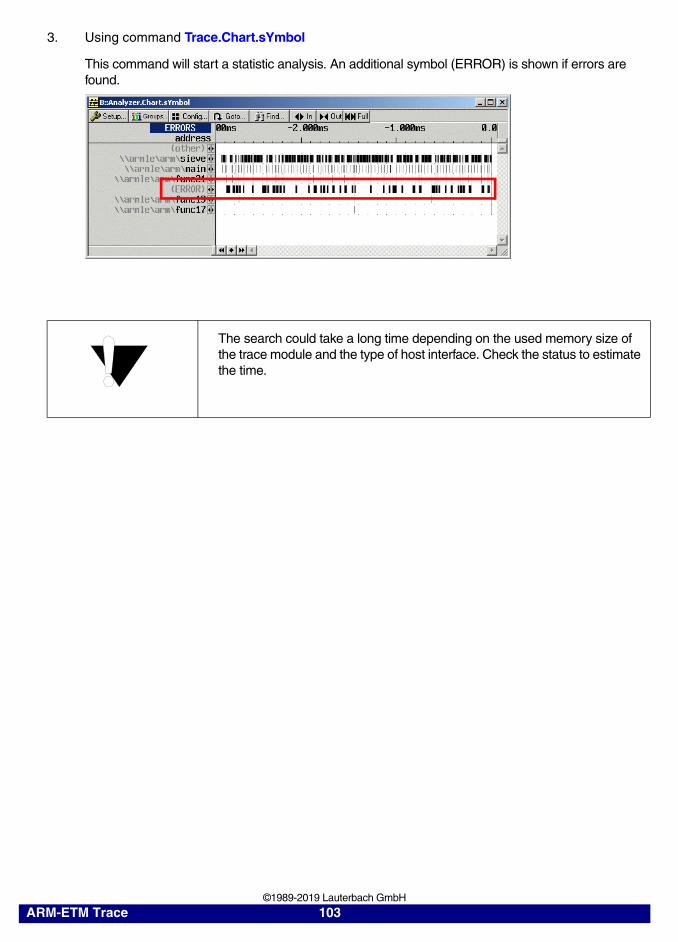
3. Using command Trace.Chart.sYmbol
This command will start a statistic analysis. An additional symbol (ERROR) is shown if errors are found.
The search could take a long time depending on the used memory size of the trace module and the type of host interface. Check the status to estimate the time.
ARM-ETM Trace 103 ©1989-2019 Lauterbach GmbH
Error Messages
One of the following 3 errors may occur:
• HARDERROR
• FLOWERROR
• FIFOFULL
Please see Diagnosis Check List.
HARDERRORS
There are no valid ETM data. Possible reasons are:
• ETM port multiplexed with other IO functions (no valid trace data)
• Trace signal capturing failed (setup/hold time violations)
• Wrong version of PowerTrace module
• Target frequency too high
Please see Diagnosis Check List.
FLOWERRORS
The traced data are not consistent with the code in the target memories. Possible reasons are:
• Memory contents have changed (e.g. self modifying code).
• Wrong trace data (as result of HARDERRORS)
Please see Diagnosis Check List.
ARM-ETM Trace 104 ©1989-2019 Lauterbach GmbH
FIFOFULL
The ETM output FIFO overflowed. The amount of trace data generated by the ETM was greater than the ETM port band width. To reduce the risk of a FIFO overflow:
• Increase the port size if possible (ETM.PortSize).
• Restrict the DataTrace to read cycles (write accesses can be reconstructed via CTS).
• Restrict the DataTrace to write cycles, a FIFO overflow becomes less likely.
• Reduce amount of trace data by using filters: use the filter TraceEnable or TraceData
• STALL the CPU if a FIFO overflow is likely to happen - ETMv1.x (ETM.STALL).
• Suppress the output of the data flow information if a FIFO overflow is likely to happen - ETMv3.x (ETM.DataSuppress).
Trace Test Failed Messages
Trace.TestFocus supports a built in trace test. This command loads a short test program up to the target memory (RAM) and traces its execution. Afterwards the recorded program flow and data pattern will be checked for any errors.
"Analyzer data capture o.k." will be shown if the test was successful.
Test failures might be caused by a variety of reasons, usually error messages such as "Trace test failed: not enough samples in the trace" will give a clue to what might have caused the failure. Refer to "Error Message Emulator" in “Error Messages” (error.pdf) to find explanations on these messages.
The Embedded Trace Macrocell is not always able to prevent overflows of the internal FIFO. Even when STALL is enabled overflows may occur.
ARM-ETM Trace 105 ©1989-2019 Lauterbach GmbH
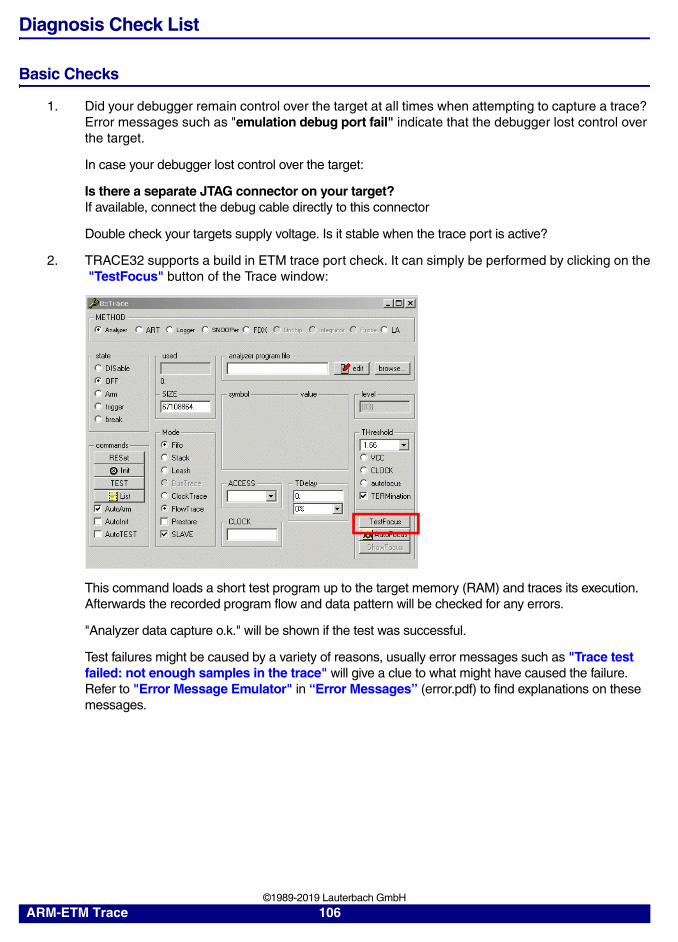
Diagnosis Check List
Basic Checks
1. Did your debugger remain control over the target at all times when attempting to capture a trace? Error messages such as "emulation debug port fail" indicate that the debugger lost control over the target.
In case your debugger lost control over the target:
Is there a separate JTAG connector on your target?If available, connect the debug cable directly to this connector
Double check your targets supply voltage. Is it stable when the trace port is active?
2. TRACE32 supports a build in ETM trace port check. It can simply be performed by clicking on the "TestFocus" button of the Trace window:
This command loads a short test program up to the target memory (RAM) and traces its execution. Afterwards the recorded program flow and data pattern will be checked for any errors.
"Analyzer data capture o.k." will be shown if the test was successful.
Test failures might be caused by a variety of reasons, usually error messages such as "Trace test failed: not enough samples in the trace" will give a clue to what might have caused the failure. Refer to "Error Message Emulator" in “Error Messages” (error.pdf) to find explanations on these messages.
ARM-ETM Trace 106 ©1989-2019 Lauterbach GmbH
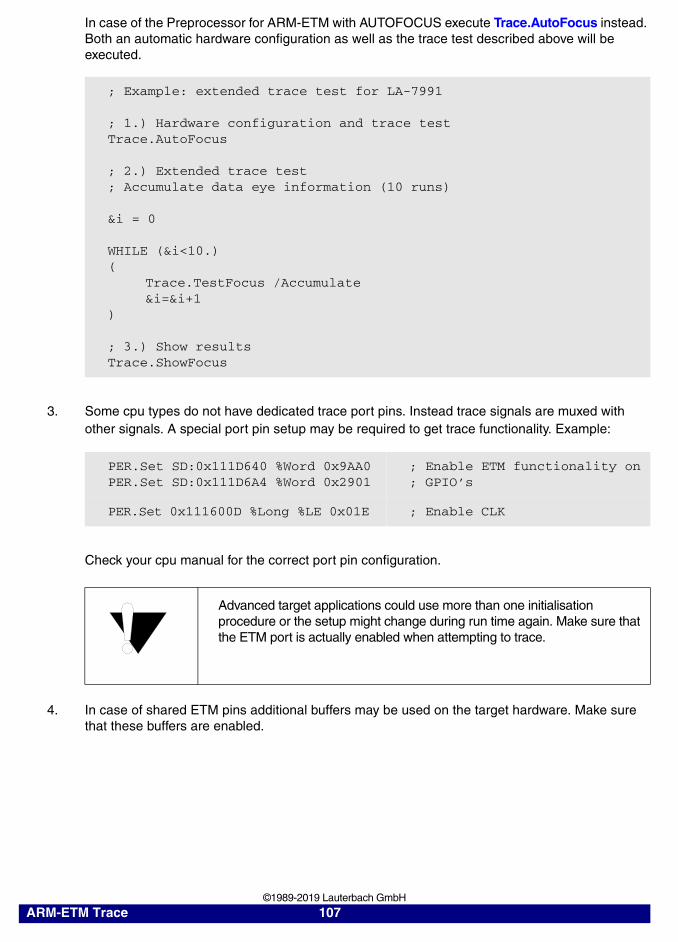
In case of the Preprocessor for ARM-ETM with AUTOFOCUS execute Trace.AutoFocus instead. Both an automatic hardware configuration as well as the trace test described above will be executed.
3. Some cpu types do not have dedicated trace port pins. Instead trace signals are muxed with other signals. A special port pin setup may be required to get trace functionality. Example:
Check your cpu manual for the correct port pin configuration.
4. In case of shared ETM pins additional buffers may be used on the target hardware. Make sure that these buffers are enabled.
; Example: extended trace test for LA-7991
; 1.) Hardware configuration and trace testTrace.AutoFocus
; 2.) Extended trace test; Accumulate data eye information (10 runs)
&i = 0
WHILE (&i<10.)(
Trace.TestFocus /Accumulate&i=&i+1
)
; 3.) Show resultsTrace.ShowFocus
PER.Set SD:0x111D640 %Word 0x9AA0PER.Set SD:0x111D6A4 %Word 0x2901
; Enable ETM functionality on; GPIO’s
PER.Set 0x111600D %Long %LE 0x01E ; Enable CLK
Advanced target applications could use more than one initialisation procedure or the setup might change during run time again. Make sure that the ETM port is actually enabled when attempting to trace.
ARM-ETM Trace 107 ©1989-2019 Lauterbach GmbH

5. Check your CPU manual for correct ETM settings such as ETM.PortSize, ETM.PortMode, ETM.HalfRate. Wrong settings result in errors.
Additional help offers the ETM register called SYSCON. It is available for ETM versions 1.2 or higher by executing ETM.Register:
6. Most of the ETM trace hardware is set up automatically. Special care has to be given to the threshold level (Trace configuration):
The threshold value(s) for clock and/or data signals is/are set automatically at software start, depending on the voltage level of pin 12 of the target connector. However, if your target is turned off or not connected during software start you may need to execute Trace.THreshold VCC or manually set it to the proper value (e.g. 0.9 V , 1.25 V or 1.65 V).
Should be close to 50% of theETM signal voltage level.
ARM-ETM Trace 108 ©1989-2019 Lauterbach GmbH
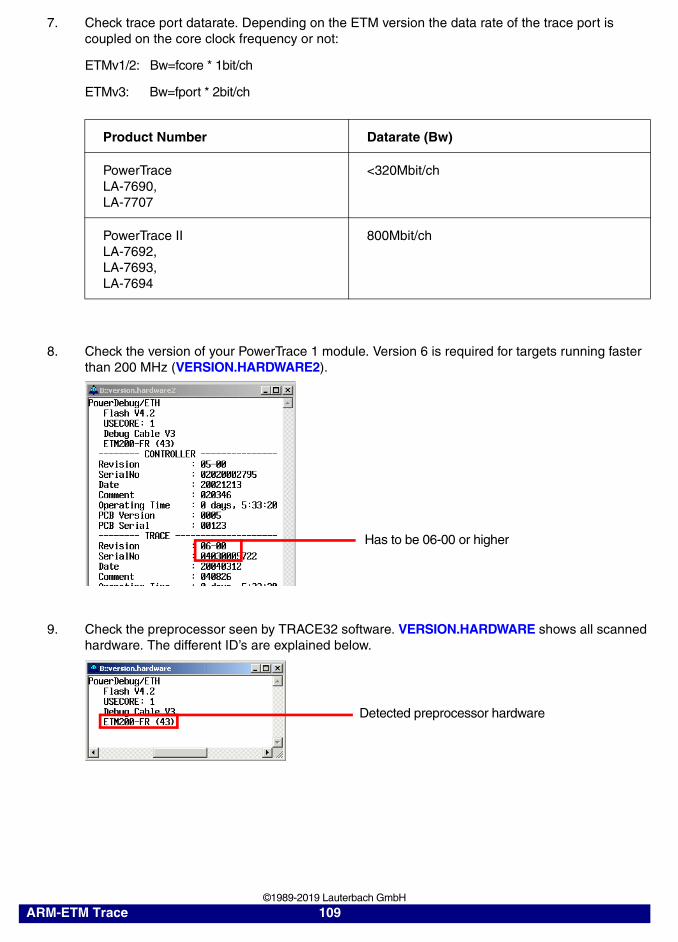
7. Check trace port datarate. Depending on the ETM version the data rate of the trace port is coupled on the core clock frequency or not:
ETMv1/2: Bw=fcore * 1bit/ch
ETMv3: Bw=fport * 2bit/ch
8. Check the version of your PowerTrace 1 module. Version 6 is required for targets running faster than 200 MHz (VERSION.HARDWARE2).
9. Check the preprocessor seen by TRACE32 software. VERSION.HARDWARE shows all scanned hardware. The different ID’s are explained below.
Product Number Datarate (Bw)
PowerTraceLA-7690,LA-7707
<320Mbit/ch
PowerTrace IILA-7692,LA-7693,LA-7694
800Mbit/ch
Has to be 06-00 or higher
Detected preprocessor hardware
ARM-ETM Trace 109 ©1989-2019 Lauterbach GmbH
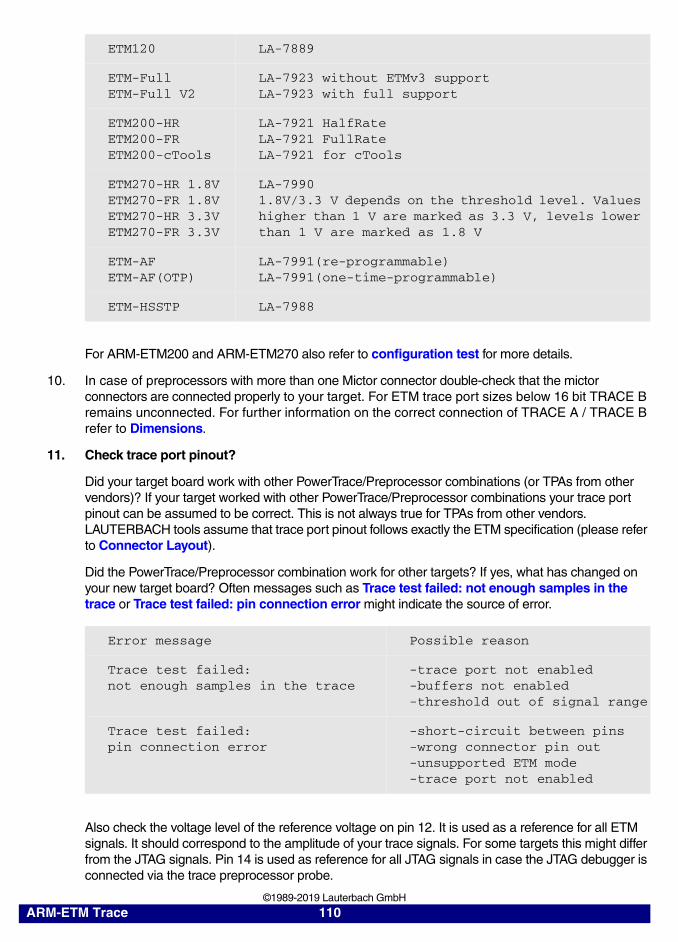
For ARM-ETM200 and ARM-ETM270 also refer to configuration test for more details.
10. In case of preprocessors with more than one Mictor connector double-check that the mictor connectors are connected properly to your target. For ETM trace port sizes below 16 bit TRACE B remains unconnected. For further information on the correct connection of TRACE A / TRACE B refer to Dimensions.
11. Check trace port pinout?
Did your target board work with other PowerTrace/Preprocessor combinations (or TPAs from other vendors)? If your target worked with other PowerTrace/Preprocessor combinations your trace port pinout can be assumed to be correct. This is not always true for TPAs from other vendors. LAUTERBACH tools assume that trace port pinout follows exactly the ETM specification (please refer to Connector Layout).
Did the PowerTrace/Preprocessor combination work for other targets? If yes, what has changed on your new target board? Often messages such as Trace test failed: not enough samples in the trace or Trace test failed: pin connection error might indicate the source of error.
Also check the voltage level of the reference voltage on pin 12. It is used as a reference for all ETM signals. It should correspond to the amplitude of your trace signals. For some targets this might differ from the JTAG signals. Pin 14 is used as reference for all JTAG signals in case the JTAG debugger is connected via the trace preprocessor probe.
ETM120 LA-7889
ETM-FullETM-Full V2
LA-7923 without ETMv3 supportLA-7923 with full support
ETM200-HRETM200-FRETM200-cTools
LA-7921 HalfRateLA-7921 FullRateLA-7921 for cTools
ETM270-HR 1.8VETM270-FR 1.8VETM270-HR 3.3VETM270-FR 3.3V
LA-79901.8V/3.3 V depends on the threshold level. Values higher than 1 V are marked as 3.3 V, levels lower than 1 V are marked as 1.8 V
ETM-AFETM-AF(OTP)
LA-7991(re-programmable)LA-7991(one-time-programmable)
ETM-HSSTP LA-7988
Error message Possible reason
Trace test failed:not enough samples in the trace
-trace port not enabled-buffers not enabled-threshold out of signal range
Trace test failed:pin connection error
-short-circuit between pins-wrong connector pin out-unsupported ETM mode-trace port not enabled
ARM-ETM Trace 110 ©1989-2019 Lauterbach GmbH
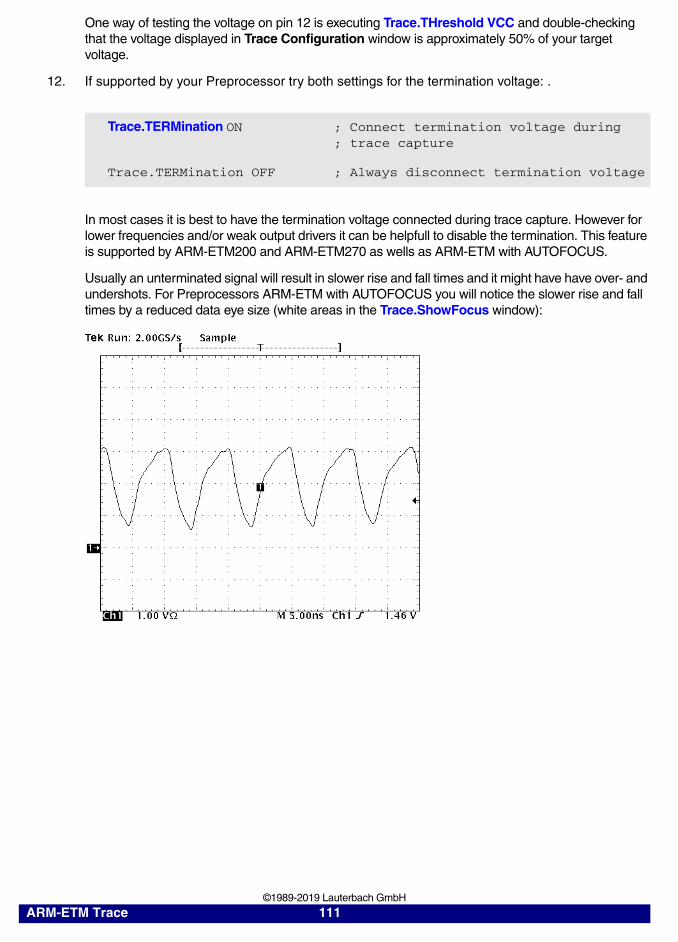
One way of testing the voltage on pin 12 is executing Trace.THreshold VCC and double-checking that the voltage displayed in Trace Configuration window is approximately 50% of your target voltage.
12. If supported by your Preprocessor try both settings for the termination voltage: .
In most cases it is best to have the termination voltage connected during trace capture. However for lower frequencies and/or weak output drivers it can be helpfull to disable the termination. This feature is supported by ARM-ETM200 and ARM-ETM270 as wells as ARM-ETM with AUTOFOCUS.
Usually an unterminated signal will result in slower rise and fall times and it might have have over- and undershots. For Preprocessors ARM-ETM with AUTOFOCUS you will notice the slower rise and fall times by a reduced data eye size (white areas in the Trace.ShowFocus window):
Trace.TERMination ON ; Connect termination voltage during; trace capture
Trace.TERMination OFF ; Always disconnect termination voltage
ARM-ETM Trace 111 ©1989-2019 Lauterbach GmbH
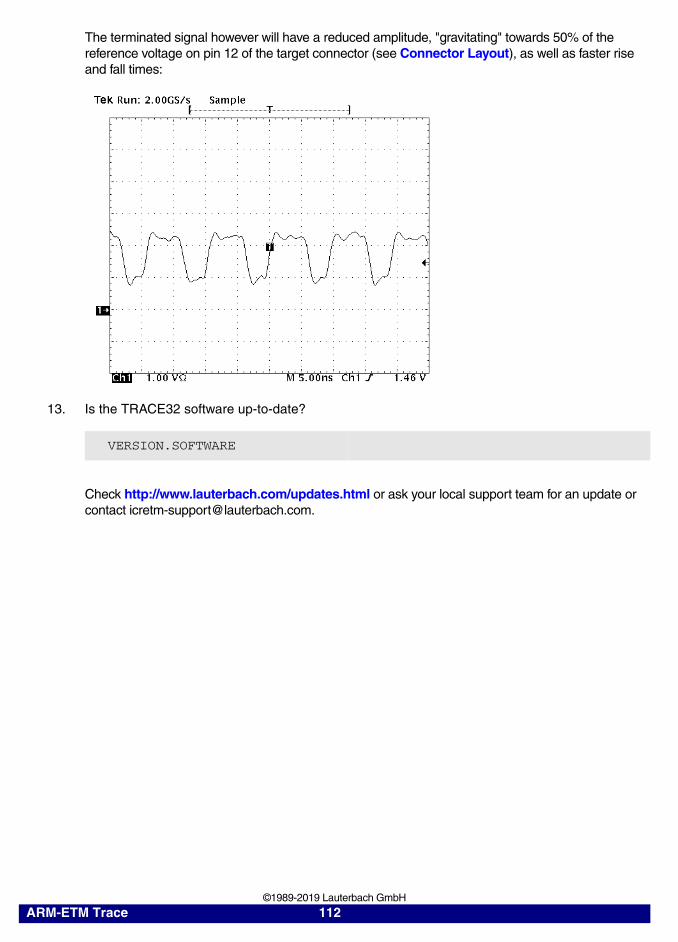
The terminated signal however will have a reduced amplitude, "gravitating" towards 50% of the reference voltage on pin 12 of the target connector (see Connector Layout), as well as faster rise and fall times:
13. Is the TRACE32 software up-to-date?
Check http://www.lauterbach.com/updates.html or ask your local support team for an update or contact [email protected].
VERSION.SOFTWARE
ARM-ETM Trace 112 ©1989-2019 Lauterbach GmbH
Advanced Check for ETMv1.x
If the basic check was completed and the trace results are still not faultless the following procedure might help you to determine the source of error. By manually disassembling the captured trace data (for a single step) you might notice swapped pins or data channels that might have timing issues.
Electrical measurements must be done by trained personal only. Special care has to be taken concerning electrostatic discharge.
The target must run and the trace has to be armed during electrical measurements to ensure trace port activity.
ARM-ETM Trace 113 ©1989-2019 Lauterbach GmbH
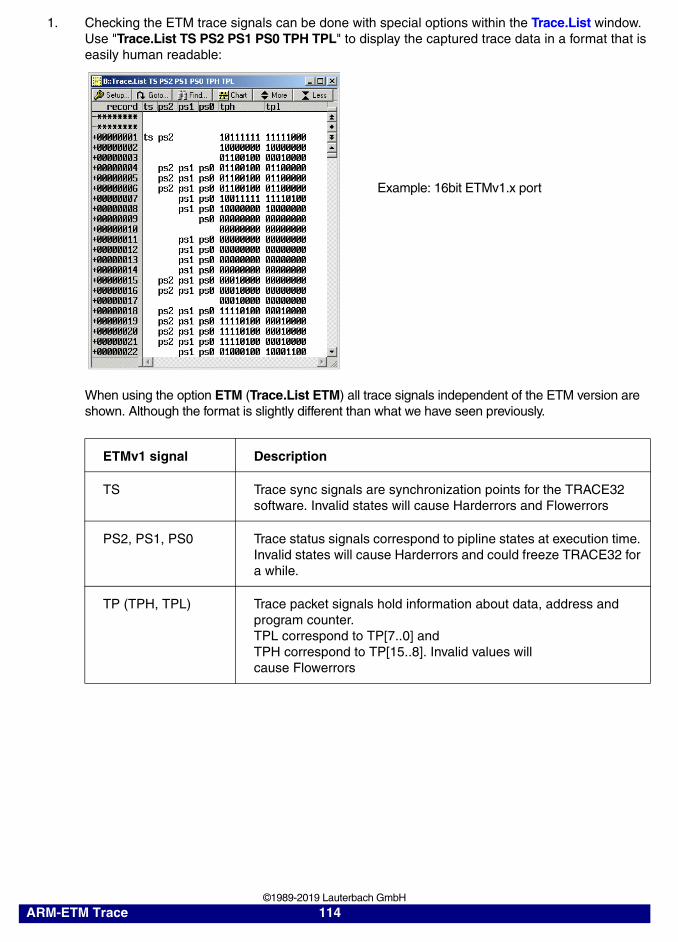
1. Checking the ETM trace signals can be done with special options within the Trace.List window.Use "Trace.List TS PS2 PS1 PS0 TPH TPL" to display the captured trace data in a format that is easily human readable:
When using the option ETM (Trace.List ETM) all trace signals independent of the ETM version are shown. Although the format is slightly different than what we have seen previously.
ETMv1 signal Description
TS Trace sync signals are synchronization points for the TRACE32 software. Invalid states will cause Harderrors and Flowerrors
PS2, PS1, PS0 Trace status signals correspond to pipline states at execution time. Invalid states will cause Harderrors and could freeze TRACE32 for a while.
TP (TPH, TPL) Trace packet signals hold information about data, address and program counter.TPL correspond to TP[7..0] andTPH correspond to TP[15..8]. Invalid values willcause Flowerrors
Example: 16bit ETMv1.x port
ARM-ETM Trace 114 ©1989-2019 Lauterbach GmbH
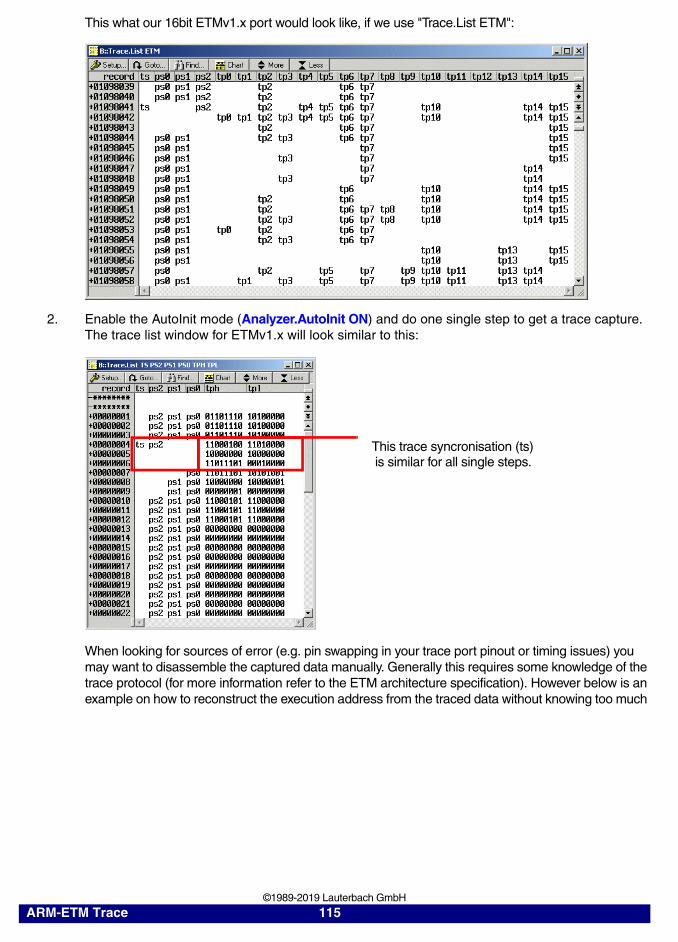
This what our 16bit ETMv1.x port would look like, if we use "Trace.List ETM":
2. Enable the AutoInit mode (Analyzer.AutoInit ON) and do one single step to get a trace capture. The trace list window for ETMv1.x will look similar to this:
When looking for sources of error (e.g. pin swapping in your trace port pinout or timing issues) you may want to disassemble the captured data manually. Generally this requires some knowledge of the trace protocol (for more information refer to the ETM architecture specification). However below is an example on how to reconstruct the execution address from the traced data without knowing too much
This trace syncronisation (ts) is similar for all single steps.
ARM-ETM Trace 115 ©1989-2019 Lauterbach GmbH
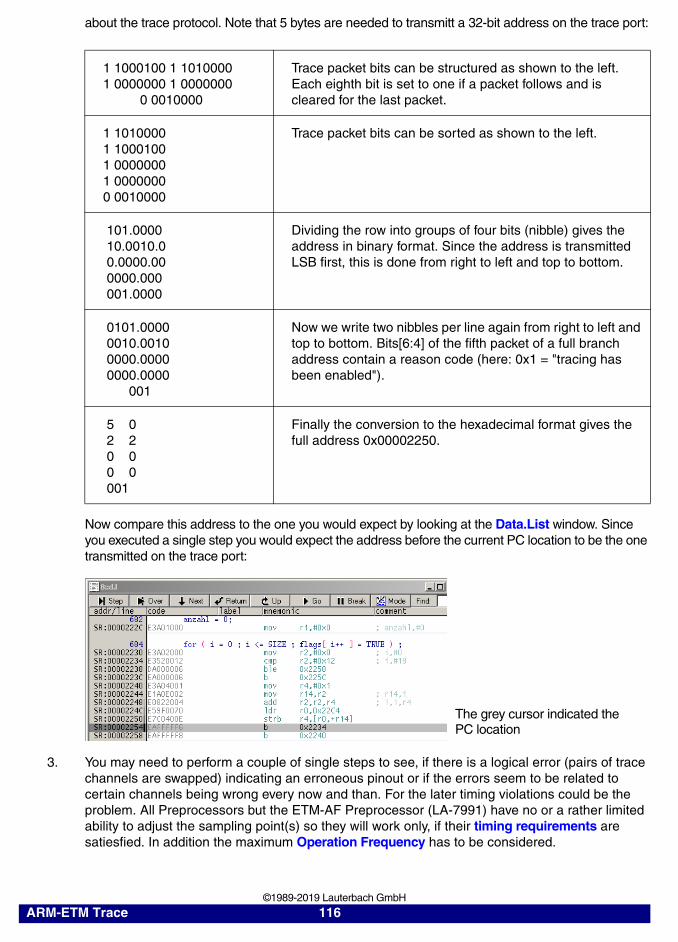
about the trace protocol. Note that 5 bytes are needed to transmitt a 32-bit address on the trace port:
Now compare this address to the one you would expect by looking at the Data.List window. Since you executed a single step you would expect the address before the current PC location to be the one transmitted on the trace port:
3. You may need to perform a couple of single steps to see, if there is a logical error (pairs of trace channels are swapped) indicating an erroneous pinout or if the errors seem to be related to certain channels being wrong every now and than. For the later timing violations could be the problem. All Preprocessors but the ETM-AF Preprocessor (LA-7991) have no or a rather limited ability to adjust the sampling point(s) so they will work only, if their timing requirements are satiesfied. In addition the maximum Operation Frequency has to be considered.
1 1000100 1 10100001 0000000 1 0000000 0 0010000
Trace packet bits can be structured as shown to the left. Each eighth bit is set to one if a packet follows and is cleared for the last packet.
1 10100001 10001001 00000001 00000000 0010000
Trace packet bits can be sorted as shown to the left.
101.0000 10.0010.0 0.0000.00 0000.000 001.0000
Dividing the row into groups of four bits (nibble) gives the address in binary format. Since the address is transmitted LSB first, this is done from right to left and top to bottom.
0101.0000 0010.0010 0000.0000 0000.0000 001
Now we write two nibbles per line again from right to left and top to bottom. Bits[6:4] of the fifth packet of a full branch address contain a reason code (here: 0x1 = "tracing has been enabled").
5 0 2 2 0 0 0 0 001
Finally the conversion to the hexadecimal format gives the full address 0x00002250.
The grey cursor indicated the PC location
ARM-ETM Trace 116 ©1989-2019 Lauterbach GmbH
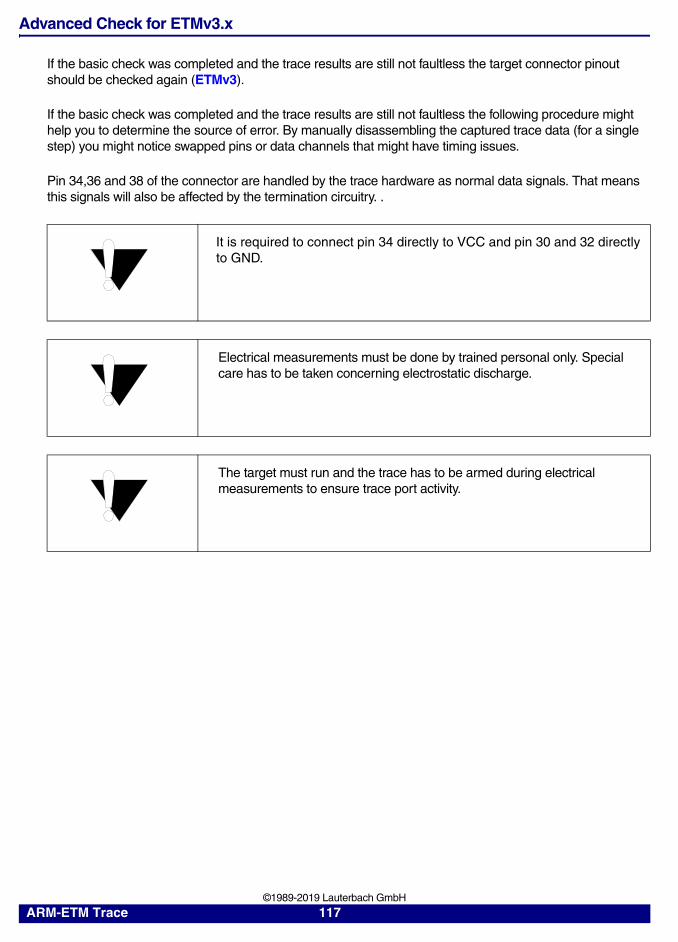
Advanced Check for ETMv3.x
If the basic check was completed and the trace results are still not faultless the target connector pinout should be checked again (ETMv3).
If the basic check was completed and the trace results are still not faultless the following procedure might help you to determine the source of error. By manually disassembling the captured trace data (for a single step) you might notice swapped pins or data channels that might have timing issues.
Pin 34,36 and 38 of the connector are handled by the trace hardware as normal data signals. That means this signals will also be affected by the termination circuitry. .
It is required to connect pin 34 directly to VCC and pin 30 and 32 directly to GND.
Electrical measurements must be done by trained personal only. Special care has to be taken concerning electrostatic discharge.
The target must run and the trace has to be armed during electrical measurements to ensure trace port activity.
ARM-ETM Trace 117 ©1989-2019 Lauterbach GmbH
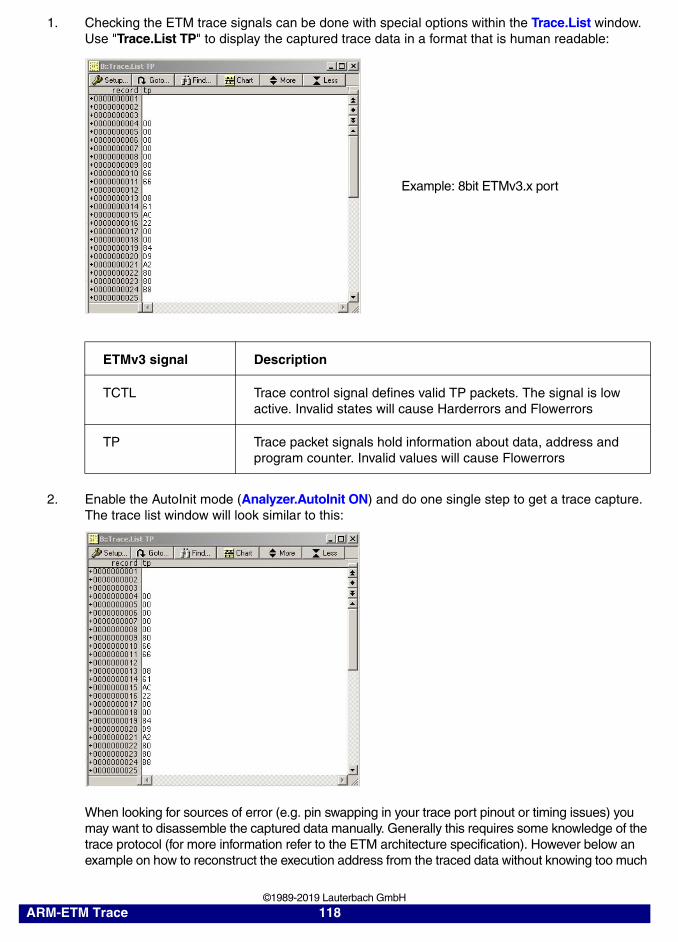
1. Checking the ETM trace signals can be done with special options within the Trace.List window.Use "Trace.List TP" to display the captured trace data in a format that is human readable:
2. Enable the AutoInit mode (Analyzer.AutoInit ON) and do one single step to get a trace capture. The trace list window will look similar to this:
When looking for sources of error (e.g. pin swapping in your trace port pinout or timing issues) you may want to disassemble the captured data manually. Generally this requires some knowledge of the trace protocol (for more information refer to the ETM architecture specification). However below an example on how to reconstruct the execution address from the traced data without knowing too much
ETMv3 signal Description
TCTL Trace control signal defines valid TP packets. The signal is low active. Invalid states will cause Harderrors and Flowerrors
TP Trace packet signals hold information about data, address and program counter. Invalid values will cause Flowerrors
Example: 8bit ETMv3.x port
ARM-ETM Trace 118 ©1989-2019 Lauterbach GmbH
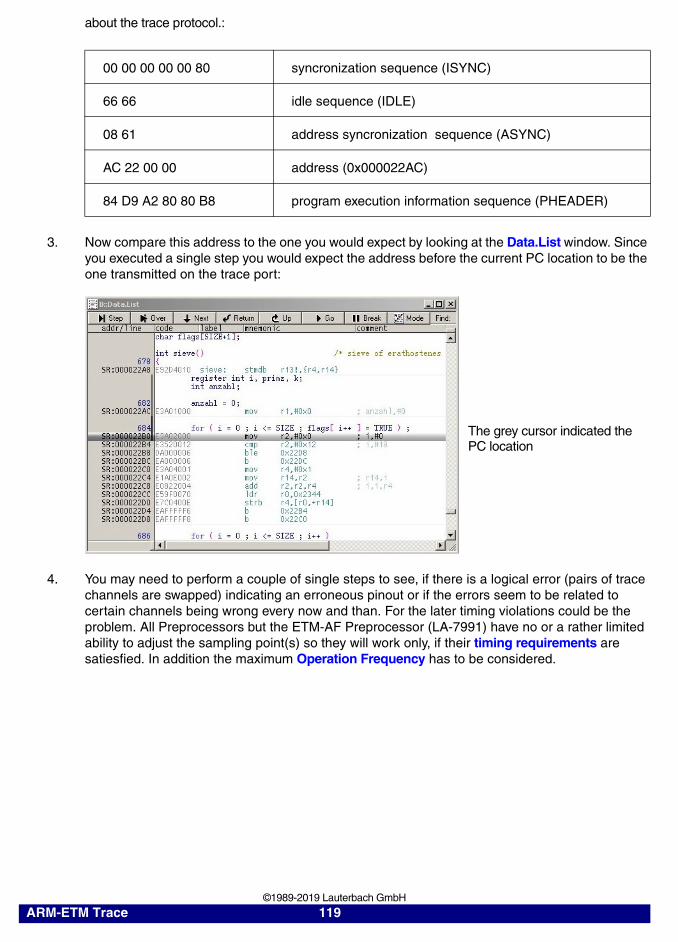
about the trace protocol.:
3. Now compare this address to the one you would expect by looking at the Data.List window. Since you executed a single step you would expect the address before the current PC location to be the one transmitted on the trace port:
4. You may need to perform a couple of single steps to see, if there is a logical error (pairs of trace channels are swapped) indicating an erroneous pinout or if the errors seem to be related to certain channels being wrong every now and than. For the later timing violations could be the problem. All Preprocessors but the ETM-AF Preprocessor (LA-7991) have no or a rather limited ability to adjust the sampling point(s) so they will work only, if their timing requirements are satiesfied. In addition the maximum Operation Frequency has to be considered.
00 00 00 00 00 80 syncronization sequence (ISYNC)
66 66 idle sequence (IDLE)
08 61 address syncronization sequence (ASYNC)
AC 22 00 00 address (0x000022AC)
84 D9 A2 80 80 B8 program execution information sequence (PHEADER)
The grey cursor indicated the PC location
ARM-ETM Trace 119 ©1989-2019 Lauterbach GmbH
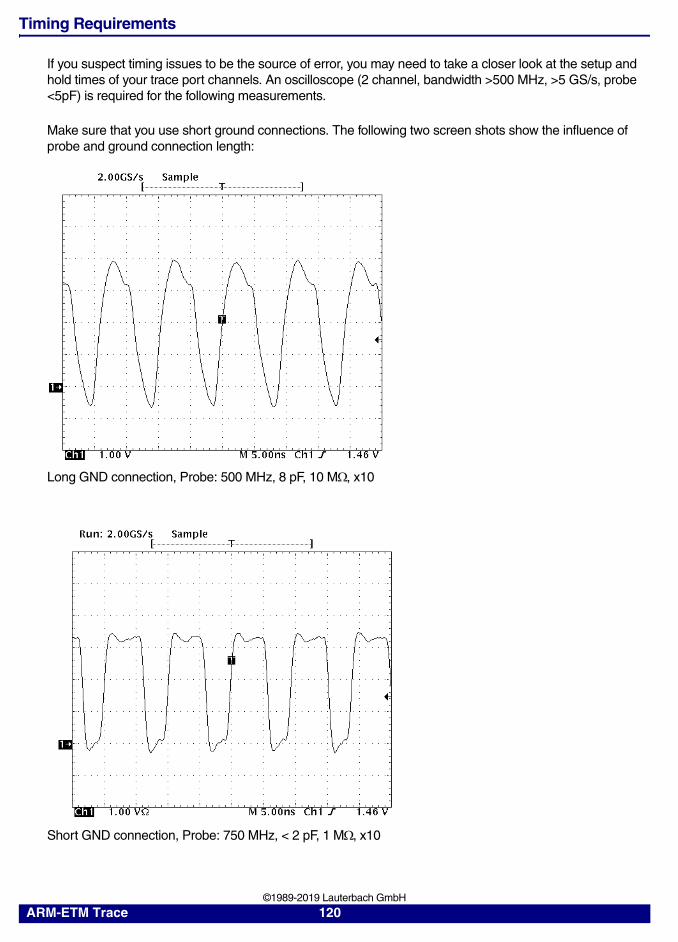
Timing Requirements
If you suspect timing issues to be the source of error, you may need to take a closer look at the setup and hold times of your trace port channels. An oscilloscope (2 channel, bandwidth >500 MHz, >5 GS/s, probe <5pF) is required for the following measurements.
Make sure that you use short ground connections. The following two screen shots show the influence of probe and ground connection length:
Long GND connection, Probe: 500 MHz, 8 pF, 10 M, x10
Short GND connection, Probe: 750 MHz, < 2 pF, 1 M, x10
ARM-ETM Trace 120 ©1989-2019 Lauterbach GmbH
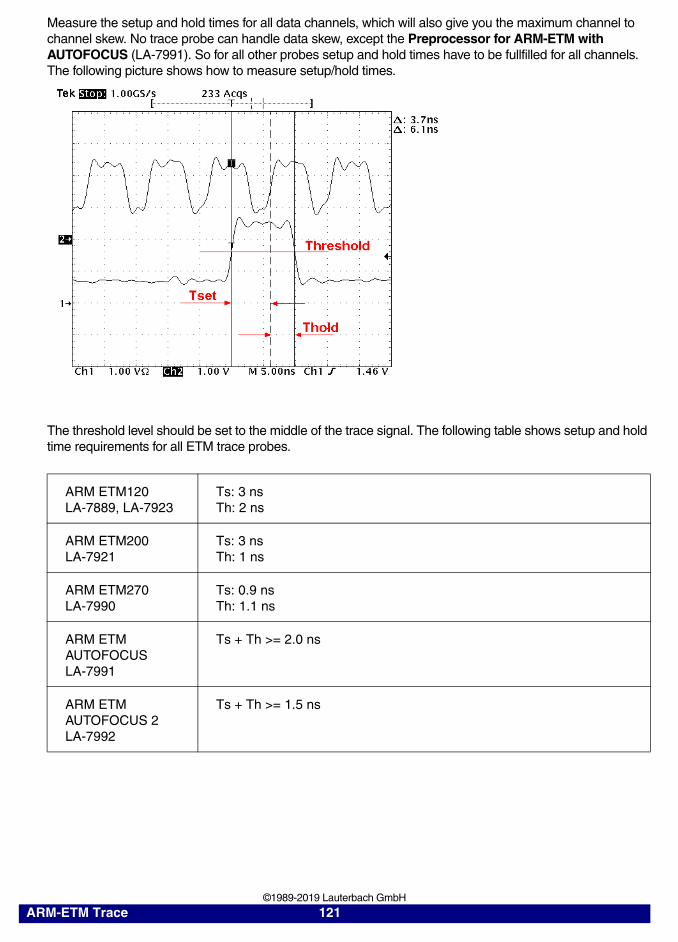
Measure the setup and hold times for all data channels, which will also give you the maximum channel to channel skew. No trace probe can handle data skew, except the Preprocessor for ARM-ETM with AUTOFOCUS (LA-7991). So for all other probes setup and hold times have to be fullfilled for all channels. The following picture shows how to measure setup/hold times.
The threshold level should be set to the middle of the trace signal. The following table shows setup and hold time requirements for all ETM trace probes.
ARM ETM120LA-7889, LA-7923
Ts: 3 nsTh: 2 ns
ARM ETM200LA-7921
Ts: 3 nsTh: 1 ns
ARM ETM270LA-7990
Ts: 0.9 nsTh: 1.1 ns
ARM ETM AUTOFOCUSLA-7991
Ts + Th >= 2.0 ns
ARM ETM AUTOFOCUS 2LA-7992
Ts + Th >= 1.5 ns
ARM-ETM Trace 121 ©1989-2019 Lauterbach GmbH
The Preprocessor for ARM-ETM with AUTOFOCUS is very powerful, if it comes to configuring itself for different target trace ports. Usually you do not need to worry about setup and hold times for data rates as high as 200 Mbit/s, although it is always a good idea to keep the channel to channel skew low and the clock duty cycle close to 50/50. Depending on your trace port data rate the maximum channel to channel skew has to stay below:
For instance a trace port with a data rate of 300 Mbit/s should have no more than (1/300 MHz - 2 ns) = 1.33 ns channel to channel skew. In addition the maximum Operation Frequency has to be considered.
ARM ETM AUTOFOCUS 1/2LA-7991/LA-7992
ch2ch_skew <= t_period - (Ts + Th)
ARM-ETM Trace 122 ©1989-2019 Lauterbach GmbH
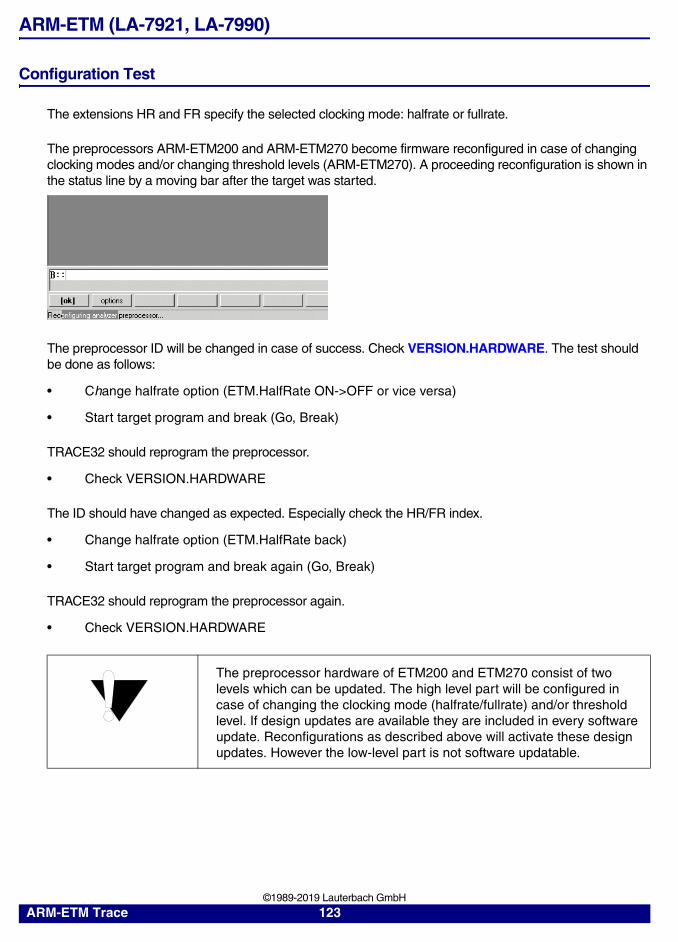
ARM-ETM (LA-7921, LA-7990)
Configuration Test
The extensions HR and FR specify the selected clocking mode: halfrate or fullrate.
The preprocessors ARM-ETM200 and ARM-ETM270 become firmware reconfigured in case of changing clocking modes and/or changing threshold levels (ARM-ETM270). A proceeding reconfiguration is shown in the status line by a moving bar after the target was started.
The preprocessor ID will be changed in case of success. Check VERSION.HARDWARE. The test should be done as follows:
• Change halfrate option (ETM.HalfRate ON->OFF or vice versa)
• Start target program and break (Go, Break)
TRACE32 should reprogram the preprocessor.
• Check VERSION.HARDWARE
The ID should have changed as expected. Especially check the HR/FR index.
• Change halfrate option (ETM.HalfRate back)
• Start target program and break again (Go, Break)
TRACE32 should reprogram the preprocessor again.
• Check VERSION.HARDWARE
The preprocessor hardware of ETM200 and ETM270 consist of two levels which can be updated. The high level part will be configured in case of changing the clocking mode (halfrate/fullrate) and/or threshold level. If design updates are available they are included in every software update. Reconfigurations as described above will activate these design updates. However the low-level part is not software updatable.
ARM-ETM Trace 123 ©1989-2019 Lauterbach GmbH
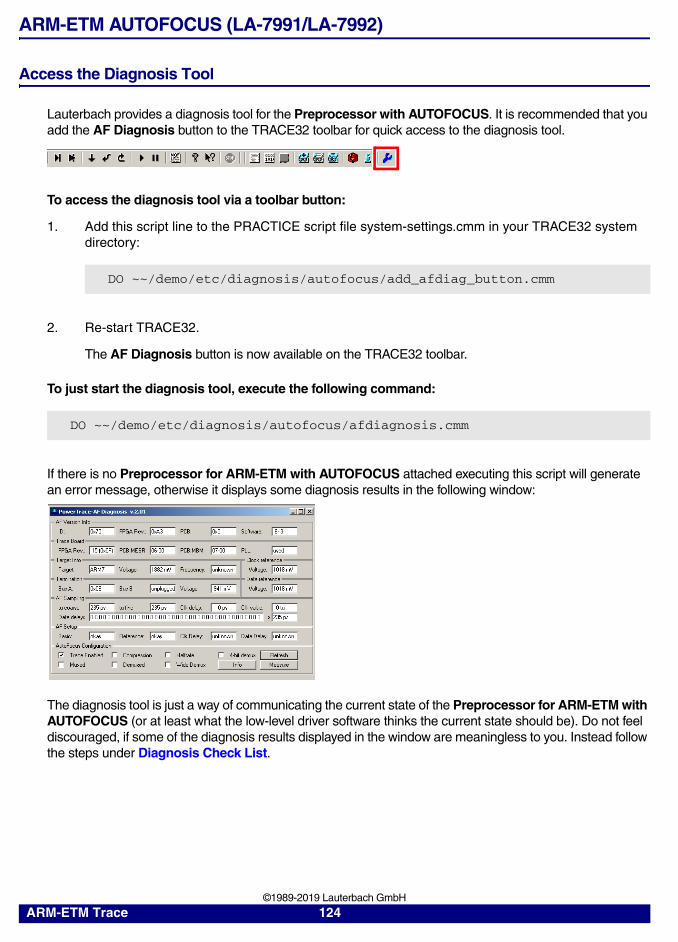
ARM-ETM AUTOFOCUS (LA-7991/LA-7992)
Access the Diagnosis Tool
Lauterbach provides a diagnosis tool for the Preprocessor with AUTOFOCUS. It is recommended that you add the AF Diagnosis button to the TRACE32 toolbar for quick access to the diagnosis tool.
To access the diagnosis tool via a toolbar button:
1. Add this script line to the PRACTICE script file system-settings.cmm in your TRACE32 system directory:
2. Re-start TRACE32.
The AF Diagnosis button is now available on the TRACE32 toolbar.
To just start the diagnosis tool, execute the following command:
If there is no Preprocessor for ARM-ETM with AUTOFOCUS attached executing this script will generate an error message, otherwise it displays some diagnosis results in the following window:
The diagnosis tool is just a way of communicating the current state of the Preprocessor for ARM-ETM with AUTOFOCUS (or at least what the low-level driver software thinks the current state should be). Do not feel discouraged, if some of the diagnosis results displayed in the window are meaningless to you. Instead follow the steps under Diagnosis Check List.
DO ~~/demo/etc/diagnosis/autofocus/add_afdiag_button.cmm
DO ~~/demo/etc/diagnosis/autofocus/afdiagnosis.cmm
ARM-ETM Trace 124 ©1989-2019 Lauterbach GmbH

Diagnosis Check List
1. Make sure that you completed the basic check list, especially do not forget to execute Trace.AutoFocus after setting up your trace port with the frequency you wish to trace and before attempting to trace signals. Do you get any error or warning messages? (for very high frequencies you may need to repeat this command until the hardware configuration is successful).
2. What is your target voltage? For Preprocessors with pluggable termination module: is the proper termination PCB plugged in? For further information refer to The Termination PCB.
3. Use the diagnosis tool for Preprocessor for ARM-ETM with AUTOFOCUS to read in the current state of the driver software / Preprocessor. After executing commands that might change the state of the Preprocessor (e.g. Trace.AutoFocus) use the Refresh button to load current values
ARM-ETM Trace 125 ©1989-2019 Lauterbach GmbH
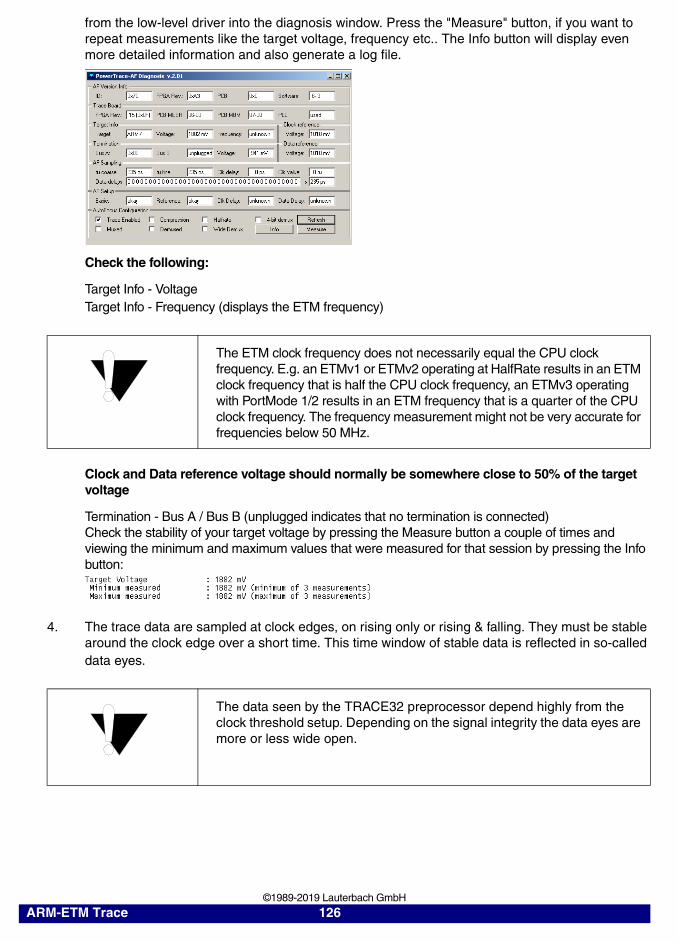
from the low-level driver into the diagnosis window. Press the "Measure" button, if you want to repeat measurements like the target voltage, frequency etc.. The Info button will display even more detailed information and also generate a log file.
Check the following:
Target Info - VoltageTarget Info - Frequency (displays the ETM frequency)
Clock and Data reference voltage should normally be somewhere close to 50% of the target voltage
Termination - Bus A / Bus B (unplugged indicates that no termination is connected)Check the stability of your target voltage by pressing the Measure button a couple of times and viewing the minimum and maximum values that were measured for that session by pressing the Info button:
4. The trace data are sampled at clock edges, on rising only or rising & falling. They must be stable around the clock edge over a short time. This time window of stable data is reflected in so-called data eyes.
The ETM clock frequency does not necessarily equal the CPU clock frequency. E.g. an ETMv1 or ETMv2 operating at HalfRate results in an ETM clock frequency that is half the CPU clock frequency, an ETMv3 operating with PortMode 1/2 results in an ETM frequency that is a quarter of the CPU clock frequency. The frequency measurement might not be very accurate for frequencies below 50 MHz.
The data seen by the TRACE32 preprocessor depend highly from the clock threshold setup. Depending on the signal integrity the data eyes are more or less wide open.
ARM-ETM Trace 126 ©1989-2019 Lauterbach GmbH
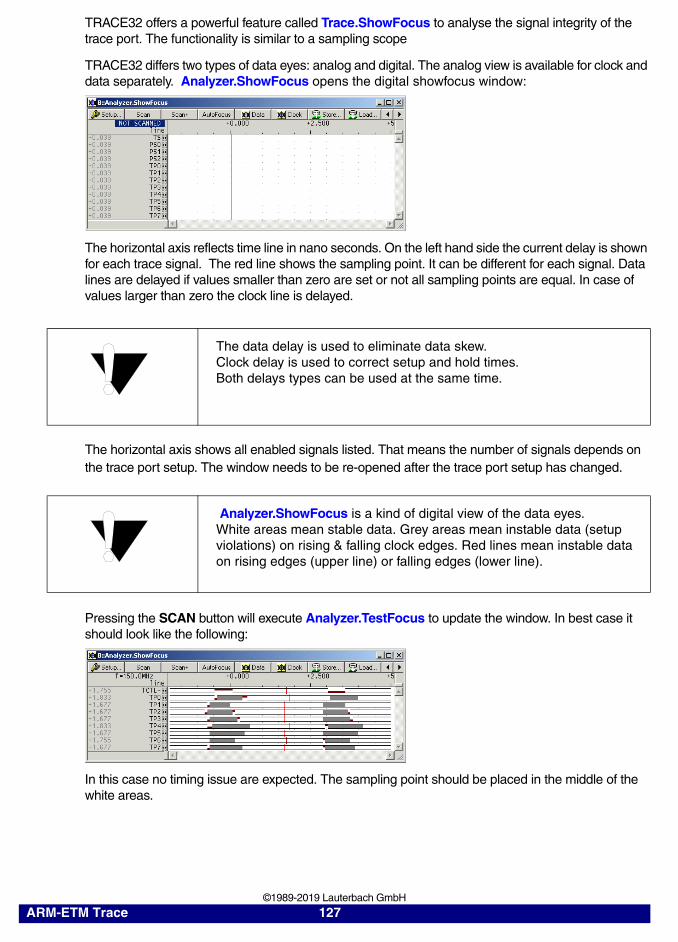
TRACE32 offers a powerful feature called Trace.ShowFocus to analyse the signal integrity of the trace port. The functionality is similar to a sampling scope
TRACE32 differs two types of data eyes: analog and digital. The analog view is available for clock and data separately. Analyzer.ShowFocus opens the digital showfocus window:
The horizontal axis reflects time line in nano seconds. On the left hand side the current delay is shown for each trace signal. The red line shows the sampling point. It can be different for each signal. Data lines are delayed if values smaller than zero are set or not all sampling points are equal. In case of values larger than zero the clock line is delayed.
The horizontal axis shows all enabled signals listed. That means the number of signals depends on the trace port setup. The window needs to be re-opened after the trace port setup has changed.
Pressing the SCAN button will execute Analyzer.TestFocus to update the window. In best case it should look like the following:
In this case no timing issue are expected. The sampling point should be placed in the middle of the white areas.
The data delay is used to eliminate data skew.Clock delay is used to correct setup and hold times.Both delays types can be used at the same time.
Analyzer.ShowFocus is a kind of digital view of the data eyes.White areas mean stable data. Grey areas mean instable data (setup violations) on rising & falling clock edges. Red lines mean instable data on rising edges (upper line) or falling edges (lower line).
ARM-ETM Trace 127 ©1989-2019 Lauterbach GmbH
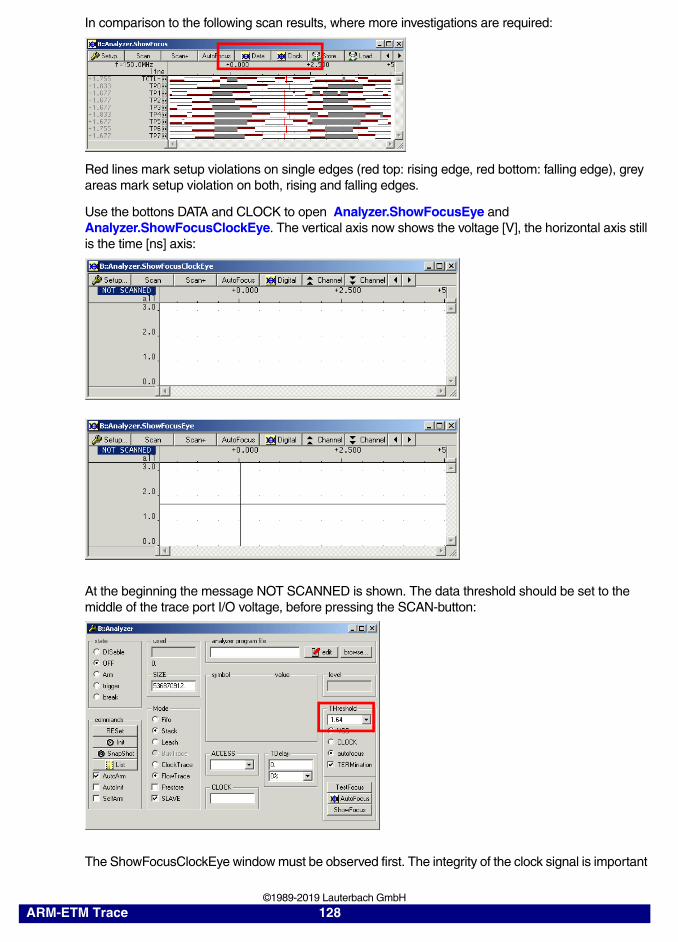
In comparison to the following scan results, where more investigations are required:
Red lines mark setup violations on single edges (red top: rising edge, red bottom: falling edge), grey areas mark setup violation on both, rising and falling edges.
Use the bottons DATA and CLOCK to open Analyzer.ShowFocusEye and Analyzer.ShowFocusClockEye. The vertical axis now shows the voltage [V], the horizontal axis still is the time [ns] axis:
At the beginning the message NOT SCANNED is shown. The data threshold should be set to the middle of the trace port I/O voltage, before pressing the SCAN-button:
The ShowFocusClockEye window must be observed first. The integrity of the clock signal is important
ARM-ETM Trace 128 ©1989-2019 Lauterbach GmbH
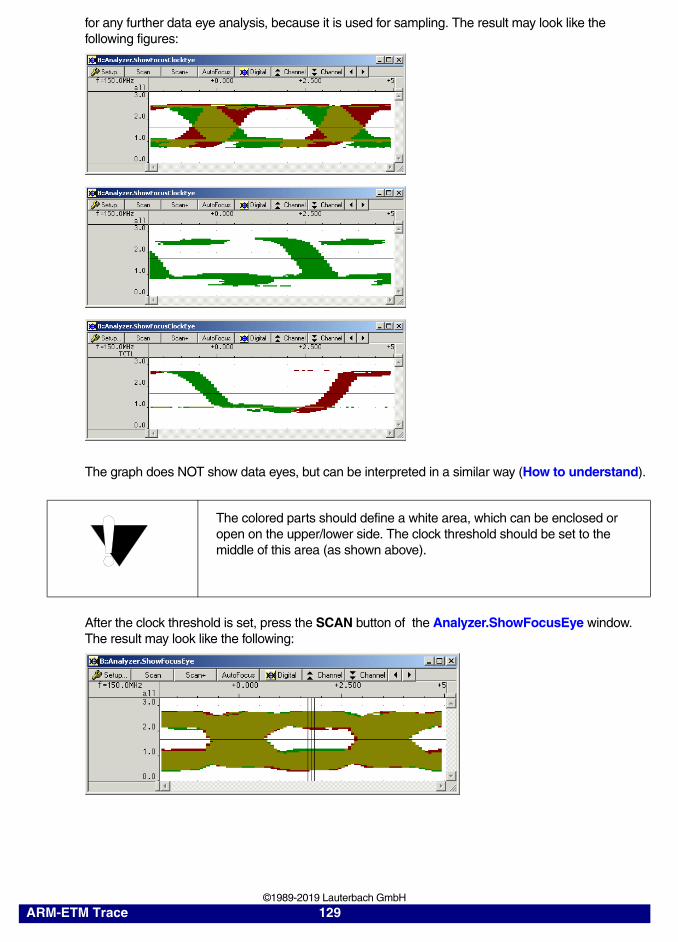
for any further data eye analysis, because it is used for sampling. The result may look like the following figures:
The graph does NOT show data eyes, but can be interpreted in a similar way (How to understand).
After the clock threshold is set, press the SCAN button of the Analyzer.ShowFocusEye window. The result may look like the following:
The colored parts should define a white area, which can be enclosed or open on the upper/lower side. The clock threshold should be set to the middle of this area (as shown above).
ARM-ETM Trace 129 ©1989-2019 Lauterbach GmbH
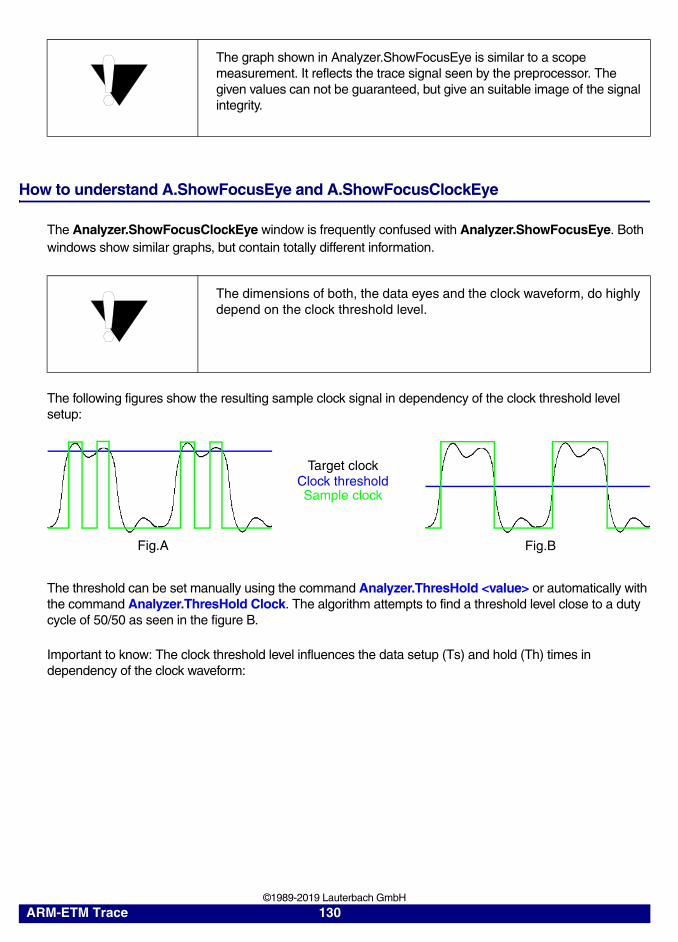
How to understand A.ShowFocusEye and A.ShowFocusClockEye
The Analyzer.ShowFocusClockEye window is frequently confused with Analyzer.ShowFocusEye. Both windows show similar graphs, but contain totally different information.
The following figures show the resulting sample clock signal in dependency of the clock threshold level setup:
The threshold can be set manually using the command Analyzer.ThresHold <value> or automatically with the command Analyzer.ThresHold Clock. The algorithm attempts to find a threshold level close to a duty cycle of 50/50 as seen in the figure B.
Important to know: The clock threshold level influences the data setup (Ts) and hold (Th) times in dependency of the clock waveform:
The graph shown in Analyzer.ShowFocusEye is similar to a scope measurement. It reflects the trace signal seen by the preprocessor. The given values can not be guaranteed, but give an suitable image of the signal integrity.
The dimensions of both, the data eyes and the clock waveform, do highly depend on the clock threshold level.
Target clockClock thresholdSample clock
Fig.A Fig.B
ARM-ETM Trace 130 ©1989-2019 Lauterbach GmbH
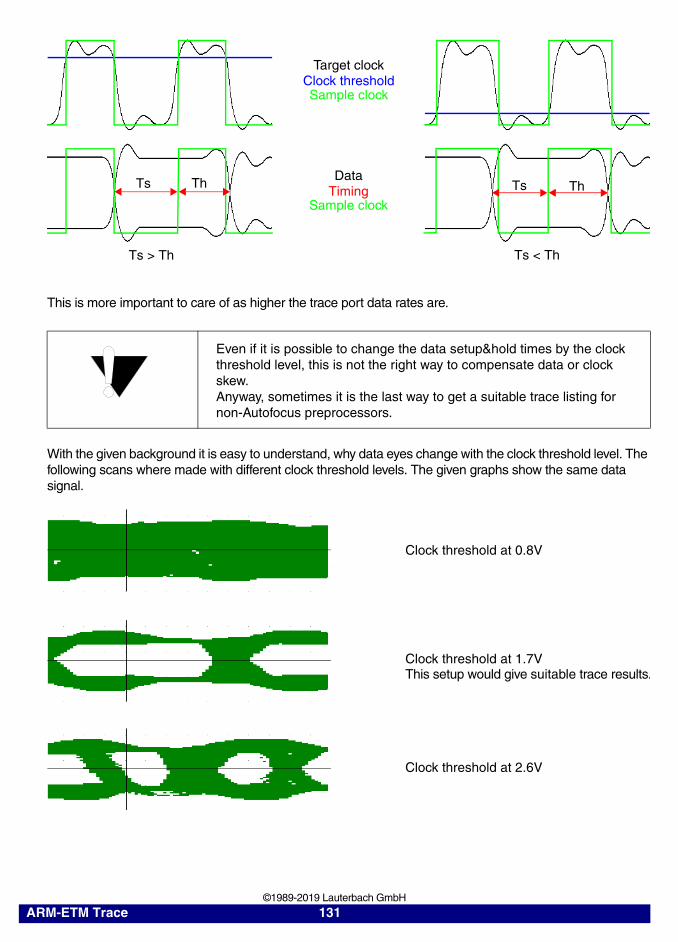
This is more important to care of as higher the trace port data rates are.
With the given background it is easy to understand, why data eyes change with the clock threshold level. The following scans where made with different clock threshold levels. The given graphs show the same data signal.
Even if it is possible to change the data setup&hold times by the clock threshold level, this is not the right way to compensate data or clock skew.Anyway, sometimes it is the last way to get a suitable trace listing fornon-Autofocus preprocessors.
Ts Th Ts Th
Ts > Th Ts < Th
Target clockClock thresholdSample clock
DataTiming
Sample clock
Clock threshold at 0.8V
Clock threshold at 1.7VThis setup would give suitable trace results.
Clock threshold at 2.6V
ARM-ETM Trace 131 ©1989-2019 Lauterbach GmbH

The number of different data eye scans lead us to the clock eye window (Analyzer.ShowFocusClockEye) which may look like the following:
Green color means sampling on rising clock edge, Red color means sampling on falling clock edge.
The correlation between Analyzer.ShowFocusEye and Analyzer.ShowFocusClockEye is shown with the following 3D-figure:
On the lower part of the figure different data eye scans are cascaded. The data threshold level and the sampling point are marked by black lines. The data threshold line also define the level where the clock eye picture would be normally placed.Basically, the clock eye scan shows a third dimension of the data eye scan..
The scan of Analyzer.ShowFocusEye keeps the clock threshold constant during the data threshold is changed.
The scan of Analyzer.ShowFocusClockEye keeps the data threshold constant during the clock threshold is changed.
Sampling on rising clock edges
Sampling on both clock edges(e.g. ETMv3)
(e.g. ETMv1 normal mode)
Different scans of Analyzer.ShowFocusEye
Scan of Analyzer.ShowFocusClockEye
Data threshold level
ARM-ETM Trace 132 ©1989-2019 Lauterbach GmbH
ARM-ETM HSSTP (LA-7988)
TBD
ARM-ETM Trace 133 ©1989-2019 Lauterbach GmbH

Support Request
If you can not detect any problem on your side, please send the following informationto [email protected]:
• used start-up/configuration scripts
• the complete text of the error messages you get (AREA.view)
• a screenshot of VERSION.SOFTWARE
• a screenshot of VERSION.HARDWARE
• a screenshot of VERSION.HARDWARE2
• a screenshot of the ETM window
• JTAG voltage level
• JTAG frequency
• ETM voltage level
• cpu core frequency
• ETM connector pinout (board schematics and layout)
• Is the problem frequency dependent?
• Does another trace hardware behave different?
For ARM-ETM with AUTOFOCUS also do the following:Please execute Trace.AutoFocus once more and add the following information to your request:
• a screenshot of Trace.ShowFocus (press SCAN before)
• a screenshot of Trace.ShowFocusEye (press SCAN before)
• a screenshot of Trace.ShowFocusClockEye (set threshold to VCC and press SCAN)
• the log file generated with Support.cmm (menu Help/About/Support) script
ARM-ETM Trace 134 ©1989-2019 Lauterbach GmbH

Recommendations for Target Board Design
• Place the trace MICTOR connector close to the target processor. Make sure that the MICTOR ground Pins are connected to your target's ground plane.
AMP part numbers for MICTOR connectors (designed for 50 systems) can be found on:
www.lauterbach.com/adetmmictor.html
For information on MICTOR connectors please refer to: www.amp.com
Additional information on MICTOR connectors and the MICTOR flex extension can be obtained by contacting [email protected].
• Consider setup and hold time requirements. Especially for Preprocessors without AutoFocus it is important to meet their timing requirements.
• Match your traces to reduce channel to channel skew: same length, same PCB layer and same amount of vias for all traces. Avoid stubs.
Ideally traces should have a 50 impedance
• Avoid parallel routing of the trace bus. The closer the tracks the more cross talk will influence the signal integrity. Special routing (meandering, e.g. used for length equalization) should be used to prevent large areas of parallel track placment. Even at higher data rates this is an important point.
• Sufficient bypass capacitors are crucial to keep the supply voltage stable when the trace port is driven by your application. This is esp. important for portsizes greater 8 bit at high frequencies. If your supply voltages are not stable, the target processor might assume illegal JTAG tap states and the TPA might loose control over the target (typically this might result in messages such as "emulation debug port fail").
If you have to safe cost, just allocate additional footprints for bypass capacitors in your PCB layout. That way you can mount additional bypass capacitors for the development PCBs that have to drive TPAs and omitt them for the production PCBs.
• Use Power and ground planes:
Capacitor vias should never be shared. Each capacitor requires at least 2 vias: one for connecting to ground and one for its vcc connection. Vias should descend directly to the power and ground planes (traces should not be used to connect bypass capacitors to the power pins they are servicing).
• A series termination on the target is usually not required. All trace channels are terminated on the Preprocessor to 50% of the voltage level of pin12 of the trace mictor.
If desirable, footprints for a series termination on the target can be implemented and mounted with O . If necessary, sophisticated users can implement a series-parallel combination. Contact [email protected] for ECDs of the Preprocessor’s termination.
• Pin 12 (VTREF) of the trace port mictor has to be on the same voltage level than the amplitude of the trace port's clock and data channels. Pin 14 has to be on the same voltage level than the amplitude of the JTAG signals (usually the same as Pin 12). Again: the termination voltage of the TPA will be 50% of VTREF.
• The target voltage has to be within the specified range specified range. For other voltage levels contact [email protected].
NOTE: for very high data rates (> 300 Mbit/s) 1.8 V signals are usually easier to support by the target than higher voltage levels.
ARM-ETM Trace 135 ©1989-2019 Lauterbach GmbH
• Recommendations for output drivers:
If possible keep output drive strength and slew rate programmable (e.g. 8, 12, 16 mA for both low and high slew).
NOTE: For very high data rates (> 300 Mbit/s) 12-16mA drivers should be used to get sharp edges and sufficient data eye opening .
If you cannot support high drive strength, at least make an investment in the clock signal. Usually the clock signal is the bottle neck, so the clock signal should have at least 6 mA, better 8 … 12 mA, drive strength. Also you should use HalfRate, whenever possible to divide the clock frequency by two.
Keep in mind that the drive strength of the output buffers has to be supported by proper PCB layout and sufficient bypass capacitors for all frequencies ranges!
Your trace port supply voltage should not show any significant ripple, even if signals are traced by the TPA (contact [email protected] for ECDs of the TPA termination).
ARM-ETM Trace 136 ©1989-2019 Lauterbach GmbH
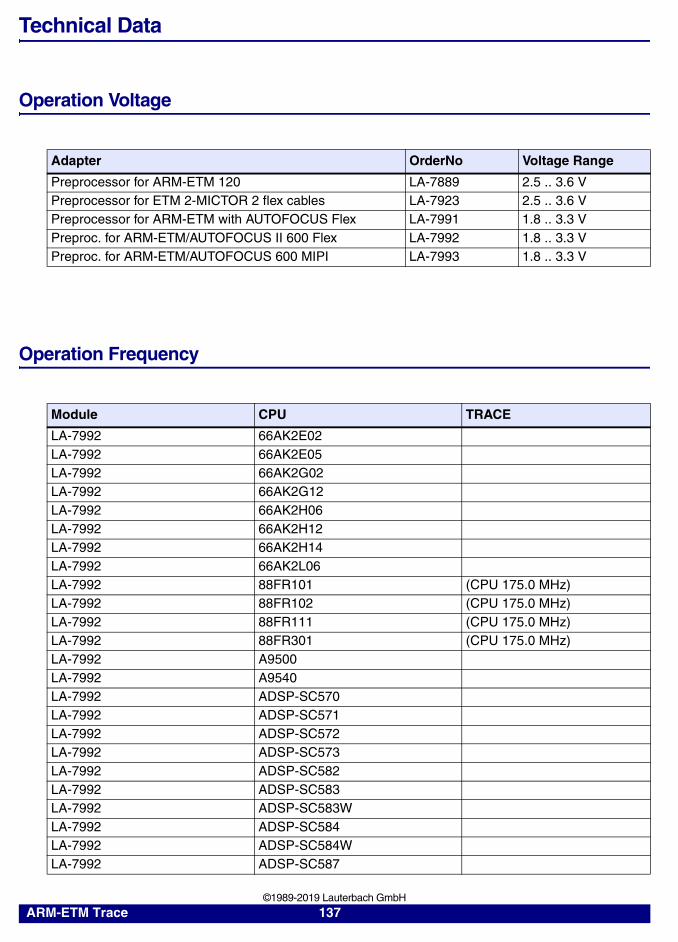
Technical Data
Operation Voltage
Operation Frequency
Adapter OrderNo Voltage Range
Preprocessor for ARM-ETM 120 LA-7889 2.5 .. 3.6 VPreprocessor for ETM 2-MICTOR 2 flex cables LA-7923 2.5 .. 3.6 VPreprocessor for ARM-ETM with AUTOFOCUS Flex LA-7991 1.8 .. 3.3 VPreproc. for ARM-ETM/AUTOFOCUS II 600 Flex LA-7992 1.8 .. 3.3 VPreproc. for ARM-ETM/AUTOFOCUS 600 MIPI LA-7993 1.8 .. 3.3 V
Module CPU TRACE
LA-7992 66AK2E02LA-7992 66AK2E05LA-7992 66AK2G02LA-7992 66AK2G12LA-7992 66AK2H06LA-7992 66AK2H12LA-7992 66AK2H14LA-7992 66AK2L06LA-7992 88FR101 (CPU 175.0 MHz)LA-7992 88FR102 (CPU 175.0 MHz)LA-7992 88FR111 (CPU 175.0 MHz)LA-7992 88FR301 (CPU 175.0 MHz)LA-7992 A9500LA-7992 A9540LA-7992 ADSP-SC570LA-7992 ADSP-SC571LA-7992 ADSP-SC572LA-7992 ADSP-SC573LA-7992 ADSP-SC582LA-7992 ADSP-SC583LA-7992 ADSP-SC583WLA-7992 ADSP-SC584LA-7992 ADSP-SC584WLA-7992 ADSP-SC587
ARM-ETM Trace 137 ©1989-2019 Lauterbach GmbH
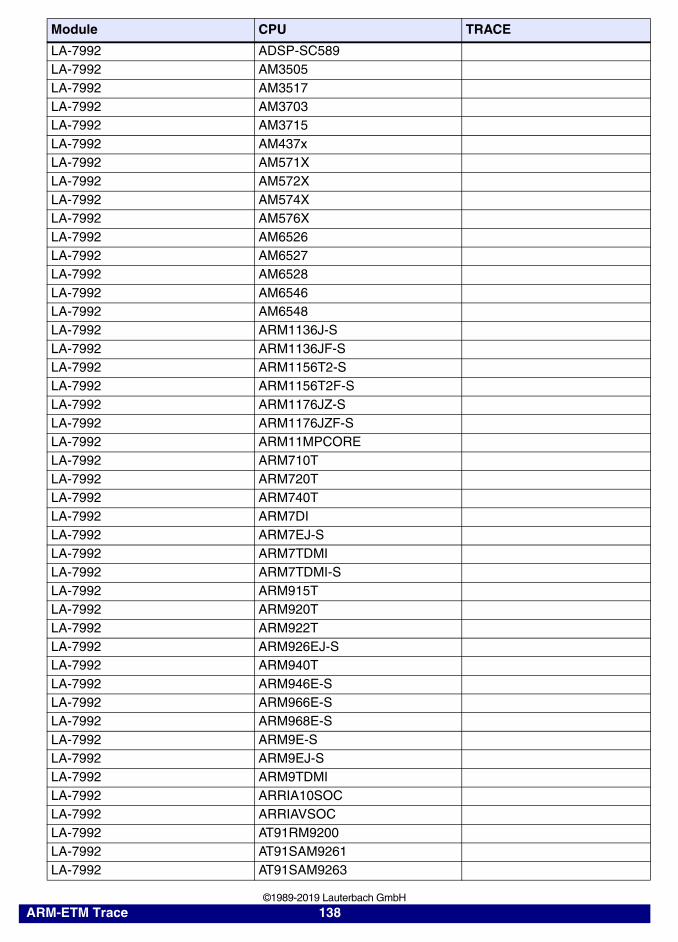
LA-7992 ADSP-SC589LA-7992 AM3505LA-7992 AM3517LA-7992 AM3703LA-7992 AM3715LA-7992 AM437xLA-7992 AM571XLA-7992 AM572XLA-7992 AM574XLA-7992 AM576XLA-7992 AM6526LA-7992 AM6527LA-7992 AM6528LA-7992 AM6546LA-7992 AM6548LA-7992 ARM1136J-SLA-7992 ARM1136JF-SLA-7992 ARM1156T2-SLA-7992 ARM1156T2F-SLA-7992 ARM1176JZ-SLA-7992 ARM1176JZF-SLA-7992 ARM11MPCORELA-7992 ARM710TLA-7992 ARM720TLA-7992 ARM740TLA-7992 ARM7DILA-7992 ARM7EJ-SLA-7992 ARM7TDMILA-7992 ARM7TDMI-SLA-7992 ARM915TLA-7992 ARM920TLA-7992 ARM922TLA-7992 ARM926EJ-SLA-7992 ARM940TLA-7992 ARM946E-SLA-7992 ARM966E-SLA-7992 ARM968E-SLA-7992 ARM9E-SLA-7992 ARM9EJ-SLA-7992 ARM9TDMILA-7992 ARRIA10SOCLA-7992 ARRIAVSOCLA-7992 AT91RM9200LA-7992 AT91SAM9261LA-7992 AT91SAM9263
Module CPU TRACE
ARM-ETM Trace 138 ©1989-2019 Lauterbach GmbH
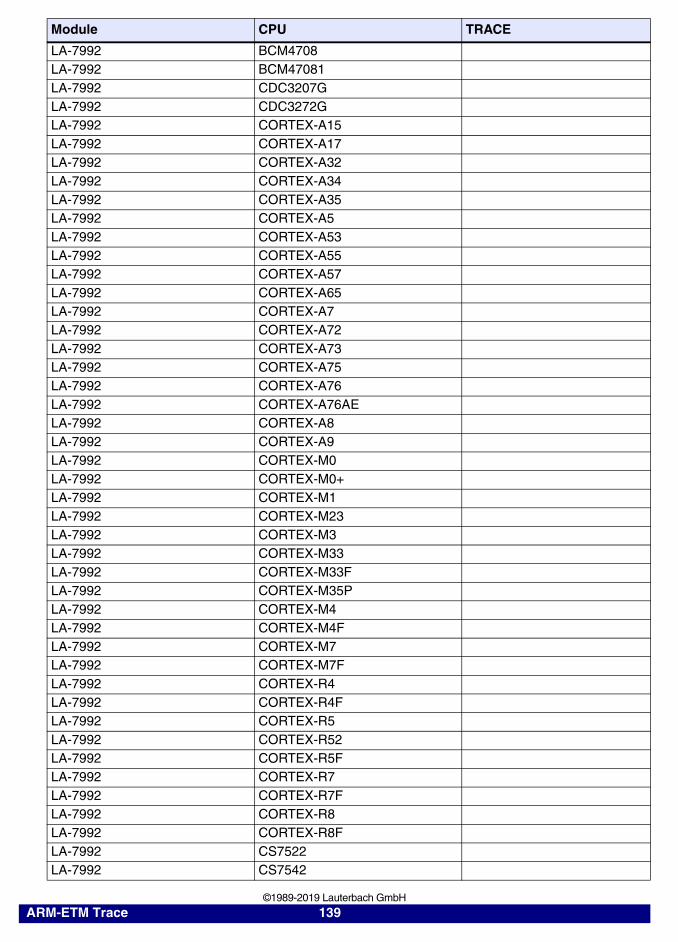
LA-7992 BCM4708LA-7992 BCM47081LA-7992 CDC3207GLA-7992 CDC3272GLA-7992 CORTEX-A15LA-7992 CORTEX-A17LA-7992 CORTEX-A32LA-7992 CORTEX-A34LA-7992 CORTEX-A35LA-7992 CORTEX-A5LA-7992 CORTEX-A53LA-7992 CORTEX-A55LA-7992 CORTEX-A57LA-7992 CORTEX-A65LA-7992 CORTEX-A7LA-7992 CORTEX-A72LA-7992 CORTEX-A73LA-7992 CORTEX-A75LA-7992 CORTEX-A76LA-7992 CORTEX-A76AELA-7992 CORTEX-A8LA-7992 CORTEX-A9LA-7992 CORTEX-M0LA-7992 CORTEX-M0+LA-7992 CORTEX-M1LA-7992 CORTEX-M23LA-7992 CORTEX-M3LA-7992 CORTEX-M33LA-7992 CORTEX-M33FLA-7992 CORTEX-M35PLA-7992 CORTEX-M4LA-7992 CORTEX-M4FLA-7992 CORTEX-M7LA-7992 CORTEX-M7FLA-7992 CORTEX-R4LA-7992 CORTEX-R4FLA-7992 CORTEX-R5LA-7992 CORTEX-R52LA-7992 CORTEX-R5FLA-7992 CORTEX-R7LA-7992 CORTEX-R7FLA-7992 CORTEX-R8LA-7992 CORTEX-R8FLA-7992 CS7522LA-7992 CS7542
Module CPU TRACE
ARM-ETM Trace 139 ©1989-2019 Lauterbach GmbH
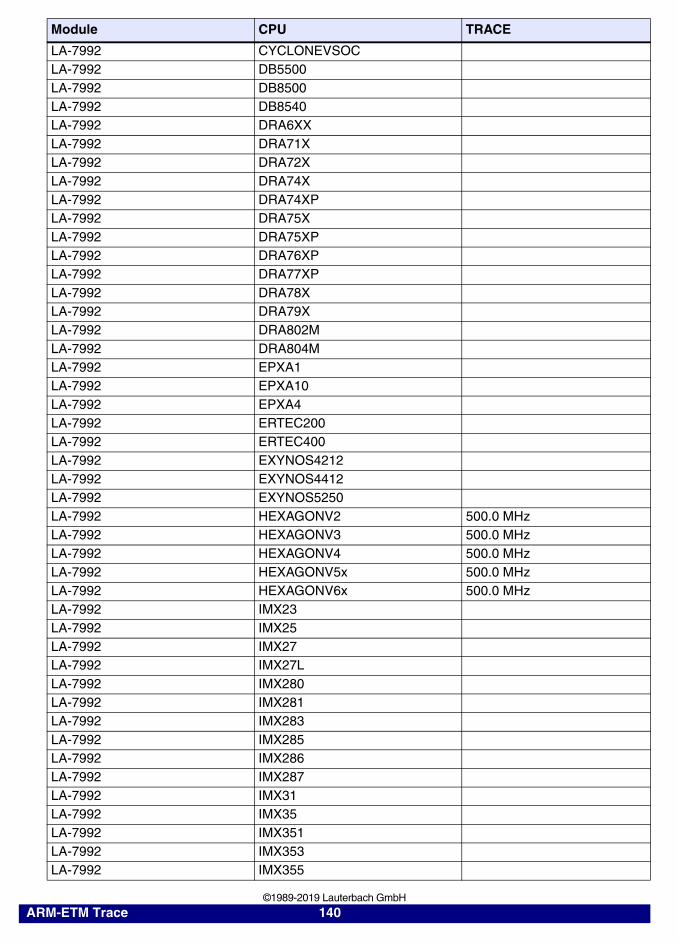
LA-7992 CYCLONEVSOCLA-7992 DB5500LA-7992 DB8500LA-7992 DB8540LA-7992 DRA6XXLA-7992 DRA71XLA-7992 DRA72XLA-7992 DRA74XLA-7992 DRA74XPLA-7992 DRA75XLA-7992 DRA75XPLA-7992 DRA76XPLA-7992 DRA77XPLA-7992 DRA78XLA-7992 DRA79XLA-7992 DRA802MLA-7992 DRA804MLA-7992 EPXA1LA-7992 EPXA10LA-7992 EPXA4LA-7992 ERTEC200LA-7992 ERTEC400LA-7992 EXYNOS4212LA-7992 EXYNOS4412LA-7992 EXYNOS5250LA-7992 HEXAGONV2 500.0 MHzLA-7992 HEXAGONV3 500.0 MHzLA-7992 HEXAGONV4 500.0 MHzLA-7992 HEXAGONV5x 500.0 MHzLA-7992 HEXAGONV6x 500.0 MHzLA-7992 IMX23LA-7992 IMX25LA-7992 IMX27LA-7992 IMX27LLA-7992 IMX280LA-7992 IMX281LA-7992 IMX283LA-7992 IMX285LA-7992 IMX286LA-7992 IMX287LA-7992 IMX31LA-7992 IMX35LA-7992 IMX351LA-7992 IMX353LA-7992 IMX355
Module CPU TRACE
ARM-ETM Trace 140 ©1989-2019 Lauterbach GmbH
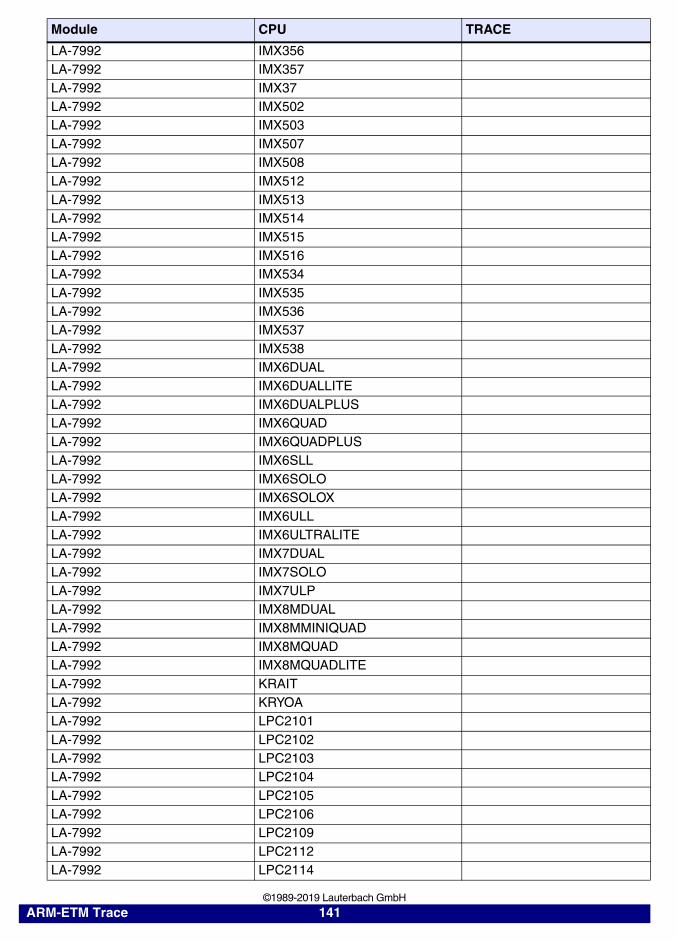
LA-7992 IMX356LA-7992 IMX357LA-7992 IMX37LA-7992 IMX502LA-7992 IMX503LA-7992 IMX507LA-7992 IMX508LA-7992 IMX512LA-7992 IMX513LA-7992 IMX514LA-7992 IMX515LA-7992 IMX516LA-7992 IMX534LA-7992 IMX535LA-7992 IMX536LA-7992 IMX537LA-7992 IMX538LA-7992 IMX6DUALLA-7992 IMX6DUALLITELA-7992 IMX6DUALPLUSLA-7992 IMX6QUADLA-7992 IMX6QUADPLUSLA-7992 IMX6SLLLA-7992 IMX6SOLOLA-7992 IMX6SOLOXLA-7992 IMX6ULLLA-7992 IMX6ULTRALITELA-7992 IMX7DUALLA-7992 IMX7SOLOLA-7992 IMX7ULPLA-7992 IMX8MDUALLA-7992 IMX8MMINIQUADLA-7992 IMX8MQUADLA-7992 IMX8MQUADLITELA-7992 KRAITLA-7992 KRYOALA-7992 LPC2101LA-7992 LPC2102LA-7992 LPC2103LA-7992 LPC2104LA-7992 LPC2105LA-7992 LPC2106LA-7992 LPC2109LA-7992 LPC2112LA-7992 LPC2114
Module CPU TRACE
ARM-ETM Trace 141 ©1989-2019 Lauterbach GmbH
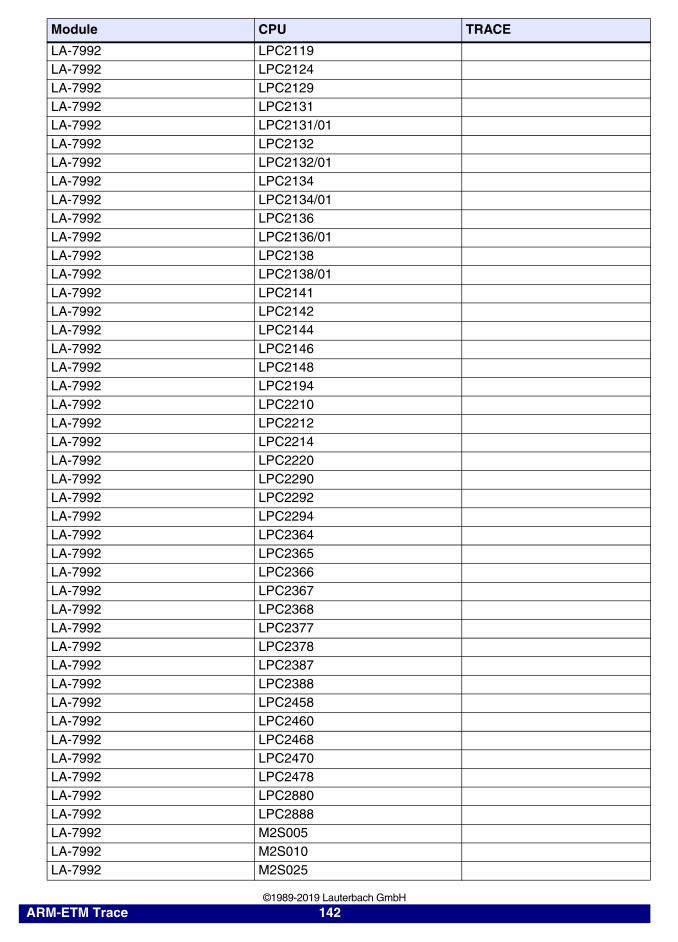
LA-7992 LPC2119LA-7992 LPC2124LA-7992 LPC2129LA-7992 LPC2131LA-7992 LPC2131/01LA-7992 LPC2132LA-7992 LPC2132/01LA-7992 LPC2134LA-7992 LPC2134/01LA-7992 LPC2136LA-7992 LPC2136/01LA-7992 LPC2138LA-7992 LPC2138/01LA-7992 LPC2141LA-7992 LPC2142LA-7992 LPC2144LA-7992 LPC2146LA-7992 LPC2148LA-7992 LPC2194LA-7992 LPC2210LA-7992 LPC2212LA-7992 LPC2214LA-7992 LPC2220LA-7992 LPC2290LA-7992 LPC2292LA-7992 LPC2294LA-7992 LPC2364LA-7992 LPC2365LA-7992 LPC2366LA-7992 LPC2367LA-7992 LPC2368LA-7992 LPC2377LA-7992 LPC2378LA-7992 LPC2387LA-7992 LPC2388LA-7992 LPC2458LA-7992 LPC2460LA-7992 LPC2468LA-7992 LPC2470LA-7992 LPC2478LA-7992 LPC2880LA-7992 LPC2888LA-7992 M2S005LA-7992 M2S010LA-7992 M2S025
Module CPU TRACE
ARM-ETM Trace 142 ©1989-2019 Lauterbach GmbH
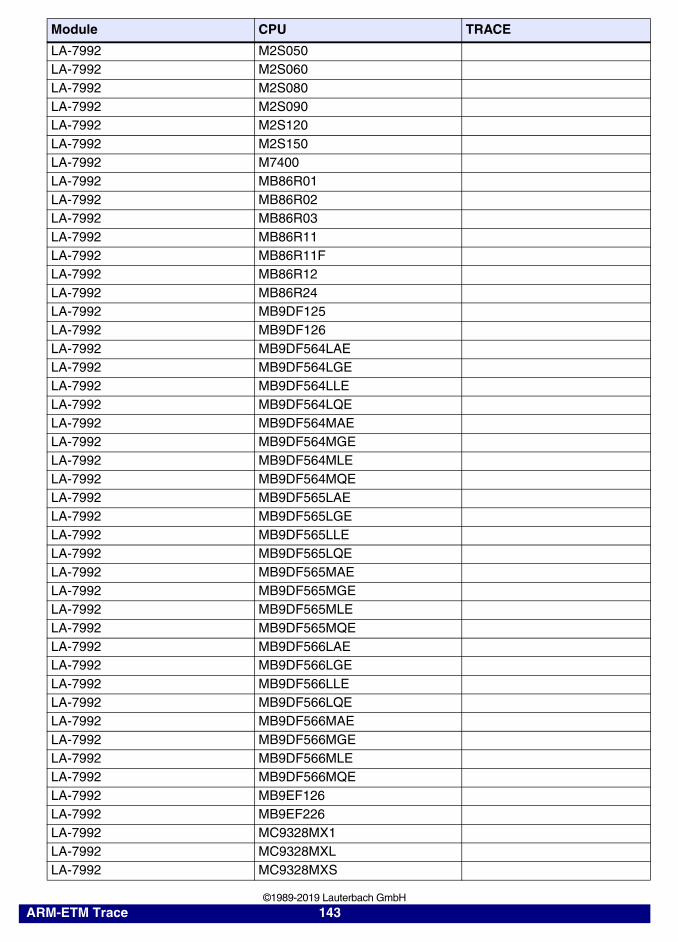
LA-7992 M2S050LA-7992 M2S060LA-7992 M2S080LA-7992 M2S090LA-7992 M2S120LA-7992 M2S150LA-7992 M7400LA-7992 MB86R01LA-7992 MB86R02LA-7992 MB86R03LA-7992 MB86R11LA-7992 MB86R11FLA-7992 MB86R12LA-7992 MB86R24LA-7992 MB9DF125LA-7992 MB9DF126LA-7992 MB9DF564LAELA-7992 MB9DF564LGELA-7992 MB9DF564LLELA-7992 MB9DF564LQELA-7992 MB9DF564MAELA-7992 MB9DF564MGELA-7992 MB9DF564MLELA-7992 MB9DF564MQELA-7992 MB9DF565LAELA-7992 MB9DF565LGELA-7992 MB9DF565LLELA-7992 MB9DF565LQELA-7992 MB9DF565MAELA-7992 MB9DF565MGELA-7992 MB9DF565MLELA-7992 MB9DF565MQELA-7992 MB9DF566LAELA-7992 MB9DF566LGELA-7992 MB9DF566LLELA-7992 MB9DF566LQELA-7992 MB9DF566MAELA-7992 MB9DF566MGELA-7992 MB9DF566MLELA-7992 MB9DF566MQELA-7992 MB9EF126LA-7992 MB9EF226LA-7992 MC9328MX1LA-7992 MC9328MXLLA-7992 MC9328MXS
Module CPU TRACE
ARM-ETM Trace 143 ©1989-2019 Lauterbach GmbH
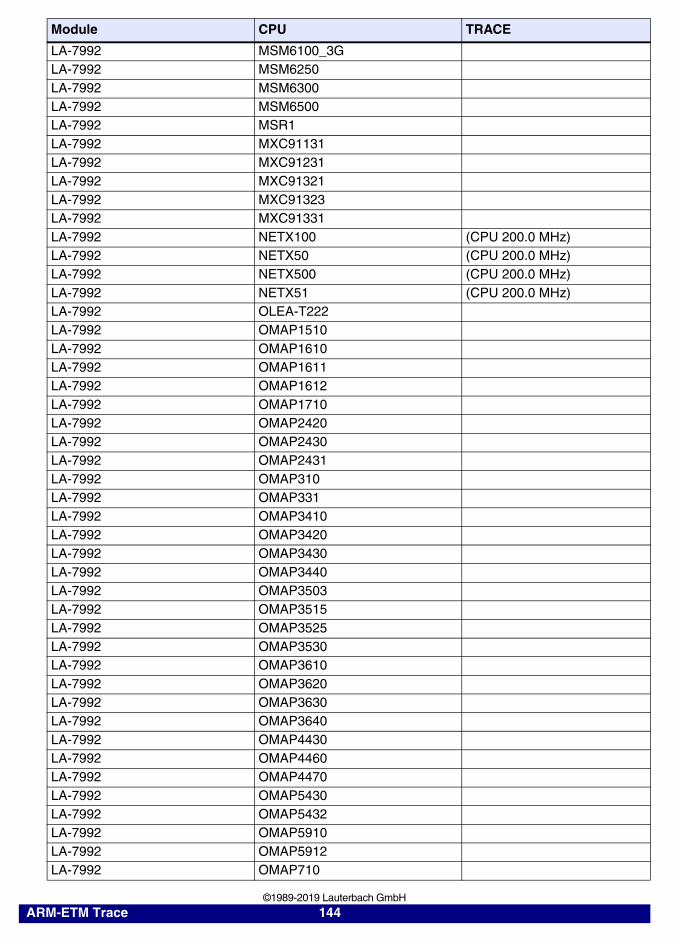
LA-7992 MSM6100_3GLA-7992 MSM6250LA-7992 MSM6300LA-7992 MSM6500LA-7992 MSR1LA-7992 MXC91131LA-7992 MXC91231LA-7992 MXC91321LA-7992 MXC91323LA-7992 MXC91331LA-7992 NETX100 (CPU 200.0 MHz)LA-7992 NETX50 (CPU 200.0 MHz)LA-7992 NETX500 (CPU 200.0 MHz)LA-7992 NETX51 (CPU 200.0 MHz)LA-7992 OLEA-T222LA-7992 OMAP1510LA-7992 OMAP1610LA-7992 OMAP1611LA-7992 OMAP1612LA-7992 OMAP1710LA-7992 OMAP2420LA-7992 OMAP2430LA-7992 OMAP2431LA-7992 OMAP310LA-7992 OMAP331LA-7992 OMAP3410LA-7992 OMAP3420LA-7992 OMAP3430LA-7992 OMAP3440LA-7992 OMAP3503LA-7992 OMAP3515LA-7992 OMAP3525LA-7992 OMAP3530LA-7992 OMAP3610LA-7992 OMAP3620LA-7992 OMAP3630LA-7992 OMAP3640LA-7992 OMAP4430LA-7992 OMAP4460LA-7992 OMAP4470LA-7992 OMAP5430LA-7992 OMAP5432LA-7992 OMAP5910LA-7992 OMAP5912LA-7992 OMAP710
Module CPU TRACE
ARM-ETM Trace 144 ©1989-2019 Lauterbach GmbH
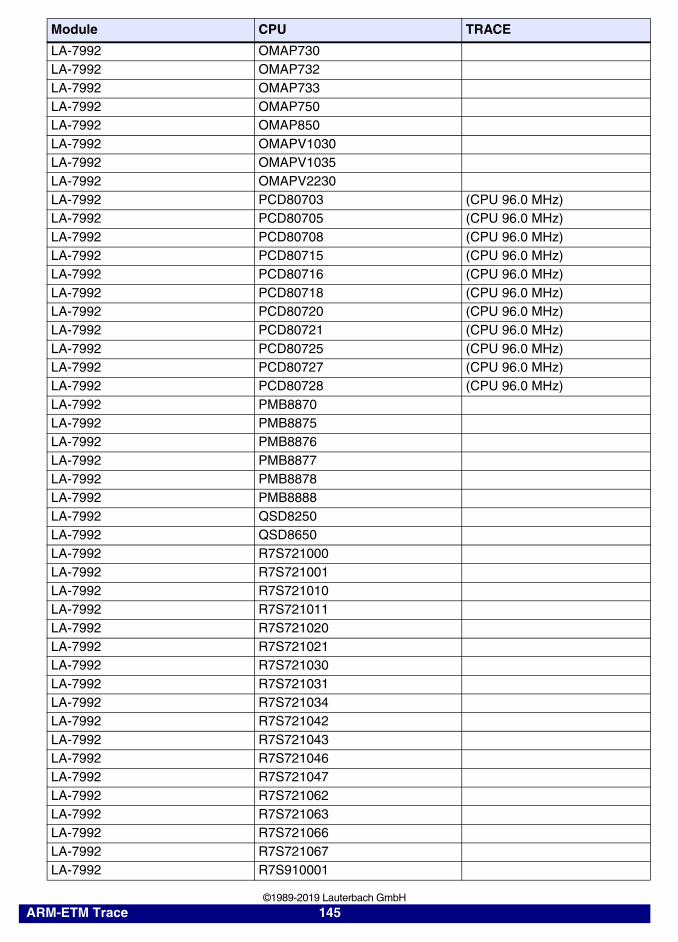
LA-7992 OMAP730LA-7992 OMAP732LA-7992 OMAP733LA-7992 OMAP750LA-7992 OMAP850LA-7992 OMAPV1030LA-7992 OMAPV1035LA-7992 OMAPV2230LA-7992 PCD80703 (CPU 96.0 MHz)LA-7992 PCD80705 (CPU 96.0 MHz)LA-7992 PCD80708 (CPU 96.0 MHz)LA-7992 PCD80715 (CPU 96.0 MHz)LA-7992 PCD80716 (CPU 96.0 MHz)LA-7992 PCD80718 (CPU 96.0 MHz)LA-7992 PCD80720 (CPU 96.0 MHz)LA-7992 PCD80721 (CPU 96.0 MHz)LA-7992 PCD80725 (CPU 96.0 MHz)LA-7992 PCD80727 (CPU 96.0 MHz)LA-7992 PCD80728 (CPU 96.0 MHz)LA-7992 PMB8870LA-7992 PMB8875LA-7992 PMB8876LA-7992 PMB8877LA-7992 PMB8878LA-7992 PMB8888LA-7992 QSD8250LA-7992 QSD8650LA-7992 R7S721000LA-7992 R7S721001LA-7992 R7S721010LA-7992 R7S721011LA-7992 R7S721020LA-7992 R7S721021LA-7992 R7S721030LA-7992 R7S721031LA-7992 R7S721034LA-7992 R7S721042LA-7992 R7S721043LA-7992 R7S721046LA-7992 R7S721047LA-7992 R7S721062LA-7992 R7S721063LA-7992 R7S721066LA-7992 R7S721067LA-7992 R7S910001
Module CPU TRACE
ARM-ETM Trace 145 ©1989-2019 Lauterbach GmbH

LA-7992 R7S910002LA-7992 R7S910006LA-7992 R7S910007LA-7992 R7S910011LA-7992 R7S910013LA-7992 R7S910015LA-7992 R7S910016LA-7992 R7S910017LA-7992 R7S910018LA-7992 R7S910025LA-7992 R7S910026LA-7992 R7S910027LA-7992 R7S910028LA-7992 R7S910035LA-7992 R7S910036LA-7992 R7S910101LA-7992 R7S910102LA-7992 R7S910106LA-7992 R7S910107LA-7992 R7S910111LA-7992 R7S910113LA-7992 R7S910115LA-7992 R7S910116LA-7992 R7S910117LA-7992 R7S910118LA-7992 R7S910125LA-7992 R7S910126LA-7992 R7S910127LA-7992 R7S910128LA-7992 R7S910135LA-7992 R7S910136LA-7992 R8A77420LA-7992 R8A77430LA-7992 R8A77440LA-7992 R8A77450LA-7992 R8A77470LA-7992 R8A77790LA-7992 R8A7790XLA-7992 R8A7791XLA-7992 R8A7792XLA-7992 R8A7793XLA-7992 R8A77940LA-7992 RM48L530-ZWTLA-7992 RM48L540-ZWTLA-7992 RM48L550-ZWT
Module CPU TRACE
ARM-ETM Trace 146 ©1989-2019 Lauterbach GmbH
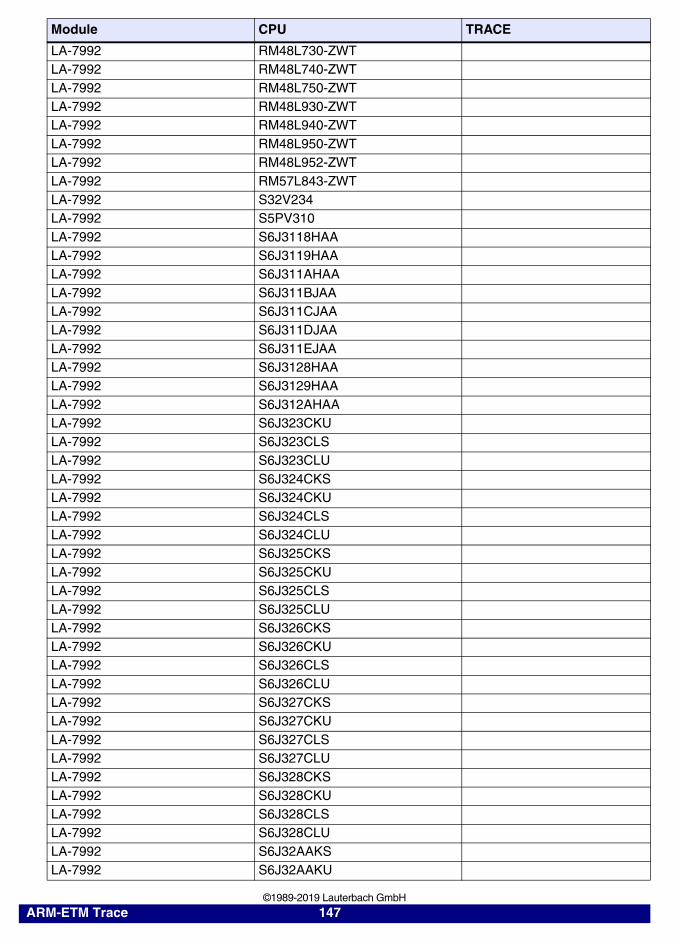
LA-7992 RM48L730-ZWTLA-7992 RM48L740-ZWTLA-7992 RM48L750-ZWTLA-7992 RM48L930-ZWTLA-7992 RM48L940-ZWTLA-7992 RM48L950-ZWTLA-7992 RM48L952-ZWTLA-7992 RM57L843-ZWTLA-7992 S32V234LA-7992 S5PV310LA-7992 S6J3118HAALA-7992 S6J3119HAALA-7992 S6J311AHAALA-7992 S6J311BJAALA-7992 S6J311CJAALA-7992 S6J311DJAALA-7992 S6J311EJAALA-7992 S6J3128HAALA-7992 S6J3129HAALA-7992 S6J312AHAALA-7992 S6J323CKULA-7992 S6J323CLSLA-7992 S6J323CLULA-7992 S6J324CKSLA-7992 S6J324CKULA-7992 S6J324CLSLA-7992 S6J324CLULA-7992 S6J325CKSLA-7992 S6J325CKULA-7992 S6J325CLSLA-7992 S6J325CLULA-7992 S6J326CKSLA-7992 S6J326CKULA-7992 S6J326CLSLA-7992 S6J326CLULA-7992 S6J327CKSLA-7992 S6J327CKULA-7992 S6J327CLSLA-7992 S6J327CLULA-7992 S6J328CKSLA-7992 S6J328CKULA-7992 S6J328CLSLA-7992 S6J328CLULA-7992 S6J32AAKSLA-7992 S6J32AAKU
Module CPU TRACE
ARM-ETM Trace 147 ©1989-2019 Lauterbach GmbH
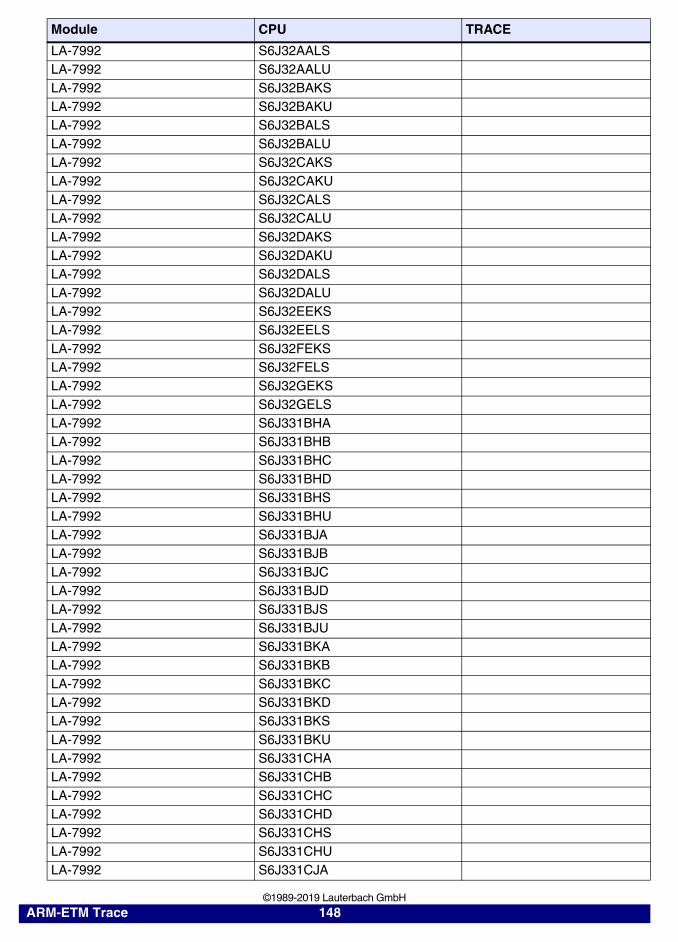
LA-7992 S6J32AALSLA-7992 S6J32AALULA-7992 S6J32BAKSLA-7992 S6J32BAKULA-7992 S6J32BALSLA-7992 S6J32BALULA-7992 S6J32CAKSLA-7992 S6J32CAKULA-7992 S6J32CALSLA-7992 S6J32CALULA-7992 S6J32DAKSLA-7992 S6J32DAKULA-7992 S6J32DALSLA-7992 S6J32DALULA-7992 S6J32EEKSLA-7992 S6J32EELSLA-7992 S6J32FEKSLA-7992 S6J32FELSLA-7992 S6J32GEKSLA-7992 S6J32GELSLA-7992 S6J331BHALA-7992 S6J331BHBLA-7992 S6J331BHCLA-7992 S6J331BHDLA-7992 S6J331BHSLA-7992 S6J331BHULA-7992 S6J331BJALA-7992 S6J331BJBLA-7992 S6J331BJCLA-7992 S6J331BJDLA-7992 S6J331BJSLA-7992 S6J331BJULA-7992 S6J331BKALA-7992 S6J331BKBLA-7992 S6J331BKCLA-7992 S6J331BKDLA-7992 S6J331BKSLA-7992 S6J331BKULA-7992 S6J331CHALA-7992 S6J331CHBLA-7992 S6J331CHCLA-7992 S6J331CHDLA-7992 S6J331CHSLA-7992 S6J331CHULA-7992 S6J331CJA
Module CPU TRACE
ARM-ETM Trace 148 ©1989-2019 Lauterbach GmbH

LA-7992 S6J331CJBLA-7992 S6J331CJCLA-7992 S6J331CJDLA-7992 S6J331CJSLA-7992 S6J331CJULA-7992 S6J331CKALA-7992 S6J331CKBLA-7992 S6J331CKCLA-7992 S6J331CKDLA-7992 S6J331CKSLA-7992 S6J331CKULA-7992 S6J331DHALA-7992 S6J331DHBLA-7992 S6J331DHCLA-7992 S6J331DHDLA-7992 S6J331DHSLA-7992 S6J331DHULA-7992 S6J331DJALA-7992 S6J331DJBLA-7992 S6J331DJCLA-7992 S6J331DJDLA-7992 S6J331DJSLA-7992 S6J331DJULA-7992 S6J331DKALA-7992 S6J331DKBLA-7992 S6J331DKCLA-7992 S6J331DKDLA-7992 S6J331DKSLA-7992 S6J331DKULA-7992 S6J331EHALA-7992 S6J331EHBLA-7992 S6J331EHCLA-7992 S6J331EHDLA-7992 S6J331EHSLA-7992 S6J331EHULA-7992 S6J331EJALA-7992 S6J331EJBLA-7992 S6J331EJCLA-7992 S6J331EJDLA-7992 S6J331EJSLA-7992 S6J331EJULA-7992 S6J331EKALA-7992 S6J331EKBLA-7992 S6J331EKCLA-7992 S6J331EKD
Module CPU TRACE
ARM-ETM Trace 149 ©1989-2019 Lauterbach GmbH

LA-7992 S6J331EKSLA-7992 S6J331EKULA-7992 S6J332BHALA-7992 S6J332BHBLA-7992 S6J332BHCLA-7992 S6J332BHDLA-7992 S6J332BHSLA-7992 S6J332BHULA-7992 S6J332BJALA-7992 S6J332BJBLA-7992 S6J332BJCLA-7992 S6J332BJDLA-7992 S6J332BJSLA-7992 S6J332BJULA-7992 S6J332BKALA-7992 S6J332BKBLA-7992 S6J332BKCLA-7992 S6J332BKDLA-7992 S6J332BKSLA-7992 S6J332BKULA-7992 S6J332CHALA-7992 S6J332CHBLA-7992 S6J332CHCLA-7992 S6J332CHDLA-7992 S6J332CHSLA-7992 S6J332CHULA-7992 S6J332CJALA-7992 S6J332CJBLA-7992 S6J332CJCLA-7992 S6J332CJDLA-7992 S6J332CJSLA-7992 S6J332CJULA-7992 S6J332CKALA-7992 S6J332CKBLA-7992 S6J332CKCLA-7992 S6J332CKDLA-7992 S6J332CKSLA-7992 S6J332CKULA-7992 S6J332DHALA-7992 S6J332DHBLA-7992 S6J332DHCLA-7992 S6J332DHDLA-7992 S6J332DHSLA-7992 S6J332DHULA-7992 S6J332DJA
Module CPU TRACE
ARM-ETM Trace 150 ©1989-2019 Lauterbach GmbH

LA-7992 S6J332DJBLA-7992 S6J332DJCLA-7992 S6J332DJDLA-7992 S6J332DJSLA-7992 S6J332DJULA-7992 S6J332DKALA-7992 S6J332DKBLA-7992 S6J332DKCLA-7992 S6J332DKDLA-7992 S6J332DKSLA-7992 S6J332DKULA-7992 S6J332EHALA-7992 S6J332EHBLA-7992 S6J332EHCLA-7992 S6J332EHDLA-7992 S6J332EHSLA-7992 S6J332EHULA-7992 S6J332EJALA-7992 S6J332EJBLA-7992 S6J332EJCLA-7992 S6J332EJDLA-7992 S6J332EJSLA-7992 S6J332EJULA-7992 S6J332EKALA-7992 S6J332EKBLA-7992 S6J332EKCLA-7992 S6J332EKDLA-7992 S6J332EKSLA-7992 S6J332EKULA-7992 S6J333BHALA-7992 S6J333BHBLA-7992 S6J333BHCLA-7992 S6J333BHDLA-7992 S6J333BHSLA-7992 S6J333BHULA-7992 S6J333BJALA-7992 S6J333BJBLA-7992 S6J333BJCLA-7992 S6J333BJDLA-7992 S6J333BJSLA-7992 S6J333BJULA-7992 S6J333BKALA-7992 S6J333BKBLA-7992 S6J333BKCLA-7992 S6J333BKD
Module CPU TRACE
ARM-ETM Trace 151 ©1989-2019 Lauterbach GmbH
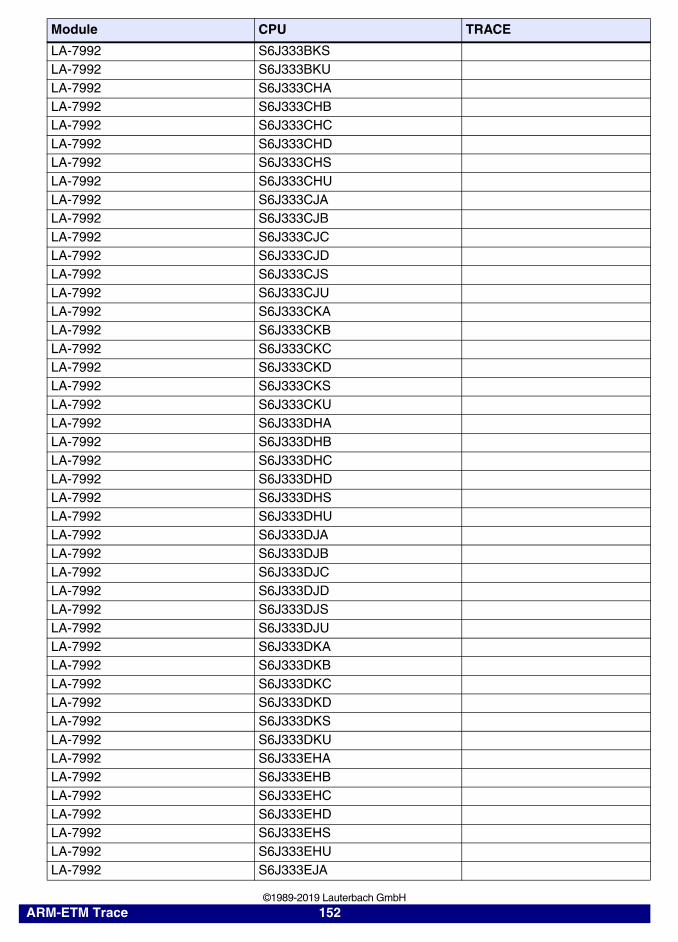
LA-7992 S6J333BKSLA-7992 S6J333BKULA-7992 S6J333CHALA-7992 S6J333CHBLA-7992 S6J333CHCLA-7992 S6J333CHDLA-7992 S6J333CHSLA-7992 S6J333CHULA-7992 S6J333CJALA-7992 S6J333CJBLA-7992 S6J333CJCLA-7992 S6J333CJDLA-7992 S6J333CJSLA-7992 S6J333CJULA-7992 S6J333CKALA-7992 S6J333CKBLA-7992 S6J333CKCLA-7992 S6J333CKDLA-7992 S6J333CKSLA-7992 S6J333CKULA-7992 S6J333DHALA-7992 S6J333DHBLA-7992 S6J333DHCLA-7992 S6J333DHDLA-7992 S6J333DHSLA-7992 S6J333DHULA-7992 S6J333DJALA-7992 S6J333DJBLA-7992 S6J333DJCLA-7992 S6J333DJDLA-7992 S6J333DJSLA-7992 S6J333DJULA-7992 S6J333DKALA-7992 S6J333DKBLA-7992 S6J333DKCLA-7992 S6J333DKDLA-7992 S6J333DKSLA-7992 S6J333DKULA-7992 S6J333EHALA-7992 S6J333EHBLA-7992 S6J333EHCLA-7992 S6J333EHDLA-7992 S6J333EHSLA-7992 S6J333EHULA-7992 S6J333EJA
Module CPU TRACE
ARM-ETM Trace 152 ©1989-2019 Lauterbach GmbH

LA-7992 S6J333EJBLA-7992 S6J333EJCLA-7992 S6J333EJDLA-7992 S6J333EJSLA-7992 S6J333EJULA-7992 S6J333EKALA-7992 S6J333EKBLA-7992 S6J333EKCLA-7992 S6J333EKDLA-7992 S6J333EKSLA-7992 S6J333EKULA-7992 S6J334BHALA-7992 S6J334BHBLA-7992 S6J334BHCLA-7992 S6J334BHDLA-7992 S6J334BHSLA-7992 S6J334BHULA-7992 S6J334BJALA-7992 S6J334BJBLA-7992 S6J334BJCLA-7992 S6J334BJDLA-7992 S6J334BJSLA-7992 S6J334BJULA-7992 S6J334BKALA-7992 S6J334BKBLA-7992 S6J334BKCLA-7992 S6J334BKDLA-7992 S6J334BKSLA-7992 S6J334BKULA-7992 S6J334CHALA-7992 S6J334CHBLA-7992 S6J334CHCLA-7992 S6J334CHDLA-7992 S6J334CHSLA-7992 S6J334CHULA-7992 S6J334CJALA-7992 S6J334CJBLA-7992 S6J334CJCLA-7992 S6J334CJDLA-7992 S6J334CJSLA-7992 S6J334CJULA-7992 S6J334CKALA-7992 S6J334CKBLA-7992 S6J334CKCLA-7992 S6J334CKD
Module CPU TRACE
ARM-ETM Trace 153 ©1989-2019 Lauterbach GmbH
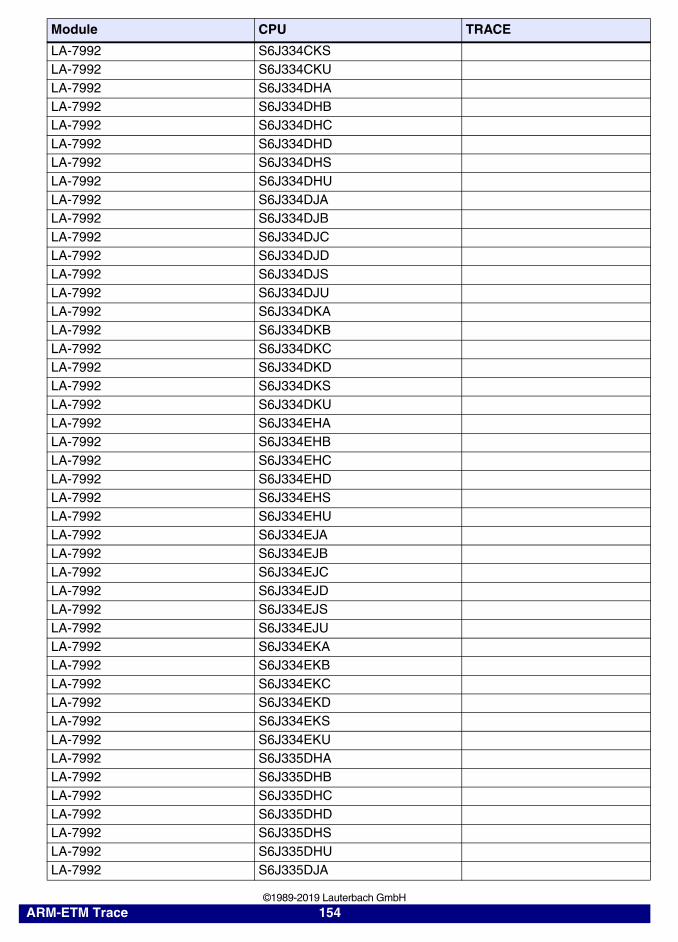
LA-7992 S6J334CKSLA-7992 S6J334CKULA-7992 S6J334DHALA-7992 S6J334DHBLA-7992 S6J334DHCLA-7992 S6J334DHDLA-7992 S6J334DHSLA-7992 S6J334DHULA-7992 S6J334DJALA-7992 S6J334DJBLA-7992 S6J334DJCLA-7992 S6J334DJDLA-7992 S6J334DJSLA-7992 S6J334DJULA-7992 S6J334DKALA-7992 S6J334DKBLA-7992 S6J334DKCLA-7992 S6J334DKDLA-7992 S6J334DKSLA-7992 S6J334DKULA-7992 S6J334EHALA-7992 S6J334EHBLA-7992 S6J334EHCLA-7992 S6J334EHDLA-7992 S6J334EHSLA-7992 S6J334EHULA-7992 S6J334EJALA-7992 S6J334EJBLA-7992 S6J334EJCLA-7992 S6J334EJDLA-7992 S6J334EJSLA-7992 S6J334EJULA-7992 S6J334EKALA-7992 S6J334EKBLA-7992 S6J334EKCLA-7992 S6J334EKDLA-7992 S6J334EKSLA-7992 S6J334EKULA-7992 S6J335DHALA-7992 S6J335DHBLA-7992 S6J335DHCLA-7992 S6J335DHDLA-7992 S6J335DHSLA-7992 S6J335DHULA-7992 S6J335DJA
Module CPU TRACE
ARM-ETM Trace 154 ©1989-2019 Lauterbach GmbH

LA-7992 S6J335DJBLA-7992 S6J335DJCLA-7992 S6J335DJDLA-7992 S6J335DJSLA-7992 S6J335DJULA-7992 S6J335DKALA-7992 S6J335DKBLA-7992 S6J335DKCLA-7992 S6J335DKDLA-7992 S6J335DKSLA-7992 S6J335DKULA-7992 S6J335EHALA-7992 S6J335EHBLA-7992 S6J335EHCLA-7992 S6J335EHDLA-7992 S6J335EHSLA-7992 S6J335EHULA-7992 S6J335EJALA-7992 S6J335EJBLA-7992 S6J335EJCLA-7992 S6J335EJDLA-7992 S6J335EJSLA-7992 S6J335EJULA-7992 S6J335EKALA-7992 S6J335EKBLA-7992 S6J335EKCLA-7992 S6J335EKDLA-7992 S6J335EKSLA-7992 S6J335EKULA-7992 S6J336AHALA-7992 S6J336AHELA-7992 S6J336AHSLA-7992 S6J336AHTLA-7992 S6J336AJALA-7992 S6J336AJELA-7992 S6J336AJSLA-7992 S6J336AJTLA-7992 S6J336CHALA-7992 S6J336CHSLA-7992 S6J336CHTLA-7992 S6J336CJALA-7992 S6J336CJELA-7992 S6J336CJSLA-7992 S6J336CJTLA-7992 S6J337AHT
Module CPU TRACE
ARM-ETM Trace 155 ©1989-2019 Lauterbach GmbH
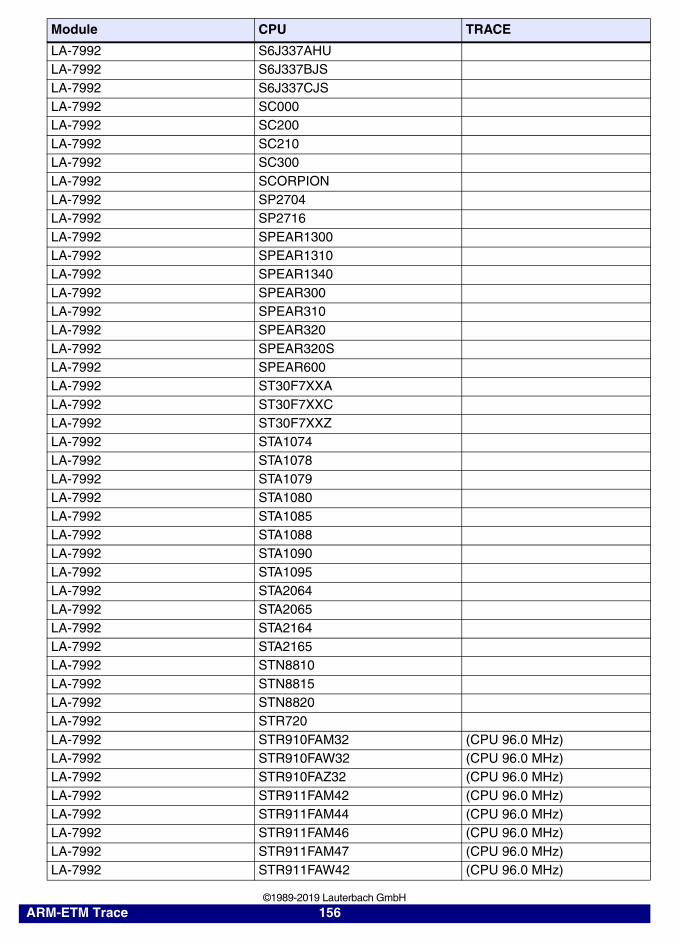
LA-7992 S6J337AHULA-7992 S6J337BJSLA-7992 S6J337CJSLA-7992 SC000LA-7992 SC200LA-7992 SC210LA-7992 SC300LA-7992 SCORPIONLA-7992 SP2704LA-7992 SP2716LA-7992 SPEAR1300LA-7992 SPEAR1310LA-7992 SPEAR1340LA-7992 SPEAR300LA-7992 SPEAR310LA-7992 SPEAR320LA-7992 SPEAR320SLA-7992 SPEAR600LA-7992 ST30F7XXALA-7992 ST30F7XXCLA-7992 ST30F7XXZLA-7992 STA1074LA-7992 STA1078LA-7992 STA1079LA-7992 STA1080LA-7992 STA1085LA-7992 STA1088LA-7992 STA1090LA-7992 STA1095LA-7992 STA2064LA-7992 STA2065LA-7992 STA2164LA-7992 STA2165LA-7992 STN8810LA-7992 STN8815LA-7992 STN8820LA-7992 STR720LA-7992 STR910FAM32 (CPU 96.0 MHz)LA-7992 STR910FAW32 (CPU 96.0 MHz)LA-7992 STR910FAZ32 (CPU 96.0 MHz)LA-7992 STR911FAM42 (CPU 96.0 MHz)LA-7992 STR911FAM44 (CPU 96.0 MHz)LA-7992 STR911FAM46 (CPU 96.0 MHz)LA-7992 STR911FAM47 (CPU 96.0 MHz)LA-7992 STR911FAW42 (CPU 96.0 MHz)
Module CPU TRACE
ARM-ETM Trace 156 ©1989-2019 Lauterbach GmbH
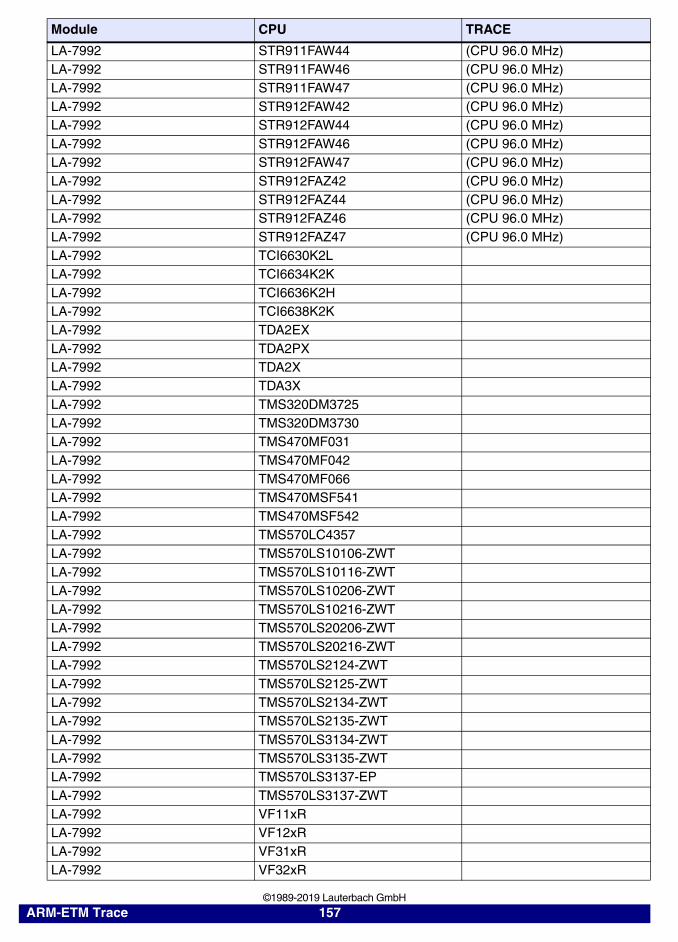
LA-7992 STR911FAW44 (CPU 96.0 MHz)LA-7992 STR911FAW46 (CPU 96.0 MHz)LA-7992 STR911FAW47 (CPU 96.0 MHz)LA-7992 STR912FAW42 (CPU 96.0 MHz)LA-7992 STR912FAW44 (CPU 96.0 MHz)LA-7992 STR912FAW46 (CPU 96.0 MHz)LA-7992 STR912FAW47 (CPU 96.0 MHz)LA-7992 STR912FAZ42 (CPU 96.0 MHz)LA-7992 STR912FAZ44 (CPU 96.0 MHz)LA-7992 STR912FAZ46 (CPU 96.0 MHz)LA-7992 STR912FAZ47 (CPU 96.0 MHz)LA-7992 TCI6630K2LLA-7992 TCI6634K2KLA-7992 TCI6636K2HLA-7992 TCI6638K2KLA-7992 TDA2EXLA-7992 TDA2PXLA-7992 TDA2XLA-7992 TDA3XLA-7992 TMS320DM3725LA-7992 TMS320DM3730LA-7992 TMS470MF031LA-7992 TMS470MF042LA-7992 TMS470MF066LA-7992 TMS470MSF541LA-7992 TMS470MSF542LA-7992 TMS570LC4357LA-7992 TMS570LS10106-ZWTLA-7992 TMS570LS10116-ZWTLA-7992 TMS570LS10206-ZWTLA-7992 TMS570LS10216-ZWTLA-7992 TMS570LS20206-ZWTLA-7992 TMS570LS20216-ZWTLA-7992 TMS570LS2124-ZWTLA-7992 TMS570LS2125-ZWTLA-7992 TMS570LS2134-ZWTLA-7992 TMS570LS2135-ZWTLA-7992 TMS570LS3134-ZWTLA-7992 TMS570LS3135-ZWTLA-7992 TMS570LS3137-EPLA-7992 TMS570LS3137-ZWTLA-7992 VF11xRLA-7992 VF12xRLA-7992 VF31xRLA-7992 VF32xR
Module CPU TRACE
ARM-ETM Trace 157 ©1989-2019 Lauterbach GmbH
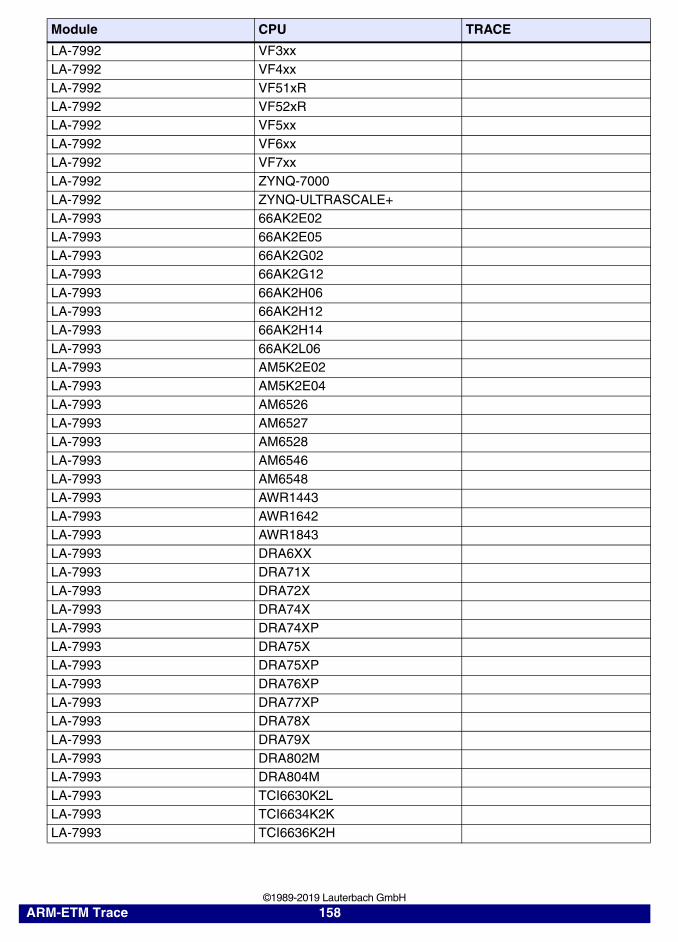
LA-7992 VF3xxLA-7992 VF4xxLA-7992 VF51xRLA-7992 VF52xRLA-7992 VF5xxLA-7992 VF6xxLA-7992 VF7xxLA-7992 ZYNQ-7000LA-7992 ZYNQ-ULTRASCALE+LA-7993 66AK2E02LA-7993 66AK2E05LA-7993 66AK2G02LA-7993 66AK2G12LA-7993 66AK2H06LA-7993 66AK2H12LA-7993 66AK2H14LA-7993 66AK2L06LA-7993 AM5K2E02LA-7993 AM5K2E04LA-7993 AM6526LA-7993 AM6527LA-7993 AM6528LA-7993 AM6546LA-7993 AM6548LA-7993 AWR1443LA-7993 AWR1642LA-7993 AWR1843LA-7993 DRA6XXLA-7993 DRA71XLA-7993 DRA72XLA-7993 DRA74XLA-7993 DRA74XPLA-7993 DRA75XLA-7993 DRA75XPLA-7993 DRA76XPLA-7993 DRA77XPLA-7993 DRA78XLA-7993 DRA79XLA-7993 DRA802MLA-7993 DRA804MLA-7993 TCI6630K2LLA-7993 TCI6634K2KLA-7993 TCI6636K2H
Module CPU TRACE
ARM-ETM Trace 158 ©1989-2019 Lauterbach GmbH
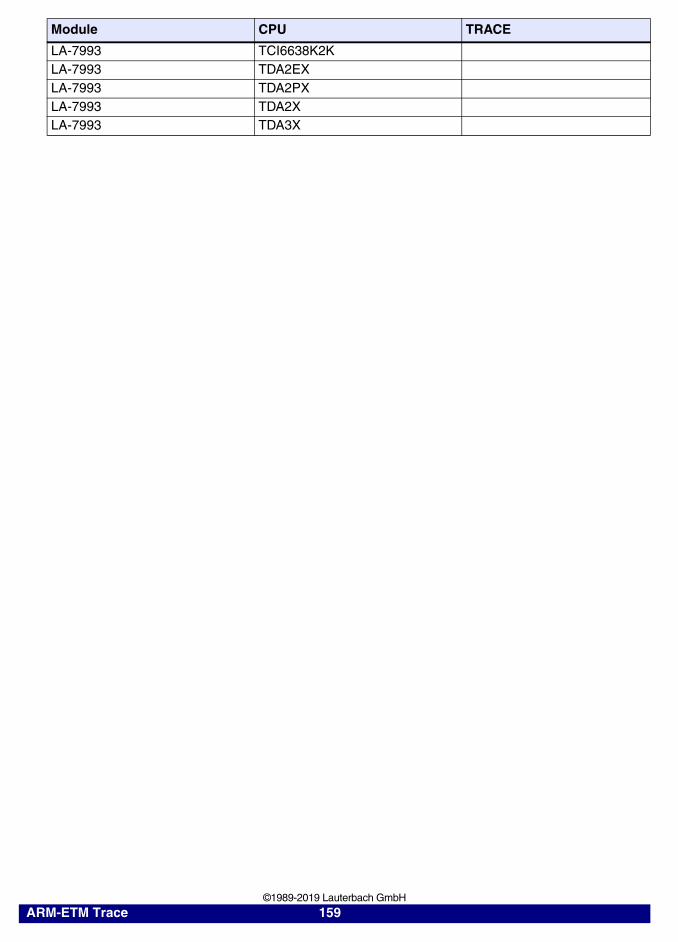
LA-7993 TCI6638K2KLA-7993 TDA2EXLA-7993 TDA2PXLA-7993 TDA2XLA-7993 TDA3X
Module CPU TRACE
ARM-ETM Trace 159 ©1989-2019 Lauterbach GmbH
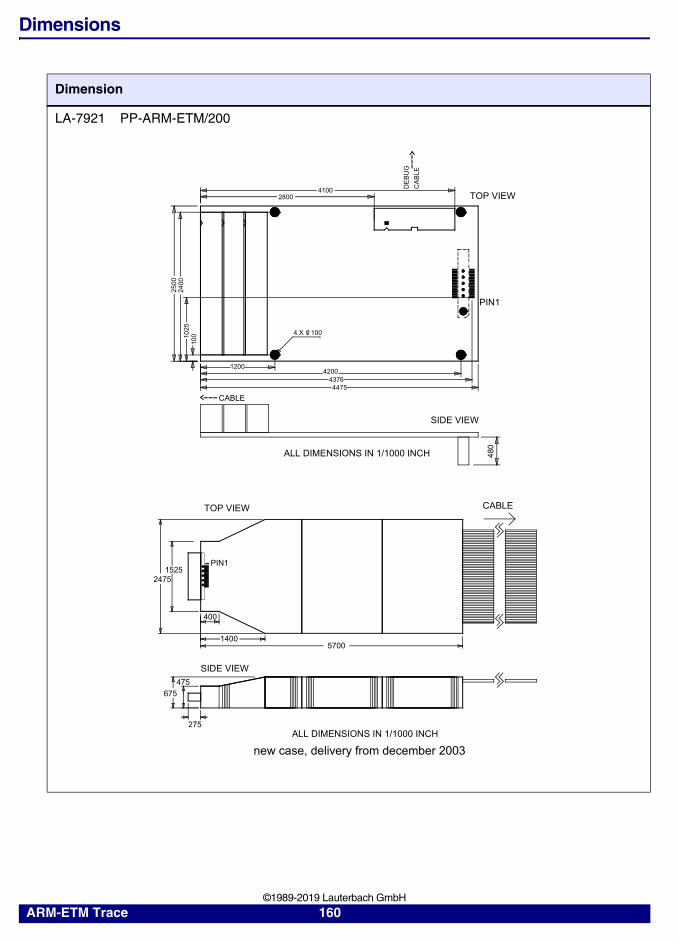
Dimensions
Dimension
LA-7921 PP-ARM-ETM/200
SIDE VIEW
480
CABLE
1200
4 X 100 0/
420043764475
10010
2524
00
2500
PIN1
TOP VIEW
DE
BU
G
CA
BLE
41002800
ALL DIMENSIONS IN 1/1000 INCH
ALL DIMENSIONS IN 1/1000 INCH
CABLE
275
675
475
SIDE VIEW
57001400
400
PIN1
24751525
TOP VIEW
new case, delivery from december 2003
ARM-ETM Trace 160 ©1989-2019 Lauterbach GmbH
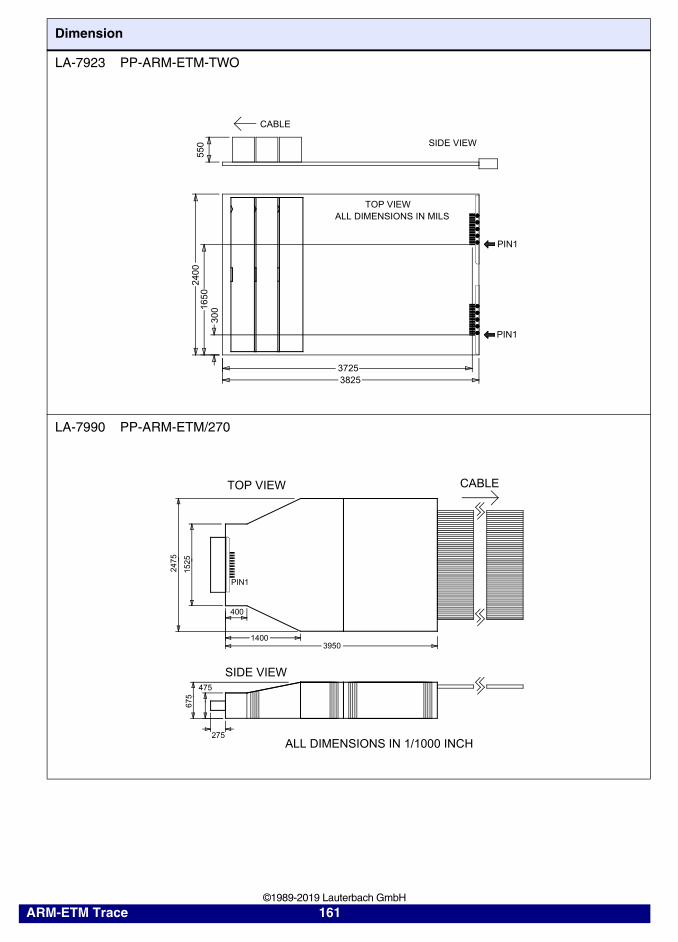
LA-7923 PP-ARM-ETM-TWO
LA-7990 PP-ARM-ETM/270
Dimension
SIDE VIEW
TOP VIEWALL DIMENSIONS IN MILS
PIN1
PIN1
37253825
30
0165
02
400
55
0
CABLE
TOP VIEW
SIDE VIEW
ALL DIMENSIONS IN 1/1000 INCH
CABLE
275
675
475
39501400
400
PIN1
24
75
152
5
ARM-ETM Trace 161 ©1989-2019 Lauterbach GmbH
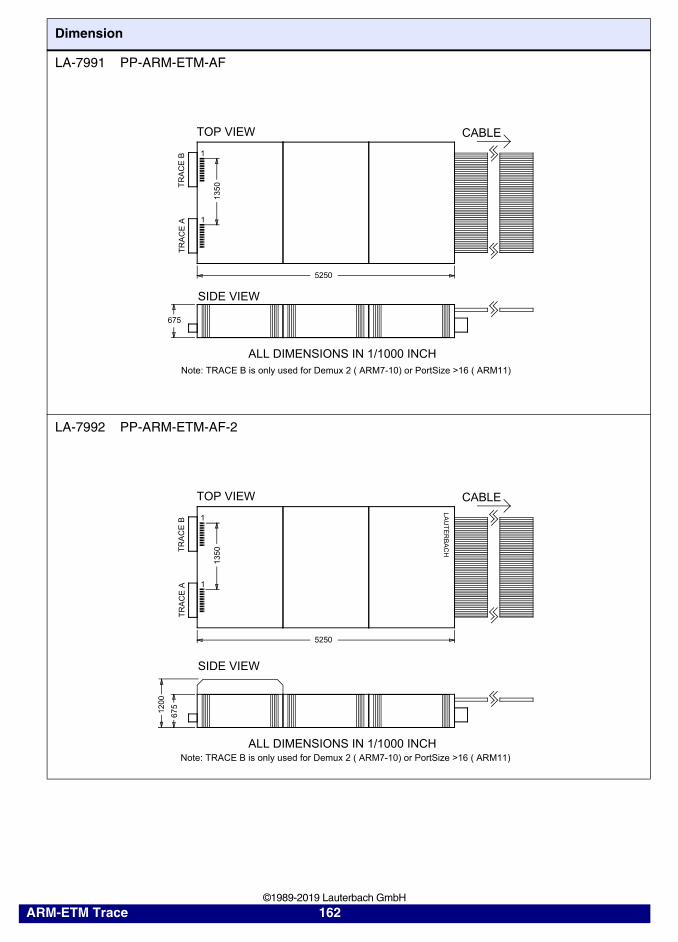
LA-7991 PP-ARM-ETM-AF
LA-7992 PP-ARM-ETM-AF-2
Dimension
SIDE VIEW
ALL DIMENSIONS IN 1/1000 INCH
TOP VIEW CABLE
135
0
5250
675
1
1
TR
AC
E A
TR
AC
E B
Note: TRACE B is only used for Demux 2 ( ARM7-10) or PortSize >16 ( ARM11)
SIDE VIEW
ALL DIMENSIONS IN 1/1000 INCH
TOP VIEW CABLE
135
0
5250
675
1
1
TR
AC
E A
TR
AC
E B
LAU
TE
RB
AC
H
1200
Note: TRACE B is only used for Demux 2 ( ARM7-10) or PortSize >16 ( ARM11)
ARM-ETM Trace 162 ©1989-2019 Lauterbach GmbH
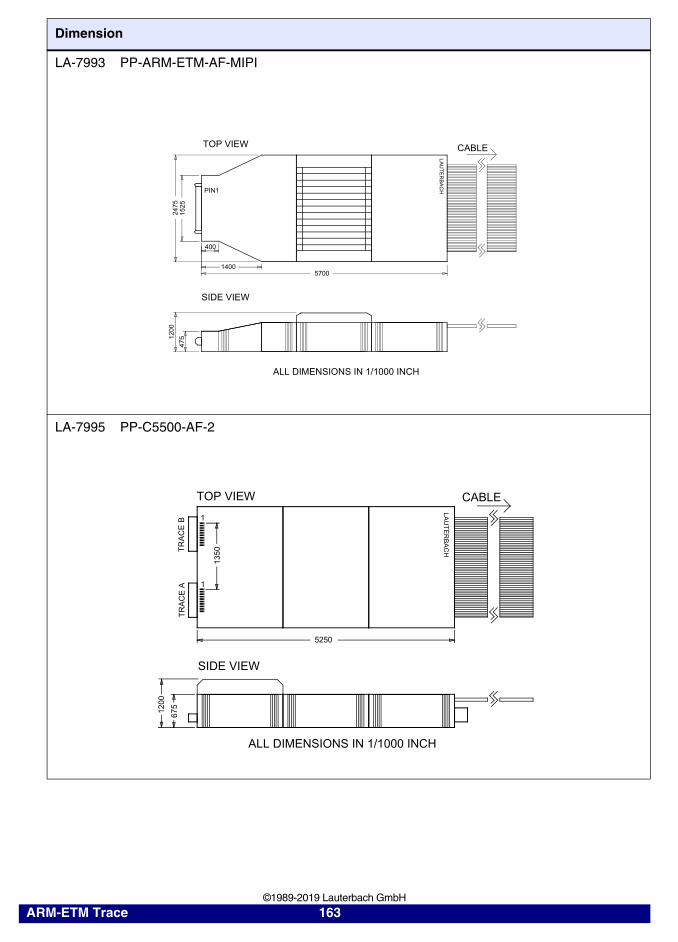
LA-7993 PP-ARM-ETM-AF-MIPI
LA-7995 PP-C5500-AF-2
Dimension
120
0
475
1400
400
PIN115
2524
75
5700
TOP VIEW CABLE
ALL DIMENSIONS IN 1/1000 INCH
SIDE VIEW
LA
UT
ER
BA
CH
SIDE VIEW
ALL DIMENSIONS IN 1/1000 INCH
TOP VIEW CABLE
135
0
5250
675
1
1
TR
AC
E A
TR
AC
E B
LAU
TE
RB
AC
H
1200
ARM-ETM Trace 163 ©1989-2019 Lauterbach GmbH
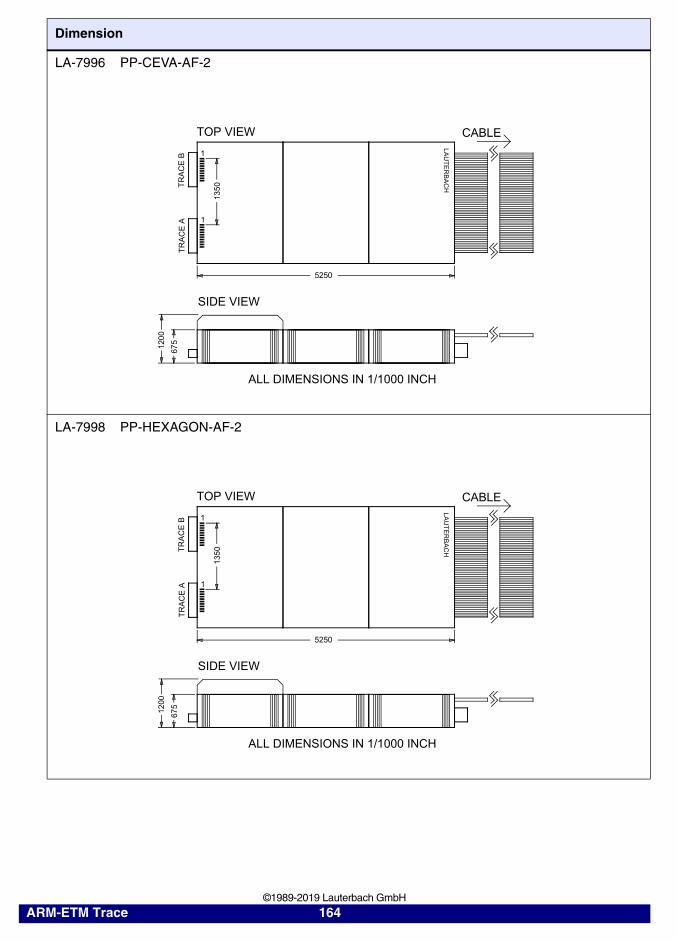
LA-7996 PP-CEVA-AF-2
LA-7998 PP-HEXAGON-AF-2
Dimension
SIDE VIEW
ALL DIMENSIONS IN 1/1000 INCH
TOP VIEW CABLE
135
0
5250
67
5
1
1
TR
AC
E A
TR
AC
E B
LAU
TE
RB
AC
H
120
0
SIDE VIEW
ALL DIMENSIONS IN 1/1000 INCH
TOP VIEW CABLE
135
0
5250
675
1
1
TR
AC
E A
TR
AC
E B
LAU
TE
RB
AC
H
1200
ARM-ETM Trace 164 ©1989-2019 Lauterbach GmbH
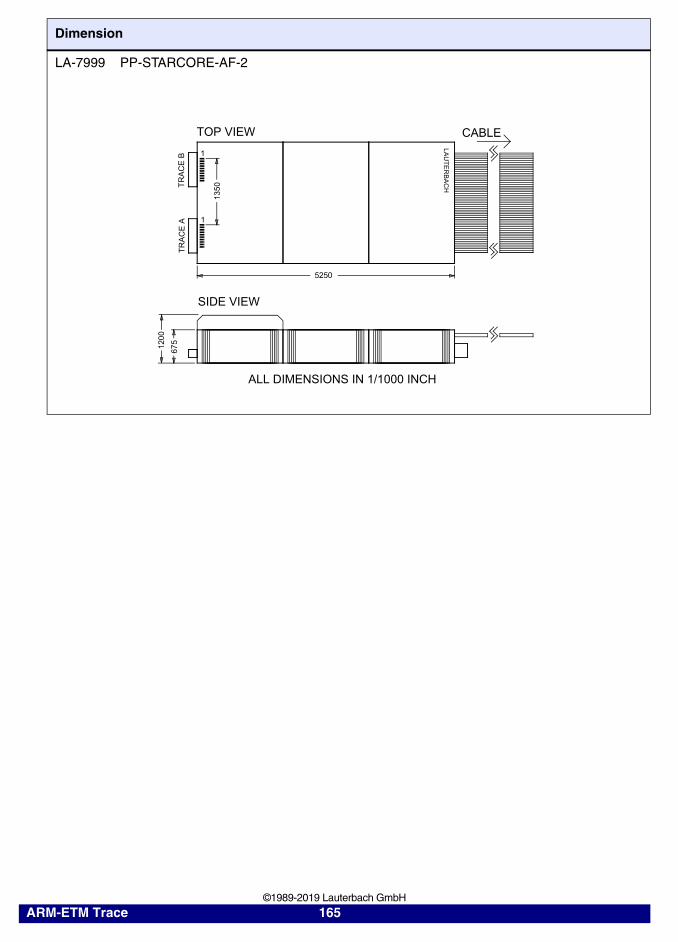
LA-7999 PP-STARCORE-AF-2
Dimension
SIDE VIEW
ALL DIMENSIONS IN 1/1000 INCH
TOP VIEW CABLE
135
0
5250
67
5
1
1
TR
AC
E A
TR
AC
E B
LAU
TE
RB
AC
H
120
0
ARM-ETM Trace 165 ©1989-2019 Lauterbach GmbH
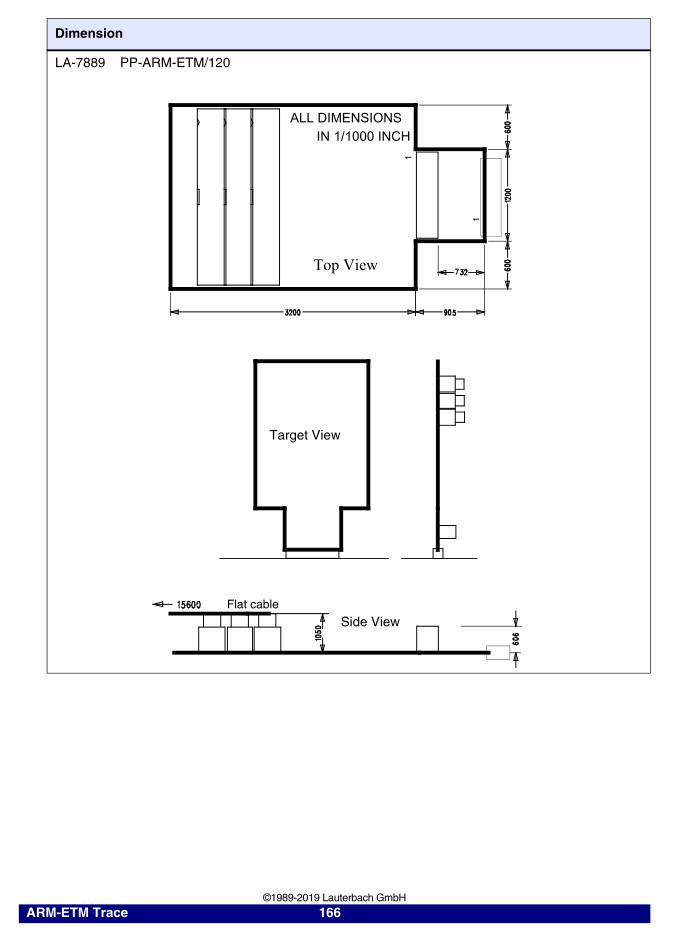
LA-7889 PP-ARM-ETM/120
Dimension
Top View
ALL DIMENSIONSIN 1/1000 INCH
Target View
Side ViewFlat cable
ARM-ETM Trace 166 ©1989-2019 Lauterbach GmbH
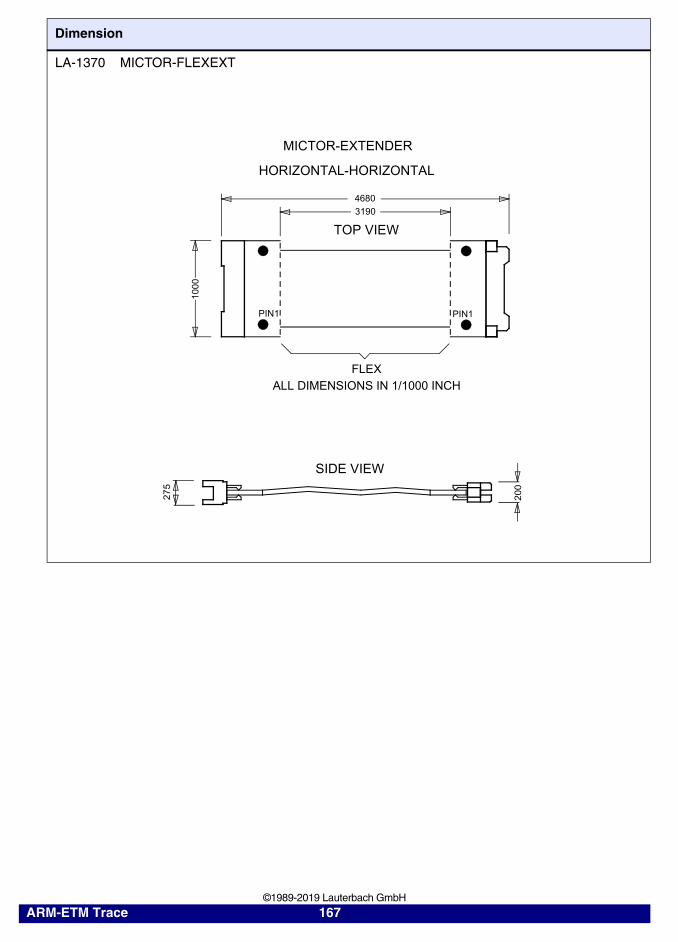
LA-1370 MICTOR-FLEXEXT
Dimension
4680
3190
TOP VIEW
PIN1 PIN1
FLEX
100
0
MICTOR-EXTENDER
HORIZONTAL-HORIZONTAL
ALL DIMENSIONS IN 1/1000 INCH
SIDE VIEW
27
5
200
ARM-ETM Trace 167 ©1989-2019 Lauterbach GmbH
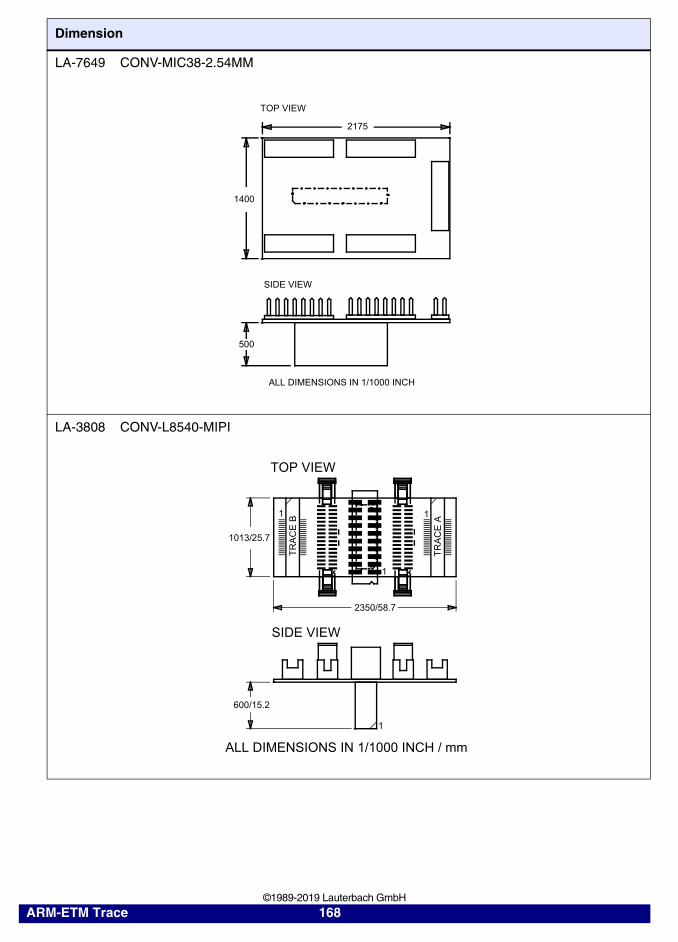
LA-7649 CONV-MIC38-2.54MM
LA-3808 CONV-L8540-MIPI
Dimension
SIDE VIEW
TOP VIEW
2175
1400
500
ALL DIMENSIONS IN 1/1000 INCH
ALL DIMENSIONS IN 1/1000 INCH / mm
600/15.2
2350/58.7
1013/25.7
1 1
1
1
TR
AC
E B
TR
AC
E A
TOP VIEW
SIDE VIEW
ARM-ETM Trace 168 ©1989-2019 Lauterbach GmbH
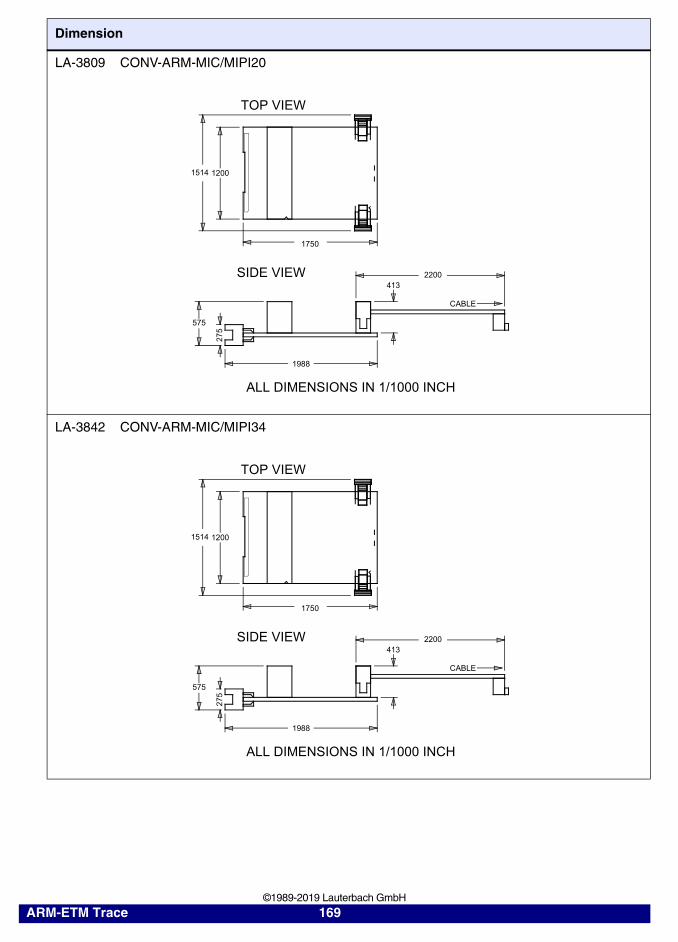
LA-3809 CONV-ARM-MIC/MIPI20
LA-3842 CONV-ARM-MIC/MIPI34
Dimension
TOP VIEW
SIDE VIEW
ALL DIMENSIONS IN 1/1000 INCH
2200413
CABLE
1750
12001514
1988
575
275
TOP VIEW
SIDE VIEW
ALL DIMENSIONS IN 1/1000 INCH
2200413
CABLE
1750
12001514
1988
575
275
ARM-ETM Trace 169 ©1989-2019 Lauterbach GmbH
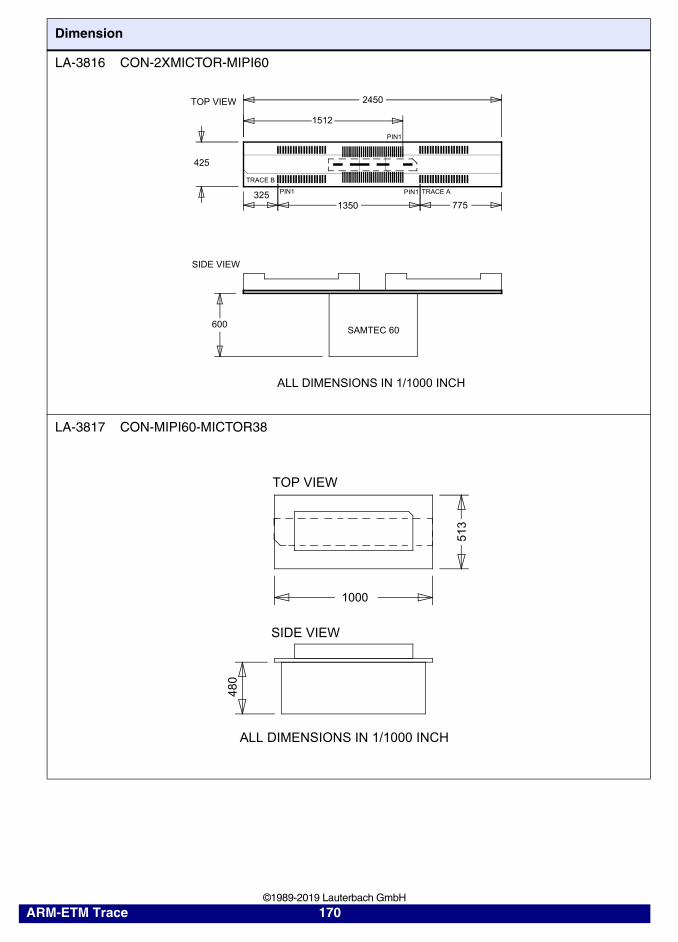
LA-3816 CON-2XMICTOR-MIPI60
LA-3817 CON-MIPI60-MICTOR38
Dimension
TOP VIEW
SIDE VIEW
SAMTEC 60600
425
2450
1512
1350 775325
ALL DIMENSIONS IN 1/1000 INCH
PIN1
TRACE B
TRACE APIN1 PIN1
1000
513
480
TOP VIEW
SIDE VIEW
ALL DIMENSIONS IN 1/1000 INCH
ARM-ETM Trace 170 ©1989-2019 Lauterbach GmbH
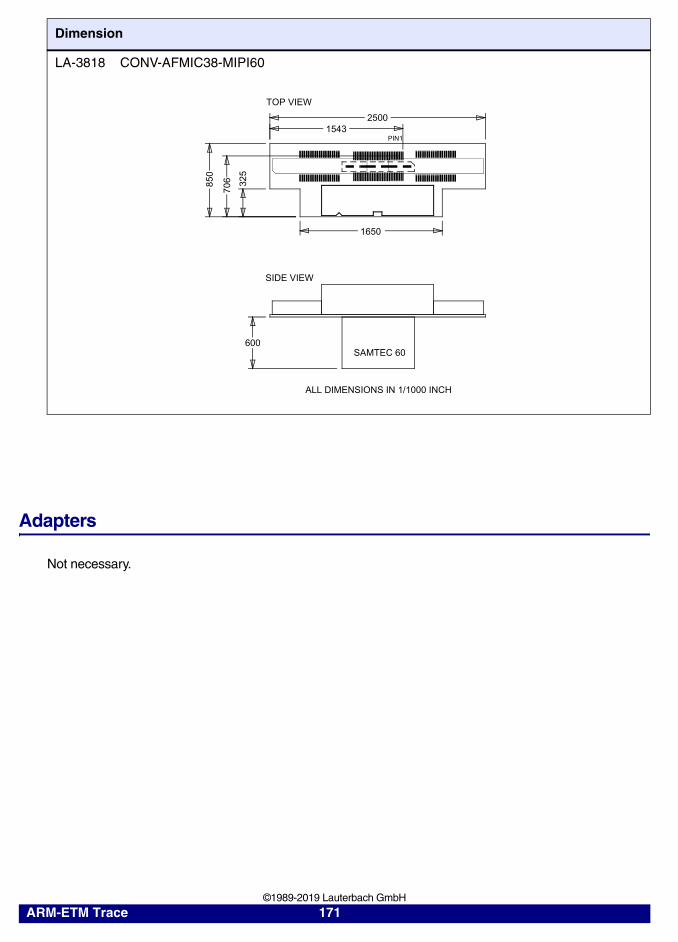
Adapters
Not necessary.
LA-3818 CONV-AFMIC38-MIPI60
Dimension
25001543
1650
SAMTEC 60600
SIDE VIEW
TOP VIEW
85
0
70
6 325
PIN1
ALL DIMENSIONS IN 1/1000 INCH
ARM-ETM Trace 171 ©1989-2019 Lauterbach GmbH
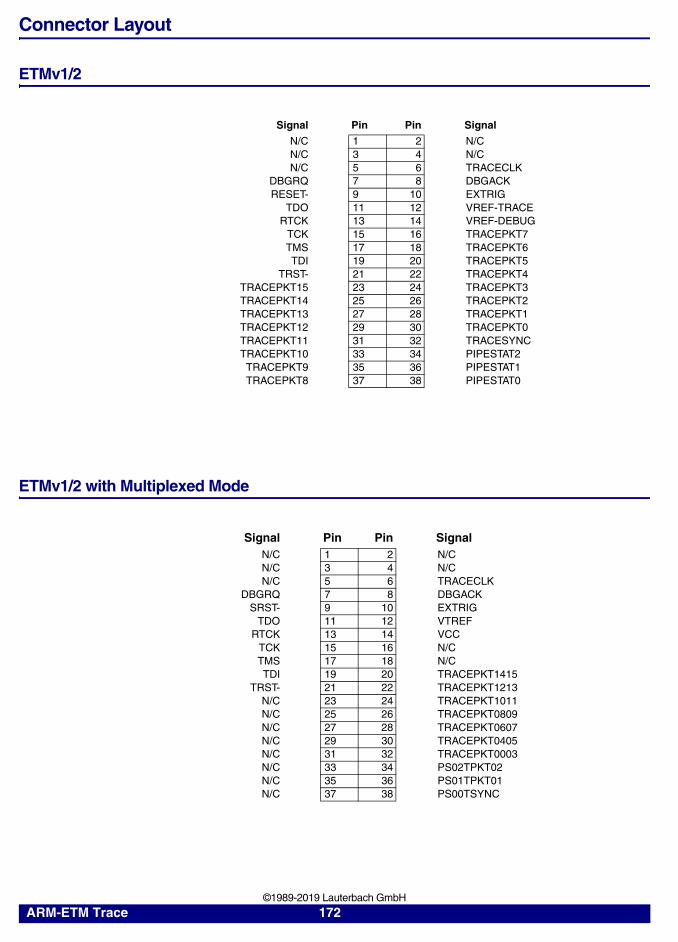
Connector Layout
ETMv1/2
ETMv1/2 with Multiplexed Mode
Signal Pin Pin Signal
N/C 1 2 N/CN/C 3 4 N/CN/C 5 6 TRACECLK
DBGRQ 7 8 DBGACKRESET- 9 10 EXTRIG
TDO 11 12 VREF-TRACERTCK 13 14 VREF-DEBUG
TCK 15 16 TRACEPKT7TMS 17 18 TRACEPKT6TDI 19 20 TRACEPKT5
TRST- 21 22 TRACEPKT4TRACEPKT15 23 24 TRACEPKT3TRACEPKT14 25 26 TRACEPKT2TRACEPKT13 27 28 TRACEPKT1TRACEPKT12 29 30 TRACEPKT0TRACEPKT11 31 32 TRACESYNCTRACEPKT10 33 34 PIPESTAT2
TRACEPKT9 35 36 PIPESTAT1TRACEPKT8 37 38 PIPESTAT0
Signal Pin Pin SignalN/C 1 2 N/CN/C 3 4 N/CN/C 5 6 TRACECLK
DBGRQ 7 8 DBGACKSRST- 9 10 EXTRIG
TDO 11 12 VTREFRTCK 13 14 VCC
TCK 15 16 N/CTMS 17 18 N/CTDI 19 20 TRACEPKT1415
TRST- 21 22 TRACEPKT1213N/C 23 24 TRACEPKT1011N/C 25 26 TRACEPKT0809N/C 27 28 TRACEPKT0607N/C 29 30 TRACEPKT0405N/C 31 32 TRACEPKT0003N/C 33 34 PS02TPKT02N/C 35 36 PS01TPKT01N/C 37 38 PS00TSYNC
ARM-ETM Trace 172 ©1989-2019 Lauterbach GmbH
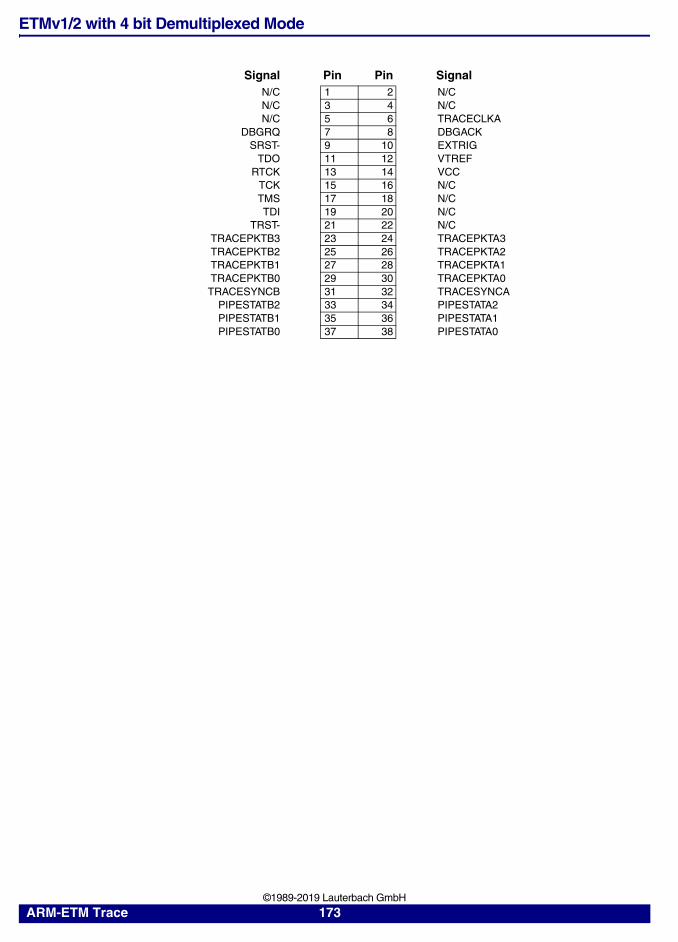
ETMv1/2 with 4 bit Demultiplexed Mode
Signal Pin Pin SignalN/C 1 2 N/CN/C 3 4 N/CN/C 5 6 TRACECLKA
DBGRQ 7 8 DBGACKSRST- 9 10 EXTRIG
TDO 11 12 VTREFRTCK 13 14 VCC
TCK 15 16 N/CTMS 17 18 N/CTDI 19 20 N/C
TRST- 21 22 N/CTRACEPKTB3 23 24 TRACEPKTA3TRACEPKTB2 25 26 TRACEPKTA2TRACEPKTB1 27 28 TRACEPKTA1TRACEPKTB0 29 30 TRACEPKTA0
TRACESYNCB 31 32 TRACESYNCAPIPESTATB2 33 34 PIPESTATA2PIPESTATB1 35 36 PIPESTATA1PIPESTATB0 37 38 PIPESTATA0
ARM-ETM Trace 173 ©1989-2019 Lauterbach GmbH
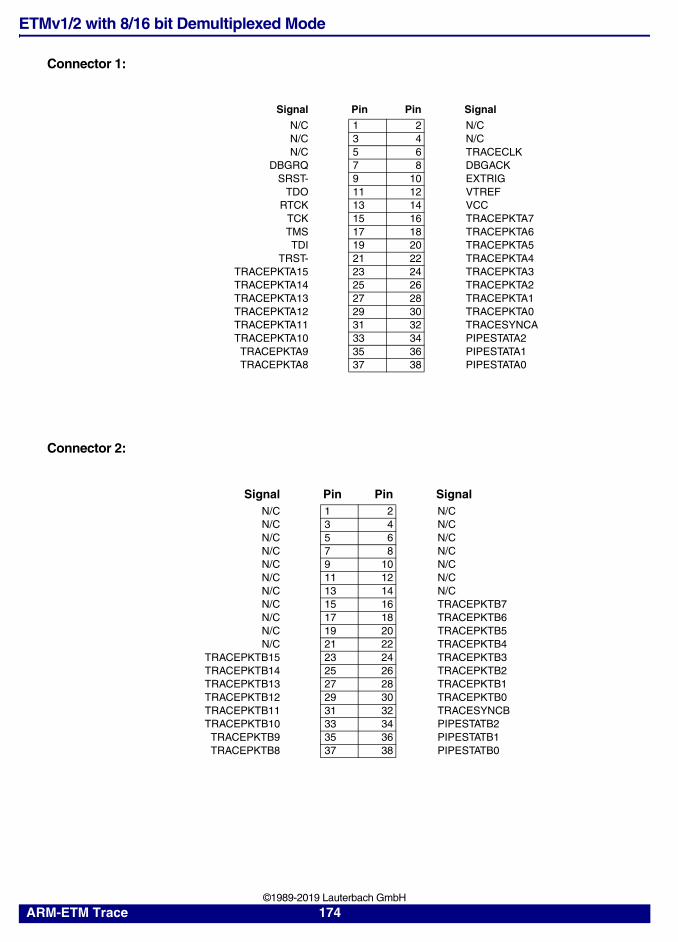
ETMv1/2 with 8/16 bit Demultiplexed Mode
Connector 1:
Connector 2:
Signal Pin Pin Signal
N/C 1 2 N/CN/C 3 4 N/CN/C 5 6 TRACECLK
DBGRQ 7 8 DBGACKSRST- 9 10 EXTRIG
TDO 11 12 VTREFRTCK 13 14 VCC
TCK 15 16 TRACEPKTA7TMS 17 18 TRACEPKTA6TDI 19 20 TRACEPKTA5
TRST- 21 22 TRACEPKTA4TRACEPKTA15 23 24 TRACEPKTA3TRACEPKTA14 25 26 TRACEPKTA2TRACEPKTA13 27 28 TRACEPKTA1TRACEPKTA12 29 30 TRACEPKTA0TRACEPKTA11 31 32 TRACESYNCATRACEPKTA10 33 34 PIPESTATA2
TRACEPKTA9 35 36 PIPESTATA1TRACEPKTA8 37 38 PIPESTATA0
Signal Pin Pin SignalN/C 1 2 N/CN/C 3 4 N/CN/C 5 6 N/CN/C 7 8 N/CN/C 9 10 N/CN/C 11 12 N/CN/C 13 14 N/CN/C 15 16 TRACEPKTB7N/C 17 18 TRACEPKTB6N/C 19 20 TRACEPKTB5N/C 21 22 TRACEPKTB4
TRACEPKTB15 23 24 TRACEPKTB3TRACEPKTB14 25 26 TRACEPKTB2TRACEPKTB13 27 28 TRACEPKTB1TRACEPKTB12 29 30 TRACEPKTB0TRACEPKTB11 31 32 TRACESYNCBTRACEPKTB10 33 34 PIPESTATB2
TRACEPKTB9 35 36 PIPESTATB1TRACEPKTB8 37 38 PIPESTATB0
ARM-ETM Trace 174 ©1989-2019 Lauterbach GmbH

Dual ETMv1/2
Signal Pin Pin SignalN/C 1 2 N/CN/C 3 4 N/C
TRACECLKB 5 6 TRACECLKADBGRQ 7 8 DBGACK
SRST- 9 10 EXTRIGTDO 11 12 VTREF
RTCK 13 14 VCCTCK 15 16 ATRACEPKT7TMS 17 18 ATRACEPKT6TDI 19 20 ATRACEPKT5
TRST- 21 22 ATRACEPKT4BTRACEPKT3 23 24 ATRACEPKT3BTRACEPKT2 25 26 ATRACEPKT2BTRACEPKT1 27 28 ATRACEPKT1BTRACEPKT0 29 30 ATRACEPKT0
BTRACESYNC 31 32 ATRACESYNCBPIPESTAT2 33 34 APIPESTAT2BPIPESTAT1 35 36 APIPESTAT1BPIPESTAT0 37 38 APIPESTAT0
ARM-ETM Trace 175 ©1989-2019 Lauterbach GmbH
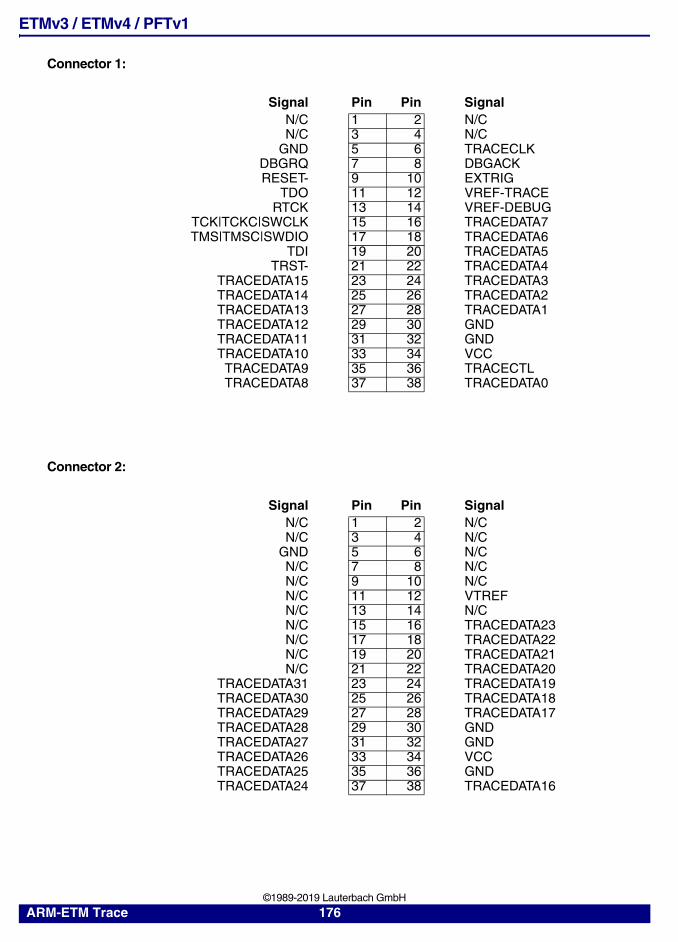
ETMv3 / ETMv4 / PFTv1
Connector 1:
Connector 2:
Signal Pin Pin SignalN/C 1 2 N/CN/C 3 4 N/C
GND 5 6 TRACECLKDBGRQ 7 8 DBGACKRESET- 9 10 EXTRIG
TDO 11 12 VREF-TRACERTCK 13 14 VREF-DEBUG
TCK|TCKC|SWCLK 15 16 TRACEDATA7TMS|TMSC|SWDIO 17 18 TRACEDATA6
TDI 19 20 TRACEDATA5TRST- 21 22 TRACEDATA4
TRACEDATA15 23 24 TRACEDATA3TRACEDATA14 25 26 TRACEDATA2TRACEDATA13 27 28 TRACEDATA1TRACEDATA12 29 30 GNDTRACEDATA11 31 32 GNDTRACEDATA10 33 34 VCC
TRACEDATA9 35 36 TRACECTLTRACEDATA8 37 38 TRACEDATA0
Signal Pin Pin SignalN/C 1 2 N/CN/C 3 4 N/C
GND 5 6 N/CN/C 7 8 N/CN/C 9 10 N/CN/C 11 12 VTREFN/C 13 14 N/CN/C 15 16 TRACEDATA23N/C 17 18 TRACEDATA22N/C 19 20 TRACEDATA21N/C 21 22 TRACEDATA20
TRACEDATA31 23 24 TRACEDATA19TRACEDATA30 25 26 TRACEDATA18TRACEDATA29 27 28 TRACEDATA17TRACEDATA28 29 30 GNDTRACEDATA27 31 32 GNDTRACEDATA26 33 34 VCCTRACEDATA25 35 36 GNDTRACEDATA24 37 38 TRACEDATA16
ARM-ETM Trace 176 ©1989-2019 Lauterbach GmbH

20 pin JTAG Connector
For a detailed describtion of 20-pin JTAG connector, please refer to JTAG Connection in "ARM and XSCALE Debugger" (debugger_arm.pdf).
ARM-ETM Trace 177 ©1989-2019 Lauterbach GmbH
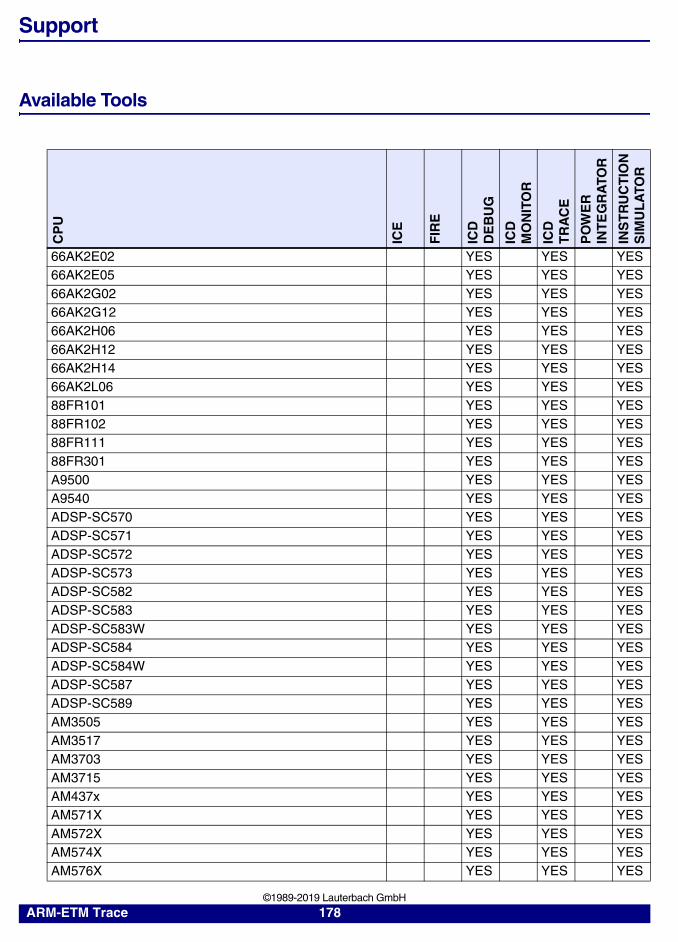
Support
Available Tools
CP
U
ICE
FIR
E
ICD
DE
BU
G
ICD
MO
NIT
OR
ICD
TR
AC
E
PO
WE
RIN
TE
GR
ATO
R
INS
TR
UC
TIO
NS
IMU
LA
TOR
66AK2E02 YES YES YES66AK2E05 YES YES YES66AK2G02 YES YES YES66AK2G12 YES YES YES66AK2H06 YES YES YES66AK2H12 YES YES YES66AK2H14 YES YES YES66AK2L06 YES YES YES88FR101 YES YES YES88FR102 YES YES YES88FR111 YES YES YES88FR301 YES YES YESA9500 YES YES YESA9540 YES YES YESADSP-SC570 YES YES YESADSP-SC571 YES YES YESADSP-SC572 YES YES YESADSP-SC573 YES YES YESADSP-SC582 YES YES YESADSP-SC583 YES YES YESADSP-SC583W YES YES YESADSP-SC584 YES YES YESADSP-SC584W YES YES YESADSP-SC587 YES YES YESADSP-SC589 YES YES YESAM3505 YES YES YESAM3517 YES YES YESAM3703 YES YES YESAM3715 YES YES YESAM437x YES YES YESAM571X YES YES YESAM572X YES YES YESAM574X YES YES YESAM576X YES YES YES
ARM-ETM Trace 178 ©1989-2019 Lauterbach GmbH
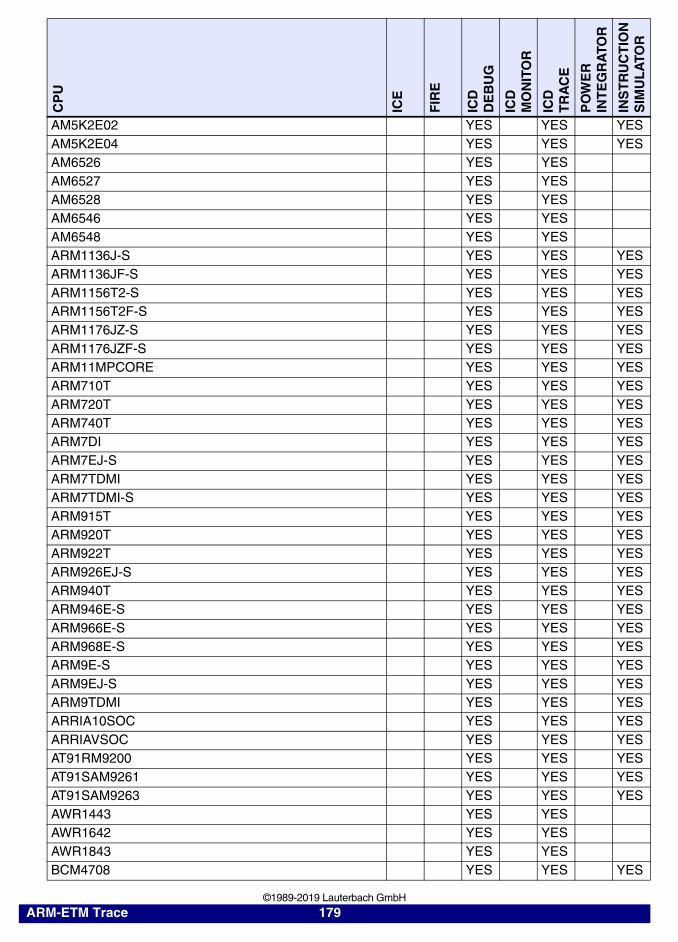
AM5K2E02 YES YES YESAM5K2E04 YES YES YESAM6526 YES YESAM6527 YES YESAM6528 YES YESAM6546 YES YESAM6548 YES YESARM1136J-S YES YES YESARM1136JF-S YES YES YESARM1156T2-S YES YES YESARM1156T2F-S YES YES YESARM1176JZ-S YES YES YESARM1176JZF-S YES YES YESARM11MPCORE YES YES YESARM710T YES YES YESARM720T YES YES YESARM740T YES YES YESARM7DI YES YES YESARM7EJ-S YES YES YESARM7TDMI YES YES YESARM7TDMI-S YES YES YESARM915T YES YES YESARM920T YES YES YESARM922T YES YES YESARM926EJ-S YES YES YESARM940T YES YES YESARM946E-S YES YES YESARM966E-S YES YES YESARM968E-S YES YES YESARM9E-S YES YES YESARM9EJ-S YES YES YESARM9TDMI YES YES YESARRIA10SOC YES YES YESARRIAVSOC YES YES YESAT91RM9200 YES YES YESAT91SAM9261 YES YES YESAT91SAM9263 YES YES YESAWR1443 YES YESAWR1642 YES YESAWR1843 YES YESBCM4708 YES YES YES
CP
U
ICE
FIR
E
ICD
DE
BU
G
ICD
MO
NIT
OR
ICD
TR
AC
E
PO
WE
RIN
TE
GR
ATO
R
INS
TR
UC
TIO
NS
IMU
LA
TOR
ARM-ETM Trace 179 ©1989-2019 Lauterbach GmbH
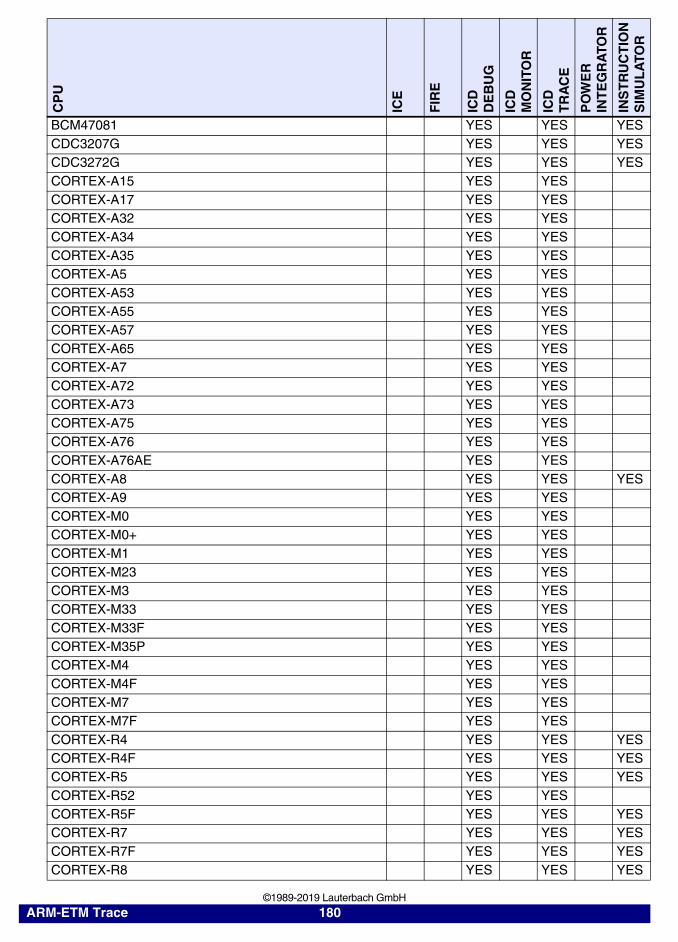
BCM47081 YES YES YESCDC3207G YES YES YESCDC3272G YES YES YESCORTEX-A15 YES YESCORTEX-A17 YES YESCORTEX-A32 YES YESCORTEX-A34 YES YESCORTEX-A35 YES YESCORTEX-A5 YES YESCORTEX-A53 YES YESCORTEX-A55 YES YESCORTEX-A57 YES YESCORTEX-A65 YES YESCORTEX-A7 YES YESCORTEX-A72 YES YESCORTEX-A73 YES YESCORTEX-A75 YES YESCORTEX-A76 YES YESCORTEX-A76AE YES YESCORTEX-A8 YES YES YESCORTEX-A9 YES YESCORTEX-M0 YES YESCORTEX-M0+ YES YESCORTEX-M1 YES YESCORTEX-M23 YES YESCORTEX-M3 YES YESCORTEX-M33 YES YESCORTEX-M33F YES YESCORTEX-M35P YES YESCORTEX-M4 YES YESCORTEX-M4F YES YESCORTEX-M7 YES YESCORTEX-M7F YES YESCORTEX-R4 YES YES YESCORTEX-R4F YES YES YESCORTEX-R5 YES YES YESCORTEX-R52 YES YESCORTEX-R5F YES YES YESCORTEX-R7 YES YES YESCORTEX-R7F YES YES YESCORTEX-R8 YES YES YES
CP
U
ICE
FIR
E
ICD
DE
BU
G
ICD
MO
NIT
OR
ICD
TR
AC
E
PO
WE
RIN
TE
GR
ATO
R
INS
TR
UC
TIO
NS
IMU
LA
TOR
ARM-ETM Trace 180 ©1989-2019 Lauterbach GmbH
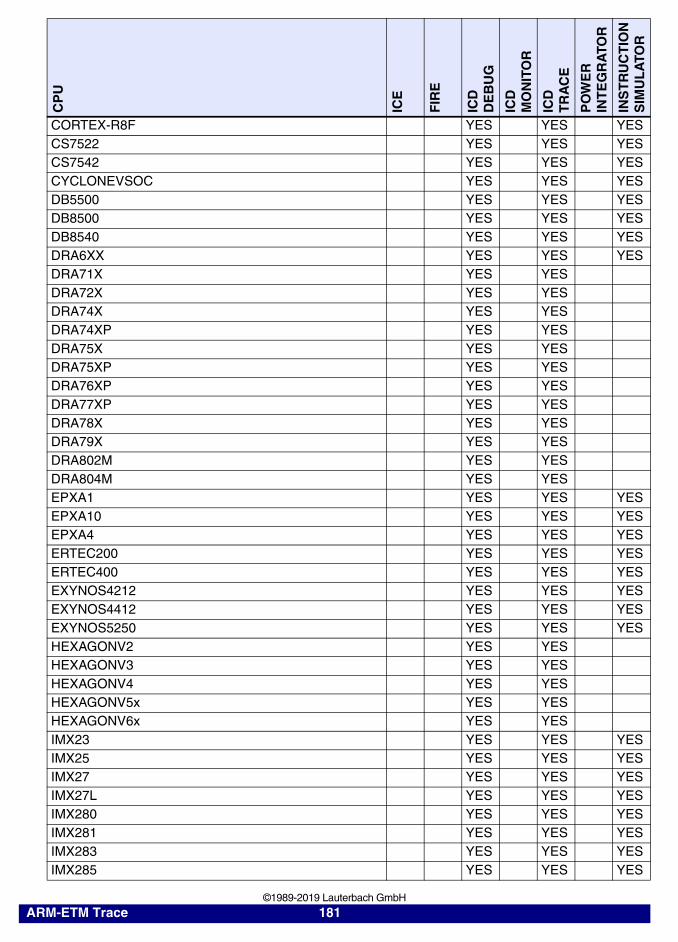
CORTEX-R8F YES YES YESCS7522 YES YES YESCS7542 YES YES YESCYCLONEVSOC YES YES YESDB5500 YES YES YESDB8500 YES YES YESDB8540 YES YES YESDRA6XX YES YES YESDRA71X YES YESDRA72X YES YESDRA74X YES YESDRA74XP YES YESDRA75X YES YESDRA75XP YES YESDRA76XP YES YESDRA77XP YES YESDRA78X YES YESDRA79X YES YESDRA802M YES YESDRA804M YES YESEPXA1 YES YES YESEPXA10 YES YES YESEPXA4 YES YES YESERTEC200 YES YES YESERTEC400 YES YES YESEXYNOS4212 YES YES YESEXYNOS4412 YES YES YESEXYNOS5250 YES YES YESHEXAGONV2 YES YESHEXAGONV3 YES YESHEXAGONV4 YES YESHEXAGONV5x YES YESHEXAGONV6x YES YESIMX23 YES YES YESIMX25 YES YES YESIMX27 YES YES YESIMX27L YES YES YESIMX280 YES YES YESIMX281 YES YES YESIMX283 YES YES YESIMX285 YES YES YES
CP
U
ICE
FIR
E
ICD
DE
BU
G
ICD
MO
NIT
OR
ICD
TR
AC
E
PO
WE
RIN
TE
GR
ATO
R
INS
TR
UC
TIO
NS
IMU
LA
TOR
ARM-ETM Trace 181 ©1989-2019 Lauterbach GmbH
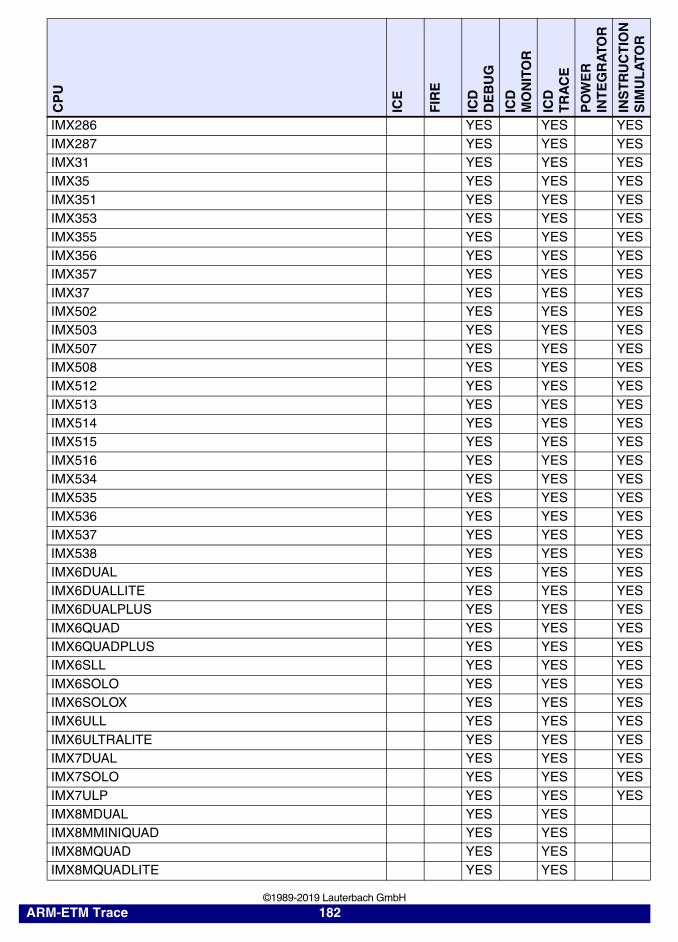
IMX286 YES YES YESIMX287 YES YES YESIMX31 YES YES YESIMX35 YES YES YESIMX351 YES YES YESIMX353 YES YES YESIMX355 YES YES YESIMX356 YES YES YESIMX357 YES YES YESIMX37 YES YES YESIMX502 YES YES YESIMX503 YES YES YESIMX507 YES YES YESIMX508 YES YES YESIMX512 YES YES YESIMX513 YES YES YESIMX514 YES YES YESIMX515 YES YES YESIMX516 YES YES YESIMX534 YES YES YESIMX535 YES YES YESIMX536 YES YES YESIMX537 YES YES YESIMX538 YES YES YESIMX6DUAL YES YES YESIMX6DUALLITE YES YES YESIMX6DUALPLUS YES YES YESIMX6QUAD YES YES YESIMX6QUADPLUS YES YES YESIMX6SLL YES YES YESIMX6SOLO YES YES YESIMX6SOLOX YES YES YESIMX6ULL YES YES YESIMX6ULTRALITE YES YES YESIMX7DUAL YES YES YESIMX7SOLO YES YES YESIMX7ULP YES YES YESIMX8MDUAL YES YESIMX8MMINIQUAD YES YESIMX8MQUAD YES YESIMX8MQUADLITE YES YES
CP
U
ICE
FIR
E
ICD
DE
BU
G
ICD
MO
NIT
OR
ICD
TR
AC
E
PO
WE
RIN
TE
GR
ATO
R
INS
TR
UC
TIO
NS
IMU
LA
TOR
ARM-ETM Trace 182 ©1989-2019 Lauterbach GmbH
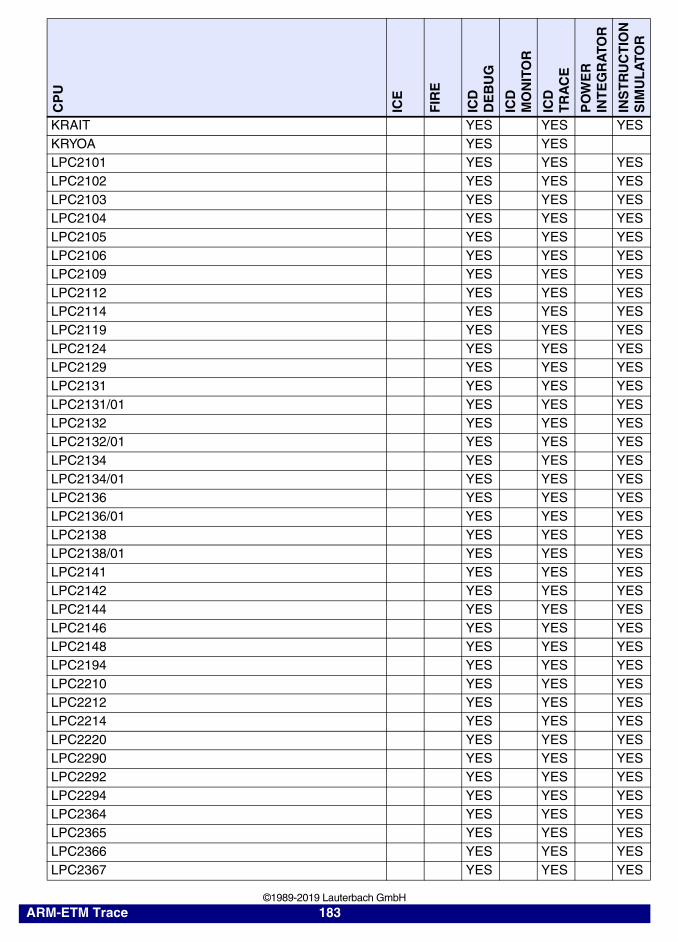
KRAIT YES YES YESKRYOA YES YESLPC2101 YES YES YESLPC2102 YES YES YESLPC2103 YES YES YESLPC2104 YES YES YESLPC2105 YES YES YESLPC2106 YES YES YESLPC2109 YES YES YESLPC2112 YES YES YESLPC2114 YES YES YESLPC2119 YES YES YESLPC2124 YES YES YESLPC2129 YES YES YESLPC2131 YES YES YESLPC2131/01 YES YES YESLPC2132 YES YES YESLPC2132/01 YES YES YESLPC2134 YES YES YESLPC2134/01 YES YES YESLPC2136 YES YES YESLPC2136/01 YES YES YESLPC2138 YES YES YESLPC2138/01 YES YES YESLPC2141 YES YES YESLPC2142 YES YES YESLPC2144 YES YES YESLPC2146 YES YES YESLPC2148 YES YES YESLPC2194 YES YES YESLPC2210 YES YES YESLPC2212 YES YES YESLPC2214 YES YES YESLPC2220 YES YES YESLPC2290 YES YES YESLPC2292 YES YES YESLPC2294 YES YES YESLPC2364 YES YES YESLPC2365 YES YES YESLPC2366 YES YES YESLPC2367 YES YES YES
CP
U
ICE
FIR
E
ICD
DE
BU
G
ICD
MO
NIT
OR
ICD
TR
AC
E
PO
WE
RIN
TE
GR
ATO
R
INS
TR
UC
TIO
NS
IMU
LA
TOR
ARM-ETM Trace 183 ©1989-2019 Lauterbach GmbH
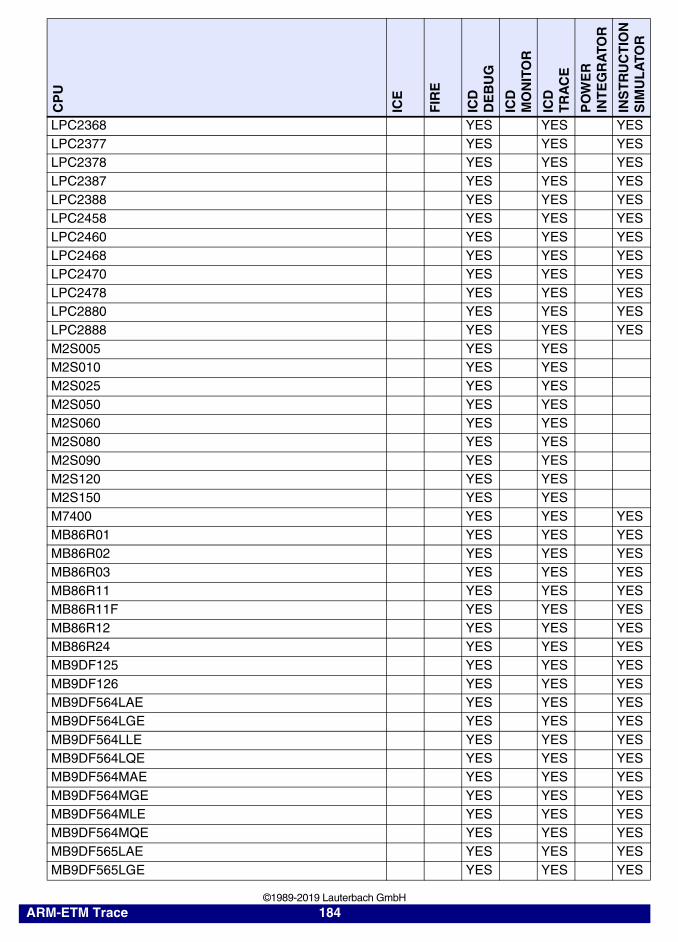
LPC2368 YES YES YESLPC2377 YES YES YESLPC2378 YES YES YESLPC2387 YES YES YESLPC2388 YES YES YESLPC2458 YES YES YESLPC2460 YES YES YESLPC2468 YES YES YESLPC2470 YES YES YESLPC2478 YES YES YESLPC2880 YES YES YESLPC2888 YES YES YESM2S005 YES YESM2S010 YES YESM2S025 YES YESM2S050 YES YESM2S060 YES YESM2S080 YES YESM2S090 YES YESM2S120 YES YESM2S150 YES YESM7400 YES YES YESMB86R01 YES YES YESMB86R02 YES YES YESMB86R03 YES YES YESMB86R11 YES YES YESMB86R11F YES YES YESMB86R12 YES YES YESMB86R24 YES YES YESMB9DF125 YES YES YESMB9DF126 YES YES YESMB9DF564LAE YES YES YESMB9DF564LGE YES YES YESMB9DF564LLE YES YES YESMB9DF564LQE YES YES YESMB9DF564MAE YES YES YESMB9DF564MGE YES YES YESMB9DF564MLE YES YES YESMB9DF564MQE YES YES YESMB9DF565LAE YES YES YESMB9DF565LGE YES YES YES
CP
U
ICE
FIR
E
ICD
DE
BU
G
ICD
MO
NIT
OR
ICD
TR
AC
E
PO
WE
RIN
TE
GR
ATO
R
INS
TR
UC
TIO
NS
IMU
LA
TOR
ARM-ETM Trace 184 ©1989-2019 Lauterbach GmbH
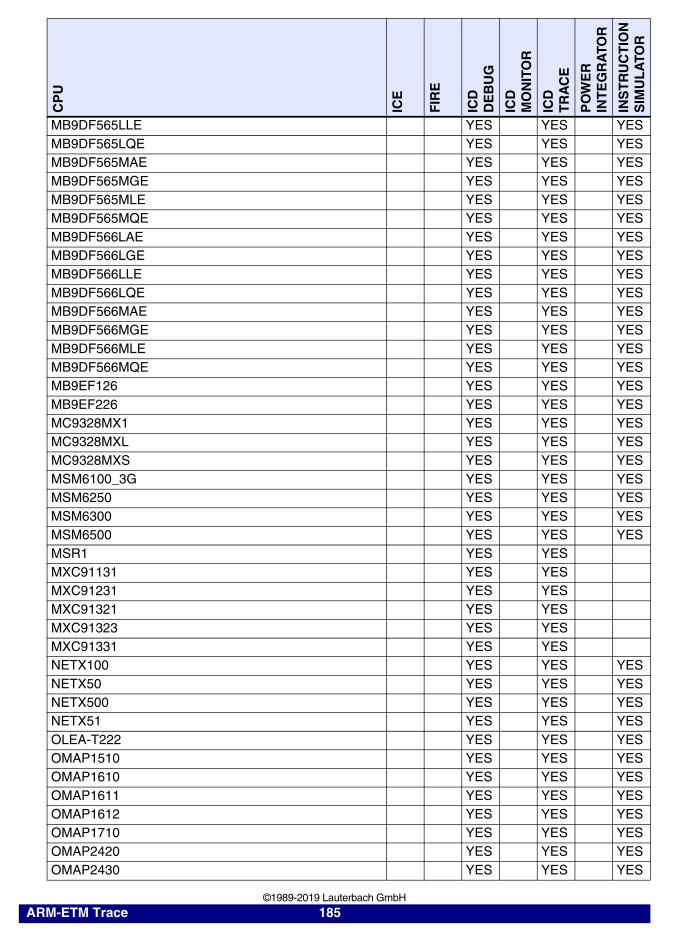
MB9DF565LLE YES YES YESMB9DF565LQE YES YES YESMB9DF565MAE YES YES YESMB9DF565MGE YES YES YESMB9DF565MLE YES YES YESMB9DF565MQE YES YES YESMB9DF566LAE YES YES YESMB9DF566LGE YES YES YESMB9DF566LLE YES YES YESMB9DF566LQE YES YES YESMB9DF566MAE YES YES YESMB9DF566MGE YES YES YESMB9DF566MLE YES YES YESMB9DF566MQE YES YES YESMB9EF126 YES YES YESMB9EF226 YES YES YESMC9328MX1 YES YES YESMC9328MXL YES YES YESMC9328MXS YES YES YESMSM6100_3G YES YES YESMSM6250 YES YES YESMSM6300 YES YES YESMSM6500 YES YES YESMSR1 YES YESMXC91131 YES YESMXC91231 YES YESMXC91321 YES YESMXC91323 YES YESMXC91331 YES YESNETX100 YES YES YESNETX50 YES YES YESNETX500 YES YES YESNETX51 YES YES YESOLEA-T222 YES YES YESOMAP1510 YES YES YESOMAP1610 YES YES YESOMAP1611 YES YES YESOMAP1612 YES YES YESOMAP1710 YES YES YESOMAP2420 YES YES YESOMAP2430 YES YES YES
CP
U
ICE
FIR
E
ICD
DE
BU
G
ICD
MO
NIT
OR
ICD
TR
AC
E
PO
WE
RIN
TE
GR
ATO
R
INS
TR
UC
TIO
NS
IMU
LA
TOR
ARM-ETM Trace 185 ©1989-2019 Lauterbach GmbH
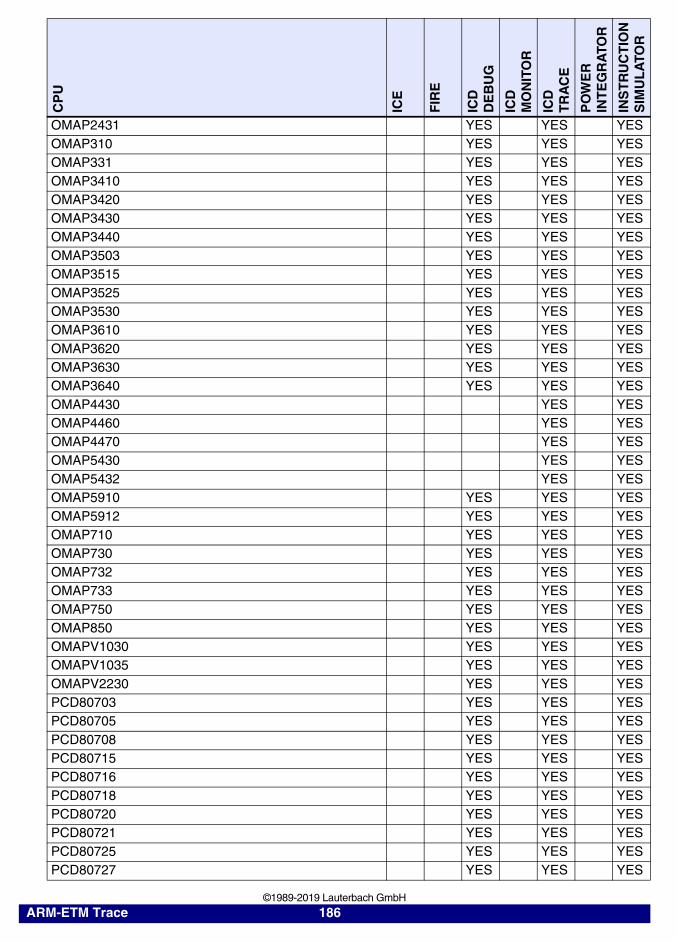
OMAP2431 YES YES YESOMAP310 YES YES YESOMAP331 YES YES YESOMAP3410 YES YES YESOMAP3420 YES YES YESOMAP3430 YES YES YESOMAP3440 YES YES YESOMAP3503 YES YES YESOMAP3515 YES YES YESOMAP3525 YES YES YESOMAP3530 YES YES YESOMAP3610 YES YES YESOMAP3620 YES YES YESOMAP3630 YES YES YESOMAP3640 YES YES YESOMAP4430 YES YESOMAP4460 YES YESOMAP4470 YES YESOMAP5430 YES YESOMAP5432 YES YESOMAP5910 YES YES YESOMAP5912 YES YES YESOMAP710 YES YES YESOMAP730 YES YES YESOMAP732 YES YES YESOMAP733 YES YES YESOMAP750 YES YES YESOMAP850 YES YES YESOMAPV1030 YES YES YESOMAPV1035 YES YES YESOMAPV2230 YES YES YESPCD80703 YES YES YESPCD80705 YES YES YESPCD80708 YES YES YESPCD80715 YES YES YESPCD80716 YES YES YESPCD80718 YES YES YESPCD80720 YES YES YESPCD80721 YES YES YESPCD80725 YES YES YESPCD80727 YES YES YES
CP
U
ICE
FIR
E
ICD
DE
BU
G
ICD
MO
NIT
OR
ICD
TR
AC
E
PO
WE
RIN
TE
GR
ATO
R
INS
TR
UC
TIO
NS
IMU
LA
TOR
ARM-ETM Trace 186 ©1989-2019 Lauterbach GmbH
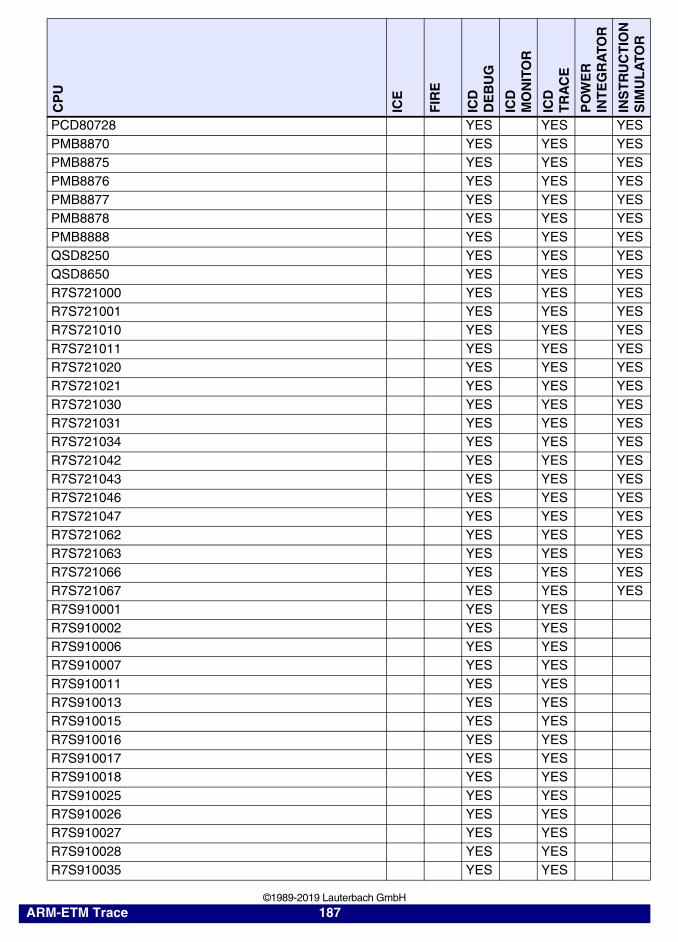
PCD80728 YES YES YESPMB8870 YES YES YESPMB8875 YES YES YESPMB8876 YES YES YESPMB8877 YES YES YESPMB8878 YES YES YESPMB8888 YES YES YESQSD8250 YES YES YESQSD8650 YES YES YESR7S721000 YES YES YESR7S721001 YES YES YESR7S721010 YES YES YESR7S721011 YES YES YESR7S721020 YES YES YESR7S721021 YES YES YESR7S721030 YES YES YESR7S721031 YES YES YESR7S721034 YES YES YESR7S721042 YES YES YESR7S721043 YES YES YESR7S721046 YES YES YESR7S721047 YES YES YESR7S721062 YES YES YESR7S721063 YES YES YESR7S721066 YES YES YESR7S721067 YES YES YESR7S910001 YES YESR7S910002 YES YESR7S910006 YES YESR7S910007 YES YESR7S910011 YES YESR7S910013 YES YESR7S910015 YES YESR7S910016 YES YESR7S910017 YES YESR7S910018 YES YESR7S910025 YES YESR7S910026 YES YESR7S910027 YES YESR7S910028 YES YESR7S910035 YES YES
CP
U
ICE
FIR
E
ICD
DE
BU
G
ICD
MO
NIT
OR
ICD
TR
AC
E
PO
WE
RIN
TE
GR
ATO
R
INS
TR
UC
TIO
NS
IMU
LA
TOR
ARM-ETM Trace 187 ©1989-2019 Lauterbach GmbH
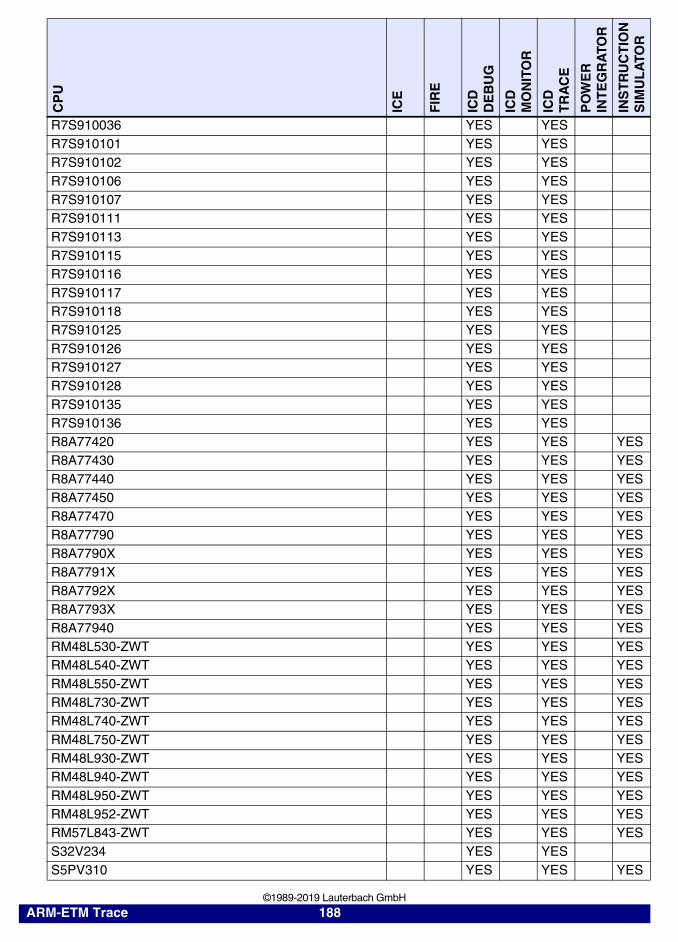
R7S910036 YES YESR7S910101 YES YESR7S910102 YES YESR7S910106 YES YESR7S910107 YES YESR7S910111 YES YESR7S910113 YES YESR7S910115 YES YESR7S910116 YES YESR7S910117 YES YESR7S910118 YES YESR7S910125 YES YESR7S910126 YES YESR7S910127 YES YESR7S910128 YES YESR7S910135 YES YESR7S910136 YES YESR8A77420 YES YES YESR8A77430 YES YES YESR8A77440 YES YES YESR8A77450 YES YES YESR8A77470 YES YES YESR8A77790 YES YES YESR8A7790X YES YES YESR8A7791X YES YES YESR8A7792X YES YES YESR8A7793X YES YES YESR8A77940 YES YES YESRM48L530-ZWT YES YES YESRM48L540-ZWT YES YES YESRM48L550-ZWT YES YES YESRM48L730-ZWT YES YES YESRM48L740-ZWT YES YES YESRM48L750-ZWT YES YES YESRM48L930-ZWT YES YES YESRM48L940-ZWT YES YES YESRM48L950-ZWT YES YES YESRM48L952-ZWT YES YES YESRM57L843-ZWT YES YES YESS32V234 YES YESS5PV310 YES YES YES
CP
U
ICE
FIR
E
ICD
DE
BU
G
ICD
MO
NIT
OR
ICD
TR
AC
E
PO
WE
RIN
TE
GR
ATO
R
INS
TR
UC
TIO
NS
IMU
LA
TOR
ARM-ETM Trace 188 ©1989-2019 Lauterbach GmbH
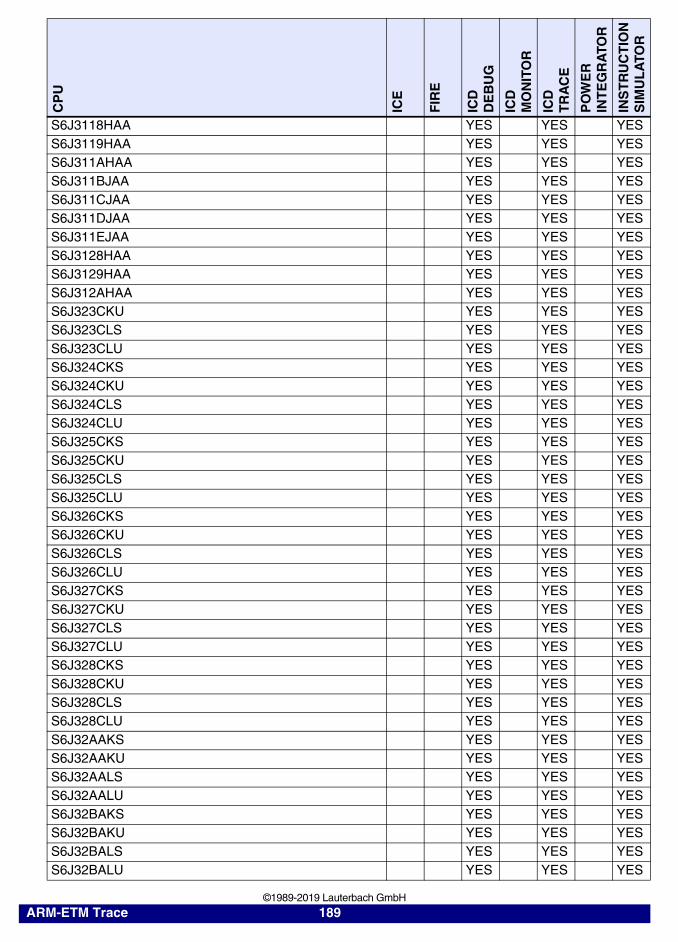
S6J3118HAA YES YES YESS6J3119HAA YES YES YESS6J311AHAA YES YES YESS6J311BJAA YES YES YESS6J311CJAA YES YES YESS6J311DJAA YES YES YESS6J311EJAA YES YES YESS6J3128HAA YES YES YESS6J3129HAA YES YES YESS6J312AHAA YES YES YESS6J323CKU YES YES YESS6J323CLS YES YES YESS6J323CLU YES YES YESS6J324CKS YES YES YESS6J324CKU YES YES YESS6J324CLS YES YES YESS6J324CLU YES YES YESS6J325CKS YES YES YESS6J325CKU YES YES YESS6J325CLS YES YES YESS6J325CLU YES YES YESS6J326CKS YES YES YESS6J326CKU YES YES YESS6J326CLS YES YES YESS6J326CLU YES YES YESS6J327CKS YES YES YESS6J327CKU YES YES YESS6J327CLS YES YES YESS6J327CLU YES YES YESS6J328CKS YES YES YESS6J328CKU YES YES YESS6J328CLS YES YES YESS6J328CLU YES YES YESS6J32AAKS YES YES YESS6J32AAKU YES YES YESS6J32AALS YES YES YESS6J32AALU YES YES YESS6J32BAKS YES YES YESS6J32BAKU YES YES YESS6J32BALS YES YES YESS6J32BALU YES YES YES
CP
U
ICE
FIR
E
ICD
DE
BU
G
ICD
MO
NIT
OR
ICD
TR
AC
E
PO
WE
RIN
TE
GR
ATO
R
INS
TR
UC
TIO
NS
IMU
LA
TOR
ARM-ETM Trace 189 ©1989-2019 Lauterbach GmbH

S6J32CAKS YES YES YESS6J32CAKU YES YES YESS6J32CALS YES YES YESS6J32CALU YES YES YESS6J32DAKS YES YES YESS6J32DAKU YES YES YESS6J32DALS YES YES YESS6J32DALU YES YES YESS6J32EEKS YES YES YESS6J32EELS YES YES YESS6J32FEKS YES YES YESS6J32FELS YES YES YESS6J32GEKS YES YES YESS6J32GELS YES YES YESS6J331BHA YES YES YESS6J331BHB YES YES YESS6J331BHC YES YES YESS6J331BHD YES YES YESS6J331BHS YES YES YESS6J331BHU YES YES YESS6J331BJA YES YES YESS6J331BJB YES YES YESS6J331BJC YES YES YESS6J331BJD YES YES YESS6J331BJS YES YES YESS6J331BJU YES YES YESS6J331BKA YES YES YESS6J331BKB YES YES YESS6J331BKC YES YES YESS6J331BKD YES YES YESS6J331BKS YES YES YESS6J331BKU YES YES YESS6J331CHA YES YES YESS6J331CHB YES YES YESS6J331CHC YES YES YESS6J331CHD YES YES YESS6J331CHS YES YES YESS6J331CHU YES YES YESS6J331CJA YES YES YESS6J331CJB YES YES YESS6J331CJC YES YES YES
CP
U
ICE
FIR
E
ICD
DE
BU
G
ICD
MO
NIT
OR
ICD
TR
AC
E
PO
WE
RIN
TE
GR
ATO
R
INS
TR
UC
TIO
NS
IMU
LA
TOR
ARM-ETM Trace 190 ©1989-2019 Lauterbach GmbH

S6J331CJD YES YES YESS6J331CJS YES YES YESS6J331CJU YES YES YESS6J331CKA YES YES YESS6J331CKB YES YES YESS6J331CKC YES YES YESS6J331CKD YES YES YESS6J331CKS YES YES YESS6J331CKU YES YES YESS6J331DHA YES YES YESS6J331DHB YES YES YESS6J331DHC YES YES YESS6J331DHD YES YES YESS6J331DHS YES YES YESS6J331DHU YES YES YESS6J331DJA YES YES YESS6J331DJB YES YES YESS6J331DJC YES YES YESS6J331DJD YES YES YESS6J331DJS YES YES YESS6J331DJU YES YES YESS6J331DKA YES YES YESS6J331DKB YES YES YESS6J331DKC YES YES YESS6J331DKD YES YES YESS6J331DKS YES YES YESS6J331DKU YES YES YESS6J331EHA YES YES YESS6J331EHB YES YES YESS6J331EHC YES YES YESS6J331EHD YES YES YESS6J331EHS YES YES YESS6J331EHU YES YES YESS6J331EJA YES YES YESS6J331EJB YES YES YESS6J331EJC YES YES YESS6J331EJD YES YES YESS6J331EJS YES YES YESS6J331EJU YES YES YESS6J331EKA YES YES YESS6J331EKB YES YES YES
CP
U
ICE
FIR
E
ICD
DE
BU
G
ICD
MO
NIT
OR
ICD
TR
AC
E
PO
WE
RIN
TE
GR
ATO
R
INS
TR
UC
TIO
NS
IMU
LA
TOR
ARM-ETM Trace 191 ©1989-2019 Lauterbach GmbH
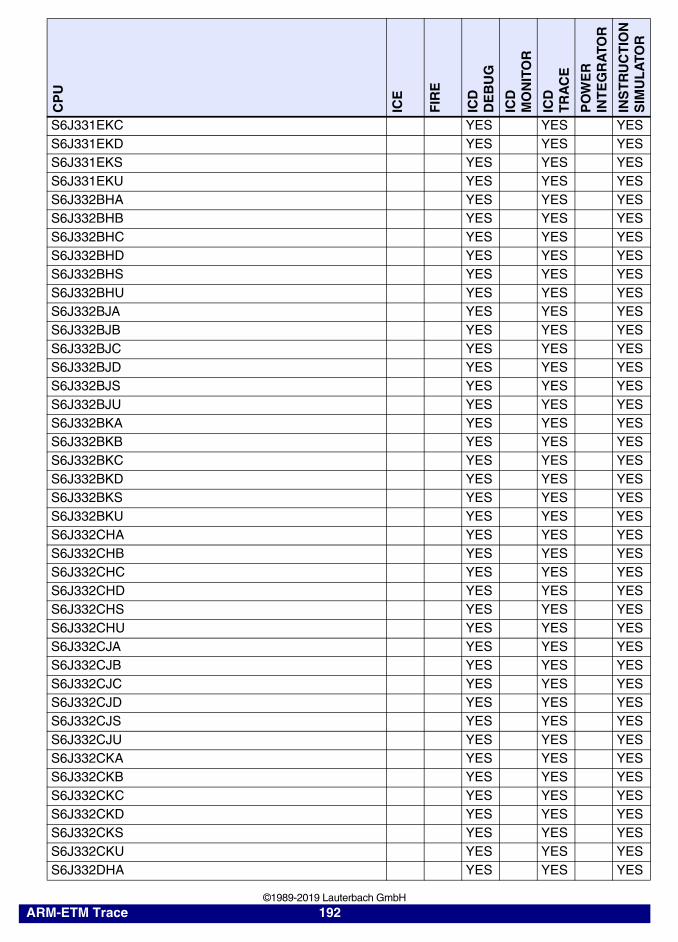
S6J331EKC YES YES YESS6J331EKD YES YES YESS6J331EKS YES YES YESS6J331EKU YES YES YESS6J332BHA YES YES YESS6J332BHB YES YES YESS6J332BHC YES YES YESS6J332BHD YES YES YESS6J332BHS YES YES YESS6J332BHU YES YES YESS6J332BJA YES YES YESS6J332BJB YES YES YESS6J332BJC YES YES YESS6J332BJD YES YES YESS6J332BJS YES YES YESS6J332BJU YES YES YESS6J332BKA YES YES YESS6J332BKB YES YES YESS6J332BKC YES YES YESS6J332BKD YES YES YESS6J332BKS YES YES YESS6J332BKU YES YES YESS6J332CHA YES YES YESS6J332CHB YES YES YESS6J332CHC YES YES YESS6J332CHD YES YES YESS6J332CHS YES YES YESS6J332CHU YES YES YESS6J332CJA YES YES YESS6J332CJB YES YES YESS6J332CJC YES YES YESS6J332CJD YES YES YESS6J332CJS YES YES YESS6J332CJU YES YES YESS6J332CKA YES YES YESS6J332CKB YES YES YESS6J332CKC YES YES YESS6J332CKD YES YES YESS6J332CKS YES YES YESS6J332CKU YES YES YESS6J332DHA YES YES YES
CP
U
ICE
FIR
E
ICD
DE
BU
G
ICD
MO
NIT
OR
ICD
TR
AC
E
PO
WE
RIN
TE
GR
ATO
R
INS
TR
UC
TIO
NS
IMU
LA
TOR
ARM-ETM Trace 192 ©1989-2019 Lauterbach GmbH

S6J332DHB YES YES YESS6J332DHC YES YES YESS6J332DHD YES YES YESS6J332DHS YES YES YESS6J332DHU YES YES YESS6J332DJA YES YES YESS6J332DJB YES YES YESS6J332DJC YES YES YESS6J332DJD YES YES YESS6J332DJS YES YES YESS6J332DJU YES YES YESS6J332DKA YES YES YESS6J332DKB YES YES YESS6J332DKC YES YES YESS6J332DKD YES YES YESS6J332DKS YES YES YESS6J332DKU YES YES YESS6J332EHA YES YES YESS6J332EHB YES YES YESS6J332EHC YES YES YESS6J332EHD YES YES YESS6J332EHS YES YES YESS6J332EHU YES YES YESS6J332EJA YES YES YESS6J332EJB YES YES YESS6J332EJC YES YES YESS6J332EJD YES YES YESS6J332EJS YES YES YESS6J332EJU YES YES YESS6J332EKA YES YES YESS6J332EKB YES YES YESS6J332EKC YES YES YESS6J332EKD YES YES YESS6J332EKS YES YES YESS6J332EKU YES YES YESS6J333BHA YES YES YESS6J333BHB YES YES YESS6J333BHC YES YES YESS6J333BHD YES YES YESS6J333BHS YES YES YESS6J333BHU YES YES YES
CP
U
ICE
FIR
E
ICD
DE
BU
G
ICD
MO
NIT
OR
ICD
TR
AC
E
PO
WE
RIN
TE
GR
ATO
R
INS
TR
UC
TIO
NS
IMU
LA
TOR
ARM-ETM Trace 193 ©1989-2019 Lauterbach GmbH
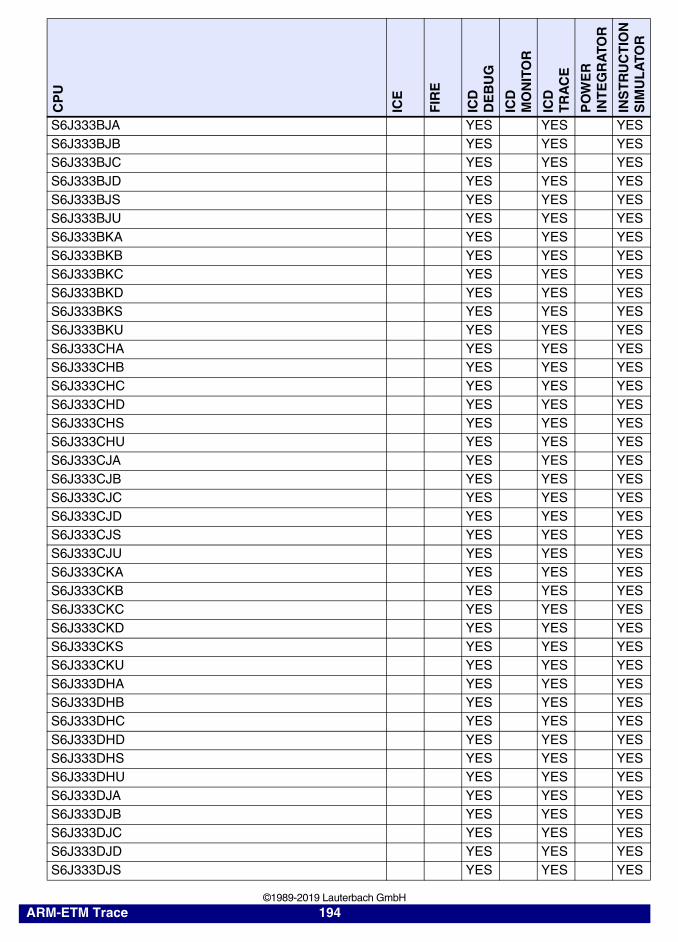
S6J333BJA YES YES YESS6J333BJB YES YES YESS6J333BJC YES YES YESS6J333BJD YES YES YESS6J333BJS YES YES YESS6J333BJU YES YES YESS6J333BKA YES YES YESS6J333BKB YES YES YESS6J333BKC YES YES YESS6J333BKD YES YES YESS6J333BKS YES YES YESS6J333BKU YES YES YESS6J333CHA YES YES YESS6J333CHB YES YES YESS6J333CHC YES YES YESS6J333CHD YES YES YESS6J333CHS YES YES YESS6J333CHU YES YES YESS6J333CJA YES YES YESS6J333CJB YES YES YESS6J333CJC YES YES YESS6J333CJD YES YES YESS6J333CJS YES YES YESS6J333CJU YES YES YESS6J333CKA YES YES YESS6J333CKB YES YES YESS6J333CKC YES YES YESS6J333CKD YES YES YESS6J333CKS YES YES YESS6J333CKU YES YES YESS6J333DHA YES YES YESS6J333DHB YES YES YESS6J333DHC YES YES YESS6J333DHD YES YES YESS6J333DHS YES YES YESS6J333DHU YES YES YESS6J333DJA YES YES YESS6J333DJB YES YES YESS6J333DJC YES YES YESS6J333DJD YES YES YESS6J333DJS YES YES YES
CP
U
ICE
FIR
E
ICD
DE
BU
G
ICD
MO
NIT
OR
ICD
TR
AC
E
PO
WE
RIN
TE
GR
ATO
R
INS
TR
UC
TIO
NS
IMU
LA
TOR
ARM-ETM Trace 194 ©1989-2019 Lauterbach GmbH
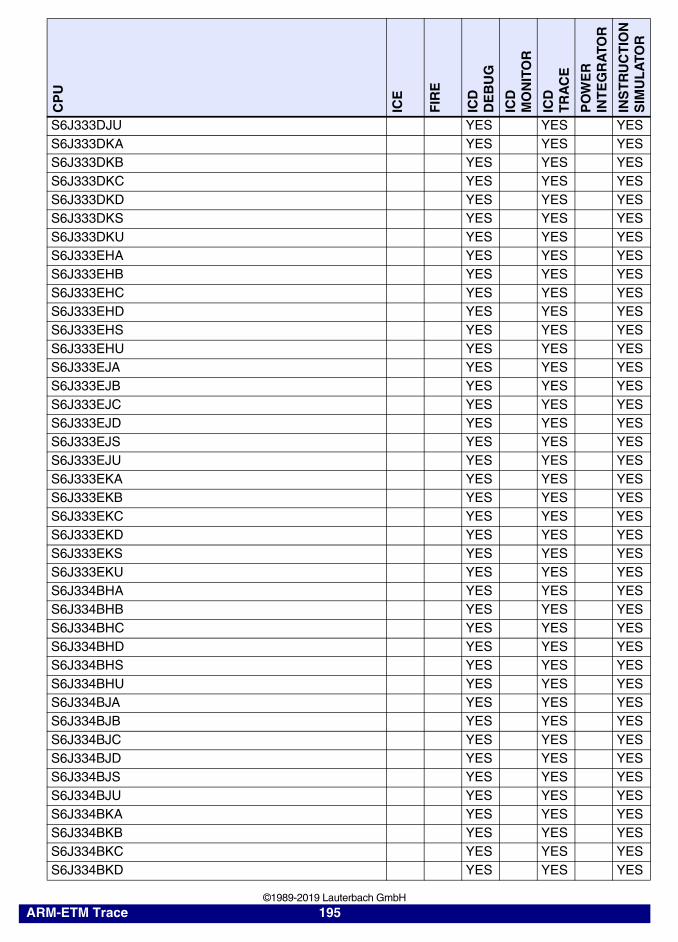
S6J333DJU YES YES YESS6J333DKA YES YES YESS6J333DKB YES YES YESS6J333DKC YES YES YESS6J333DKD YES YES YESS6J333DKS YES YES YESS6J333DKU YES YES YESS6J333EHA YES YES YESS6J333EHB YES YES YESS6J333EHC YES YES YESS6J333EHD YES YES YESS6J333EHS YES YES YESS6J333EHU YES YES YESS6J333EJA YES YES YESS6J333EJB YES YES YESS6J333EJC YES YES YESS6J333EJD YES YES YESS6J333EJS YES YES YESS6J333EJU YES YES YESS6J333EKA YES YES YESS6J333EKB YES YES YESS6J333EKC YES YES YESS6J333EKD YES YES YESS6J333EKS YES YES YESS6J333EKU YES YES YESS6J334BHA YES YES YESS6J334BHB YES YES YESS6J334BHC YES YES YESS6J334BHD YES YES YESS6J334BHS YES YES YESS6J334BHU YES YES YESS6J334BJA YES YES YESS6J334BJB YES YES YESS6J334BJC YES YES YESS6J334BJD YES YES YESS6J334BJS YES YES YESS6J334BJU YES YES YESS6J334BKA YES YES YESS6J334BKB YES YES YESS6J334BKC YES YES YESS6J334BKD YES YES YES
CP
U
ICE
FIR
E
ICD
DE
BU
G
ICD
MO
NIT
OR
ICD
TR
AC
E
PO
WE
RIN
TE
GR
ATO
R
INS
TR
UC
TIO
NS
IMU
LA
TOR
ARM-ETM Trace 195 ©1989-2019 Lauterbach GmbH

S6J334BKS YES YES YESS6J334BKU YES YES YESS6J334CHA YES YES YESS6J334CHB YES YES YESS6J334CHC YES YES YESS6J334CHD YES YES YESS6J334CHS YES YES YESS6J334CHU YES YES YESS6J334CJA YES YES YESS6J334CJB YES YES YESS6J334CJC YES YES YESS6J334CJD YES YES YESS6J334CJS YES YES YESS6J334CJU YES YES YESS6J334CKA YES YES YESS6J334CKB YES YES YESS6J334CKC YES YES YESS6J334CKD YES YES YESS6J334CKS YES YES YESS6J334CKU YES YES YESS6J334DHA YES YES YESS6J334DHB YES YES YESS6J334DHC YES YES YESS6J334DHD YES YES YESS6J334DHS YES YES YESS6J334DHU YES YES YESS6J334DJA YES YES YESS6J334DJB YES YES YESS6J334DJC YES YES YESS6J334DJD YES YES YESS6J334DJS YES YES YESS6J334DJU YES YES YESS6J334DKA YES YES YESS6J334DKB YES YES YESS6J334DKC YES YES YESS6J334DKD YES YES YESS6J334DKS YES YES YESS6J334DKU YES YES YESS6J334EHA YES YES YESS6J334EHB YES YES YESS6J334EHC YES YES YES
CP
U
ICE
FIR
E
ICD
DE
BU
G
ICD
MO
NIT
OR
ICD
TR
AC
E
PO
WE
RIN
TE
GR
ATO
R
INS
TR
UC
TIO
NS
IMU
LA
TOR
ARM-ETM Trace 196 ©1989-2019 Lauterbach GmbH

S6J334EHD YES YES YESS6J334EHS YES YES YESS6J334EHU YES YES YESS6J334EJA YES YES YESS6J334EJB YES YES YESS6J334EJC YES YES YESS6J334EJD YES YES YESS6J334EJS YES YES YESS6J334EJU YES YES YESS6J334EKA YES YES YESS6J334EKB YES YES YESS6J334EKC YES YES YESS6J334EKD YES YES YESS6J334EKS YES YES YESS6J334EKU YES YES YESS6J335DHA YES YES YESS6J335DHB YES YES YESS6J335DHC YES YES YESS6J335DHD YES YES YESS6J335DHS YES YES YESS6J335DHU YES YES YESS6J335DJA YES YES YESS6J335DJB YES YES YESS6J335DJC YES YES YESS6J335DJD YES YES YESS6J335DJS YES YES YESS6J335DJU YES YES YESS6J335DKA YES YES YESS6J335DKB YES YES YESS6J335DKC YES YES YESS6J335DKD YES YES YESS6J335DKS YES YES YESS6J335DKU YES YES YESS6J335EHA YES YES YESS6J335EHB YES YES YESS6J335EHC YES YES YESS6J335EHD YES YES YESS6J335EHS YES YES YESS6J335EHU YES YES YESS6J335EJA YES YES YESS6J335EJB YES YES YES
CP
U
ICE
FIR
E
ICD
DE
BU
G
ICD
MO
NIT
OR
ICD
TR
AC
E
PO
WE
RIN
TE
GR
ATO
R
INS
TR
UC
TIO
NS
IMU
LA
TOR
ARM-ETM Trace 197 ©1989-2019 Lauterbach GmbH
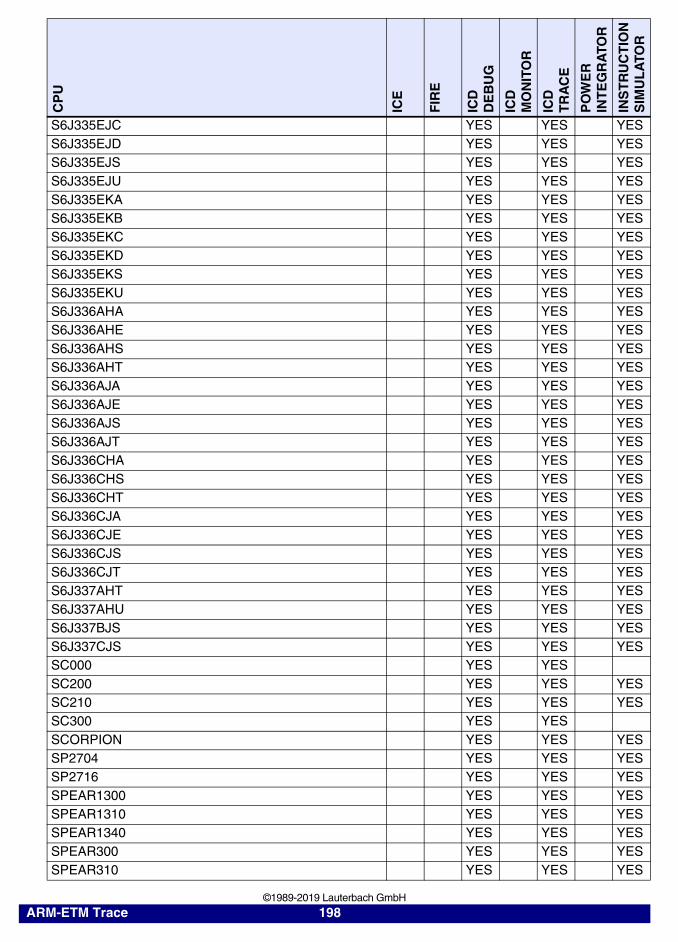
S6J335EJC YES YES YESS6J335EJD YES YES YESS6J335EJS YES YES YESS6J335EJU YES YES YESS6J335EKA YES YES YESS6J335EKB YES YES YESS6J335EKC YES YES YESS6J335EKD YES YES YESS6J335EKS YES YES YESS6J335EKU YES YES YESS6J336AHA YES YES YESS6J336AHE YES YES YESS6J336AHS YES YES YESS6J336AHT YES YES YESS6J336AJA YES YES YESS6J336AJE YES YES YESS6J336AJS YES YES YESS6J336AJT YES YES YESS6J336CHA YES YES YESS6J336CHS YES YES YESS6J336CHT YES YES YESS6J336CJA YES YES YESS6J336CJE YES YES YESS6J336CJS YES YES YESS6J336CJT YES YES YESS6J337AHT YES YES YESS6J337AHU YES YES YESS6J337BJS YES YES YESS6J337CJS YES YES YESSC000 YES YESSC200 YES YES YESSC210 YES YES YESSC300 YES YESSCORPION YES YES YESSP2704 YES YES YESSP2716 YES YES YESSPEAR1300 YES YES YESSPEAR1310 YES YES YESSPEAR1340 YES YES YESSPEAR300 YES YES YESSPEAR310 YES YES YES
CP
U
ICE
FIR
E
ICD
DE
BU
G
ICD
MO
NIT
OR
ICD
TR
AC
E
PO
WE
RIN
TE
GR
ATO
R
INS
TR
UC
TIO
NS
IMU
LA
TOR
ARM-ETM Trace 198 ©1989-2019 Lauterbach GmbH
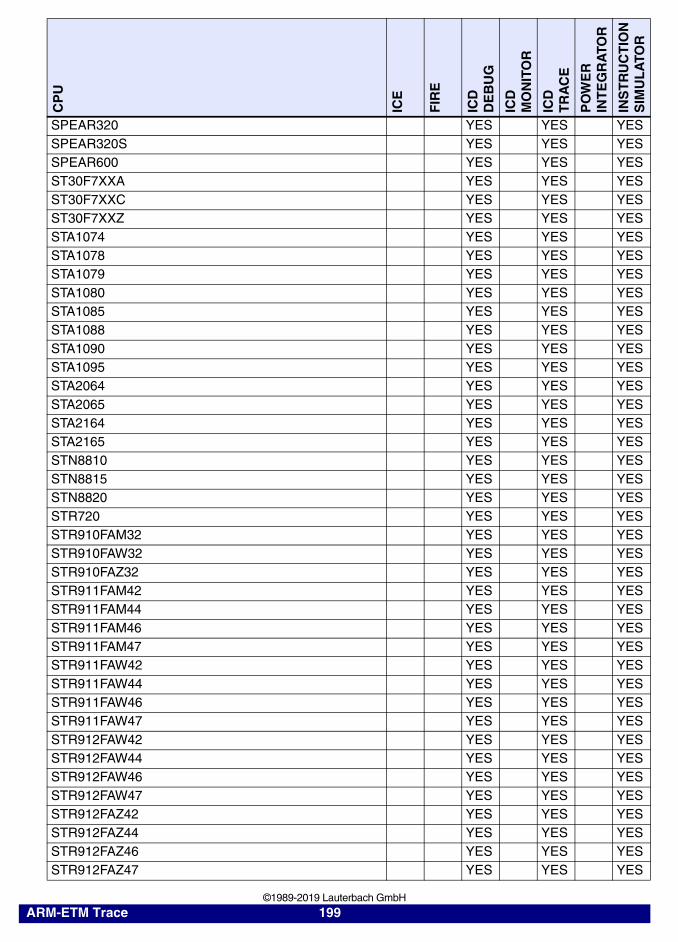
SPEAR320 YES YES YESSPEAR320S YES YES YESSPEAR600 YES YES YESST30F7XXA YES YES YESST30F7XXC YES YES YESST30F7XXZ YES YES YESSTA1074 YES YES YESSTA1078 YES YES YESSTA1079 YES YES YESSTA1080 YES YES YESSTA1085 YES YES YESSTA1088 YES YES YESSTA1090 YES YES YESSTA1095 YES YES YESSTA2064 YES YES YESSTA2065 YES YES YESSTA2164 YES YES YESSTA2165 YES YES YESSTN8810 YES YES YESSTN8815 YES YES YESSTN8820 YES YES YESSTR720 YES YES YESSTR910FAM32 YES YES YESSTR910FAW32 YES YES YESSTR910FAZ32 YES YES YESSTR911FAM42 YES YES YESSTR911FAM44 YES YES YESSTR911FAM46 YES YES YESSTR911FAM47 YES YES YESSTR911FAW42 YES YES YESSTR911FAW44 YES YES YESSTR911FAW46 YES YES YESSTR911FAW47 YES YES YESSTR912FAW42 YES YES YESSTR912FAW44 YES YES YESSTR912FAW46 YES YES YESSTR912FAW47 YES YES YESSTR912FAZ42 YES YES YESSTR912FAZ44 YES YES YESSTR912FAZ46 YES YES YESSTR912FAZ47 YES YES YES
CP
U
ICE
FIR
E
ICD
DE
BU
G
ICD
MO
NIT
OR
ICD
TR
AC
E
PO
WE
RIN
TE
GR
ATO
R
INS
TR
UC
TIO
NS
IMU
LA
TOR
ARM-ETM Trace 199 ©1989-2019 Lauterbach GmbH

TCI6630K2L YES YES YESTCI6634K2K YES YES YESTCI6636K2H YES YES YESTCI6638K2K YES YES YESTDA2EX YES YESTDA2PX YES YESTDA2X YES YESTDA3X YES YESTMS320DM3725 YES YES YESTMS320DM3730 YES YES YESTMS470MF031 YES YESTMS470MF042 YES YESTMS470MF066 YES YESTMS470MSF541 YES YESTMS470MSF542 YES YESTMS570LC4357 YES YES YESTMS570LS10106-ZWT YES YES YESTMS570LS10116-ZWT YES YES YESTMS570LS10206-ZWT YES YES YESTMS570LS10216-ZWT YES YES YESTMS570LS20206-ZWT YES YES YESTMS570LS20216-ZWT YES YES YESTMS570LS2124-ZWT YES YES YESTMS570LS2125-ZWT YES YES YESTMS570LS2134-ZWT YES YES YESTMS570LS2135-ZWT YES YES YESTMS570LS3134-ZWT YES YES YESTMS570LS3135-ZWT YES YES YESTMS570LS3137-EP YES YES YESTMS570LS3137-ZWT YES YES YESVF11xR YES YES YESVF12xR YES YES YESVF31xR YES YES YESVF32xR YES YES YESVF3xx YES YES YESVF4xx YES YES YESVF51xR YES YES YESVF52xR YES YES YES
CP
U
ICE
FIR
E
ICD
DE
BU
G
ICD
MO
NIT
OR
ICD
TR
AC
E
PO
WE
RIN
TE
GR
ATO
R
INS
TR
UC
TIO
NS
IMU
LA
TOR
ARM-ETM Trace 200 ©1989-2019 Lauterbach GmbH
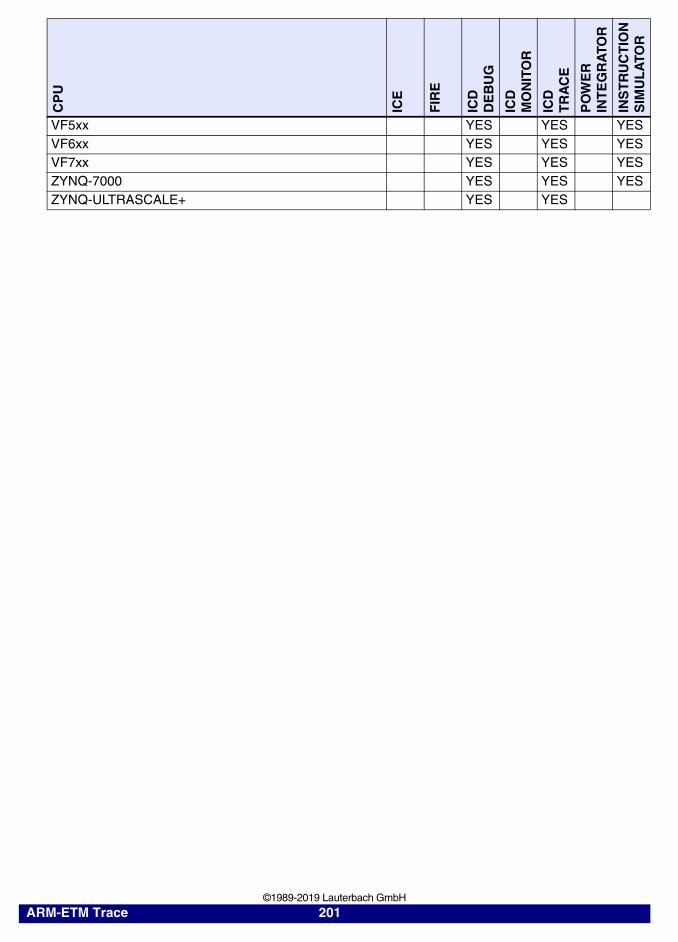
VF5xx YES YES YESVF6xx YES YES YESVF7xx YES YES YESZYNQ-7000 YES YES YESZYNQ-ULTRASCALE+ YES YES
CP
U
ICE
FIR
E
ICD
DE
BU
G
ICD
MO
NIT
OR
ICD
TR
AC
E
PO
WE
RIN
TE
GR
ATO
R
INS
TR
UC
TIO
NS
IMU
LA
TOR
ARM-ETM Trace 201 ©1989-2019 Lauterbach GmbH
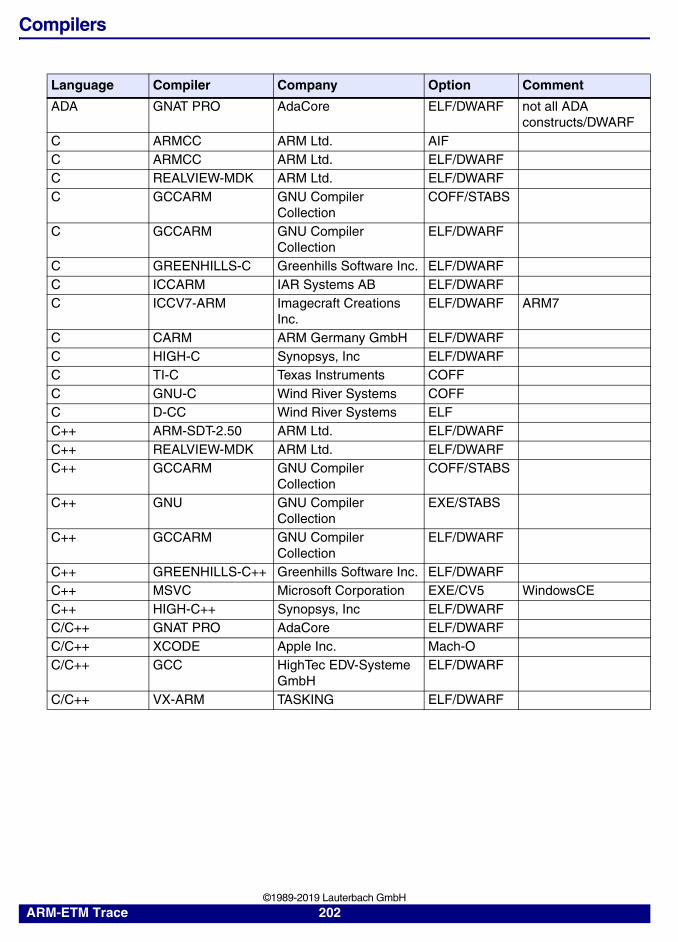
Compilers
Language Compiler Company Option Comment
ADA GNAT PRO AdaCore ELF/DWARF not all ADA constructs/DWARF
C ARMCC ARM Ltd. AIFC ARMCC ARM Ltd. ELF/DWARFC REALVIEW-MDK ARM Ltd. ELF/DWARFC GCCARM GNU Compiler
CollectionCOFF/STABS
C GCCARM GNU Compiler Collection
ELF/DWARF
C GREENHILLS-C Greenhills Software Inc. ELF/DWARFC ICCARM IAR Systems AB ELF/DWARFC ICCV7-ARM Imagecraft Creations
Inc.ELF/DWARF ARM7
C CARM ARM Germany GmbH ELF/DWARFC HIGH-C Synopsys, Inc ELF/DWARFC TI-C Texas Instruments COFFC GNU-C Wind River Systems COFFC D-CC Wind River Systems ELFC++ ARM-SDT-2.50 ARM Ltd. ELF/DWARFC++ REALVIEW-MDK ARM Ltd. ELF/DWARFC++ GCCARM GNU Compiler
CollectionCOFF/STABS
C++ GNU GNU Compiler Collection
EXE/STABS
C++ GCCARM GNU Compiler Collection
ELF/DWARF
C++ GREENHILLS-C++ Greenhills Software Inc. ELF/DWARFC++ MSVC Microsoft Corporation EXE/CV5 WindowsCEC++ HIGH-C++ Synopsys, Inc ELF/DWARFC/C++ GNAT PRO AdaCore ELF/DWARFC/C++ XCODE Apple Inc. Mach-OC/C++ GCC HighTec EDV-Systeme
GmbHELF/DWARF
C/C++ VX-ARM TASKING ELF/DWARF
ARM-ETM Trace 202 ©1989-2019 Lauterbach GmbH
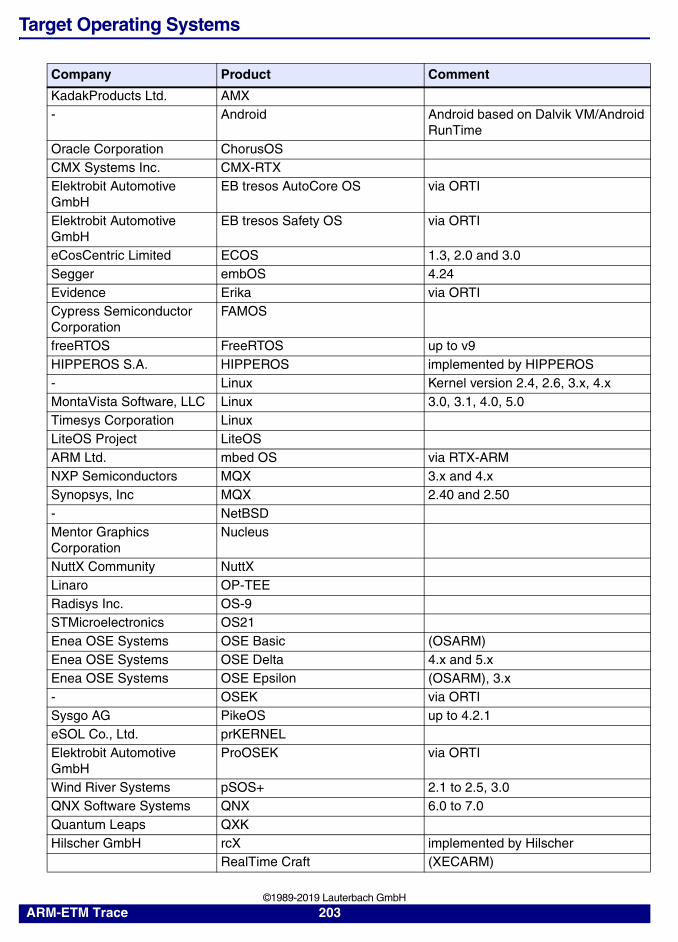
Target Operating Systems
Company Product Comment
KadakProducts Ltd. AMX- Android Android based on Dalvik VM/Android
RunTimeOracle Corporation ChorusOSCMX Systems Inc. CMX-RTXElektrobit Automotive GmbH
EB tresos AutoCore OS via ORTI
Elektrobit Automotive GmbH
EB tresos Safety OS via ORTI
eCosCentric Limited ECOS 1.3, 2.0 and 3.0Segger embOS 4.24Evidence Erika via ORTICypress Semiconductor Corporation
FAMOS
freeRTOS FreeRTOS up to v9HIPPEROS S.A. HIPPEROS implemented by HIPPEROS- Linux Kernel version 2.4, 2.6, 3.x, 4.xMontaVista Software, LLC Linux 3.0, 3.1, 4.0, 5.0Timesys Corporation LinuxLiteOS Project LiteOSARM Ltd. mbed OS via RTX-ARMNXP Semiconductors MQX 3.x and 4.xSynopsys, Inc MQX 2.40 and 2.50- NetBSDMentor Graphics Corporation
Nucleus
NuttX Community NuttXLinaro OP-TEERadisys Inc. OS-9STMicroelectronics OS21Enea OSE Systems OSE Basic (OSARM)Enea OSE Systems OSE Delta 4.x and 5.xEnea OSE Systems OSE Epsilon (OSARM), 3.x- OSEK via ORTISysgo AG PikeOS up to 4.2.1eSOL Co., Ltd. prKERNELElektrobit Automotive GmbH
ProOSEK via ORTI
Wind River Systems pSOS+ 2.1 to 2.5, 3.0QNX Software Systems QNX 6.0 to 7.0Quantum Leaps QXKHilscher GmbH rcX implemented by Hilscher
RealTime Craft (XECARM)
ARM-ETM Trace 203 ©1989-2019 Lauterbach GmbH
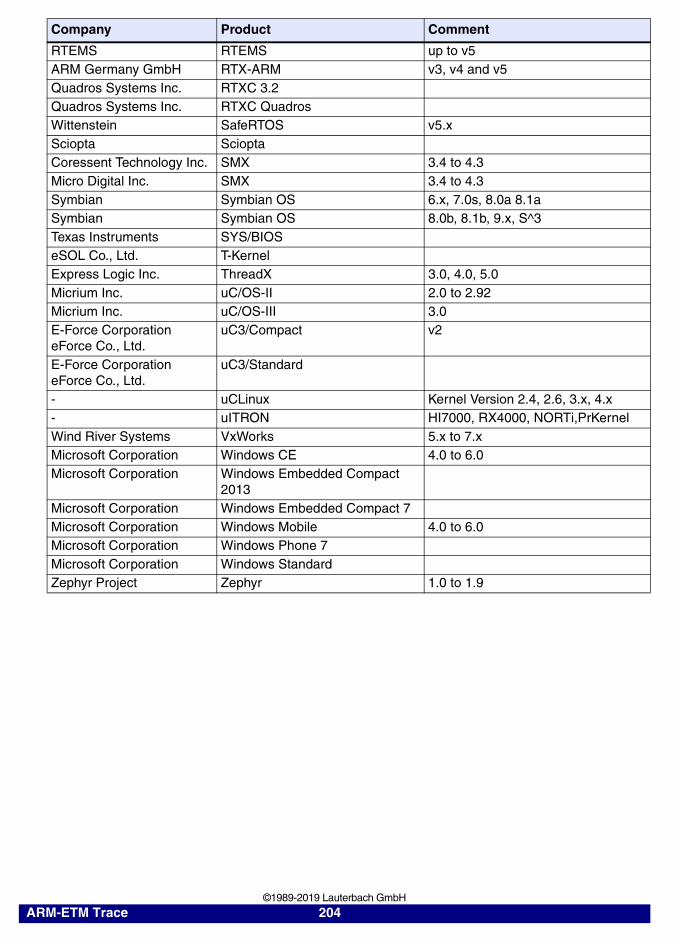
RTEMS RTEMS up to v5ARM Germany GmbH RTX-ARM v3, v4 and v5Quadros Systems Inc. RTXC 3.2Quadros Systems Inc. RTXC QuadrosWittenstein SafeRTOS v5.xSciopta ScioptaCoressent Technology Inc. SMX 3.4 to 4.3Micro Digital Inc. SMX 3.4 to 4.3Symbian Symbian OS 6.x, 7.0s, 8.0a 8.1aSymbian Symbian OS 8.0b, 8.1b, 9.x, S^3Texas Instruments SYS/BIOSeSOL Co., Ltd. T-KernelExpress Logic Inc. ThreadX 3.0, 4.0, 5.0Micrium Inc. uC/OS-II 2.0 to 2.92Micrium Inc. uC/OS-III 3.0E-Force Corporation eForce Co., Ltd.
uC3/Compact v2
E-Force Corporation eForce Co., Ltd.
uC3/Standard
- uCLinux Kernel Version 2.4, 2.6, 3.x, 4.x- uITRON HI7000, RX4000, NORTi,PrKernelWind River Systems VxWorks 5.x to 7.xMicrosoft Corporation Windows CE 4.0 to 6.0Microsoft Corporation Windows Embedded Compact
2013Microsoft Corporation Windows Embedded Compact 7Microsoft Corporation Windows Mobile 4.0 to 6.0Microsoft Corporation Windows Phone 7Microsoft Corporation Windows StandardZephyr Project Zephyr 1.0 to 1.9
Company Product Comment
ARM-ETM Trace 204 ©1989-2019 Lauterbach GmbH
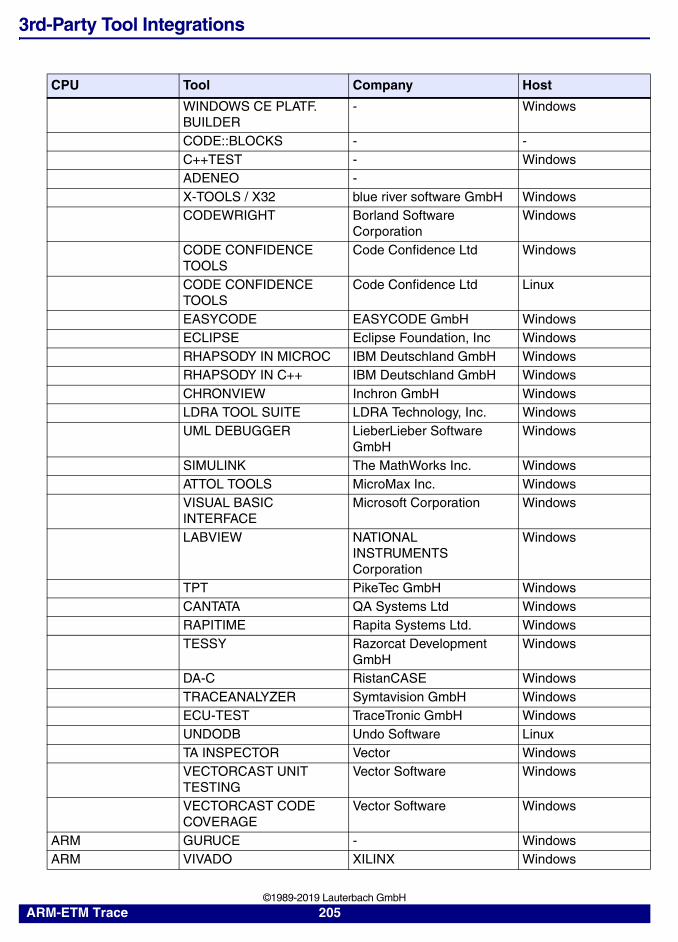
3rd-Party Tool Integrations
CPU Tool Company Host
WINDOWS CE PLATF. BUILDER
- Windows
CODE::BLOCKS - -C++TEST - WindowsADENEO -X-TOOLS / X32 blue river software GmbH WindowsCODEWRIGHT Borland Software
CorporationWindows
CODE CONFIDENCE TOOLS
Code Confidence Ltd Windows
CODE CONFIDENCE TOOLS
Code Confidence Ltd Linux
EASYCODE EASYCODE GmbH WindowsECLIPSE Eclipse Foundation, Inc WindowsRHAPSODY IN MICROC IBM Deutschland GmbH WindowsRHAPSODY IN C++ IBM Deutschland GmbH WindowsCHRONVIEW Inchron GmbH WindowsLDRA TOOL SUITE LDRA Technology, Inc. WindowsUML DEBUGGER LieberLieber Software
GmbHWindows
SIMULINK The MathWorks Inc. WindowsATTOL TOOLS MicroMax Inc. WindowsVISUAL BASIC INTERFACE
Microsoft Corporation Windows
LABVIEW NATIONAL INSTRUMENTS Corporation
Windows
TPT PikeTec GmbH WindowsCANTATA QA Systems Ltd WindowsRAPITIME Rapita Systems Ltd. WindowsTESSY Razorcat Development
GmbHWindows
DA-C RistanCASE WindowsTRACEANALYZER Symtavision GmbH WindowsECU-TEST TraceTronic GmbH WindowsUNDODB Undo Software LinuxTA INSPECTOR Vector WindowsVECTORCAST UNIT TESTING
Vector Software Windows
VECTORCAST CODE COVERAGE
Vector Software Windows
ARM GURUCE - WindowsARM VIVADO XILINX Windows
ARM-ETM Trace 205 ©1989-2019 Lauterbach GmbH

ARM-ETM Trace 206 ©1989-2019 Lauterbach GmbH
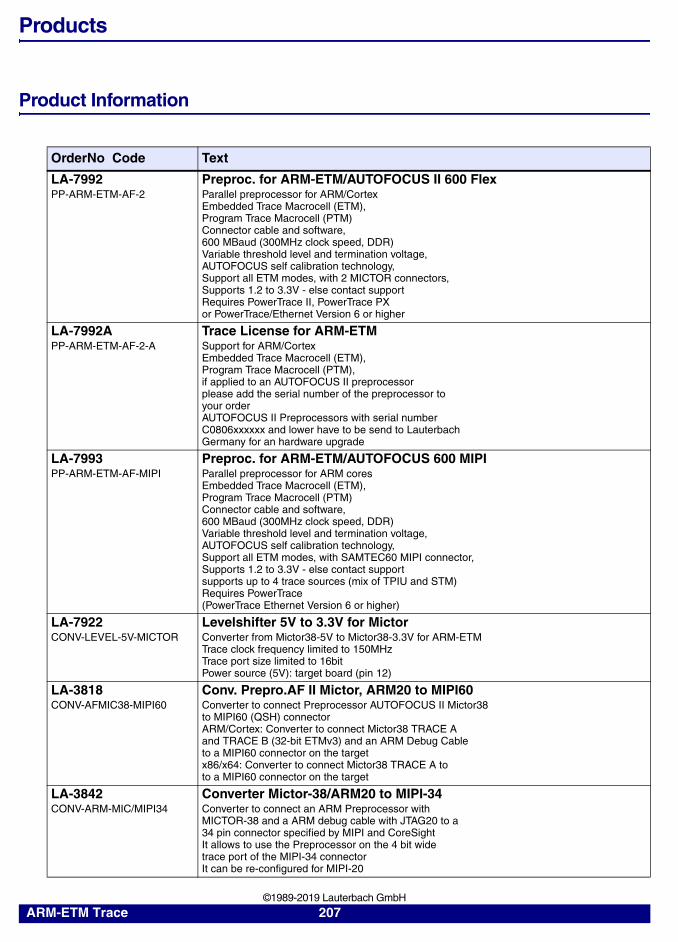
Products
Product Information
OrderNo Code Text
LA-7992 PP-ARM-ETM-AF-2
Preproc. for ARM-ETM/AUTOFOCUS II 600 FlexParallel preprocessor for ARM/CortexEmbedded Trace Macrocell (ETM),Program Trace Macrocell (PTM)Connector cable and software,600 MBaud (300MHz clock speed, DDR)Variable threshold level and termination voltage,AUTOFOCUS self calibration technology,Support all ETM modes, with 2 MICTOR connectors,Supports 1.2 to 3.3V - else contact supportRequires PowerTrace II, PowerTrace PXor PowerTrace/Ethernet Version 6 or higher
LA-7992A PP-ARM-ETM-AF-2-A
Trace License for ARM-ETMSupport for ARM/CortexEmbedded Trace Macrocell (ETM),Program Trace Macrocell (PTM),if applied to an AUTOFOCUS II preprocessorplease add the serial number of the preprocessor toyour orderAUTOFOCUS II Preprocessors with serial numberC0806xxxxxx and lower have to be send to LauterbachGermany for an hardware upgrade
LA-7993 PP-ARM-ETM-AF-MIPI
Preproc. for ARM-ETM/AUTOFOCUS 600 MIPIParallel preprocessor for ARM coresEmbedded Trace Macrocell (ETM),Program Trace Macrocell (PTM)Connector cable and software,600 MBaud (300MHz clock speed, DDR)Variable threshold level and termination voltage,AUTOFOCUS self calibration technology,Support all ETM modes, with SAMTEC60 MIPI connector,Supports 1.2 to 3.3V - else contact supportsupports up to 4 trace sources (mix of TPIU and STM)Requires PowerTrace(PowerTrace Ethernet Version 6 or higher)
LA-7922 CONV-LEVEL-5V-MICTOR
Levelshifter 5V to 3.3V for MictorConverter from Mictor38-5V to Mictor38-3.3V for ARM-ETMTrace clock frequency limited to 150MHzTrace port size limited to 16bitPower source (5V): target board (pin 12)
LA-3818 CONV-AFMIC38-MIPI60
Conv. Prepro.AF II Mictor, ARM20 to MIPI60Converter to connect Preprocessor AUTOFOCUS II Mictor38to MIPI60 (QSH) connectorARM/Cortex: Converter to connect Mictor38 TRACE Aand TRACE B (32-bit ETMv3) and an ARM Debug Cableto a MIPI60 connector on the targetx86/x64: Converter to connect Mictor38 TRACE A toto a MIPI60 connector on the target
LA-3842 CONV-ARM-MIC/MIPI34
Converter Mictor-38/ARM20 to MIPI-34Converter to connect an ARM Preprocessor withMICTOR-38 and a ARM debug cable with JTAG20 to a34 pin connector specified by MIPI and CoreSightIt allows to use the Preprocessor on the 4 bit widetrace port of the MIPI-34 connectorIt can be re-configured for MIPI-20
ARM-ETM Trace 207 ©1989-2019 Lauterbach GmbH
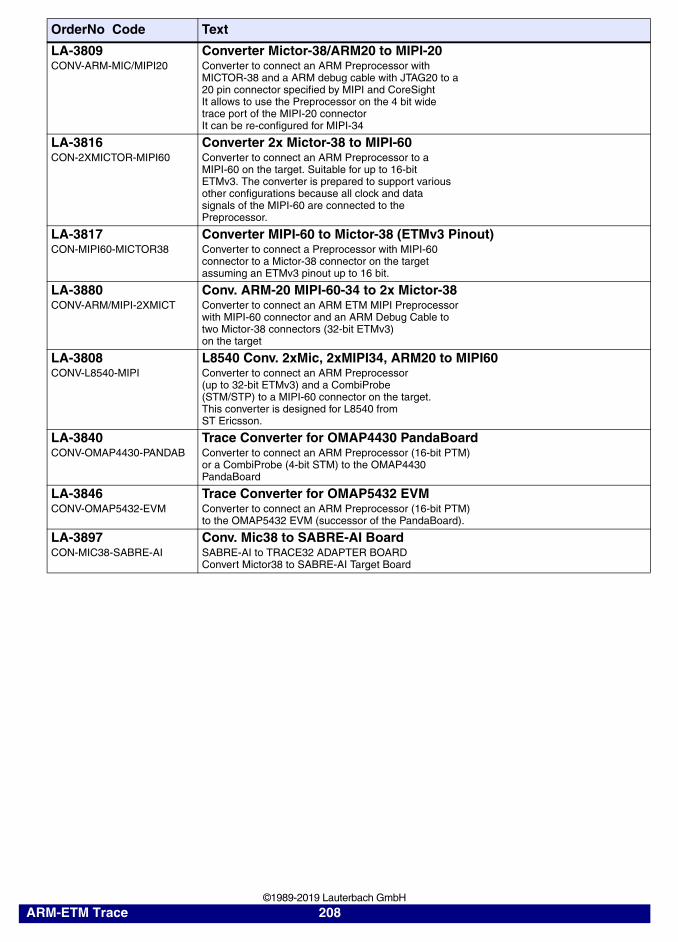
LA-3809 CONV-ARM-MIC/MIPI20
Converter Mictor-38/ARM20 to MIPI-20Converter to connect an ARM Preprocessor withMICTOR-38 and a ARM debug cable with JTAG20 to a20 pin connector specified by MIPI and CoreSightIt allows to use the Preprocessor on the 4 bit widetrace port of the MIPI-20 connectorIt can be re-configured for MIPI-34
LA-3816 CON-2XMICTOR-MIPI60
Converter 2x Mictor-38 to MIPI-60Converter to connect an ARM Preprocessor to aMIPI-60 on the target. Suitable for up to 16-bitETMv3. The converter is prepared to support variousother configurations because all clock and datasignals of the MIPI-60 are connected to thePreprocessor.
LA-3817 CON-MIPI60-MICTOR38
Converter MIPI-60 to Mictor-38 (ETMv3 Pinout)Converter to connect a Preprocessor with MIPI-60connector to a Mictor-38 connector on the targetassuming an ETMv3 pinout up to 16 bit.
LA-3880 CONV-ARM/MIPI-2XMICT
Conv. ARM-20 MIPI-60-34 to 2x Mictor-38Converter to connect an ARM ETM MIPI Preprocessorwith MIPI-60 connector and an ARM Debug Cable totwo Mictor-38 connectors (32-bit ETMv3)on the target
LA-3808 CONV-L8540-MIPI
L8540 Conv. 2xMic, 2xMIPI34, ARM20 to MIPI60Converter to connect an ARM Preprocessor(up to 32-bit ETMv3) and a CombiProbe(STM/STP) to a MIPI-60 connector on the target.This converter is designed for L8540 fromST Ericsson.
LA-3840 CONV-OMAP4430-PANDAB
Trace Converter for OMAP4430 PandaBoardConverter to connect an ARM Preprocessor (16-bit PTM)or a CombiProbe (4-bit STM) to the OMAP4430PandaBoard
LA-3846 CONV-OMAP5432-EVM
Trace Converter for OMAP5432 EVMConverter to connect an ARM Preprocessor (16-bit PTM)to the OMAP5432 EVM (successor of the PandaBoard).
LA-3897 CON-MIC38-SABRE-AI
Conv. Mic38 to SABRE-AI BoardSABRE-AI to TRACE32 ADAPTER BOARDConvert Mictor38 to SABRE-AI Target Board
OrderNo Code Text
ARM-ETM Trace 208 ©1989-2019 Lauterbach GmbH
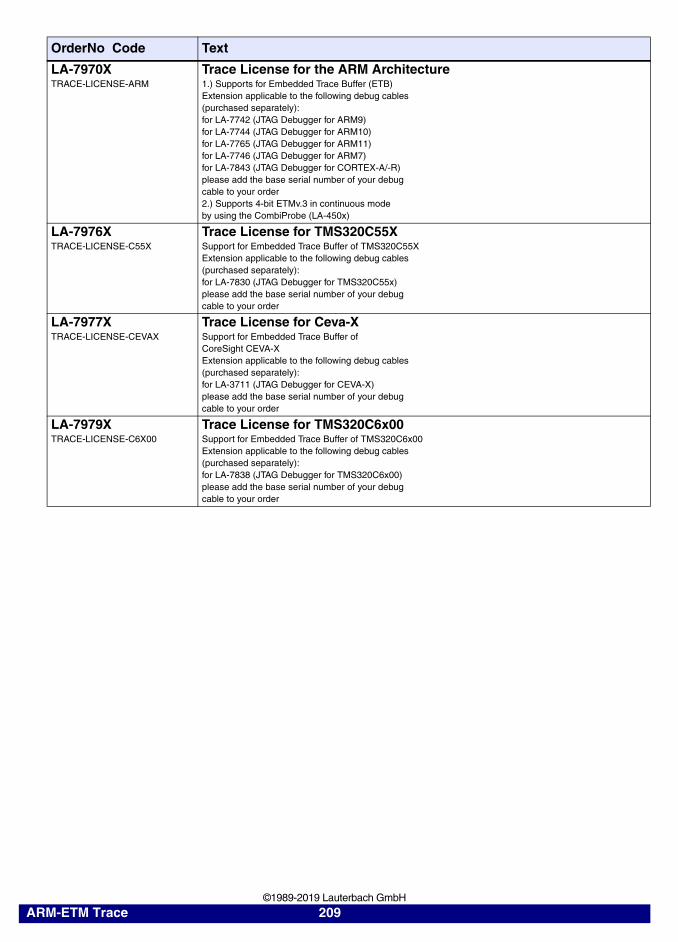
OrderNo Code Text
LA-7970X TRACE-LICENSE-ARM
Trace License for the ARM Architecture1.) Supports for Embedded Trace Buffer (ETB)Extension applicable to the following debug cables(purchased separately):for LA-7742 (JTAG Debugger for ARM9)for LA-7744 (JTAG Debugger for ARM10)for LA-7765 (JTAG Debugger for ARM11)for LA-7746 (JTAG Debugger for ARM7)for LA-7843 (JTAG Debugger for CORTEX-A/-R)please add the base serial number of your debugcable to your order2.) Supports 4-bit ETMv.3 in continuous modeby using the CombiProbe (LA-450x)
LA-7976X TRACE-LICENSE-C55X
Trace License for TMS320C55XSupport for Embedded Trace Buffer of TMS320C55XExtension applicable to the following debug cables(purchased separately):for LA-7830 (JTAG Debugger for TMS320C55x)please add the base serial number of your debugcable to your order
LA-7977X TRACE-LICENSE-CEVAX
Trace License for Ceva-XSupport for Embedded Trace Buffer ofCoreSight CEVA-XExtension applicable to the following debug cables(purchased separately):for LA-3711 (JTAG Debugger for CEVA-X)please add the base serial number of your debugcable to your order
LA-7979X TRACE-LICENSE-C6X00
Trace License for TMS320C6x00Support for Embedded Trace Buffer of TMS320C6x00Extension applicable to the following debug cables(purchased separately):for LA-7838 (JTAG Debugger for TMS320C6x00)please add the base serial number of your debugcable to your order
ARM-ETM Trace 209 ©1989-2019 Lauterbach GmbH
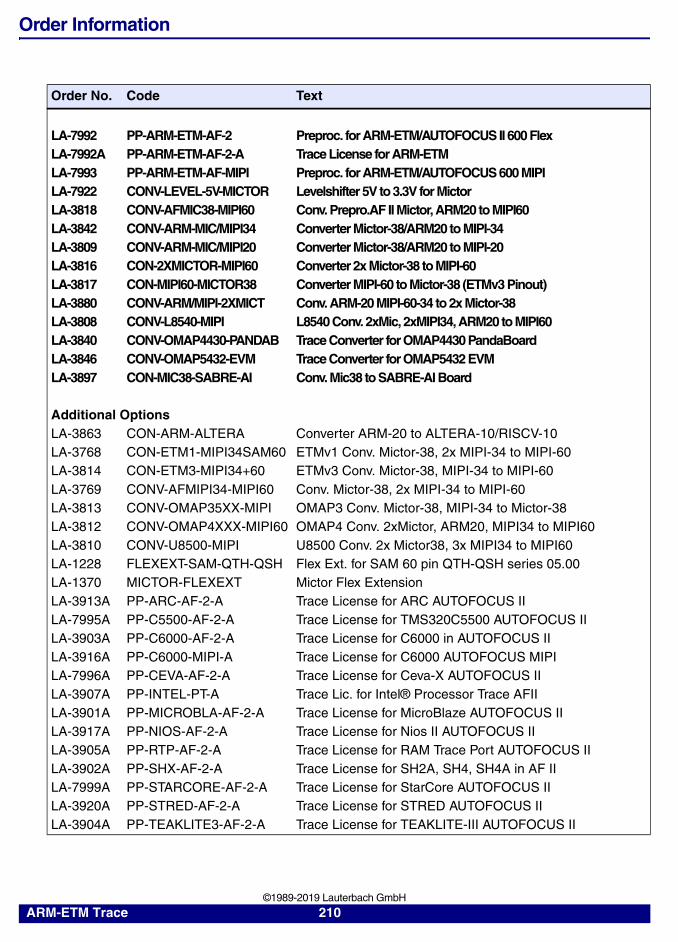
Order Information
Order No. Code Text
LA-7992 PP-ARM-ETM-AF-2 Preproc. for ARM-ETM/AUTOFOCUS II 600 FlexLA-7992A PP-ARM-ETM-AF-2-A Trace License for ARM-ETMLA-7993 PP-ARM-ETM-AF-MIPI Preproc. for ARM-ETM/AUTOFOCUS 600 MIPILA-7922 CONV-LEVEL-5V-MICTOR Levelshifter 5V to 3.3V for MictorLA-3818 CONV-AFMIC38-MIPI60 Conv. Prepro.AF II Mictor, ARM20 to MIPI60LA-3842 CONV-ARM-MIC/MIPI34 Converter Mictor-38/ARM20 to MIPI-34LA-3809 CONV-ARM-MIC/MIPI20 Converter Mictor-38/ARM20 to MIPI-20LA-3816 CON-2XMICTOR-MIPI60 Converter 2x Mictor-38 to MIPI-60LA-3817 CON-MIPI60-MICTOR38 Converter MIPI-60 to Mictor-38 (ETMv3 Pinout)LA-3880 CONV-ARM/MIPI-2XMICT Conv. ARM-20 MIPI-60-34 to 2x Mictor-38LA-3808 CONV-L8540-MIPI L8540 Conv. 2xMic, 2xMIPI34, ARM20 to MIPI60LA-3840 CONV-OMAP4430-PANDAB Trace Converter for OMAP4430 PandaBoardLA-3846 CONV-OMAP5432-EVM Trace Converter for OMAP5432 EVMLA-3897 CON-MIC38-SABRE-AI Conv. Mic38 to SABRE-AI Board
Additional OptionsLA-3863 CON-ARM-ALTERA Converter ARM-20 to ALTERA-10/RISCV-10LA-3768 CON-ETM1-MIPI34SAM60 ETMv1 Conv. Mictor-38, 2x MIPI-34 to MIPI-60LA-3814 CON-ETM3-MIPI34+60 ETMv3 Conv. Mictor-38, MIPI-34 to MIPI-60LA-3769 CONV-AFMIPI34-MIPI60 Conv. Mictor-38, 2x MIPI-34 to MIPI-60LA-3813 CONV-OMAP35XX-MIPI OMAP3 Conv. Mictor-38, MIPI-34 to Mictor-38LA-3812 CONV-OMAP4XXX-MIPI60 OMAP4 Conv. 2xMictor, ARM20, MIPI34 to MIPI60LA-3810 CONV-U8500-MIPI U8500 Conv. 2x Mictor38, 3x MIPI34 to MIPI60LA-1228 FLEXEXT-SAM-QTH-QSH Flex Ext. for SAM 60 pin QTH-QSH series 05.00LA-1370 MICTOR-FLEXEXT Mictor Flex ExtensionLA-3913A PP-ARC-AF-2-A Trace License for ARC AUTOFOCUS IILA-7995A PP-C5500-AF-2-A Trace License for TMS320C5500 AUTOFOCUS IILA-3903A PP-C6000-AF-2-A Trace License for C6000 in AUTOFOCUS IILA-3916A PP-C6000-MIPI-A Trace License for C6000 AUTOFOCUS MIPILA-7996A PP-CEVA-AF-2-A Trace License for Ceva-X AUTOFOCUS IILA-3907A PP-INTEL-PT-A Trace Lic. for Intel® Processor Trace AFIILA-3901A PP-MICROBLA-AF-2-A Trace License for MicroBlaze AUTOFOCUS IILA-3917A PP-NIOS-AF-2-A Trace License for Nios II AUTOFOCUS IILA-3905A PP-RTP-AF-2-A Trace License for RAM Trace Port AUTOFOCUS IILA-3902A PP-SHX-AF-2-A Trace License for SH2A, SH4, SH4A in AF IILA-7999A PP-STARCORE-AF-2-A Trace License for StarCore AUTOFOCUS IILA-3920A PP-STRED-AF-2-A Trace License for STRED AUTOFOCUS IILA-3904A PP-TEAKLITE3-AF-2-A Trace License for TEAKLITE-III AUTOFOCUS II
ARM-ETM Trace 210 ©1989-2019 Lauterbach GmbH
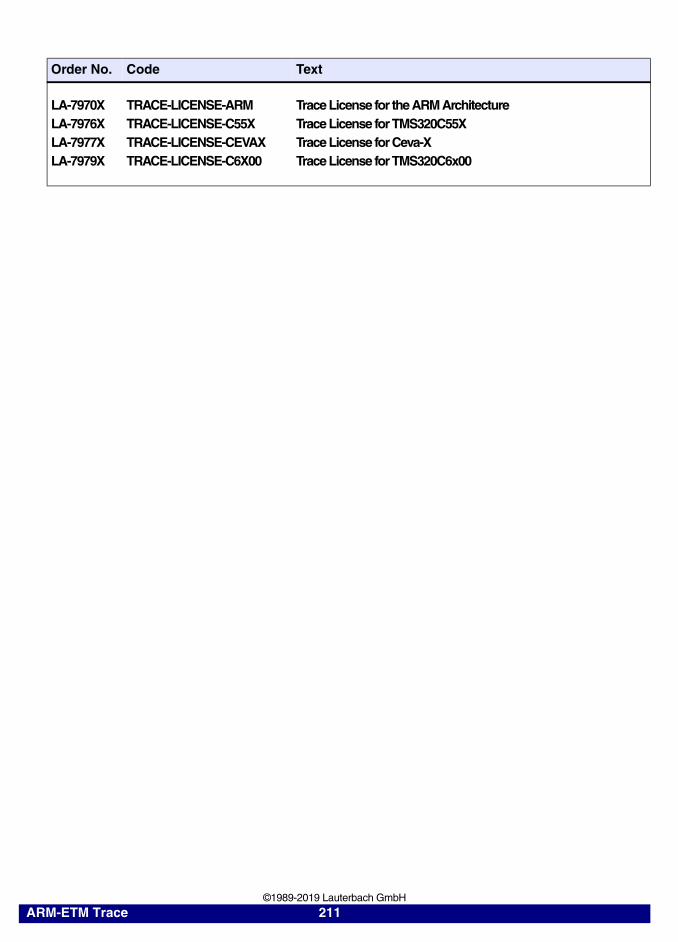
Order No. Code Text
LA-7970X TRACE-LICENSE-ARM Trace License for the ARM ArchitectureLA-7976X TRACE-LICENSE-C55X Trace License for TMS320C55XLA-7977X TRACE-LICENSE-CEVAX Trace License for Ceva-XLA-7979X TRACE-LICENSE-C6X00 Trace License for TMS320C6x00
ARM-ETM Trace 211 ©1989-2019 Lauterbach GmbH


![SH2, SH3 and SH4 Debugger - Lauterbach · SH2, SH3 and SH4 Debugger 10 ©1989-2020 Lauterbach GmbH Enable 8-bit AUD Trace Interface of SH4-202 The CPUs AUD trace lines AUD[7..4] are](https://static.fdocuments.us/doc/165x107/5fb904018f400302fc36e759/sh2-sh3-and-sh4-debugger-lauterbach-sh2-sh3-and-sh4-debugger-10-1989-2020.jpg)