
Arlington School Board - Arlington County Civic Federation
15
1 December 5, 2006 Arlington Public Schools: Progress, Prospects & Potential Arlington Public Schools: Progress, Prospects & Potential Arlington School Board Presentation to the Arlington Civic Federation Progress & Comparisons Progress & Comparisons Cost Per Pupil Comparison Cost Per Pupil Comparison $0 $2,000 $4,000 $6,000 $8,000 $10,000 $12,000 $14,000 $16,000 $18,000 $20,000 FY 2007 $18,232 $17,958 $17,700 $13,446 $12,853 $12,036 $12,023 $10,378 $10,332 FY 2006 $15,871 $16,464 $16,020 $12,549 $11,915 $10,775 $11,379 $9,374 $9,638 Alexandria City Arlington County Falls Church City Montgomery County Fairfax County Manassas City Loudoun County Prince William County Prince George's County Washington Area Boards of Education (WABE), November 2006
Transcript of Arlington School Board - Arlington County Civic Federation
1
December 5, 2006
Arlington Public Schools: Progress, Prospects & PotentialArlington Public Schools: Progress, Prospects & Potential
Arlington School Board
Presentation to theArlington Civic Federation
Progress & ComparisonsProgress & Comparisons
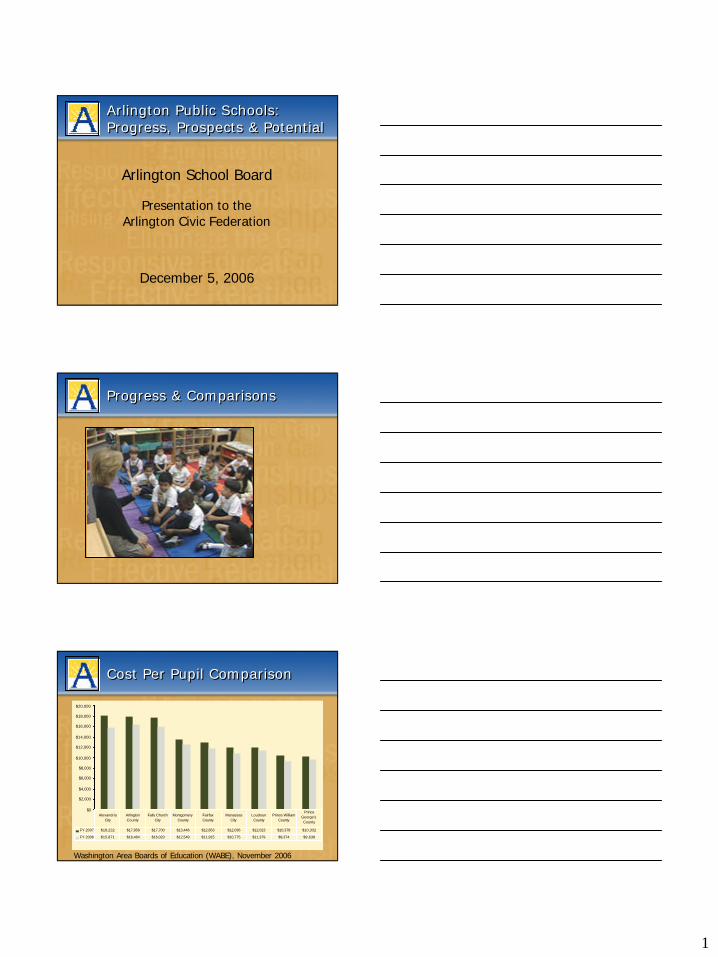
Cost Per Pupil ComparisonCost Per Pupil Comparison
$0
$2,000
$4,000
$6,000
$8,000
$10,000
$12,000
$14,000
$16,000
$18,000
$20,000
FY 2007 $18,232 $17,958 $17,700 $13,446 $12,853 $12,036 $12,023 $10,378 $10,332
FY 2006 $15,871 $16,464 $16,020 $12,549 $11,915 $10,775 $11,379 $9,374 $9,638
Alexandria City
Arlington County
Falls Church City
Montgomery County
Fairfax County
Manassas City
Loudoun County
Prince William County
Prince George's County
Washington Area Boards of Education (WABE), November 2006

2
Average Class Size ComparisonAverage Class Size Comparison
Washington Area Boards of Education (WABE), November 2006
Salary Information ComparisonSalary Information Comparison
School DivisionContract Length
Hours perDay
Step 1 + Bachelors
Degree Average
Step 9 + Masters Degree Maximum
Beginning Hourly
Maximum Hourly
Alexandria City 192 7.25 $42,040 $61,956 $63,642 $91,633 $14.23 $23.51Arlington County 200 7.50 $42,040 $69,156 $64,001 $96,983 $13.37 $26.14
Fairfax County 194 7.50 $42,400 $62,638 $58,067 $88,394 $12.15 $26.67Falls Church City 200 7.50 $39,211 $61,780 $59,489 $91,353 $13.99 $24.69Loudoun County 197 7.00 $40,986 $58,540 $56,271 $90,668 $13.88 $25.85Manassas City 200 7.50 $40,838 $58,867 $55,303 $88,972 $11.88 $20.79Montgomery County 195 8.00 $42,176 $66,611 $61,544 $94,179 $14.87 $23.59
Prince George's County 192 7.50 $41,410 $54,980 $58,253 $84,813 $13.36 $25.32Prince William County 195 7.00 $40,788 $53,413 $55,245 $86,372 $13.21 $24.78
Teacher Salary Instructional Ass't.
Washington Area Boards of Education (WABE), November 2006
Student DemographicsStudent Demographics
School Division
Dropout
Rate1
Students Eligible
Percent of District Enrollment
Alexandria City 84.0% 4.5% 6,334 61.6%Arlington County 87.0% 2.4% 6,462 35.4%Fairfax County 93.0% 2.7% 32,540 19.8%Falls Church City 92.0% 0.0% 162 8.5%Loudoun County 92.0% 1.3% 5,575 11.0%
Manassas City 78.0% 1.2% 1,512 23.0%Montgomery County3 94.3% 1.8% 30,720 22.0%Prince George's County 62.0% 4.1% 58,162 42.1%Prince William County 85.0% 1.7% 17,883 25.3%
1 2004-2005 School Year.2 FY 2007 Approved.3
As of Oct 31, 2005.
Free or Reduced Price Lunch Eligibility2Percent of Graduates Going on to
Postsecondary
Education1
Washington Area Boards of Education (WABE), November 2006

3
SAT ScoresSAT Scores
School DivisionAverage
Math
Average Critical
Reading*Average Writing Total
Percent of Seniors Taking
Tests
Alexandria City 509 512 509 1,530 62.5%
Arlington County 545 544 531 1,620 72.0%Fairfax County1
563 545 535 1,643 76.0%Falls Church City 577 568 564 1,709 75.0%Loudoun County 528 525 508 1,561 76.5%Manassas City 529 520 507 1,556 42.7%
Montgomery County 558 539 537 1,634 75.8%Prince George's County 425 437 N/A N/A 55.0%Prince William County 504 507 493 1,504 43.7%
*Formerly verbal.1Percent of seniors taking tests is SY 2004-2005 data.
Washington Area Boards of Education (WABE), November 2006
Recent APS RecognitionsRecent APS Recognitions
• Named to top 16% public school systems by Expansion Management
• Recognized as “2005-06 Super System” by Southern Association of Schools & Colleges Council on Accreditation & School Improvement
• All 4 high schools in Newsweek’s “Top High Schools in America” – 4 th consecutive year
• Gunston MS received Wingspan Arts Best Documentary award in Film Festival at Lincoln Center for its student-produced claymation
• Wakefield received College Board’s 2006 Inspiration Award
Recognitions, continuedRecognitions, continued
• Wakefield’s I t’s Academic team captured Scholastic Bowl National District Championship for 4th consecutive year
• ATS Nature Girls environment club received County Dept of Environmental Services award for recycling & environmental ed efforts
• Barrett received $10,000 Toyota Tapestry award recognizing innovative teachers
• Tuckahoe received “Sea World/Busch Gardens/ Fujifilm Environmental Excellence Award”

4
Recognitions, continuedRecognitions, continued
• Taylor’s fifth grade Odyssey of the American Mind team competed at Iowa State University for world title.
• Yorktown debate team won VHSL AAA State Championship
• Yorktown Girls Swim & Dive Team won First Place in VHSL State Championship
• Career Center students in TV production program took 1st, 2nd, & 3rd place in Virginia State Skills USA competition
• Students at H-B Woodlawn & Wakefield received six Cappies (Critics & Awards Program) awards at the Kennedy Center
Progress: AYP, NCLB, Assets and Program EvaluationProgress: AYP, NCLB, Assets and Program Evaluation
Making AYP in 2006Making AYP in 2006
Up to 29 targets depending on group size larger than 50 students:
White Black HispanicLEP Disabilities F/R Lunchand All Students
Students may count in more than one group.

5
Making AYP in 2006 More DifficultMaking AYP in 2006 More Difficult
• AYP Reading targets increased from 65% to 69%
• AYP Mathematics targets increased from 63% to 67%
• Testing in Reading and Mathematics was expanded at the elementary school level to include Grade 4, along with Grades 3 and 5
• Testing in Reading and Mathematics was expanded at the middle school level to include Grades 6 and 7, along with Grade 8
• 9 schools did not make AYP (11 in 2004-2005)
• 3 elementary schools did not make AYP (7 in 2004-2005)
Making AYP in 2006Making AYP in 2006
• 2 schools (Abingdon and Barrett) that had been under NCLB sanctions made AYP for the second consecutive year and are out of sanctions
• 2 schools (Carlin Springs and Randolph) that are under NCLB sanctions made AYP for the first year, if they make AYP this year then they will be out of sanctions
• There are no NCLB sanctions for non-Title I schools that do not make AYP
Making AYP in 2006Making AYP in 2006

6
Planning to Make AYP in 2007Planning to Make AYP in 2007
• APS Strategic Plan
• APS Improvement Plan for Reading• School Management Plan
• School Improvement Plan
School-Based: Data AnalysisSchool-Based: Data Analysis
• Data analysis of test scores, individual student performance, question analysis, and identification of targeted students
• Continued role of Lead Teacher Leadership Team for data analysis and strategic planning
• Targeting instructional materials to students’instructional levels
• Increased use of monitoring checklists to track individual student’s services
• Ongoing use of diagnostic assessments in reading and math for instructional decision-making
School-Based: StrategiesSchool-Based: Strategies
• Analysis of past strategies and their impact on student success
• Increased use of instructional checklists• Continued study of exemplary project impact on
student success -- review and revision• Focused “literacy” nights to involve parents• Consistent implementation of SOL remediation at
the elementary level through the use of the Voyager program for Reading and Math Buddiesfor Mathematics
• Continued implementation of before and after school programs such as Project GO and HOTS
7
School-Based: Professional DevelopmentSchool-Based: Professional Development
• Participation in central office professional development and remediation programs and activities
• Continued use of staff meeting time for professional development
• School-based professional development focus such as Teachers as Readers
• Department and grade level meetings focused on instruction and performance
Central Office Support Targeted to Schools Not Making AYPCentral Office Support Targeted to Schools Not Making AYP
• Focused, consistent professional development such as Early Reading Strategies Institute (ERSI), Guided Reading and Writing, Math Investigations, and Lucy Calkins Primary Writing
• Focused, consistent remediation that is tied to the instructional program
• Continued collaboration between the Departments of Instruction and Student Services on the delivery of reading instruction
Central Office Support Targeted to Schools Not Making AYP
Central Office Support Targeted to Schools Not Making AYP
• Increased targeted support to schools for continuity of instruction both across and within grades
• Targeted support for new teachers through modeling and coaching
• Last year, adopted K-12 textbooks in mathematics and 6-12 textbooks in English, including materials for special education and ESOL/HILT
• This year, evaluation of K-5 English materials in reading and writing, again including special education and ESOL

8
Follow-up to Program Evaluation: Selected ExamplesFollow-up to Program Evaluation: Selected Examples
• Elementary English Language Arts & Title I(Fall 2006)– Adopting teaching materials based on
evaluation findings (e.g., inclusion of explicit instruction of oral language)
– Professional development courses workshops offered in areas of weakness (e.g., writing process, grade 4 guided reading)
Follow-up to Program Evaluation: Selected ExamplesFollow-up to Program Evaluation: Selected Examples
• School & Community Relations Department (Spring 2006)– Communicated results of “Secret Shopper”
visits and calls to all schools for principal follow-up
– Customer Service training provided for: • All administrators• Transportation Staff• Coaching Staff• Other school staff
Follow-up to Program Evaluation: Selected ExamplesFollow-up to Program Evaluation: Selected Examples
• Immersion (Spring 2006)– Specific staff development on:
• Implementation of consistent reading program aligned with APS reading program
• Development and implementation of a consistent Spanish language arts curriculum

9
Follow-up to Program Evaluation: Selected ExamplesFollow-up to Program Evaluation: Selected Examples
• Mathematics (Spring 2005)– Focused Professional Development for teachers on
Investigations Approach
– Introduced new K-12 teaching materials based on program evaluation
Follow-up to Program Evaluation: Selected ExamplesFollow-up to Program Evaluation: Selected Examples
• Secondary English Language Arts (Spring 2005)– Curriculum development to remedy
reported weaknesses in explicit reading and writing instruction
– Professional development to remedy reported weaknesses in explicit reading and writing instruction
Then and Now: Asset LevelsThen and Now: Asset Levels
2001 2003 2006 Average 19 19 20
0 to 10 Assets 15% 14% 11% 11 to 20 Assets 44% 44% 44% 21 to 30 Assets 33% 33% 35% 31 to 40 Assets 8%
8% 10%
Arlington Partnership on Children, Youth and Families, 2006

10
Young People Are “Better Off”Comparing survey data from 2001 and 2006Young People Are “Better Off”Comparing survey data from 2001 and 2006
• Significantly more young people reported:– 13 of 40 assets (five of the external assets and eight of
the internal assets)– 2 of 8 thriving behaviors (maintaining good health and
overcoming adversity)
• Significantly fewer young people reported– 3 of 10 high-risk behaviors (depression/suicide,
antisocial behavior, and school problems.)
– 2 of 5 developmental deficits (being left home alone or TV overexposure)
• Other indicators showed no significant change
Arlington Partnership on Children, Youth and Families, 2006
Assets Affect BehaviorAssets Affect Behavior
9
5
3
1
0123456789
10
0 to 10Assets
11 to 20Assets
21 to 30Assets
31 to 40Assets
Number of RiskBehaviors
Low-asset youth report far more risk behaviors.
Arlington Partnership on Children, Youth and Families, 2006
High-Asset Youth Have Higher GPAsHigh-Asset Youth Have Higher GPAs
• Study linked school records with Assets (GPA is not self-reported)
• Study controlled for gender, race, ethnicity family composition, and SES
2.1
3.2
0
0.5
1
1.5
2
2.5
3
3.5
0 to 10Assets
31 to 40Asset
GPA
Boosting Student Achievement http://www.search-institute.org/research/Insights
Arlington Partnership on Children, Youth and Families, 2006

11
Changes in School-Related AssetsChanges in School-Related Assets
3228
48 46
3528
50 52
0
10
20
30
40
50
60
Caring schoolclimate
Parentinvolvement
Schoolboundaries
Highexpectations
20012006
External Assets Arlington Partnership on Children, Youth and Families, 2006
Changes in School-Related AssetsChanges in School-Related Assets
6451
65
50
30
6857
64 62
32
01020304050607080
Ach
ieve
men
tm
otiv
atio
n
Scho
olen
gage
men
t
Hom
ewor
k
Bon
ding
tosc
hool
Rea
ding
for
plea
sure
20012006
Internal Assets Arlington Partnership on Children, Youth and Families, 2006
Survey Questions Related to Teachers’ BehaviorsSurvey Questions Related to Teachers’ Behaviors
4752
454950
56
0
10
20
30
40
50
60
2001 2006
Teachers really care
Lots of encouragement
Teachers expect mybest
Arlington Partnership on Children, Youth and Families, 2006

12
Measuring Parent InvolvementSearch bases the asset on these four questions.Measuring Parent InvolvementSearch bases the asset on these four questions.
• Helping with school work• Talking to student about what he/she is
doing in school• Asking about homework• Going to meetings or events at school
Note: To have this asset, young people must have parents who do all of these things!
Arlington Partnership on Children, Youth and Families, 2006
Changes in Asset ComponentsChanges in Asset Components
• No statistically significant changes in assets from 2001 to 2006
• Did see offsetting changes in questions– Increases for 6th grade– Decreases for 12th grade
• Fewer parents helping with school work, all grade levels
37
82
72
59
29
76
69
53
0
10
20
30
40
50
60
70
80
90
Help Talk Ask Attend
20012006
Parents of seniors
Key problem with parent involvement is that parents don’t know how to be supportive of older teens –they have grown less supportive over time.
Arlington Partnership on Children, Youth and Families, 2006
Rising Achievement: Closing the GAPRising Achievement: Closing the GAP

13
TotalWhiteHispanicBlackAsianYear8795787290200689968273932005
65824737691998718652467319997589575079200078916657822001829369638720028595746789200387967570902004
%Passed
Raise achievement and eliminate gaps: SOL results
TotalWhiteHispanicBlackAsianYear
172352006
87957872902006
142332005
89968273932005
% Point Gap
65824737691998718652467319997589575079200078916657822001829369638720028595746789200387967570902004
%Passed
354513199834401319993239102000253492001243082002212862003212662004
Raise achievement and eliminate gaps: SOL results
Raise Achievement & Eliminate Gaps: SOL ResultsRaise Achievement & Eliminate Gaps: SOL Results
Combined Results for Black, Hispanic & White StudentsGr. 3, 5, 8, and End of Course SOL Pass Rates
0
0.2
0.4
0.6
0.8
1
200620052004200320022001200019991998
Per
cen
t P
assi
ng
Black White Hispanic

14
• Must admit that you have a problem– Put data front-and-center and present in a form
that all can understand– Measure and report progress consistently
• Goal must be a priority for everyone– Must be addressed by every school and every
teacher– Must be reflected in system, school, department,
administrator and teacher plans
• Interventions must be early, consistent and address key variables
To Effectively Address Achievement Gaps:To Effectively Address Achievement Gaps:
ü Expectationsü Quality of teaching &
classroom interactionsü Access to opportunitiesü Support, involvement of
parents & community
Key Variables in Eliminating Achievement GapsKey Variables in Eliminating Achievement Gaps
Strategic Plan
Department Plans
School Improvement Plans
School Management PlansAdministrator Work Plans
Teacher PDPsAdministrator Work Plans
Planning and Management ProcessPlanning and Management Process

15
Environmental LandscapeEnvironmental Landscape
December 5, 2006
Arlington Public Schools: Progress, Prospects & PotentialArlington Public Schools: Progress, Prospects & Potential
Arlington School Board
Presentation to theArlington Civic Federation