ARLA FOODS ANNUALRESULTS 2017 - LandbrugsAvisen · Profit appropriation for 2017 with proceeds from...
17
ARLA FOODS ANNUAL RESULTS Press conference February 21st 2018 2017
Transcript of ARLA FOODS ANNUALRESULTS 2017 - LandbrugsAvisen · Profit appropriation for 2017 with proceeds from...
ARLA FOODS ANNUAL RESULTS
Press conferenceFebruary 21st 2018
2017
2 Sources: IMF (GDP growth); MSCI
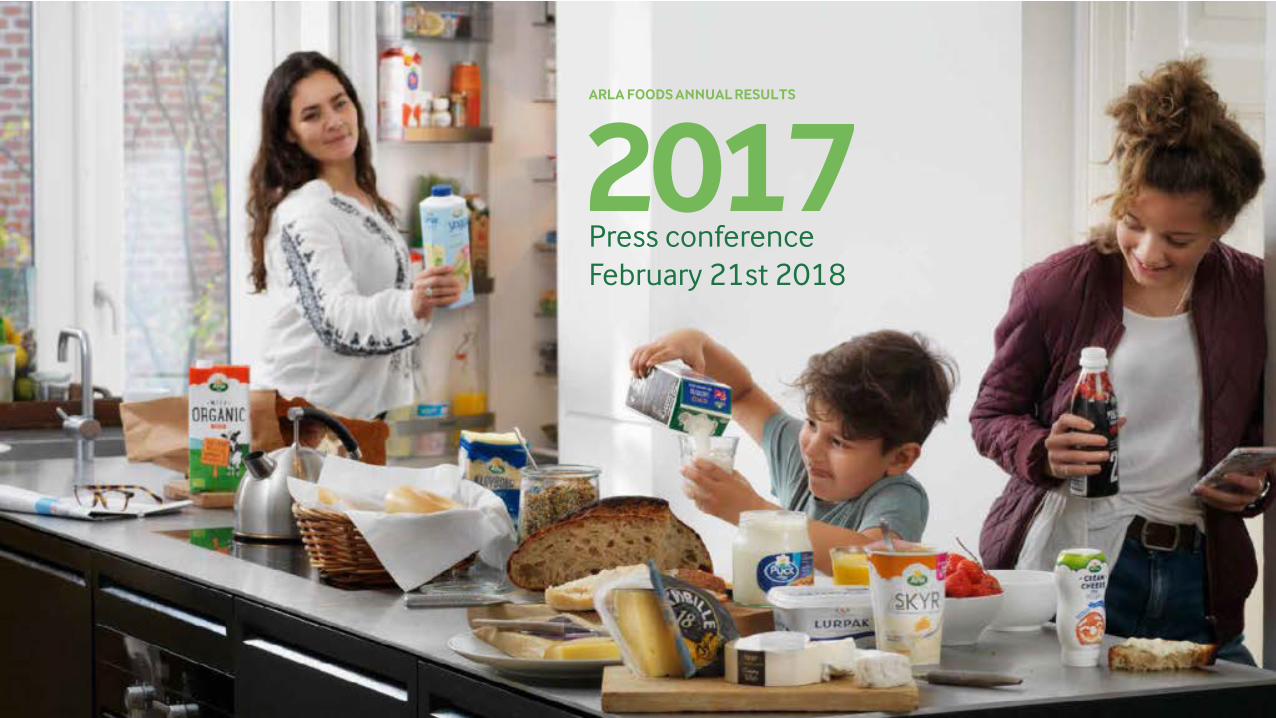
HIGHLIGHTS: External trends in 2017
8
6
4
02017
2
3
4
5tEUR/Ton
tEUR/Ton
20172016
2016
Fat
Protein
47%
-27%
6.8%
Den
mar
k
Ger
man
y
Russ
ia
1.9%
Chi
na
Nig
eria
0.8%2.0% 1.8%
Wor
ld
3.6%
Euro
peUS
2.2%1.7%
Swed
en
2.2%
UK
3.1%
Saud
i Ara
bia
0.1%
Peak in dairy
commodity prices
Fat shortage increased fat price
Strong economic
growth
Firm market
develop-ment
Yellow cheese commodity prices in EU
Fat and protein pricesGross domestic product in 2017% growth vs 2016
53414996106
201620152013 2014
+29.1%
2017
Average OPEC crude oil priceUSD/barrel

3
HIGHLIGHTS: Internal trends in 2017
20162015
3.72.4
2014
2.63.3
2017
3.0%
2016 2017
2.1%
2014
5.2%
2015
3.4%
20
25
30
35
40
20172016
27%
Arla’s prepaid milk priceEURc/KG
Prepaid up 27% in
2017
Strong branded growth
Increased complexity
drives costs
Volume driven revenue growth%
Conversion costsix
LeverageNIBD incl. pensions / EBITDA
Strong balance
sheet
Opening of our Global Innovation Centre in Aarhus
GG2020
9998
201720162015
104

2017Performance at a glance
Profit share1
2.8%OF REVENUE
•Target 2017 2.8-3.2%
201720162015
2.8%3.6%
2.8%
Revenue
10.3BILLION EUR
•Target 2017 EUR 10 - 10.5 billion
201720162015
10.39.6
10.3
Milk volumeBILLION KG
13.92016
14.22015
13.92017
Performance priceEURc/KG
38.12017
2015
33.7
2016
30.9
2017
38.1
4 1Based on profit allocated to owners of Arla Foods amba.

5
2017 milk inflow unchanged compared to 2016, however very volatile year
1.7
11.8
2013 2015
12.5
2014
9.5
13.9
2017
1.6
2016
13.9
12.4
1.812.7
14.2
3.2
13.61.6
12.3
+0.5%Owner milk
Other milk
Note that development is impacted by mergers (UK and Central Europe)1Including Belgium, Luxembourg and Netherlands
2016 2017% % mKG
Denmark 0.5% 2.1% 4,827UK -3.3% -0.2% 3,203Sweden -4.3% -2.8% 1,855Germany 1.0% 0.1% 1,759Other owner milk1 -2.8% 2.0% 729Other milk -10.2% 0.6% 1,564Total -2.2% 0.5% 13,937
Inflow of raw milkbKG
Inflow of raw milk by country
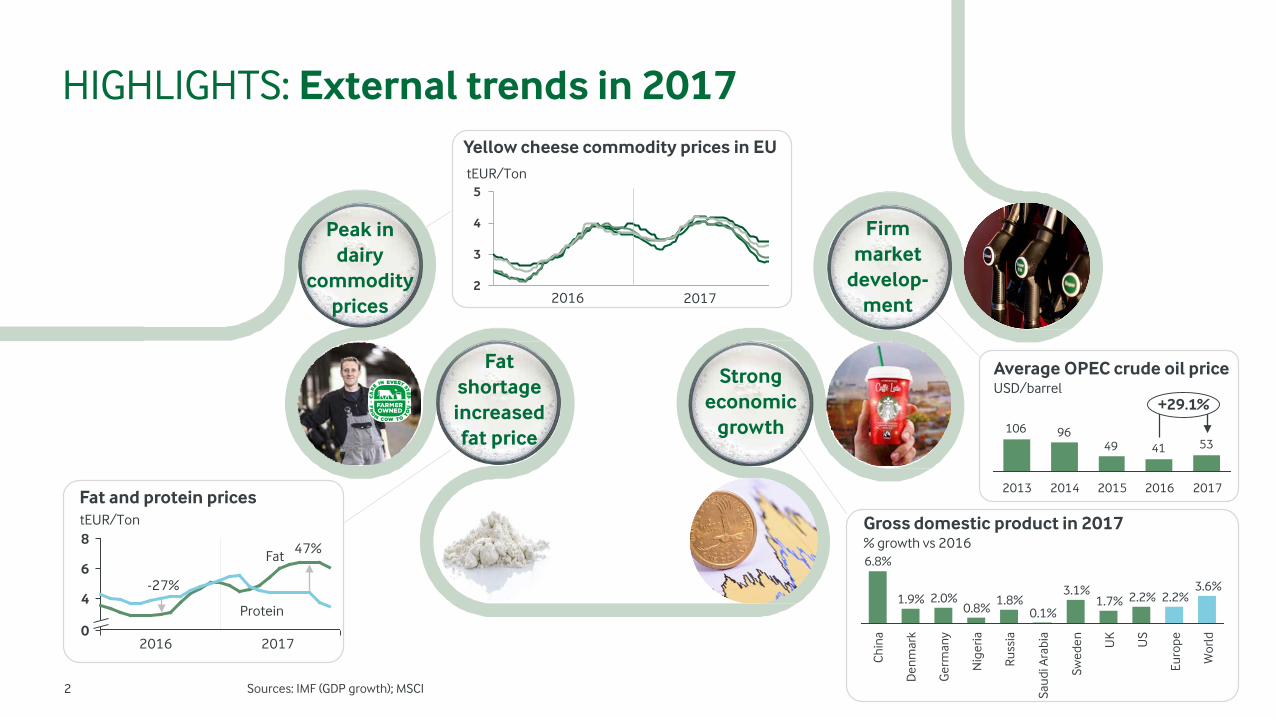
Performance price improved 23% in 2017 and averaged 38.1 EURc/KG
6
38.2
O D
34.2
35.3 35.5
F J
33.6 33.4
36.1
M SJA
38.2
37.3
A
34.735.3
MJ N
38.3
Performance priceEURc/KG
38.12017
201520142013 20172016
41.0
33.7
41.7
38.1
30.9
Performance priceEURc/KG
Prepaid milk price month by month in 2017EURc/KG
6

44.6%
Brand share 1
•Target 2020 > 45%
201720162015
44.6%44.5%
42.1%
3.0%
Strategic branded volume driven revenue growth
201720162015
3.4% 5.2% 3.0%
•Target 2017 1-3%
20.2%
International share2
•Target 2020 > 20%
201720162015
20.2%19.7%
18.1%
2017Quality of business
7 1Brand share calculated as share of total revenue; 2International share calculated as share of total retail and foodservice revenue

Brand share 2012-2017
Strong strategic branded revenue growth driven by both sales price and volume increases
2014
2015
44.5%
43.0%
2013
41.0%
2016
42.0%
44.6%
2017
8.3%528 mEUR
10.1%3,026 mEUR
6.8%339 mEUR
3.1%181 mEUR
5.5%476 mEUR
Supported brands1
Revenue growth of
10%Strategic branded
volume driven revenue growth
3.0%2016: 5.2%
Revenue development by brands
66%
Oth
. Sup
.
10%
Puck
4%
8%
Lurp
ak
12%
Arla
Cas
tello
2017 brand share split
8 1 Adjusted from the effect of sale of Rynkeby
ARLA
® B
RAND
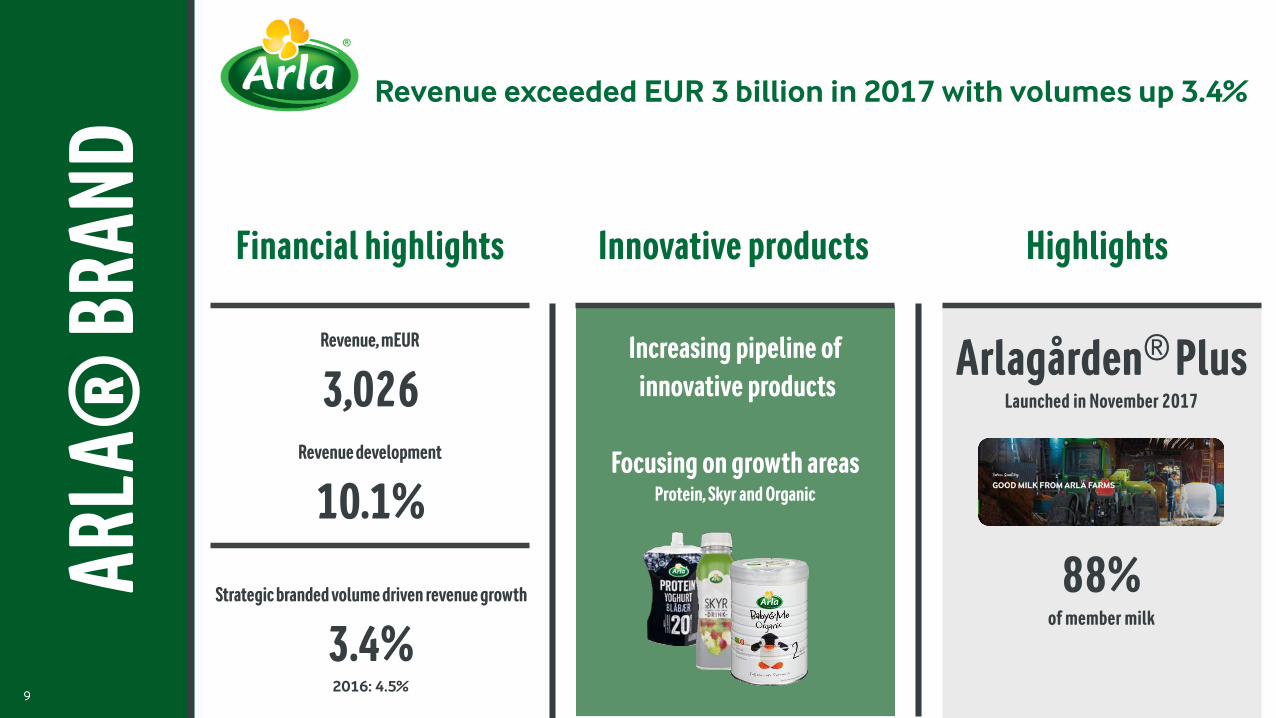
Revenue exceeded EUR 3 billion in 2017 with volumes up 3.4%
Strategic branded volume driven revenue growth
3.4%2016: 4.5%
Revenue, mEUR
3,026Revenue development
10.1%
Increasing pipeline ofinnovative products
Focusing on growth areasProtein, Skyr and Organic
Financial highlights Innovative products
Arlagården® PlusLaunched in November 2017
88%of member milk
Highlights
9
10
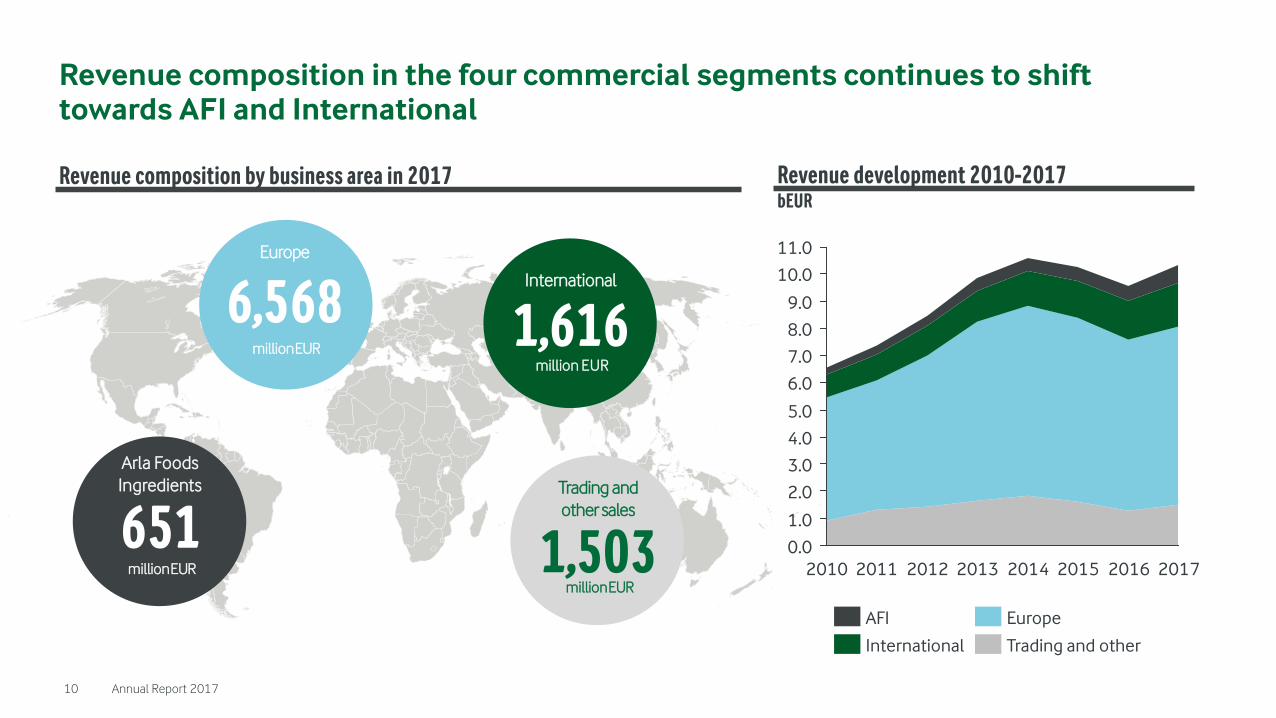
Revenue composition in the four commercial segments continues to shift towards AFI and International
Annual Report 2017
6,568Europe
millionEUR
Arla Foods Ingredients
millionEUR
1,616International
million EUR
1,503Trading and other sales
millionEUR
651
9.0
5.0
4.0
11.0
7.0
2.0
10.0
6.0
3.0
8.0
1.0
0.020122010 20152011 20172014 20162013
International Trading and other
EuropeAFI
Revenue composition by business area in 2017 Revenue development 2010-2017bEUR
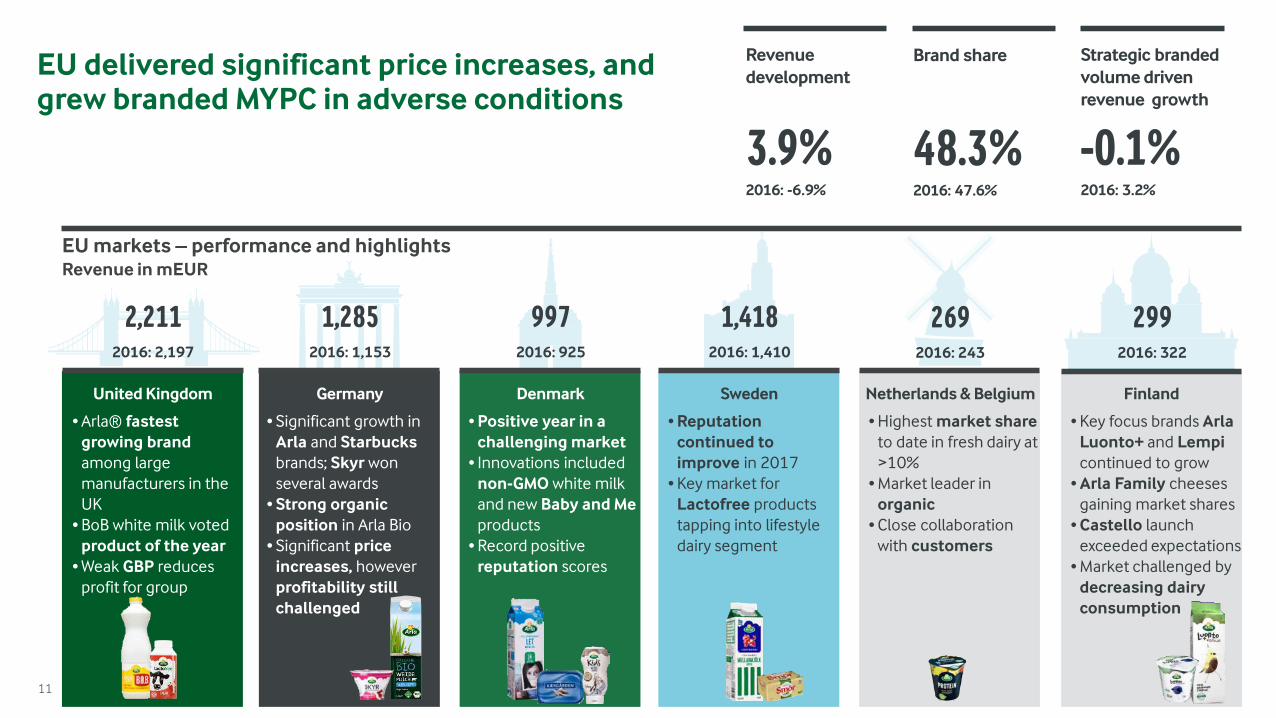
EU delivered significant price increases, and grew branded MYPC in adverse conditions
Germany Sweden
Strategic branded volume drivenrevenue growth
-0.1%2016: 3.2%
United Kingdom Denmark
Brand share
48.3%2016: 47.6%
Revenue development
3.9%2016: -6.9%
Netherlands & Belgium Finland
• Arla® fastest growing brand among large manufacturers in the UK
• BoB white milk voted product of the year
• Weak GBP reduces profit for group
• Significant growth in Arla and Starbucksbrands; Skyr won several awards
• Strong organic position in Arla Bio
• Significant price increases, however profitability still challenged
• Positive year in a challenging market
• Innovations included non-GMO white milk and new Baby and Me products
• Record positive reputation scores
• Reputation continued to improve in 2017
• Key market for Lactofree products tapping into lifestyle dairy segment
• Highest market share to date in fresh dairy at >10%
• Market leader in organic
• Close collaboration with customers
• Key focus brands Arla Luonto+ and Lempicontinued to grow
• Arla Family cheeses gaining market shares
• Castello launch exceeded expectations
• Market challenged bydecreasing dairy consumption
1,2852016: 1,153
2,2112016: 2,197
1,4182016: 1,410
9972016: 925
2692016: 243
2992016: 322
EU markets – performance and highlightsRevenue in mEUR
11
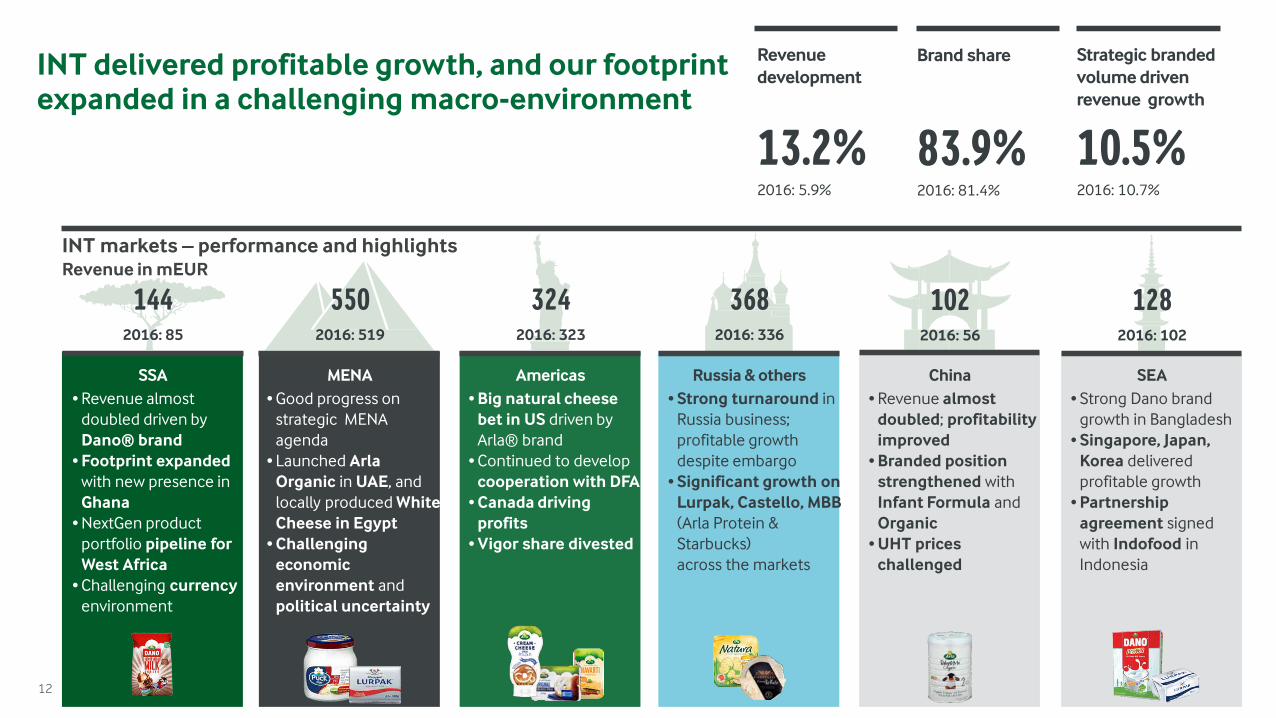
INT delivered profitable growth, and our footprint expanded in a challenging macro-environment
INT markets – performance and highlightsRevenue in mEUR
5502016: 519
MENA
1442016: 85
3682016: 336
3242016: 323
1022016: 56
Russia & others
Strategic branded volume drivenrevenue growth
10.5%2016: 10.7%
SSA Americas
Brand share
83.9%2016: 81.4%
Revenue development
13.2%2016: 5.9%
China SEA
1282016: 102
• Revenue almost doubled driven by Dano® brand
• Footprint expandedwith new presence in Ghana
• NextGen product portfolio pipeline for West Africa
• Challenging currency environment
• Good progress on strategic MENA agenda
• Launched Arla Organic in UAE, and locally produced White Cheese in Egypt
• Challenging economic environment andpolitical uncertainty
• Big natural cheese bet in US driven by Arla® brand
• Continued to develop cooperation with DFA
• Canada driving profits
• Vigor share divested
• Strong turnaround in Russia business; profitable growth despite embargo
• Significant growth on Lurpak, Castello, MBB (Arla Protein & Starbucks) across the markets
• Revenue almost doubled; profitability improved
• Branded position strengthened withInfant Formula and Organic
• UHT prices challenged
• Strong Dano brand growth in Bangladesh
• Singapore, Japan, Korea delivered profitable growth
• Partnership agreement signed with Indofood in Indonesia
12

AFI increased the value-added share of products
Share of value products
74%2016: 60%1
Revenue share of Arla Group total
6.3%2016: 5.7%
Revenue development
19.6%2016: 5.0%
Trading share of Group revenue
14.5%2016: 13.3%
Revenue development
18.0%2016: -20.5%
Trading revenue increased due to higher commodity prices
Volume of standard & value-add products
Revenue split by regions
651MILLIONEUR
Standard productsValue products
2017
74%
68%
2012
Index 100
Index 140
2017 2016
Europe and MEA
49% 47%
Asia 41% 40%
Americas 10% 13%
Mission statement officially launched:
“To discover and deliver all the wonders whey
can bring to people’s lives.”
13 1Share of value products in 2016 impacted by stock reduction exercise
Trading share of milk volume
20.2%2016: 20.1%
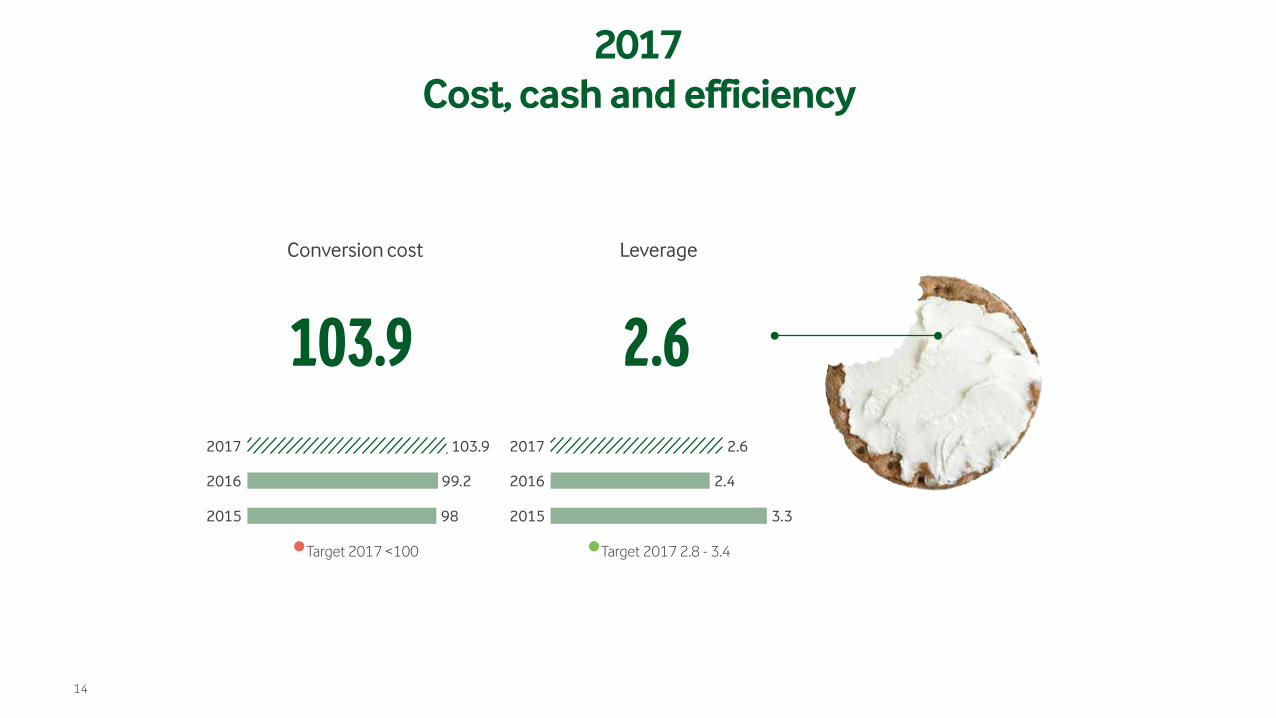
2017Cost, cash and efficiency
•Target 2017 <100 •Target 2017 2.8 - 3.4
2015 2015
2016 2016
2017 2017
98 3.3
99.2 2.4
103.9 2.6
Conversion cost
103.9
Leverage
2.6
14
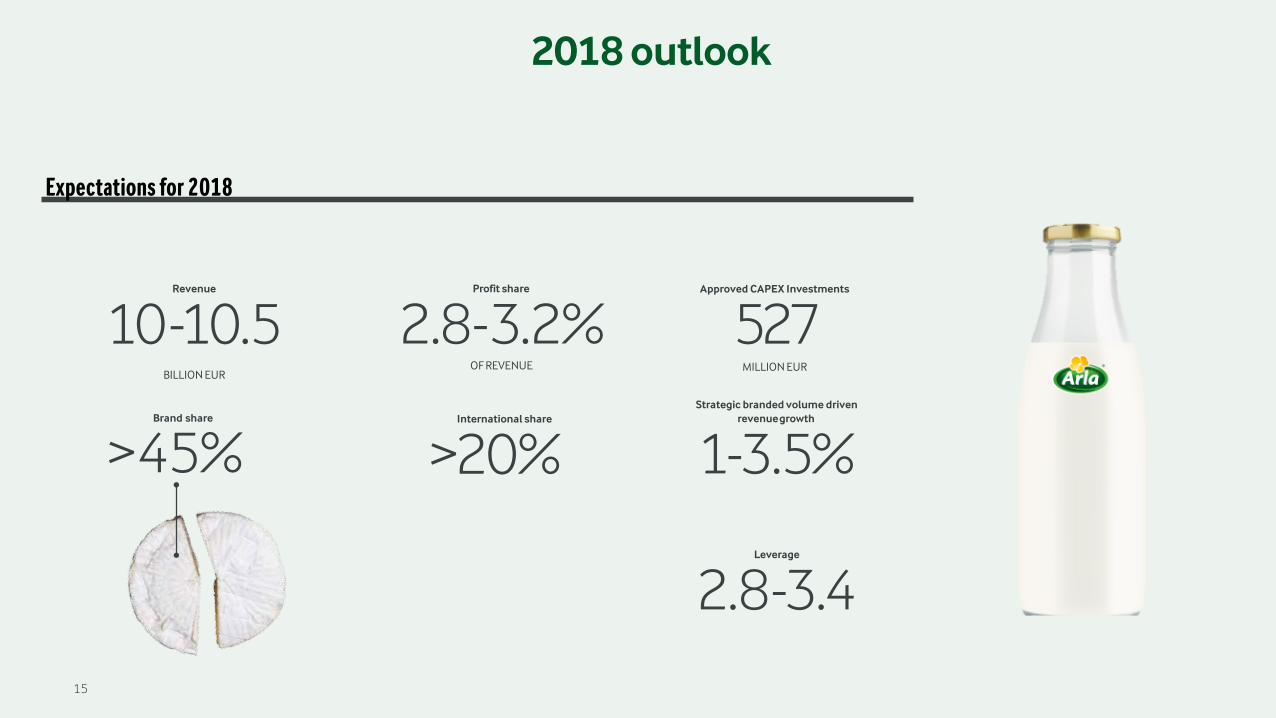
2018 outlook
Profit share
2.8-3.2%OF REVENUE
International share
>20%
Leverage
2.8-3.4
Revenue
10-10.5BILLION EUR
Strategic branded volume drivenrevenuegrowth
1-3.5%>45%
15
Brand share
Approved CAPEX Investments
527MILLION EUR
Expectations for 2018

BoD proposal on profit appropriation provides a supplementary payment equal to 1 EURc, and retainment of Vigor proceeds as common capital
Performance Price
38.1 EURc/kg
Prepaid Milk Price
35.8 EURc/kg
Profit for the year
2851 EURm
2.3 EURc/kg
Supplementary Payment
124 EURm
32 EURm
127 EURm
Common Capital
76 EURm
443 EURm
120 EURm
Individual Capital
38 EURm
Supplementary Payment: 1 EURc/kg owner milk
Consolidation principles:Common Capital 2/3Individual Capital 1/3
Consolidation
114 EURm
443 EURm
158 EURm
16
Profit appropriation for 2017 with proceeds from Vigor retained as common capital
1 Based on profit allocated to owners of Arla Foods amba; 2 Interest on contributed capital: 0.04 EURc/kg3 Gain on the divestment of associated company Vigor

ARLA FOODS ANNUAL RESULTS
Press conferenceFebruary 21st 2018
2017