Arkansas Labor Market Report · 2017-11-01 · Arkansas Labor Market Report September 2017 The...
19
www.discover.arkansas.gov Arkansas Labor Market Report September 2017
Transcript of Arkansas Labor Market Report · 2017-11-01 · Arkansas Labor Market Report September 2017 The...
www.discover.arkansas.gov
ArkansasLabor MarketReport
September 2017
www.discover.arkansas.gov
ArkansasLabor MarketReport
September 2017
The Arkansas Labor Market is prepared monthly in conjunction with the U.S. Department of Labor, Bu-reau of Labor Statistics (BLS). The current month’s estimates are preliminary, while previous month’s data is subject to revision.
Estimates of nonfarm payroll jobs show the num-ber of jobs by industry and reflect employment by place of work. Hours and earnings estimates are based on payroll and worker-hour data col-lected for production workers in manufacturing industries.
Industries are classified according to the North American Industry Classification System (NAICS). All estimates are based on a first quarter 2016 benchmark.
Explanation of Terms and Concepts
Monthly Business Survey of Employers
A monthly sample survey designed to provide industry information on nonfarm payroll jobs. Data are compiled each month from mail surveys and telephone interviews conducted by the Bureau of Labor Statistics in cooperation with Department of Workforce Services. The data are based on establishment records and include all workers, full-or part-time, who received pay during the payroll period which includes the 12th of the
month. Approximately 5,000 Arkansas business establishments are surveyed.
Metropolitan Statistical Area (MSA)
A term applied by the U.S. Office of Management and Budget to counties that have one or more central cities and that meet specified criteria of population density, commuting patterns and social and economic integration.
Current Population Survey (CPS)
A monthly sample survey of the population 16 years of age and over, designed to provide data on the labor force, the employed and the unem-ployed. The survey is conducted each month by the Bureau of the Census for BLS. The information is collected by trained interviewers from a sample of about 60,000 households. The data collected are based on the activity reported for the calendar week including the 12th of the month. Approxi-mately 800 Arkansas households are represented in the sample survey.
Civilian Labor Force
The sum of all employed and unemployed persons 16 years of age or older. Members of the Armed Forces are excluded.
Employment
An estimate of the number of persons who worked any time for pay or profit or worked 15 hours or more as unpaid workers in a family business dur-ing the calendar week which includes the 12th of the month. Also included are those who, although not working, had some job attachment and were not looking for work, and persons involved in labor management disputes.
Unemployment
An estimate of the number of persons who did not have a job, but were available for work and actively seeking work during the calendar week which includes the 12th of the month.
Unemployment Rate
The number of unemployed as a percentage of the civilian labor force. Unemployment rates are calculated from unrounded data.
Seasonal Adjustment
A statistical technique applied to monthly data to eliminate changes that normally occur during the year due to seasonal events such as weather, major holidays, schedule shifts, harvest times, and the opening/closing of schools.
Technical Notes
Monthly Spotlight..................................................2
Arkansas Labor Force Summary.......................3
Arkansas Nonfarm Payroll Jobs........................4
Arkansas Production Workers...........................6
Metropolitan Statistical Areas...........................7
Micropolitan Statistical Areas/Cities.............14
County Labor Force Statistics..........................15
Local Workforce Development Areas..........18
Table of Contents
ArkansasLabor MarketReport
September 2017
September Spotlight
www.discover.arkansas.gov 2
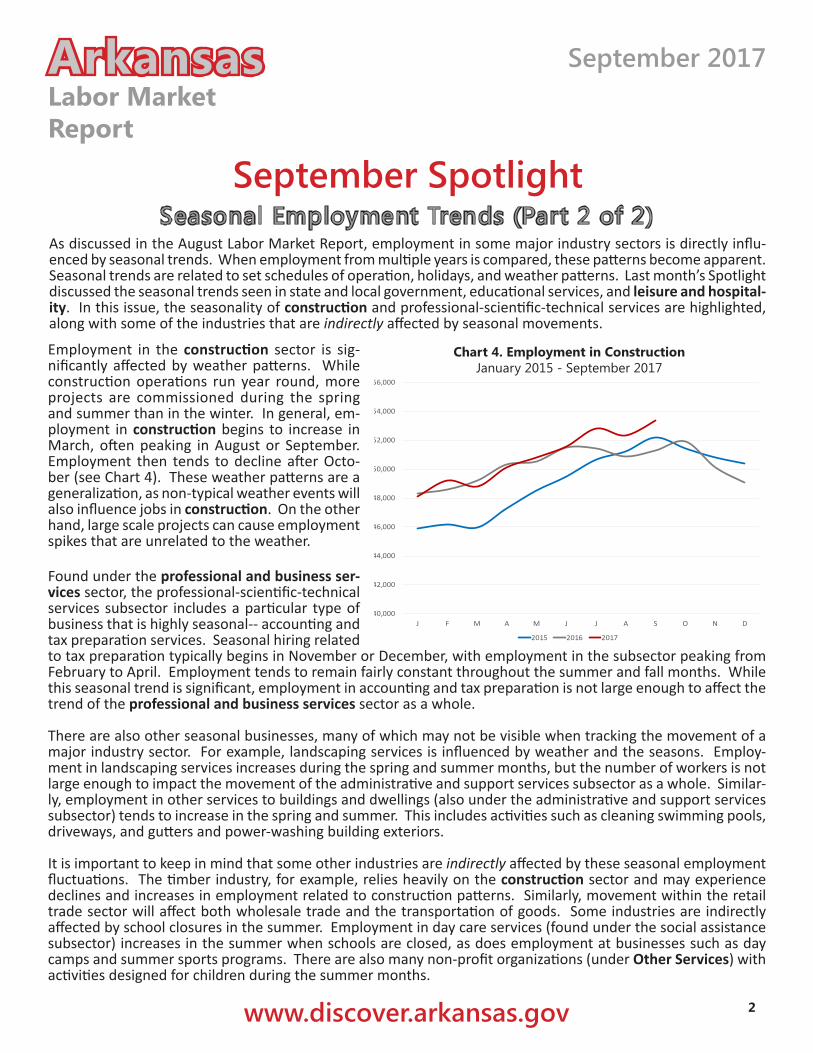
Seasonal Employment Trends (Part 2 of 2)As discussed in the August Labor Market Report, employment in some major industry sectors is directly influ-enced by seasonal trends. When employment from multiple years is compared, these patterns become apparent. Seasonal trends are related to set schedules of operation, holidays, and weather patterns. Last month’s Spotlight discussed the seasonal trends seen in state and local government, educational services, and leisure and hospital-ity. In this issue, the seasonality of construction and professional-scientific-technical services are highlighted, along with some of the industries that are indirectly affected by seasonal movements.
Employment in the construction sector is sig-nificantly affected by weather patterns. While construction operations run year round, more projects are commissioned during the spring and summer than in the winter. In general, em-ployment in construction begins to increase in March, often peaking in August or September. Employment then tends to decline after Octo-ber (see Chart 4). These weather patterns are a generalization, as non-typical weather events will also influence jobs in construction. On the other hand, large scale projects can cause employment spikes that are unrelated to the weather.
Found under the professional and business ser-vices sector, the professional-scientific-technical services subsector includes a particular type of business that is highly seasonal-- accounting and tax preparation services. Seasonal hiring related to tax preparation typically begins in November or December, with employment in the subsector peaking from February to April. Employment tends to remain fairly constant throughout the summer and fall months. While this seasonal trend is significant, employment in accounting and tax preparation is not large enough to affect the trend of the professional and business services sector as a whole.
There are also other seasonal businesses, many of which may not be visible when tracking the movement of a major industry sector. For example, landscaping services is influenced by weather and the seasons. Employ-ment in landscaping services increases during the spring and summer months, but the number of workers is not large enough to impact the movement of the administrative and support services subsector as a whole. Similar-ly, employment in other services to buildings and dwellings (also under the administrative and support services subsector) tends to increase in the spring and summer. This includes activities such as cleaning swimming pools, driveways, and gutters and power-washing building exteriors.
It is important to keep in mind that some other industries are indirectly affected by these seasonal employment fluctuations. The timber industry, for example, relies heavily on the construction sector and may experience declines and increases in employment related to construction patterns. Similarly, movement within the retail trade sector will affect both wholesale trade and the transportation of goods. Some industries are indirectly affected by school closures in the summer. Employment in day care services (found under the social assistance subsector) increases in the summer when schools are closed, as does employment at businesses such as day camps and summer sports programs. There are also many non-profit organizations (under Other Services) with activities designed for children during the summer months.
Chart 4. Employment in ConstructionJanuary 2015 - September 2017
40,000
42,000
44,000
46,000
48,000
50,000
52,000
54,000
56,000
J F M A M J J A S O N D
2015 2016 2017
ArkansasLabor MarketReport
September 2017
State of ArkansasCivilian Labor Force Summary
Civilian Labor Force Estimates
Civilian Labor Force Employment Unemployment Unemployment Rate
U.S. Unemployment
1,378,1571,330,428
47,7293.5
4.4
1,379,5921,330,925
48,6673.5
4.2
1,341,4821,287,538
53,9444.0
4.9
Sep 16 Sep 17 Aug 17
www.discover.arkansas.gov 3
Civilian Labor Force Employment Unemployment Unemployment Rate
U.S. Unemployment
1,372,8811,324,256
48,6253.5
4.5
1,375,1861,328,621
46,5653.4
4.1
1,345,5131,293,350
52,1633.9
4.8
Sep 16 Sep 17 Aug 17
Seasonally Adjusted Not Seasonally Adjusted
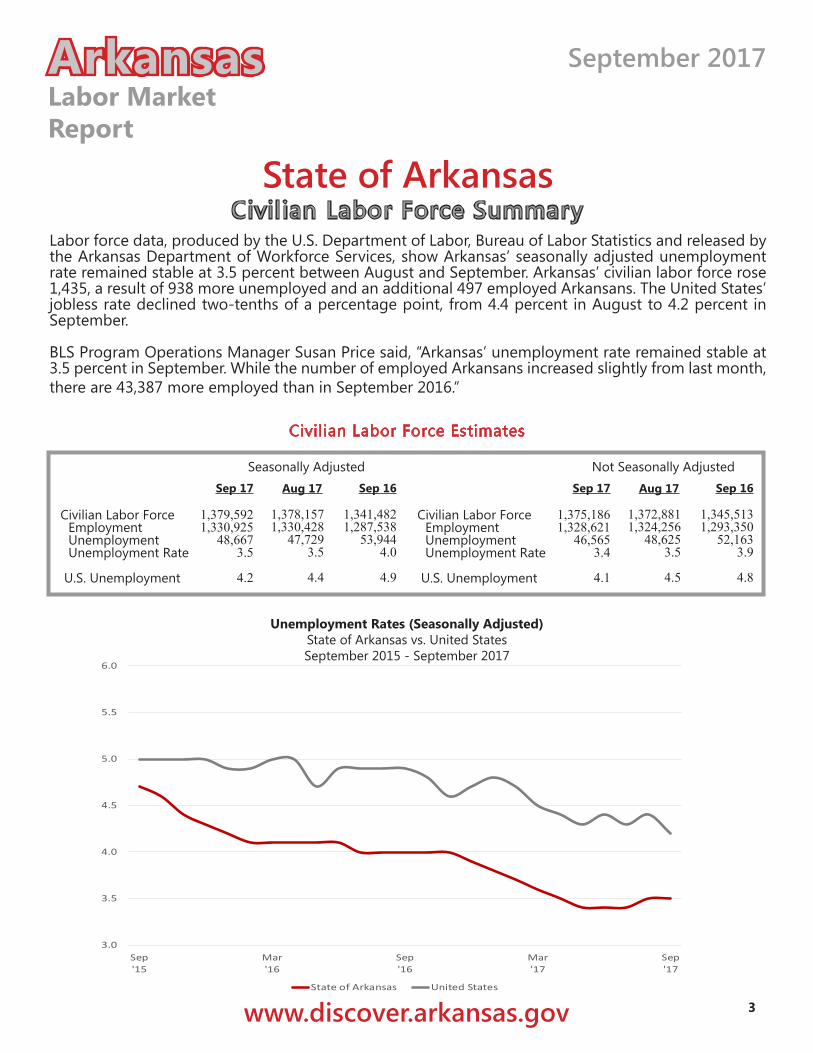
Unemployment Rates (Seasonally Adjusted)State of Arkansas vs. United StatesSeptember 2015 - September 2017
Labor force data, produced by the U.S. Department of Labor, Bureau of Labor Statistics and released by the Arkansas Department of Workforce Services, show Arkansas’ seasonally adjusted unemployment rate remained stable at 3.5 percent between August and September. Arkansas’ civilian labor force rose 1,435, a result of 938 more unemployed and an additional 497 employed Arkansans. The United States’ jobless rate declined two-tenths of a percentage point, from 4.4 percent in August to 4.2 percent in September.
BLS Program Operations Manager Susan Price said, “Arkansas’ unemployment rate remained stable at 3.5 percent in September. While the number of employed Arkansans increased slightly from last month, there are 43,387 more employed than in September 2016.”
3.0
3.5
4.0
4.5
5.0
5.5
6.0
Sep'15
Mar'16
Sep'16
Mar'17
Sep'17
State of Arkansas United States
ArkansasLabor MarketReport
September 2017
State of ArkansasNonfarm Payroll Jobs
www.discover.arkansas.gov 4
Sep 17 Aug 17 Sep 16
1237.4213.057.56.2
51.332.8
155.574.181.4
1024.4252.246.3
141.764.213.451.237.913.3
144.242.035.566.7
185.316.0
169.355.339.6
117.510.9
106.611.695.047.5
213.120.279.0
113.9
1242.8217.358.46.1
52.334.0
158.973.285.7
1025.5255.548.3
141.965.313.351.338.013.3
146.043.333.968.8
187.515.7
171.858.438.2
123.212.6
110.612.897.848.8
199.920.274.5
105.2
1258.3219.759.56.1
53.434.6
160.273.886.4
1038.6253.547.4
140.965.213.151.238.113.1
148.944.033.571.4
190.618.5
172.158.738.7
119.211.5
107.712.695.149.8
212.320.379.1
112.9
OTM OTY
20.96.72.0
-0.12.11.84.7
-0.35.0
14.21.31.1
-0.81.0
-0.30.00.2
-0.24.72.0
-2.04.75.32.52.83.4
-0.91.70.61.11.00.12.3
-0.80.10.1
-1.0
15.52.41.10.01.10.61.30.60.7
13.1-2.0-0.9-1.0-0.1-0.2-0.10.1
-0.22.90.7
-0.42.63.12.80.30.30.5
-4.0-1.1-2.9-0.2-2.71.0
12.40.14.67.7
Total Nonfarm Goods Producing Mining, Logging, and Construction Mining & Logging Construction Specialty Trade Contractors Manufacturing Durable Goods Nondurable Goods Service Providing Trade, Transportation & Utilities Wholesale Trade Retail Trade Transport, Warehousing & Utilities Information Financial Activities Finance & Insurance Real Estate & Rental & Leasing Professional & Business Services Professional,Scientific&Technical Management of Companies Administrative & Support Services Educational & Health Services Educational Services Health Care & Social Assistance Ambulatory Health Care Social Assistance Leisure & Hospitality Arts, Entertainment & Recreation Accommodation & Food Services Accommodation Services Food Services Other Services Government Federal Government State Government Local Government
(NAICS)
Not Seasonally Adjusted(In Thousands)
ArkansasLabor MarketReport
September 2017
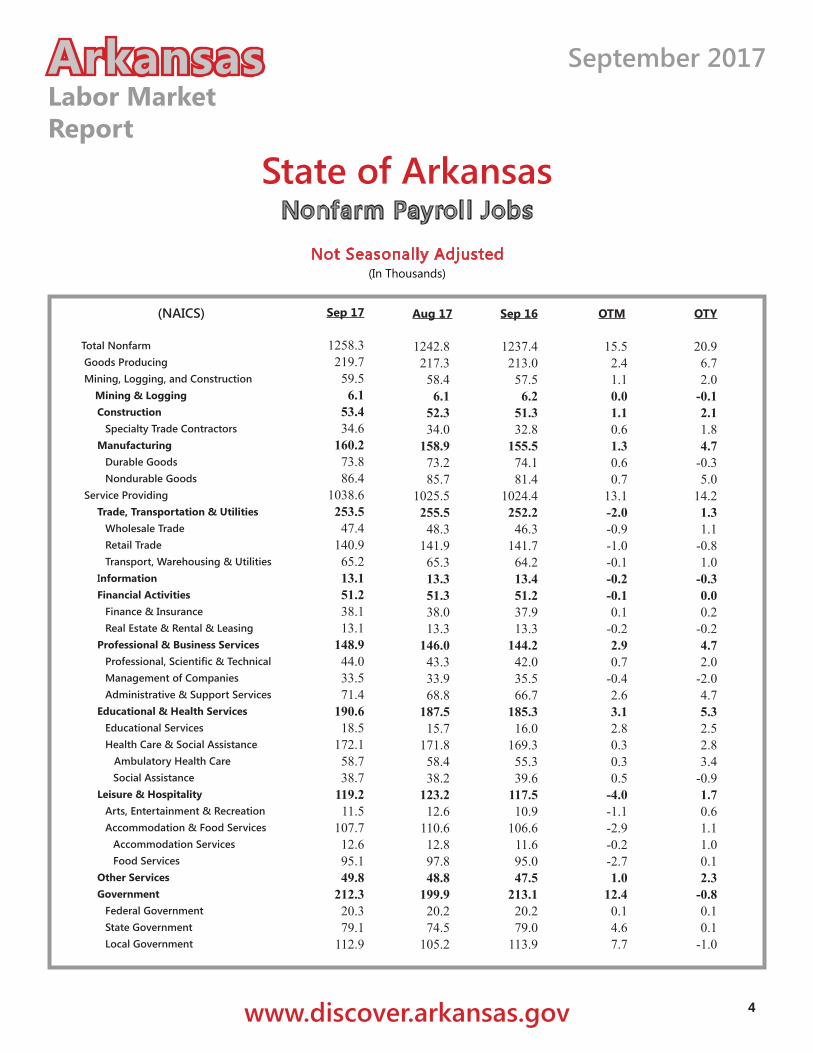
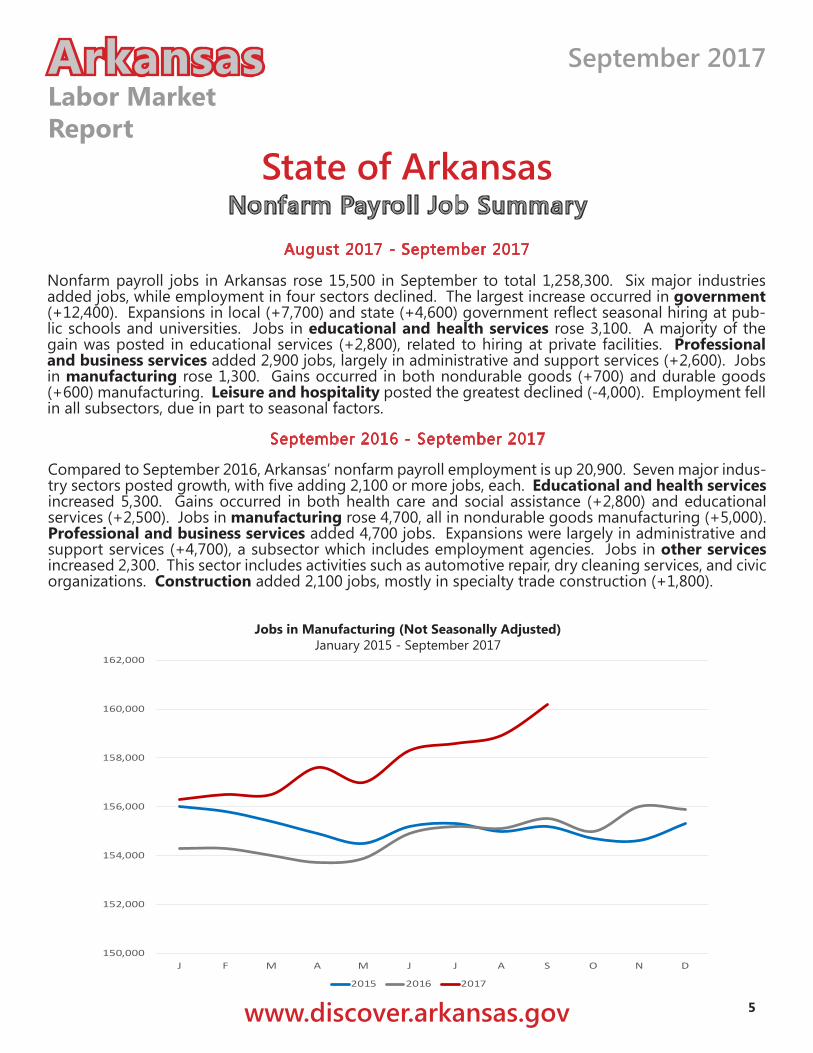
Nonfarm payroll jobs in Arkansas rose 15,500 in September to total 1,258,300. Six major industries added jobs, while employment in four sectors declined. The largest increase occurred in government (+12,400). Expansions in local (+7,700) and state (+4,600) government reflect seasonal hiring at pub-lic schools and universities. Jobs in educational and health services rose 3,100. A majority of the gain was posted in educational services (+2,800), related to hiring at private facilities. Professional and business services added 2,900 jobs, largely in administrative and support services (+2,600). Jobs in manufacturing rose 1,300. Gains occurred in both nondurable goods (+700) and durable goods (+600) manufacturing. Leisure and hospitality posted the greatest declined (-4,000). Employment fell in all subsectors, due in part to seasonal factors.
State of ArkansasNonfarm Payroll Job Summary
www.discover.arkansas.gov 5
Jobs in Manufacturing (Not Seasonally Adjusted)January 2015 - September 2017
August 2017 - September 2017
September 2016 - September 2017
Compared to September 2016, Arkansas’ nonfarm payroll employment is up 20,900. Seven major indus-try sectors posted growth, with five adding 2,100 or more jobs, each. Educational and health services increased 5,300. Gains occurred in both health care and social assistance (+2,800) and educational services (+2,500). Jobs in manufacturing rose 4,700, all in nondurable goods manufacturing (+5,000). Professional and business services added 4,700 jobs. Expansions were largely in administrative and support services (+4,700), a subsector which includes employment agencies. Jobs in other services increased 2,300. This sector includes activities such as automotive repair, dry cleaning services, and civic organizations. Construction added 2,100 jobs, mostly in specialty trade construction (+1,800).
150,000
152,000
154,000
156,000
158,000
160,000
162,000
J F M A M J J A S O N D
2015 2016 2017
ArkansasLabor MarketReport
September 2017
State of ArkansasProduction Workers- Hours and Earnings
Average Weekly HoursAverage Hourly EarningsAverage Weekly Earnings
39.616.27
644.29
41.015.99
655.59
39.715.57
618.13
Sep 16 Sep 17 Aug 17
Manufacturing
www.discover.arkansas.gov 6
Average Weekly HoursAverage Hourly EarningsAverage Weekly Earnings
40.917.94
733.75
41.017.78
728.98
41.417.57
727.40
Sep 16 Sep 17 Aug 17
Average Weekly HoursAverage Hourly EarningsAverage Weekly Earnings
38.514.86
572.11
41.014.56
596.96
38.213.62
520.28
Sep 16 Sep 17 Aug 17
Durable Goods Manufacturing Nondurable Goods Manufacturing
Average Hourly Earnings- ManufacturingSeptember: 2002 - 2017
Durable Goods and Nondurable Goods Manufacturing
$11.00
$12.00
$13.00
$14.00
$15.00
$16.00
$17.00
'02 '03 '04 '05 '06 '07 '08 '09 '10 '11 '12 '13 '14 '15 '16 '17
ArkansasLabor MarketReport
September 2017
Metropolitan Statistical AreasLittle Rock-North Little Rock-Conway MSA
www.discover.arkansas.gov 7
Civilian Labor Force Estimates (Not Seasonally Adjusted)
Civilian Labor ForceEmployment UnemploymentUnemployment Rate
350,114337,70512,409
3.5
Sep 17 Aug 17 Sep 16359,928348,547
11,3813.2
358,901347,802
11,0993.1
Nonfarm Payroll Jobs (Not Seasonally Adjusted)
Total Nonfarm Goods Producing Mining, Logging & Construction Manufacturing Service Providing Trade, Transportation & Utilities Wholesale Trade Retail Trade Trans., Warehousing & Utilities Information Financial Activities Professional & Business Services Educational & Health Services Leisure & Hospitality Other Services Government Federal Government State Government Local Government
357.138.118.120.0
319.069.514.938.416.26.1
20.547.657.433.214.969.89.7
35.324.8
353.937.617.620.0
316.370.015.038.916.16.1
20.646.057.133.615.067.99.7
34.323.9
355.337.117.020.1
318.269.715.038.915.86.3
20.547.255.834.014.670.19.6
35.025.5
NAICS Sep 17 Aug 17 Sep 163.20.50.50.02.7
-0.5-0.1-0.50.10.0
-0.11.60.3
-0.4-0.11.90.01.00.9
1.81.01.1
-0.10.8
-0.2-0.1-0.50.4
-0.20.00.41.6
-0.80.3
-0.30.10.3
-0.7
OTM OTY
8,78710,097-1,310
-0.4
OTM OTY-1,027
-745-282-0.1
The Little Rock-North Little Rock-Conway MSA= Faulkner, Grant, Lonoke, Perry, Pulaski, & Saline counties.
(In Thousands)
Number of EmployedSeptember: 2007 - 2017
Jobs in Educational and Health ServicesJanuary 2015 - September 2017
300,000
305,000
310,000
315,000
320,000
325,000
330,000
335,000
340,000
345,000
350,000
355,000
'07 '08 '09 '10 '11 '12 '13 '14 '15 '16 '17
48,000
49,000
50,000
51,000
52,000
53,000
54,000
55,000
56,000
57,000
58,000
J F M A M J J A S O N D
2015 2016 2017
ArkansasLabor MarketReport
September 2017
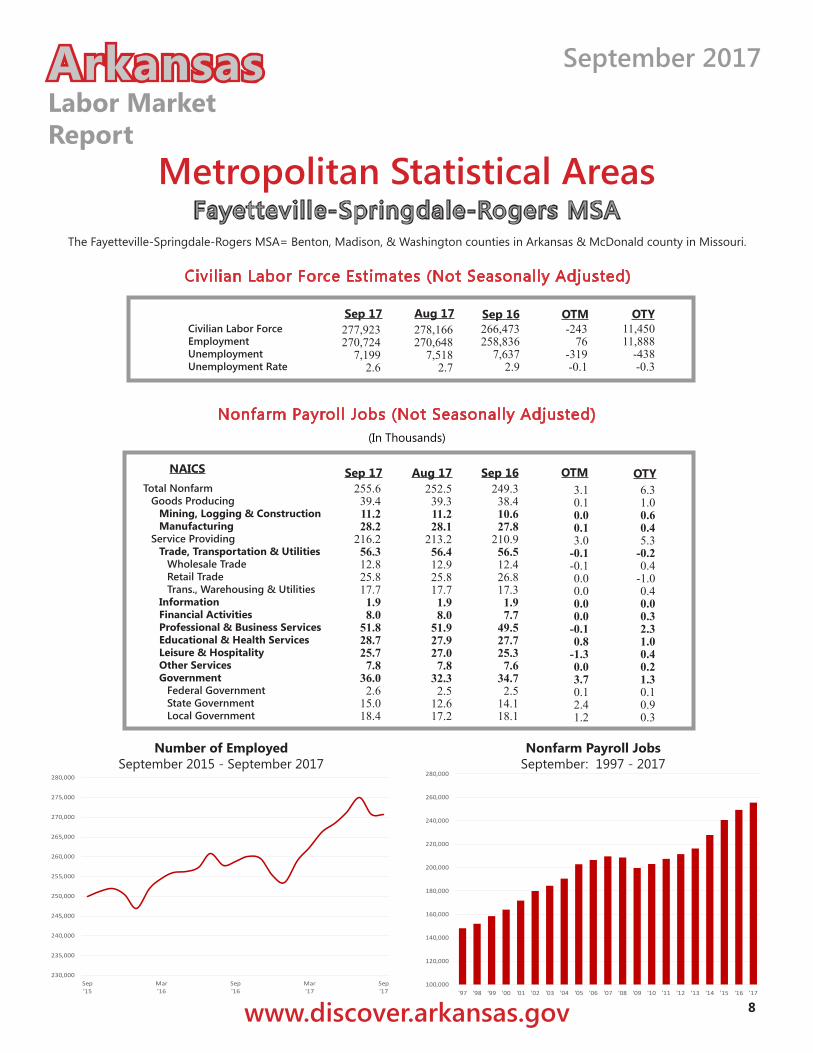
Metropolitan Statistical AreasFayetteville-Springdale-Rogers MSA
www.discover.arkansas.gov 8
Civilian Labor Force Estimates (Not Seasonally Adjusted)
Civilian Labor ForceEmployment UnemploymentUnemployment Rate
266,473258,836
7,6372.9
Sep 17 Aug 17 Sep 16278,166270,648
7,5182.7
277,923270,724
7,1992.6
Nonfarm Payroll Jobs (Not Seasonally Adjusted)
Total Nonfarm Goods Producing Mining, Logging & Construction Manufacturing Service Providing Trade, Transportation & Utilities Wholesale Trade Retail Trade Trans., Warehousing & Utilities Information Financial Activities Professional & Business Services Educational & Health Services Leisure & Hospitality Other Services Government Federal Government State Government Local Government
255.639.411.228.2
216.256.312.825.817.71.98.0
51.828.725.77.8
36.02.6
15.018.4
252.539.311.228.1
213.256.412.925.817.71.98.0
51.927.927.07.8
32.32.5
12.617.2
249.338.410.627.8
210.956.512.426.817.31.97.7
49.527.725.37.6
34.72.5
14.118.1
NAICS Sep 17 Aug 17 Sep 163.10.10.00.13.0
-0.1-0.10.00.00.00.0
-0.10.8
-1.30.03.70.12.41.2
6.31.00.60.45.3
-0.20.4
-1.00.40.00.32.31.00.40.21.30.10.90.3
OTM OTY
11,45011,888
-438-0.3
OTM OTY-243
76-319-0.1
The Fayetteville-Springdale-Rogers MSA= Benton, Madison, & Washington counties in Arkansas & McDonald county in Missouri.
(In Thousands)
Number of EmployedSeptember 2015 - September 2017
Nonfarm Payroll JobsSeptember: 1997 - 2017
230,000
235,000
240,000
245,000
250,000
255,000
260,000
265,000
270,000
275,000
280,000
Sep'15
Mar'16
Sep'16
Mar'17
Sep'17
100,000
120,000
140,000
160,000
180,000
200,000
220,000
240,000
260,000
280,000
'97 '98 '99 '00 '01 '02 '03 '04 '05 '06 '07 '08 '09 '10 '11 '12 '13 '14 '15 '16 '17
ArkansasLabor MarketReport
September 2017
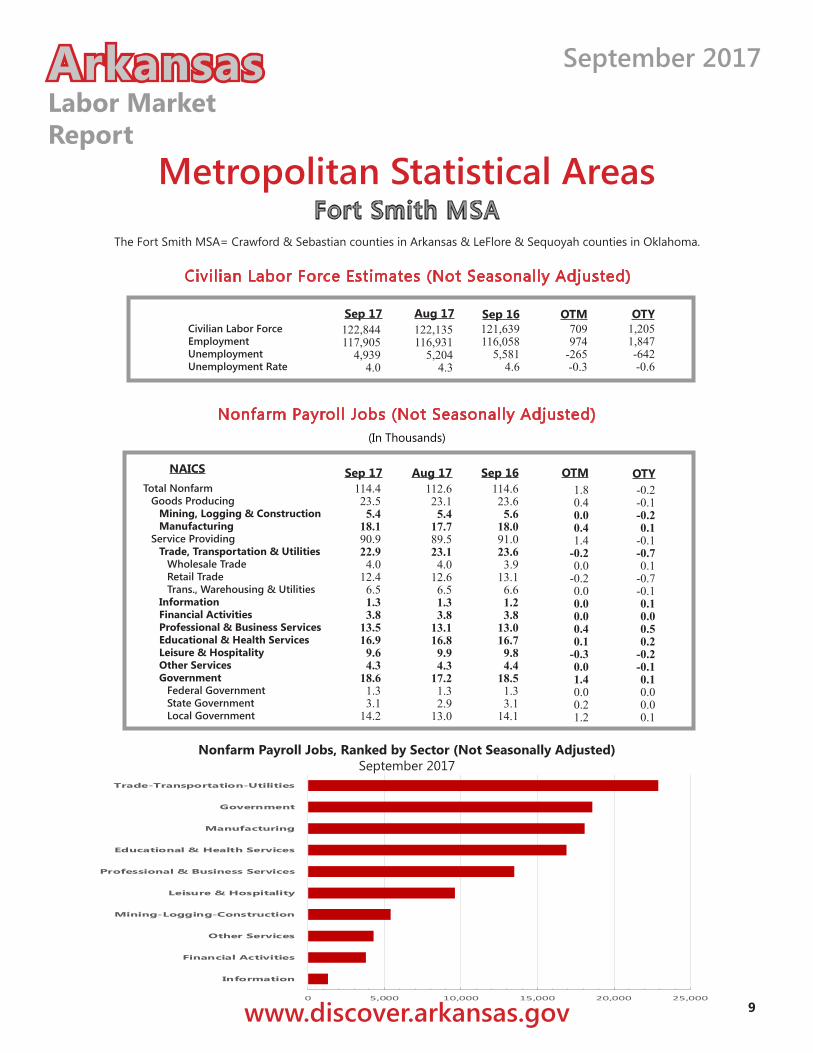
Metropolitan Statistical AreasFort Smith MSA
www.discover.arkansas.gov 9
Civilian Labor Force Estimates (Not Seasonally Adjusted)
Civilian Labor ForceEmployment UnemploymentUnemployment Rate
121,639116,058
5,5814.6
Sep 17 Aug 17 Sep 16122,135116,931
5,2044.3
122,844117,905
4,9394.0
Nonfarm Payroll Jobs (Not Seasonally Adjusted)
Total Nonfarm Goods Producing Mining, Logging & Construction Manufacturing Service Providing Trade, Transportation & Utilities Wholesale Trade Retail Trade Trans., Warehousing & Utilities Information Financial Activities Professional & Business Services Educational & Health Services Leisure & Hospitality Other Services Government Federal Government State Government Local Government
114.423.55.4
18.190.922.94.0
12.46.51.33.8
13.516.99.64.3
18.61.33.1
14.2
112.623.15.4
17.789.523.14.0
12.66.51.33.8
13.116.89.94.3
17.21.32.9
13.0
114.623.65.6
18.091.023.63.9
13.16.61.23.8
13.016.79.84.4
18.51.33.1
14.1
NAICS Sep 17 Aug 17 Sep 161.80.40.00.41.4
-0.20.0
-0.20.00.00.00.40.1
-0.30.01.40.00.21.2
-0.2-0.1-0.20.1
-0.1-0.70.1
-0.7-0.10.10.00.50.2
-0.2-0.10.10.00.00.1
OTM OTY
1,2051,847-642-0.6
OTM OTY709974
-265-0.3
The Fort Smith MSA= Crawford & Sebastian counties in Arkansas & LeFlore & Sequoyah counties in Oklahoma.
(In Thousands)
Nonfarm Payroll Jobs, Ranked by Sector (Not Seasonally Adjusted)September 2017
0 5,000 10,000 15,000 20,000 25,000
Information
Financial Activities
Other Services
Mining-Logging-Construction
Leisure & Hospitality
Professional & Business Services
Educational & Health Services
Manufacturing
Government
Trade-Transportation-Utilities
ArkansasLabor MarketReport
September 2017
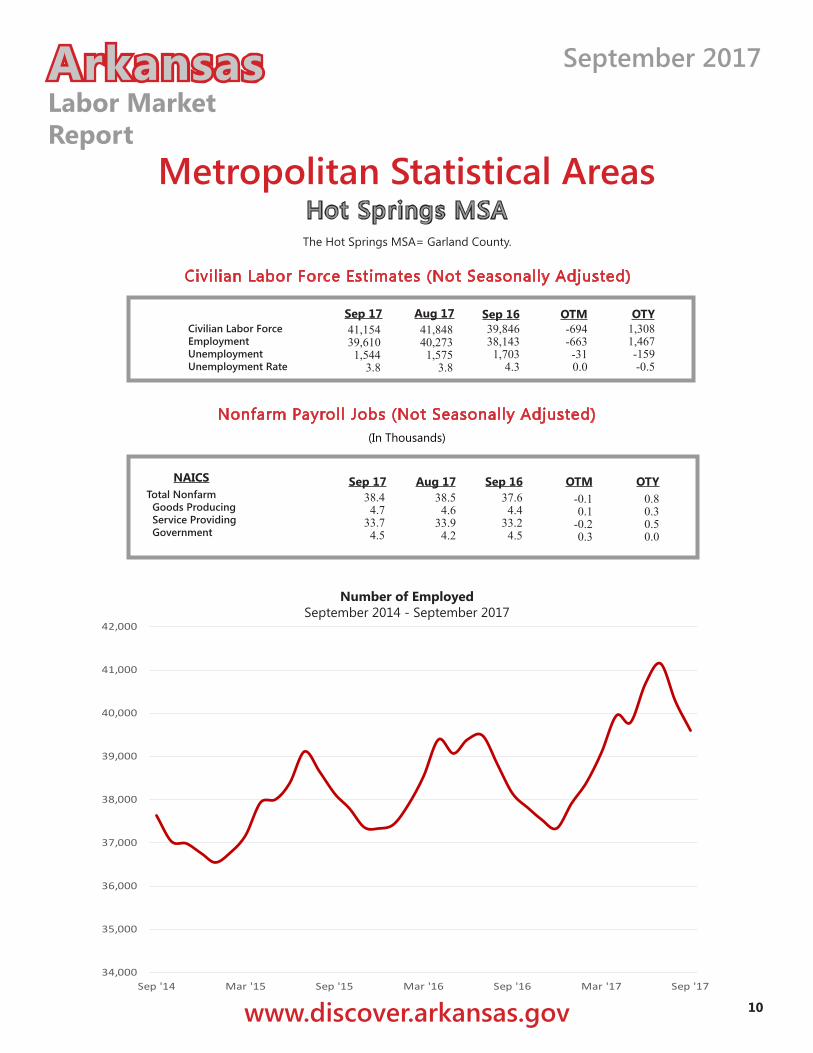
Metropolitan Statistical AreasHot Springs MSA
www.discover.arkansas.gov 10
Civilian Labor Force Estimates (Not Seasonally Adjusted)
Civilian Labor ForceEmployment UnemploymentUnemployment Rate
39,84638,1431,703
4.3
Sep 17 Aug 17 Sep 1641,84840,2731,575
3.8
41,15439,6101,544
3.8
Nonfarm Payroll Jobs (Not Seasonally Adjusted)
1,3081,467-159-0.5
OTM OTY-694-663-310.0
The Hot Springs MSA= Garland County.
(In Thousands)
Number of EmployedSeptember 2014 - September 2017
38.44.7
33.74.5
38.54.6
33.94.2
37.64.4
33.24.5
NAICS Sep 17 Aug 17 Sep 16-0.10.1
-0.20.3
0.80.30.50.0
OTM OTYTotal Nonfarm Goods Producing Service Providing Government
34,000
35,000
36,000
37,000
38,000
39,000
40,000
41,000
42,000
Sep '14 Mar '15 Sep '15 Mar '16 Sep '16 Mar '17 Sep '17
ArkansasLabor MarketReport
September 2017
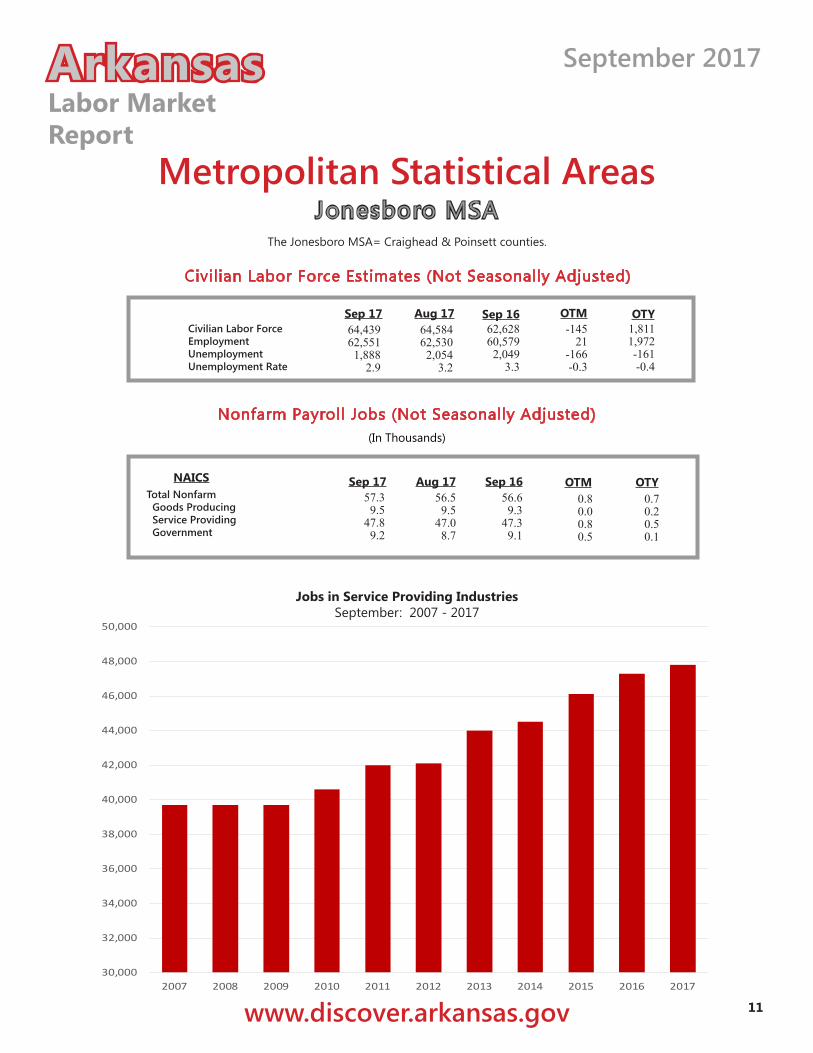
Metropolitan Statistical AreasJonesboro MSA
www.discover.arkansas.gov 11
Civilian Labor Force Estimates (Not Seasonally Adjusted)
Civilian Labor ForceEmployment UnemploymentUnemployment Rate
62,62860,5792,049
3.3
Sep 17 Aug 17 Sep 1664,58462,5302,054
3.2
64,43962,5511,888
2.9
Nonfarm Payroll Jobs (Not Seasonally Adjusted)
1,8111,972-161-0.4
OTM OTY-145
21-166-0.3
The Jonesboro MSA= Craighead & Poinsett counties.
(In Thousands)
Jobs in Service Providing IndustriesSeptember: 2007 - 2017
57.39.5
47.89.2
56.59.5
47.08.7
56.69.3
47.39.1
NAICS Sep 17 Aug 17 Sep 160.80.00.80.5
0.70.20.50.1
OTM OTYTotal Nonfarm Goods Producing Service Providing Government
30,000
32,000
34,000
36,000
38,000
40,000
42,000
44,000
46,000
48,000
50,000
2007 2008 2009 2010 2011 2012 2013 2014 2015 2016 2017
ArkansasLabor MarketReport
September 2017
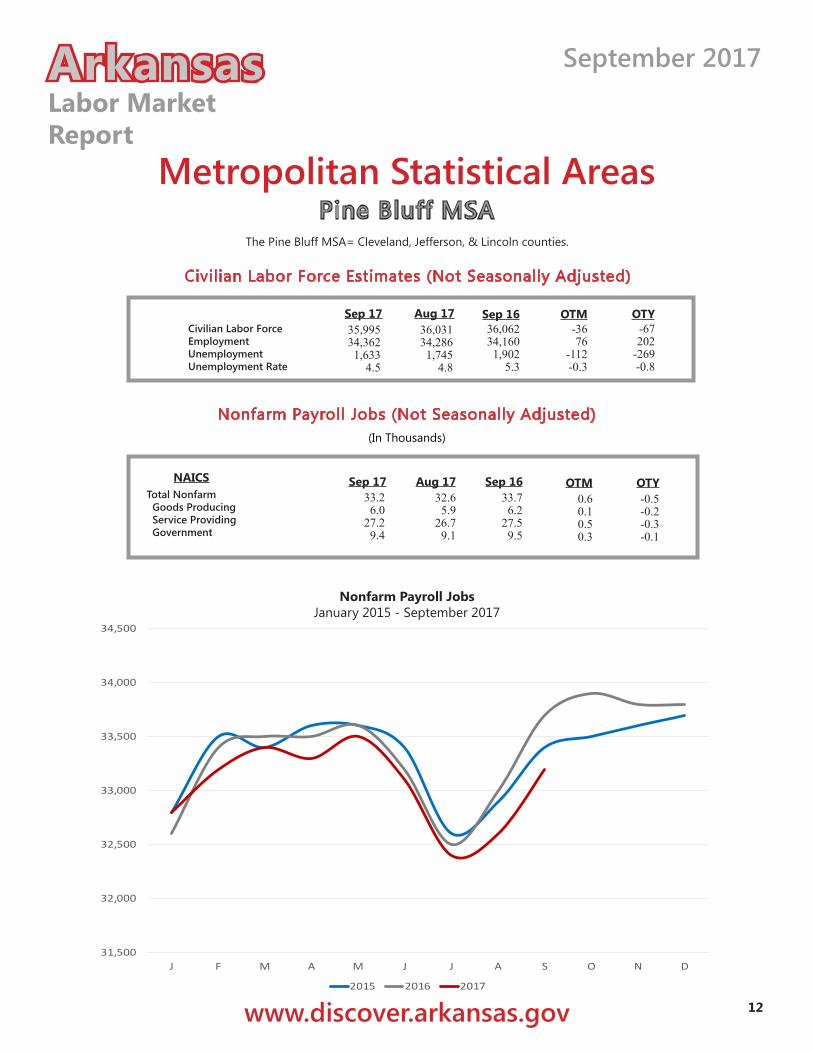
Metropolitan Statistical AreasPine Bluff MSA
www.discover.arkansas.gov 12
Civilian Labor Force Estimates (Not Seasonally Adjusted)
Civilian Labor ForceEmployment UnemploymentUnemployment Rate
36,06234,1601,902
5.3
Sep 17 Aug 17 Sep 1636,03134,2861,745
4.8
35,99534,3621,633
4.5
Nonfarm Payroll Jobs (Not Seasonally Adjusted)
-67202
-269-0.8
OTM OTY-3676
-112-0.3
The Pine Bluff MSA= Cleveland, Jefferson, & Lincoln counties.
(In Thousands)
Nonfarm Payroll JobsJanuary 2015 - September 2017
33.26.0
27.29.4
32.65.9
26.79.1
33.76.2
27.59.5
NAICS Sep 17 Aug 17 Sep 160.60.10.50.3
-0.5-0.2-0.3-0.1
OTM OTYTotal Nonfarm Goods Producing Service Providing Government
31,500
32,000
32,500
33,000
33,500
34,000
34,500
J F M A M J J A S O N D
2015 2016 2017
ArkansasLabor MarketReport
September 2017
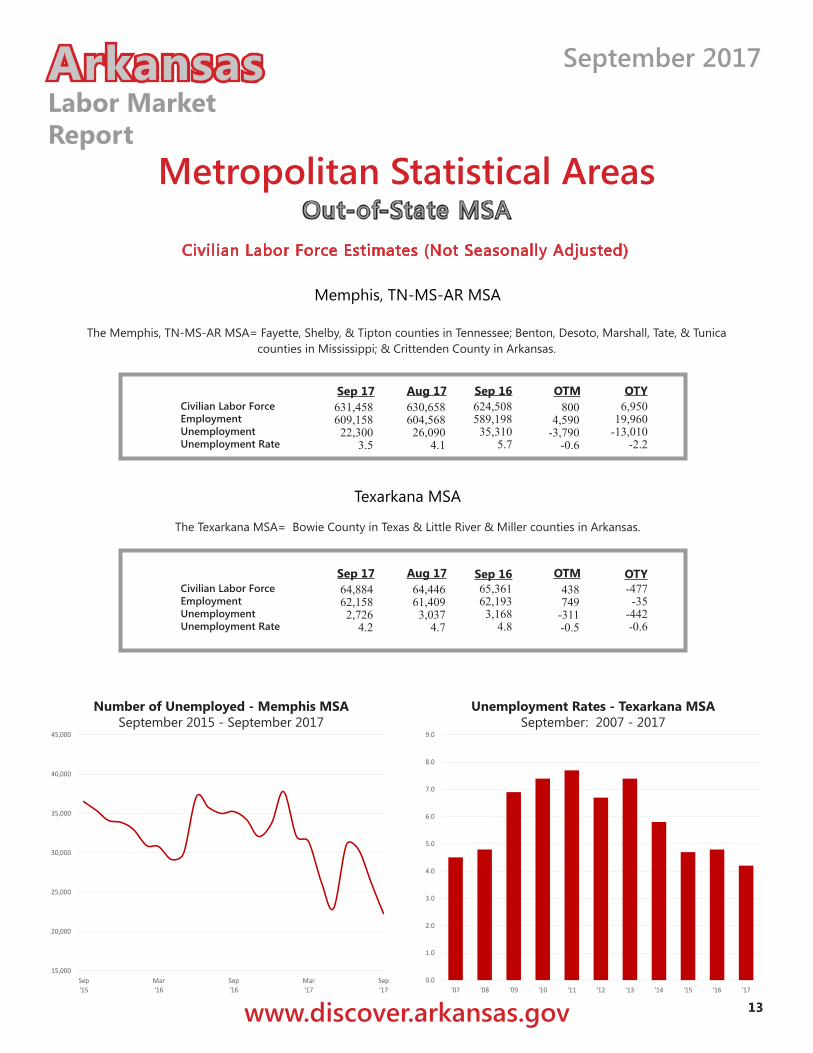
Metropolitan Statistical AreasOut-of-State MSA
www.discover.arkansas.gov 13
Civilian Labor Force Estimates (Not Seasonally Adjusted)
Civilian Labor ForceEmployment UnemploymentUnemployment Rate
624,508589,19835,310
5.7
Sep 17 Aug 17 Sep 16630,658604,56826,090
4.1
631,458609,15822,300
3.5
6,95019,960
-13,010-2.2
OTM OTY800
4,590-3,790
-0.6
Memphis, TN-MS-AR MSA
Civilian Labor ForceEmployment UnemploymentUnemployment Rate
65,36162,1933,168
4.8
Sep 17 Aug 17 Sep 1664,44661,4093,037
4.7
64,88462,158
2,7264.2
-477-35
-442-0.6
OTM OTY438749
-311-0.5
The Memphis, TN-MS-AR MSA= Fayette, Shelby, & Tipton counties in Tennessee; Benton, Desoto, Marshall, Tate, & Tunica counties in Mississippi; & Crittenden County in Arkansas.
Texarkana MSA
The Texarkana MSA= Bowie County in Texas & Little River & Miller counties in Arkansas.
Number of Unemployed - Memphis MSASeptember 2015 - September 2017
Unemployment Rates - Texarkana MSASeptember: 2007 - 2017
0.0
1.0
2.0
3.0
4.0
5.0
6.0
7.0
8.0
9.0
'07 '08 '09 '10 '11 '12 '13 '14 '15 '16 '17
15,000
20,000
25,000
30,000
35,000
40,000
45,000
Sep'15
Mar'16
Sep'16
Mar'17
Sep'17
ArkansasLabor MarketReport
September 2017
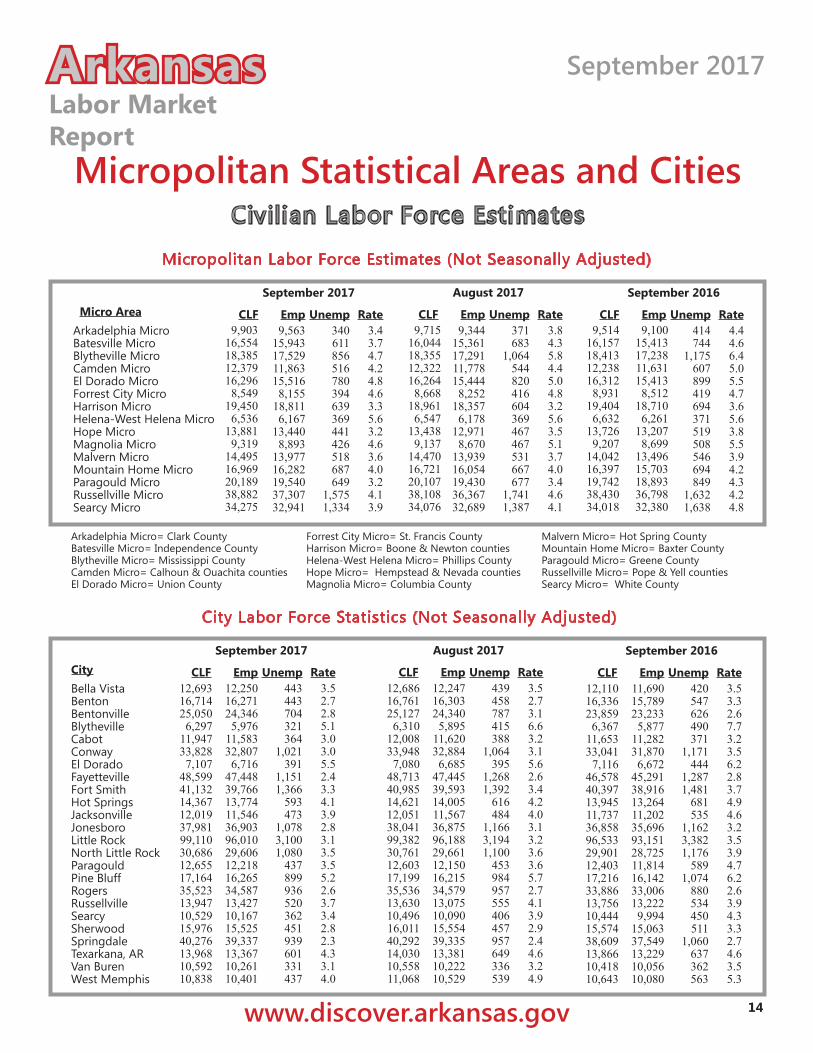
Micropolitan Statistical Areas and CitiesCivilian Labor Force Estimates
www.discover.arkansas.gov 14
Micropolitan Labor Force Estimates (Not Seasonally Adjusted)
Arkadelphia Micro= Clark CountyBatesville Micro= Independence CountyBlytheville Micro= Mississippi CountyCamden Micro= Calhoun & Ouachita countiesEl Dorado Micro= Union County
Forrest City Micro= St. Francis CountyHarrison Micro= Boone & Newton countiesHelena-West Helena Micro= Phillips CountyHope Micro= Hempstead & Nevada countiesMagnolia Micro= Columbia County
Malvern Micro= Hot Spring CountyMountain Home Micro= Baxter CountyParagould Micro= Greene CountyRussellville Micro= Pope & Yell countiesSearcy Micro= White County
Arkadelphia MicroBatesville Micro Blytheville MicroCamden Micro El Dorado Micro Forrest City MicroHarrison MicroHelena-West Helena MicroHope MicroMagnolia MicroMalvern MicroMountain Home MicroParagould MicroRussellville Micro Searcy Micro
9,56315,94317,52911,86315,5168,155
18,8116,167
13,4408,893
13,97716,28219,54037,30732,941
340611856516780394639369441426518687649
1,5751,334
Micro Area CLF Emp Unemp3.43.74.74.24.84.63.35.63.24.63.64.03.24.13.9
Rate9,903
16,55418,38512,37916,2968,549
19,4506,536
13,8819,319
14,49516,96920,18938,88234,275
9,34415,36117,29111,77815,4448,252
18,3576,178
12,9718,670
13,93916,05419,43036,36732,689
371683
1,064544820416604369467467531667677
1,7411,387
CLF Emp Unemp3.84.35.84.45.04.83.25.63.55.13.74.03.44.64.1
Rate CLF Emp Unemp4.44.66.45.05.54.73.65.63.85.53.94.24.34.24.8
Rate
September 2017 August 2017 September 2016
Bella VistaBentonBentonvilleBlythevilleCabotConwayEl DoradoFayettevilleFort SmithHot SpringsJacksonvilleJonesboroLittle RockNorth Little RockParagouldPine BluffRogersRussellvilleSearcySherwoodSpringdaleTexarkana, ARVan BurenWest Memphis
12,69316,71425,0506,297
11,94733,8287,107
48,59941,13214,36712,01937,98199,11030,68612,65517,16435,52313,94710,52915,97640,27613,96810,59210,838
12,25016,27124,3465,976
11,58332,8076,716
47,44839,76613,77411,54636,90396,01029,60612,21816,26534,58713,42710,16715,52539,33713,36710,26110,401
443443704321364
1,021391
1,1511,366
593473
1,0783,1001,080
437899936520362451939601331437
City CLF Emp Unemp3.52.72.85.13.03.05.52.43.34.13.92.83.13.53.55.22.63.73.42.82.34.33.14.0
Rate12,68616,76125,1276,310
12,00833,9487,080
48,71340,98514,62112,05138,04199,38230,76112,60317,19935,53613,63010,49616,01140,29214,03010,55811,068
12,24716,30324,3405,895
11,62032,8846,685
47,44539,59314,00511,56736,87596,18829,66112,15016,21534,57913,07510,09015,55439,33513,38110,22210,529
439458787415388
1,064395
1,2681,392
616484
1,1663,1941,100
453984957555406457957649336539
CLF Emp Unemp3.52.73.16.63.23.15.62.63.44.24.03.13.23.63.65.72.74.13.92.92.44.63.24.9
Rate12,11016,33623,8596,367
11,65333,041
7,11646,57840,39713,94511,73736,85896,53329,90112,40317,21633,88613,75610,44415,57438,60913,86610,41810,643
11,69015,78923,2335,877
11,28231,8706,672
45,29138,91613,26411,20235,69693,15128,72511,81416,14233,00613,2229,994
15,06337,54913,22910,05610,080
420547626490371
1,171444
1,2871,481
681535
1,1623,3821,176
5891,074
880534450511
1,060637362563
CLF Emp Unemp3.53.32.67.73.23.56.22.83.74.94.63.23.53.94.76.22.63.94.33.32.74.63.55.3
Rate
September 2017 August 2017 September 2016
City Labor Force Statistics (Not Seasonally Adjusted)
9,51416,15718,41312,23816,3128,931
19,4046,632
13,7269,207
14,04216,39719,74238,43034,018
414744
1,175607899419694371519508546694849
1,6321,638
9,71516,04418,35512,32216,2648,668
18,9616,547
13,4389,137
14,47016,72120,10738,10834,076
9,10015,41317,23811,63115,4138,512
18,7106,261
13,2078,699
13,49615,70318,89336,79832,380
ArkansasLabor MarketReport
September 2017
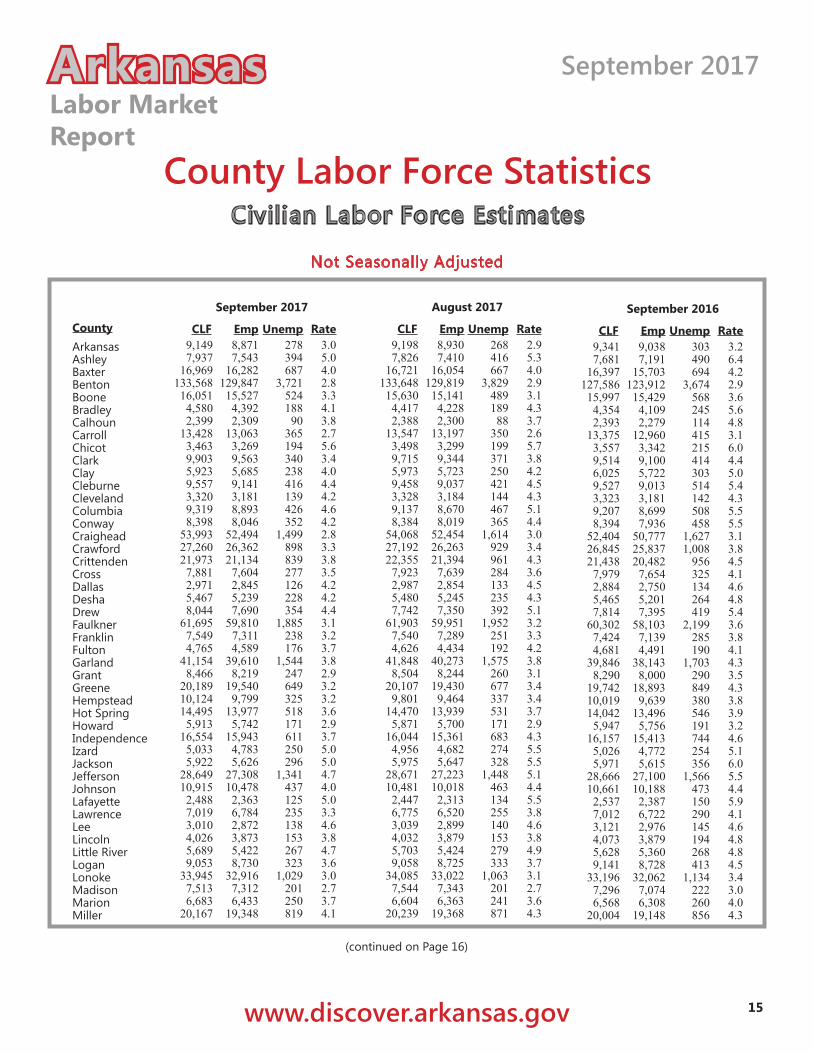
County Labor Force Statistics
www.discover.arkansas.gov 15
ArkansasAshleyBaxterBentonBooneBradleyCalhounCarrollChicotClarkClayCleburneClevelandColumbiaConwayCraigheadCrawfordCrittendenCrossDallasDeshaDrewFaulknerFranklinFultonGarlandGrantGreeneHempsteadHot SpringHowardIndependenceIzardJacksonJeffersonJohnsonLafayetteLawrenceLeeLincolnLittle RiverLoganLonokeMadisonMarionMiller
9,1497,937
16,969133,56816,0514,5802,399
13,4283,4639,9035,9239,5573,3209,3198,398
53,99327,26021,9737,8812,9715,4678,044
61,6957,5494,765
41,1548,466
20,18910,12414,4955,913
16,5545,0335,922
28,64910,9152,4887,0193,0104,0265,6899,053
33,9457,5136,683
20,167
8,8717,543
16,282129,84715,5274,3922,309
13,0633,2699,5635,6859,1413,1818,8938,046
52,49426,36221,1347,6042,8455,2397,690
59,8107,3114,589
39,6108,219
19,5409,799
13,9775,742
15,9434,7835,626
27,30810,4782,3636,7842,8723,8735,4228,730
32,9167,3126,433
19,348
278394687
3,72152418890
365194340238416139426352
1,499898839277126228354
1,885238176
1,544247649325518171611250296
1,341437125235138153267323
1,029201250819
County CLF Emp Unemp3.05.04.02.83.34.13.82.75.63.44.04.44.24.64.22.83.33.83.54.24.24.43.13.23.73.82.93.23.23.62.93.75.05.04.74.05.03.34.63.84.73.63.02.73.74.1
Rate9,1987,826
16,721133,64815,6304,4172,388
13,5473,4989,7155,9739,4583,3289,1378,384
54,06827,19222,3557,9232,9875,4807,742
61,9037,5404,626
41,8488,504
20,1079,801
14,4705,871
16,0444,9565,975
28,67110,4812,4476,7753,0394,0325,7039,058
34,0857,5446,604
20,239
8,9307,410
16,054129,81915,1414,2282,300
13,1973,2999,3445,7239,0373,1848,6708,019
52,45426,26321,3947,6392,8545,2457,350
59,9517,2894,434
40,2738,244
19,4309,464
13,9395,700
15,3614,6825,647
27,22310,0182,3136,5202,8993,8795,4248,725
33,0227,3436,363
19,368
268416667
3,82948918988
350199371250421144467365
1,614929961284133235392
1,952251192
1,575260677337531171683274328
1,448463134255140153279333
1,063201241871
CLF Emp Unemp2.95.34.02.93.14.33.72.65.73.84.24.54.35.14.43.03.44.33.64.54.35.13.23.34.23.83.13.43.43.72.94.35.55.55.14.45.53.84.63.84.93.73.12.73.64.3
Rate9,3417,681
16,397127,58615,9974,3542,393
13,3753,5579,5146,0259,5273,3239,2078,394
52,40426,84521,4387,9792,8845,4657,814
60,3027,4244,681
39,8468,290
19,74210,01914,0425,947
16,1575,0265,971
28,66610,6612,5377,0123,1214,0735,6289,141
33,1967,2966,568
20,004
9,0387,191
15,703123,91215,4294,1092,279
12,9603,3429,1005,7229,0133,1818,6997,936
50,77725,83720,4827,6542,7505,2017,395
58,1037,1394,491
38,1438,000
18,8939,639
13,4965,756
15,4134,7725,615
27,10010,1882,3876,7222,9763,8795,3608,728
32,0627,0746,308
19,148
303490694
3,674568245114415215414303514142508458
1,6271,008
956325134264419
2,199285190
1,703290849380546191744254356
1,566473150290145194268413
1,134222260856
CLF Emp Unemp3.26.44.22.93.65.64.83.16.04.45.05.44.35.55.53.13.84.54.14.64.85.43.63.84.14.33.54.33.83.93.24.65.16.05.54.45.94.14.64.84.84.53.43.04.04.3
Rate
September 2017 August 2017 September 2016
(continued on Page 16)
Civilian Labor Force Estimates
Not Seasonally Adjusted
ArkansasLabor MarketReport
September 2017
County Labor Force Statistics
www.discover.arkansas.gov 16
MississippiMonroeMontgomeryNevadaNewtonOuachitaPerryPhillipsPikePoinsettPolkPopePrairiePulaskiRandolphSt. FrancisSalineScottSearcySebastianSevierSharpStoneUnionVan BurenWashingtonWhiteWoodruffYell
18,3852,8013,1113,7573,3999,9804,2446,5364,298
10,4467,954
30,0063,760
192,5367,1208,549
58,0154,5362,992
59,0765,7126,1524,824
16,2966,002
125,98334,2752,9978,876
17,5292,6872,9763,6413,2849,5544,0896,1674,140
10,0577,627
28,7603,619
186,4016,8608,155
56,3674,3712,859
57,0905,4655,8974,625
15,5165,708
123,05132,9412,8688,547
856114135116115426155369158389327
1,246141
6,135260394
1,648165133
1,986247255199780294
2,9321,334
129329
County CLF Emp Unemp4.74.14.33.13.44.33.75.63.73.74.14.23.83.23.74.62.83.64.43.44.34.14.14.84.92.33.94.33.7
Rate18,3552,8403,1463,6373,3319,9344,2656,5474,345
10,5168,018
29,3933,727
193,0417,0118,668
58,1304,5073,033
58,8815,6975,9694,877
16,2645,893
126,11434,0763,0128,715
17,2912,7273,0073,5073,2169,4784,1076,1784,182
10,0767,691
28,0053,583
186,7476,7368,252
56,4764,3552,895
56,8415,4475,7014,669
15,4445,598
123,04432,6892,8858,362
1,064113139130115456158369163440327
1,388144
6,294275416
1,654152138
2,040250268208820295
3,0701,387
127353
CLF Emp Unemp5.84.04.43.63.54.63.75.63.84.24.14.73.93.33.94.82.83.44.53.54.44.54.35.05.02.44.14.24.1
Rate18,4132,8493,1023,7073,4079,8454,1786,6324,143
10,2248,112
29,5863,657
187,6286,8078,931
56,5204,4653,029
58,0195,6366,1124,757
16,3126,021
120,72034,0182,9938,844
17,2382,7202,9473,5683,2819,3523,9926,2613,9699,8027,720
28,3203,524
180,8506,5248,512
54,6984,3032,888
55,8705,3645,8084,530
15,4135,631
117,45932,3802,8498,478
1,175129155139126493186371174422392
1,266133
6,778283419
1,822162141
2,149272304227899390
3,2611,638
144366
CLF Emp Unemp6.44.55.03.73.75.04.55.64.24.14.84.33.63.64.24.73.23.64.73.74.85.04.85.56.52.74.84.84.1
Rate
September 2017 August 2017 September 2016
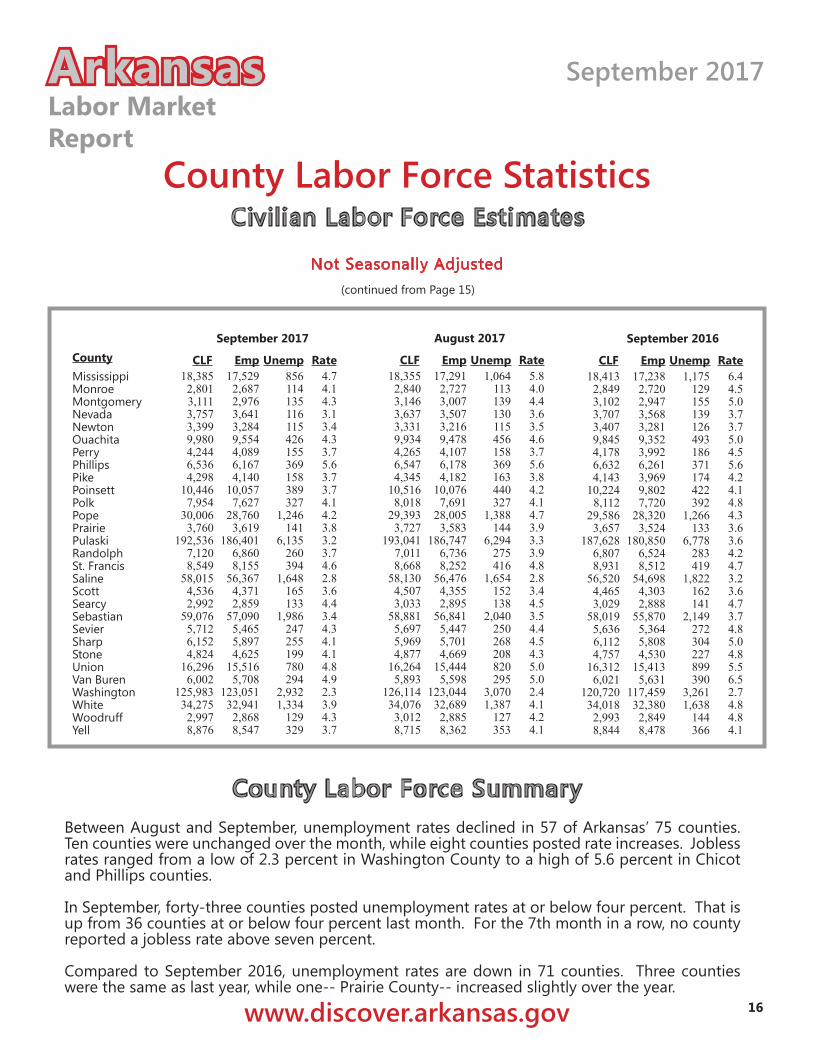
Not Seasonally Adjusted(continued from Page 15)
Civilian Labor Force Estimates
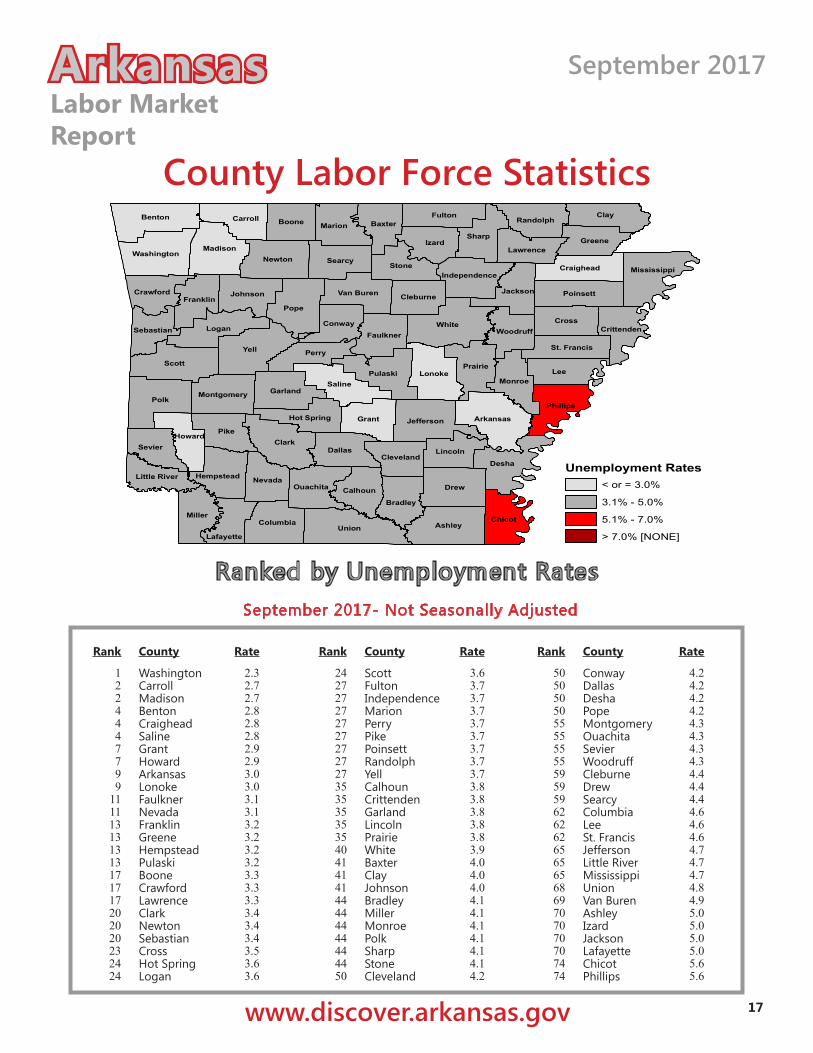
County Labor Force SummaryBetween August and September, unemployment rates declined in 57 of Arkansas’ 75 counties. Ten counties were unchanged over the month, while eight counties posted rate increases. Jobless rates ranged from a low of 2.3 percent in Washington County to a high of 5.6 percent in Chicot and Phillips counties.
In September, forty-three counties posted unemployment rates at or below four percent. That is up from 36 counties at or below four percent last month. For the 7th month in a row, no county reported a jobless rate above seven percent.
Compared to September 2016, unemployment rates are down in 71 counties. Three counties were the same as last year, while one-- Prairie County-- increased slightly over the year.
ArkansasLabor MarketReport
September 2017
County Labor Force Statistics
www.discover.arkansas.gov 17
County
September 2017- Not Seasonally Adjusted
Ranked by Unemployment Rates
WashingtonCarrollMadisonBentonCraigheadSalineGrantHowardArkansasLonokeFaulknerNevadaFranklinGreeneHempsteadPulaskiBooneCrawfordLawrenceClarkNewtonSebastianCrossHot SpringLogan
2.32.72.72.82.82.82.92.93.03.03.13.13.23.23.23.23.33.33.33.43.43.43.53.63.6
Rate
1224447799
111113131313171717202020232424
Rank County
ScottFultonIndependenceMarionPerryPikePoinsettRandolphYellCalhounCrittendenGarlandLincolnPrairieWhiteBaxterClayJohnsonBradleyMillerMonroePolkSharpStoneCleveland
3.63.73.73.73.73.73.73.73.73.83.83.83.83.83.94.04.04.04.14.14.14.14.14.14.2
Rate
24272727272727272735353535354041414144444444444450
Rank County
ConwayDallasDeshaPopeMontgomeryOuachitaSevierWoodruffCleburneDrewSearcyColumbiaLeeSt. FrancisJeffersonLittle RiverMississippiUnionVan BurenAshleyIzardJacksonLafayetteChicotPhillips
4.24.24.24.24.34.34.34.34.44.44.44.64.64.64.74.74.74.84.95.05.05.05.05.65.6
Rate
50505050555555555959596262626565656869707070707474
Rank
Yell
Polk
White
Union
ScottLee
Clark
Pope
Drew
Clay
Pike
Ashley
Desha
Benton
Izard
Saline
Logan
Miller
Grant
Newton
Pulaski
Arkansas
Lonoke
Dallas
Stone
Cross
Perry
Chicot
Sharp
Prairie
Madison
Fulton
Searcy
Phillips
Carroll
Jefferson
MarionBoone
Poinsett
Garland
Baxter
Sevier
Bradley
Mississippi
Nevada
Monroe
Greene
Washington
Ouachita
Johnson
Columbia
Jackson
Howard
Franklin
Faulkner
Lincoln
Calhoun
Conway
Van Buren
Craighead
Randolph
CrawfordCleburne
Hempstead
Woodruff
Montgomery
Lawrence
Crittenden
St. Francis
Cleveland
Lafayette
Hot Spring
Sebastian
Independence
Little RiverUnemployment Rates
< or = 3.0%
3.1% - 5.0%
5.1% - 7.0%
> 7.0% [NONE]
ArkansasLabor MarketReport
September 2017
Local Workforce Development AreasCivilian Labor Force Estimates
www.discover.arkansas.gov 18
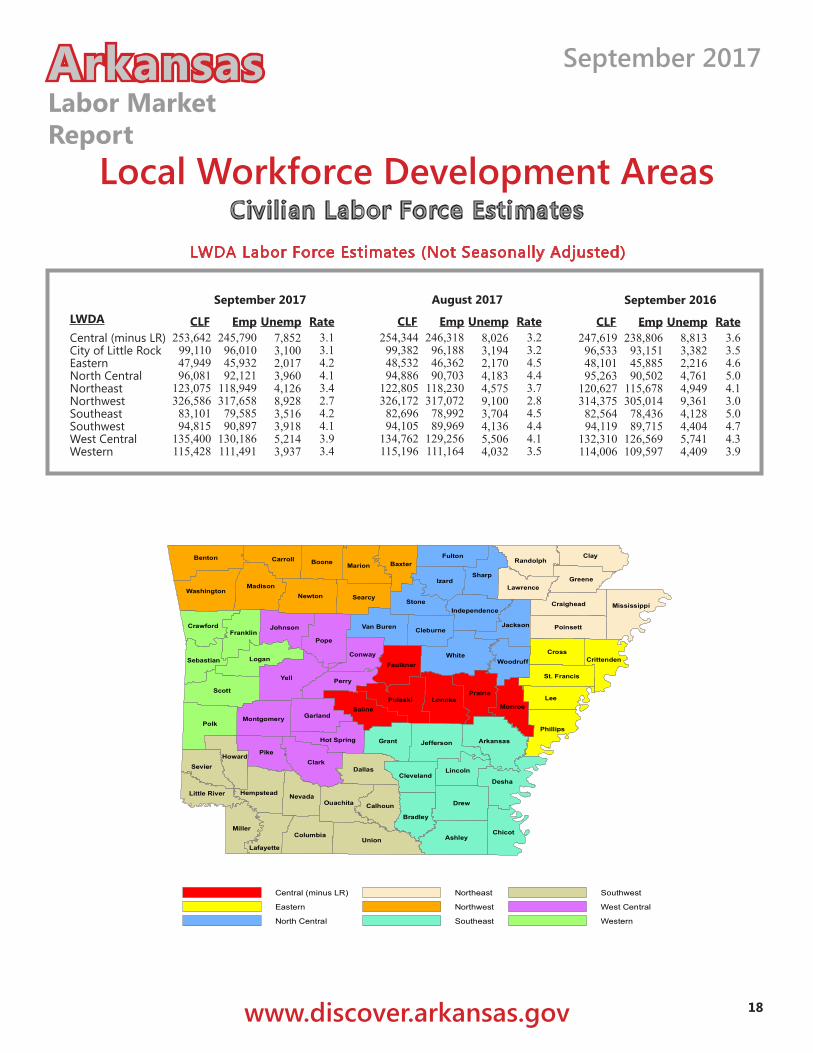
LWDA Labor Force Estimates (Not Seasonally Adjusted)
Central (minus LR)City of Little RockEasternNorth CentralNortheastNorthwestSoutheastSouthwestWest CentralWestern
253,64299,11047,94996,081
123,075326,58683,10194,815
135,400115,428
245,79096,01045,93292,121
118,949317,65879,58590,897
130,186111,491
LWDA CLF Emp Unemp3.13.14.24.13.42.74.24.13.93.4
Rate254,34499,38248,53294,886
122,805326,17282,69694,105
134,762115,196
246,31896,18846,36290,703
118,230317,07278,99289,969
129,256111,164
CLF Emp Unemp3.23.24.54.43.72.84.54.44.13.5
Rate247,61996,53348,10195,263
120,627314,37582,56494,119
132,310114,006
238,80693,15145,88590,502
115,678305,01478,43689,715
126,569109,597
CLF Emp Unemp3.63.54.65.04.13.05.04.74.33.9
Rate
September 2017 August 2017 September 2016
Yell
Polk
White
Union
ScottLee
Clark
Pope
Drew
Clay
Pike
Ashley
Desha
Benton
Izard
Saline
Logan
Miller
Grant
Newton
Pulaski
Arkansas
Lonoke
Dallas
Stone
Cross
Perry
Chicot
Sharp
Prairie
Madison
Fulton
Searcy
Phillips
Carroll
Jefferson
MarionBoone
Poinsett
Garland
Baxter
Sevier
Bradley
Mississippi
Nevada
Monroe
Greene
Washington
Ouachita
Johnson
Columbia
Jackson
Howard
Franklin
Faulkner
Lincoln
Calhoun
Conway
Van Buren
Craighead
Randolph
CrawfordCleburne
Hempstead
Woodruff
Montgomery
Lawrence
Crittenden
St. Francis
Cleveland
Lafayette
Hot Spring
Sebastian
Independence
Little River
Central (minus LR)
Eastern
North Central
Northeast
Northwest
Southeast
Southwest
West Central
Western
7,8523,1002,0173,9604,1268,9283,5163,9185,2143,937
8,0263,1942,1704,1834,5759,1003,7044,1365,5064,032
8,8133,3822,2164,7614,9499,3614,1284,4045,7414,409