Arkansas Labor Market · 2016-04-28 · Spotlight A Comparative Look at Unemployment Rates Due to...
8
Nonfarm Payroll Jobs Increase 3,200 in October Arkansas’ Unemployment Rate Declines to 5.1 Percent Employment Headlines Employment Quick Facts Nonfarm Payroll Summary Oct 15 Sep 15 Oct 14 Total Nonfarm Goods Producing Service Providing 1,223,300 1,220,100 1,203,600 215,900 216,000 212,300 1,007,400 1,004,100 991,300 State of Arkansas Unemployment Rates AR Unemployment Rate US Unemployment Rate Oct 15 Sep 15 Oct 14 5.1 5.2 5.8 5.0 5.1 5.7 Seasonally Adjusted Jobs in Service Providing Industries State of Arkansas January 2013 - October 2015 www.discover.arkansas.gov Arkansas Labor Market October 2015 940,000 950,000 960,000 970,000 980,000 990,000 1,000,000 1,010,000 1,020,000 J F M A M J J A S O N D 2013 2014 2015
Transcript of Arkansas Labor Market · 2016-04-28 · Spotlight A Comparative Look at Unemployment Rates Due to...

Nonfarm Payroll Jobs Increase 3,200 in October
Arkansas’ Unemployment Rate Declines to 5.1 Percent
E m p l o y m e n t H e a d l i n e s
E m p l o y m e n t Q u i c k F a c t sNonfarm Payroll Summary
Oct 15 Sep 15 Oct 14
Total Nonfarm
Goods Producing Service Providing
1,223,300 1,220,100 1,203,600
215,900 216,000 212,300
1,007,400 1,004,100 991,300
State of Arkansas
Unemployment Rates
AR Unemployment Rate
US Unemployment Rate
Oct 15 Sep 15 Oct 14
5.1 5.2 5.8
5.0 5.1 5.7
Seasonally Adjusted
Jobs in Service Providing IndustriesState of Arkansas
January 2013 - October 2015
www.discover.arkansas.gov
Arkansas Labor MarketOctober 2015
940,000
950,000
960,000
970,000
980,000
990,000
1,000,000
1,010,000
1,020,000
J F M A M J J A S O N D
2013 2014 2015

State of Arkansas
Total Nonfarm Goods Producing Mining & Logging Construction Specialty Trade Contractors Manufacturing Durable Goods Nondurable Goods Service Providing Trade, Transportation & Utilities Wholesale Trade Retail Trade Transport, Warehousing & Utilities Information Financial Activities Finance & Insurance Real Estate & Rental & Leasing Professional & Business Services Professional,Scientific&Technical Management of Companies Administrative & Support Services Educational & Health Services Educational Services Health Care & Social Assistance Ambulatory Health Care Social Assistance Leisure & Hospitality Arts, Entertainment & Recreation Accommodation & Food Services Accommodation Services Food Services Other Services Government Federal Government State Government Local Government
Oct 15 Sep 15 Oct 14 (NAICS)
Nonfarm Payroll Jobs
Manufacturing Durable Goods Nondurable Goods
Oct 15 Oct 14 Sep 15 Oct 15 Oct 14 Sep 15 Oct 15 Sep 15 Oct 14
Average Weekly Earnings Average Weekly Hours Average Hourly Earnings
Hours and Earnings of Arkansas Production Workers(Manufacturing Industries)
September 2015 - October 2015
Nonfarm payroll jobs in Arkansas increased 3,200 in October to total 1,223,300. Employ-ment rose in six major industry sectors, while four sectors declined. Government added 2,200 jobs. Local (+1,400) and state (+800) gov-ernment posted all the gains, as public school employment reaches full capacity. Educational and health services increased 1,100. Most of the additions occurred in health care and social assistance (+800). Jobs in trade, transporta-tion, and utilities rose 1,100. All gains were in retail trade (+1,600), which more than offset minor declines in other subsectors. Leisure and hospitality decreased 2,100. Losses oc-curred in arts, entertainment, and recreation (-800) and accommodation and food services (-1,300), both typical seasonal declines.
October 2014 - October 2015
Compared to October 2014, Arkansas’ non-farm payroll employment is up 19,700. Seven major industry sectors reported job growth, as four sectors declined. Construction post-ed the greatest increase, adding 8,200 jobs. Most of the gains were in specialty trade con-tractors (+7,200). Jobs in educational and health services rose 5,400. Expansions in health care and social assistance (+6,200) more than offset the losses in educational services (-800). Professional and business services added 4,400 jobs, with additions reported across all subsectors. Employment in leisure and hospitality rose 3,200. A majority of the growth was in food services (+2,500). Jobs in manufacturing declined 3,900. Losses were reported in both durable goods (-2,300) and nondurable goods (-1,600) manufacturing.
1,203,600212,300
9,00046,40029,000
156,90077,70079,200
991,300246,30046,500
136,20063,60013,70049,50036,70012,800
136,40039,30033,20063,900
175,10015,000
160,10050,00037,500
109,20010,30098,90011,00087,90043,700
217,40020,20079,800
117,400
1,220,100216,000
8,30055,30036,000
152,40075,30077,100
1,004,100245,60048,100
134,80062,70013,70051,00037,90013,100
140,90040,20034,30066,400
179,40013,900
165,50051,50038,600
114,50011,700
102,80011,10091,70044,300
214,70020,20079,600
114,900
1,223,300215,900
8,30054,60036,200
153,00075,40077,600
1,007,400246,70047,700
136,40062,60013,60051,30038,20013,100
140,80041,20034,70064,900
180,50014,200
166,30051,70039,200
112,40010,900
101,50011,10090,40045,200
216,90020,20080,400
116,300
$661.57710.12612.57
$666.20711.79622.05
$669.44719.35621.92
41.441.041.7
41.239.542.9
41.441.241.6
$15.9817.3214.69
$16.1718.0214.50
$16.1717.4614.95
Nonfarm Payroll Employment

SpotlightA Comparative Look at Unemployment Rates
Due to differing economies and labor force conditions in various parts of the country, unemployment rates vary greatly from state to state. In October 2015, state jobless rates ranged from a low of 2.8 percent in North Dakota to a high of 6.9 percent in West Virginia. The unemployment rate in Arkansas in October declined to 5.1 percent, a ranking of 27 out of 51 states. By looking at the map below, it becomes apparent that trends exist among states that are located within the same region. While there are some exceptions, western states tend to have higher jobless rates than states located in the midwest. Simi-larly, states located in the northeast generally experience lower unemployment rates than states located in the southeast. These regional trends occur because states often experience economic similarities based on shared industries, work forces, and climates.
North DakotaNebraskaSouth DakotaHawaiiNew HampshireIowaUtahMinnesotaVermontColoradoIdahoWyomingKansasMontanaVirginiaMaineOklahomaWisconsinIndianaOhio
CaliforniaAlabamaMississippiOregonArizonaLouisianaAlaskaDistrict of ColumbiaNevadaNew MexicoWest Virginia
123446788
1011111313151616161919
4142424445464748485051
2.82.93.23.33.33.53.63.73.73.84.04.04.14.14.24.34.34.34.44.4
5.85.95.96.06.16.26.46.66.66.86.9
Rank
U.S. Unemployment Rate = 5.0 Percent
1922232425252727272727273334353537373939
TexasMassachusettsNew YorkKentuckyMichiganMissouriArkansasConnecticutDelawareFloridaMarylandPennsylvaniaWashingtonRhode IslandIllinoisNew JerseySouth CarolinaTennesseeGeorgiaNorth Carolina
State4.44.64.84.95.05.05.15.15.15.15.15.15.25.35.45.45.65.65.75.7
Rate Rank State Rate Rank State Rate
Unemployment Rates, Ranked by State (Seasonally Adjusted)October 2015
Unemployment Rates, Ranked by State (Seasonally Adjusted)October 2015
Continental U.S. Only

Nonfarm Payroll Jobs Nonfarm Payroll Jobs
Total Nonfarm Goods Producing Mining, Logging & Construction Manufacturing Service Providing Trade, Transportation & Utilities Wholesale Trade Retail Trade Trans., Warehousing & Utilities Information Financial Activities Professional & Business Services Educational & Health Services Leisure & Hospitality Other Services Government Federal Government State Government Local Government
355,10039,20018,90020,300
315,90066,60014,80038,30013,5006,600
20,80046,60053,30034,00016,30071,7009,700
34,90027,100
353,60039,20018,90020,300
314,40065,80014,90037,20013,7006,600
20,80045,60053,10034,90016,40071,2009,700
34,80026,700
348,40037,10016,80020,300
311,30067,10015,00037,90014,2006,700
20,50045,00052,30032,20016,00071,5009,500
34,60027,400
Total Nonfarm Goods Producing Mining, Logging & Construction Manufacturing Service Providing Trade, Transportation & Utilities Wholesale Trade Retail Trade Trans., Warehousing & Utilities Information Financial Activities Professional & Business Services Educational & Health Services Leisure & Hospitality Other Services Government Federal Government State Government Local Government
232,10035,5008,800
26,700196,60051,40011,10024,70015,6001,8007,000
45,90025,80023,8006,800
34,1002,500
13,60018,000
231,30036,1008,900
27,200195,20051,40011,20024,50015,7001,9006,900
45,30025,70023,8006,800
33,4002,600
13,30017,500
227,20036,1008,600
27,500191,10050,60010,80024,10015,7001,9006,800
45,50025,00021,4006,600
33,3002,500
12,90017,900
NAICS NAICS Oct 15 Sep 15 Oct 14 Oct 15 Sep 15 Oct 14
The LR-NLR-Conway MSA consists of the following counties: Faulkner, Grant, Lonoke, Perry, Pulaski, and Saline
The FSR MSA consists of the following counties: Benton, Madison, Washington, and McDonald (in Missouri)
Civilian Labor Force Estimates Civilian Labor Force Estimates
Jobs in Service Providing IndustriesOctober: 2005 - 2015
Number of EmployedOctober: 2005 - 2015
Little Rock-North Little Rock-Conway MSA
Fayetteville-Springdale-Rogers MSA
Civilian Labor ForceEmployment UnemploymentUnemployment Rate
340,475324,05016,425
4.8
Oct 15 Sep 15 Oct 14351,050335,72515,325
4.4
352,100337,42514,675
4.2
Civilian Labor ForceEmployment UnemploymentUnemployment Rate
241,975232,500
9,4753.9
Oct 15 Sep 15 Oct 14248,850240,075
8,7753.5
250,400241,925
8,4753.4
Metropolitan Statistical Areas
275,000
280,000
285,000
290,000
295,000
300,000
305,000
310,000
315,000
320,000
'05 '06 '07 '08 '09 '10 '11 '12 '13 '14 '15195,000
200,000
205,000
210,000
215,000
220,000
225,000
230,000
235,000
240,000
245,000
'05 '06 '07 '08 '09 '10 '11 '12 '13 '14 '15
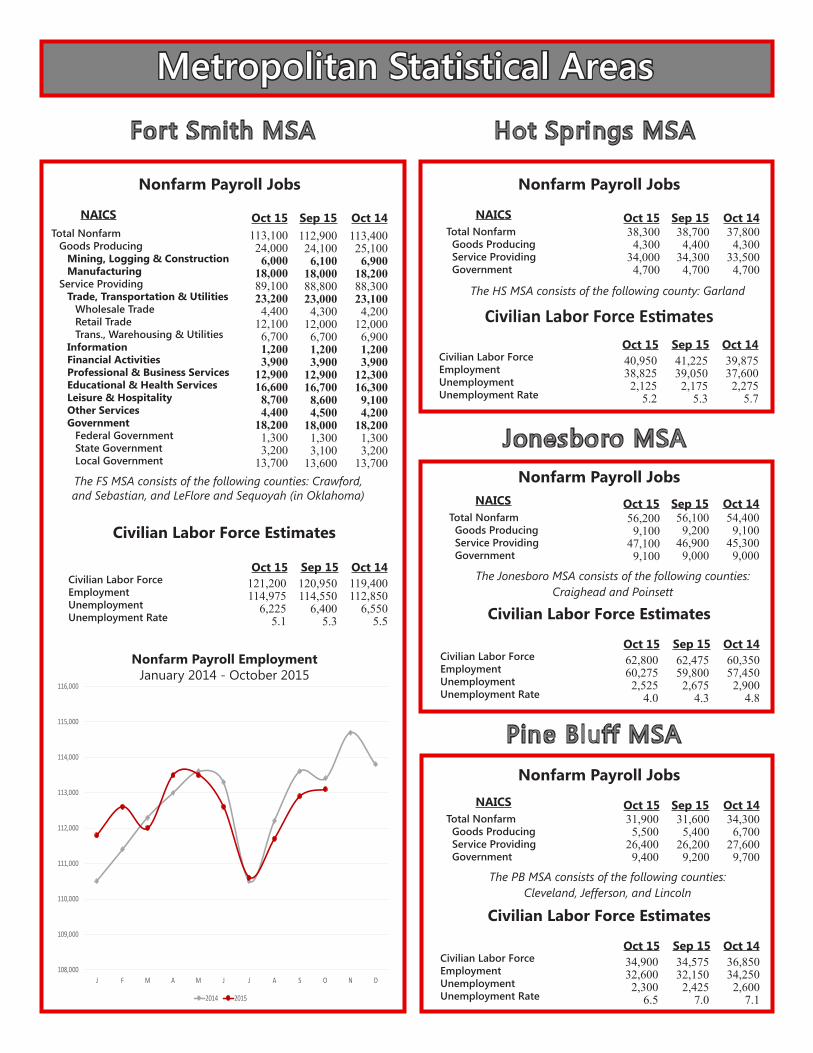
Fort Smith MSA
Nonfarm Payroll Jobs
Total Nonfarm Goods Producing Mining, Logging & Construction Manufacturing Service Providing Trade, Transportation & Utilities Wholesale Trade Retail Trade Trans., Warehousing & Utilities Information Financial Activities Professional & Business Services Educational & Health Services Leisure & Hospitality Other Services Government Federal Government State Government Local Government
113,10024,0006,000
18,00089,10023,2004,400
12,1006,7001,2003,900
12,90016,6008,7004,400
18,2001,3003,200
13,700
112,90024,1006,100
18,00088,80023,0004,300
12,0006,7001,2003,900
12,90016,7008,6004,500
18,0001,3003,100
13,600
113,40025,1006,900
18,20088,30023,1004,200
12,0006,9001,2003,900
12,30016,3009,1004,200
18,2001,3003,200
13,700
NAICS Oct 15 Sep 15 Oct 14
The FS MSA consists of the following counties: Crawford, and Sebastian, and LeFlore and Sequoyah (in Oklahoma)
Civilian Labor Force Estimates
Nonfarm Payroll EmploymentJanuary 2014 - October 2015
Hot Springs MSA
Total Nonfarm Goods Producing Service Providing Government
Nonfarm Payroll Jobs
NAICS Oct 15 Sep 15 Oct 14
The HS MSA consists of the following county: Garland
Civilian Labor Force Estimates
Jonesboro MSA
Pine Bluff MSA
37,8004,300
33,5004,700
38,7004,400
34,3004,700
38,3004,300
34,0004,700
Total Nonfarm Goods Producing Service Providing Government
Nonfarm Payroll JobsNAICS Oct 15 Sep 15 Oct 14
The Jonesboro MSA consists of the following counties: Craighead and Poinsett
Civilian Labor Force Estimates
54,4009,100
45,3009,000
56,1009,200
46,9009,000
56,2009,100
47,1009,100
Total Nonfarm Goods Producing Service Providing Government
Nonfarm Payroll JobsNAICS Oct 15 Sep 15 Oct 14
The PB MSA consists of the following counties: Cleveland, Jefferson, and Lincoln
Civilian Labor Force Estimates
34,3006,700
27,6009,700
31,6005,400
26,2009,200
31,9005,500
26,4009,400
Civilian Labor ForceEmployment UnemploymentUnemployment Rate
119,400112,850
6,5505.5
Oct 15 Sep 15 Oct 14120,950114,550
6,4005.3
121,200114,975
6,2255.1
Civilian Labor ForceEmployment UnemploymentUnemployment Rate
36,85034,2502,600
7.1
Oct 15 Sep 15 Oct 1434,57532,1502,425
7.0
34,90032,6002,300
6.5
Civilian Labor ForceEmployment UnemploymentUnemployment Rate
60,35057,4502,900
4.8
Oct 15 Sep 15 Oct 1462,47559,8002,675
4.3
62,80060,2752,525
4.0
Civilian Labor ForceEmployment UnemploymentUnemployment Rate
39,87537,6002,275
5.7
Oct 15 Sep 15 Oct 1441,22539,0502,175
5.3
40,95038,8252,125
5.2
Metropolitan Statistical Areas
108,000
109,000
110,000
111,000
112,000
113,000
114,000
115,000
116,000
J F M A M J J A S O N D
2014 2015
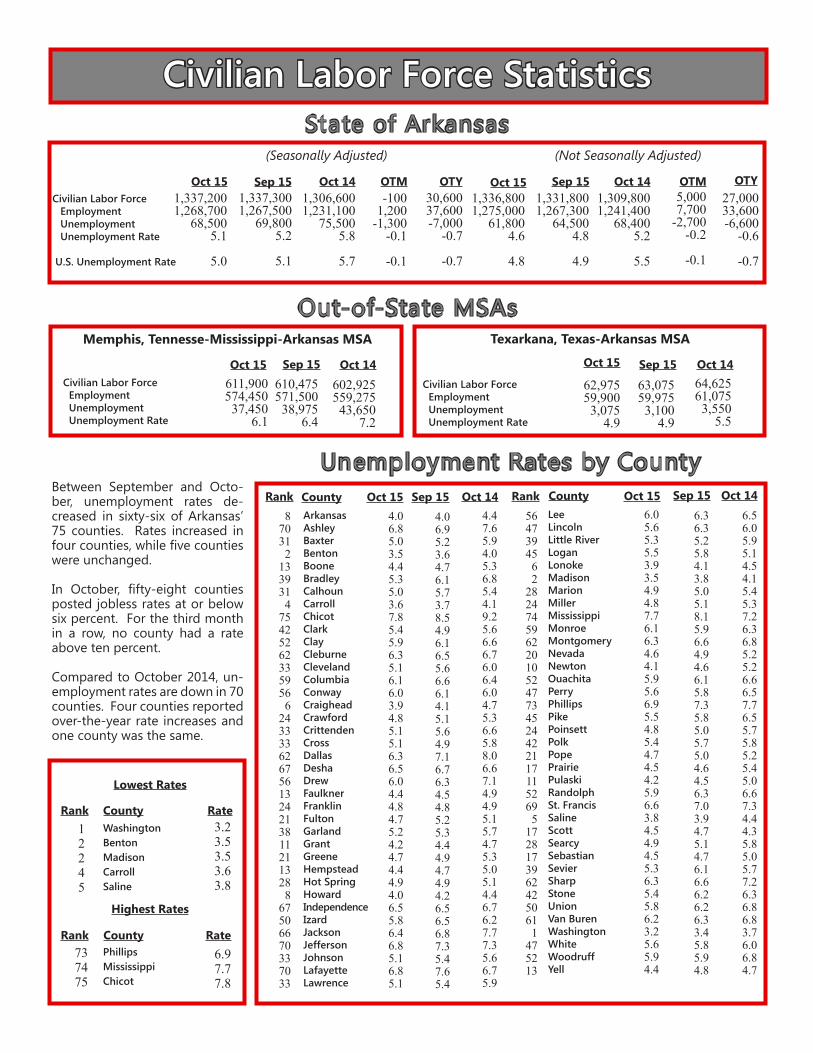
State of Arkansas
Civilian Labor Force Employment Unemployment Unemployment Rate
U.S. Unemployment Rate
Oct 14 Oct 15 Sep 15
(Seasonally Adjusted)
OTY OTM Oct 14 Oct 15 Sep 1527,00033,600-6,600
-0.6
-0.7
OTYOTM 5,0007,700
-2,700-0.2
-0.1
(Not Seasonally Adjusted)
-1001,200
-1,300-0.1
-0.1
30,60037,600-7,000
-0.7
-0.7
1,337,2001,268,700
68,5005.1
5.0
1,337,3001,267,500
69,8005.2
5.1
1,306,6001,231,100
75,5005.8
5.7
1,336,8001,275,000
61,8004.6
4.8
1,331,8001,267,300
64,5004.8
4.9
1,309,8001,241,400
68,4005.2
5.5
Out-of-State MSAs
Civilian Labor Force Employment Unemployment Unemployment Rate
Oct 15 Sep 15 Oct 14611,900574,45037,450
6.1
610,475571,50038,975
6.4
602,925559,27543,650
7.2
Memphis, Tennesse-Mississippi-Arkansas MSA
Civilian Labor Force Employment Unemployment Unemployment Rate
Oct 15 Sep 15 Oct 14
62,97559,9003,075
4.9
63,07559,9753,100
4.9
64,62561,0753,550
5.5
Texarkana, Texas-Arkansas MSA
Unemployment Rates by County
ArkansasAshleyBaxterBentonBooneBradleyCalhounCarrollChicotClarkClayCleburneClevelandColumbiaConwayCraigheadCrawfordCrittendenCrossDallasDeshaDrewFaulknerFranklinFultonGarlandGrantGreeneHempsteadHot SpringHowardIndependenceIzardJacksonJeffersonJohnsonLafayetteLawrence
LeeLincolnLittle RiverLoganLonokeMadisonMarionMillerMississippiMonroeMontgomeryNevadaNewtonOuachitaPerryPhillipsPikePoinsettPolkPopePrairiePulaskiRandolphSt. FrancisSalineScottSearcySebastianSevierSharpStoneUnionVan BurenWashingtonWhiteWoodruffYell
6.56.05.95.14.54.15.45.37.26.36.85.25.26.66.57.76.55.75.85.25.45.06.67.34.44.35.85.05.77.26.36.86.83.76.06.84.7
6.36.35.25.84.13.85.05.18.15.96.64.94.66.15.87.35.85.05.75.04.64.56.37.03.94.75.14.76.16.66.26.26.33.45.85.94.8
6.05.65.35.53.93.54.94.87.76.16.34.64.15.95.66.95.54.85.44.74.54.25.96.63.84.54.94.55.36.35.45.86.23.25.65.94.4
4.06.85.03.54.45.35.03.67.85.45.96.35.16.16.03.94.85.15.16.36.56.04.44.84.75.24.24.74.44.94.06.55.86.46.85.16.85.1
4.06.95.23.64.76.15.73.78.54.96.16.55.66.66.14.15.15.64.97.16.76.34.54.85.25.34.44.94.74.94.26.56.56.87.35.47.65.4
4.47.65.94.05.36.85.44.19.25.66.66.76.06.46.04.75.36.65.88.06.67.14.94.95.15.74.75.35.05.14.46.76.27.77.35.66.75.9
Oct 14 Oct 15 Sep 15 County Oct 14 Sep 15 Oct 15 County8
70312
1339314
754252623359566
24333362675613242138112113288
67506670337033
Rank5647394562
2824745962201052477345244221171152695
17281739624250611
475213
Rank
Rate County Rank
Lowest Rates
12245
WashingtonBentonMadisonCarrollSaline
3.23.53.53.63.8
Rate County Rank
Highest Rates
737475
PhillipsMississippiChicot
6.97.77.8
Between September and Octo-ber, unemployment rates de-creased in sixty-six of Arkansas’ 75 counties. Rates increased in four counties, while five counties were unchanged.
In October, fifty-eight counties posted jobless rates at or below six percent. For the third month in a row, no county had a rate above ten percent.
Compared to October 2014, un-employment rates are down in 70 counties. Four counties reported over-the-year rate increases and one county was the same.
Civilian Labor Force Statistics

The Arkansas Labor Market is prepared monthly in conjunction with the U.S. Department of Labor, Bu-reau of Labor Statistics (BLS). The current month’s estimates are preliminary, while previous data are subject to revision.
Estimates of nonfarm payroll jobs show the num-ber of jobs by industry and reflect employment by place of work. Hours and earnings estimates are based on payroll and worker-hour data col-lected for production workers in manufacturing industries.
Industries are classified according to the North American Industry Classification System (NAICS). All estimates are based on a first quarter 2014 benchmark.
Explanation of Terms and Concepts
Monthly Business Survey of Employers
A monthly sample survey designed to provide industry information on nonfarm payroll jobs. Data are compiled each month from mail surveys and telephone interviews conducted by the Bureau of Labor Statistics in cooperation with Department of Workforce Services. The data are based on establishment records and include all workers, full-or part-time, who received pay during the payroll period which includes the 12th of the
month. Approximately 5,000 Arkansas business establishments are surveyed.
Metropolitan Statistical Area (MSA)
A term applied by the U.S. Office of Management and Budget to counties that have one or more central cities and that meet specified criteria of population density, commuting patterns and social and economic integration.
Current Population Survey (CPS)
A monthly sample survey of the population 16 years of age and over, designed to provide data on the labor force, the employed and the unem-ployed. The survey is conducted each month by the Bureau of the Census for BLS. The information is collected by trained interviewers from a sample of about 60,000 households. The data collected are based on the activity reported for the calendar week including the 12th of the month. Approxi-mately 800 Arkansas households are represented in the sample survey.
Civilian Labor Force
The sum of all employed and unemployed persons 16 years of age or older. Members of the Armed Forces are excluded.
Employment
An estimate of the number of persons who worked any time for pay or profit or worked 15 hours or more as unpaid workers in a family business dur-ing the calendar week which includes the 12th of the month. Also included are those who, although not working, had some job attachment and were not looking for work, and persons involved in labor management disputes.
Unemployment
An estimate of the number of persons who did not have a job, but were available for work and actively seeking work during the calendar week which includes the 12th of the month.
Unemployment Rate
The number of unemployed as a percentage of the civilian labor force. Unemployment rates are calculated from unrounded data.
Seasonal Adjustment
A statistical technique applied to monthly data to eliminate changes that normally occur during the year due to seasonal events such as weather, major holidays, schedule shifts, harvest times, and the opening/closing of schools.
For complete County Labor Force Statistics, please visit our website at www.discover.arkansas.gov
Civilian Labor Force Statistics
Technical Notes

Arkansas Labor MarketOctober 2015
The Arkansas Labor Market is produced by the Department of Workforce Services, Bureau of Labor Statistics. All Statistics are published in cooperation with the United States Department of Labor, Bureau of Labor Statistics.
Auxiliary aids and services are available upon request to individuals with disabilities.
Voice: 1-800-285-1121 TDD: 1-800-285-1131
Asa Hutchinson- Governor Daryl Bassett- DWS Director
Department of Workforce ServicesBureau of Labor StatisticsP.O. Box 2981Little Rock, AR 72203-2981