Arkansas Imports, based on State of Final Destination Information This information is based on...
19
Arkansas Imports, based on State of Final Destination Information This information is based on shipments that were reported as being shipped to an Arkansas destination
-
Upload
hilary-wood -
Category
Documents
-
view
218 -
download
0
Transcript of Arkansas Imports, based on State of Final Destination Information This information is based on...
Arkansas Imports, based on State of Final Destination
Information
This information is based on shipments that were reported as being shipped to
an Arkansas destination

Arkansas Imports, based on State of Final Destination Information
• This information is based on shipments that were reported as being shipped to Arkansas, and not necessarily shipments through Arkansas ports and gateways
• Information was complied from US Census Foreign Trade information by ITTS
Definitions
• Commodity definitions are at the Harmonized Code 2 Digit level
For more information visit http://www.census.gov/foreign-trade/schedules/b/index.html

Outline
• Imports by Mode – Total Flows• Imports by Commodity• Shipments from top Countries
• Each has charts for – All Modes– Air Shipments– Vessel Shipments

Arkansas Inbound International Shipments, Trade by Mode, By Value
2008-2014 ($7.6 Billion)
Other includes shipments that go through land crossings (NAFTA) or other modes, excluding air and maritime gateways
2008 2009 2010 2011 2012 2013 20140
1,000,000,000
2,000,000,000
3,000,000,000
4,000,000,000
5,000,000,000
6,000,000,000
7,000,000,000
8,000,000,000
9,000,000,000
Other (45%)Vessel (47%)Air (8%)

Shipments by Commodity

Arkansas Inbound International Shipments, Top Commodities 2014
(All modes - $7.6 Billion)
Aircraft, Spacecraft, And Parts Thereof (21%)Industrial Machinery, Including Computers (15%)Electric Machinery Etc; Sound Equip; Tv Equip; Pts (9%)Furniture; Bedding Etc; Lamps Nesoi Etc; Prefab Bd (6%)Toys, Games & Sport Equipment; Parts & Ac-cessories (5%)Vehicles, Except Railway Or Tramway, And Parts Etc (4%)Arms And Ammunition; Parts And Accessories Thereof (3%)Plastics And Articles Thereof (3%)Iron And Steel (3%)Textile Art Nesoi; Needlecraft Sets; Worn Text Art (2%)Other (28%)

Arkansas Inbound International Shipments, Top Five Commodities, 2008-2014
(All modes - $7.6 Billion)
20082009
20102011
20122013
20140.0
200,000,000.0
400,000,000.0
600,000,000.0
800,000,000.0
1,000,000,000.0
1,200,000,000.0
1,400,000,000.0
1,600,000,000.0
1,800,000,000.0
2,000,000,000.0Aircraft, Spacecraft, And Parts Thereof (21%)
Industrial Machinery, In-cluding Computers (15%)
Electric Machinery Etc; Sound Equip; Tv Equip; Pts (9%)
Furniture; Bedding Etc; Lamps Nesoi Etc; Prefab Bd (6%)
Toys, Games & Sport Equipment; Parts & Ac-cessories (5%)
Ranking and Share is based on 2014 values
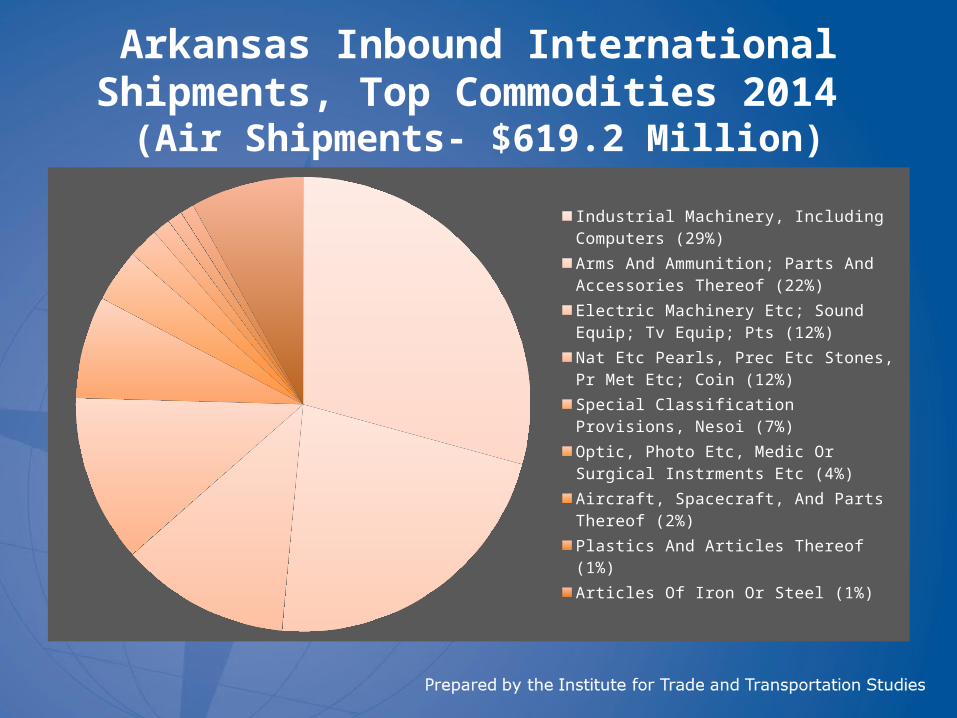
Arkansas Inbound International Shipments, Top Commodities 2014
(Air Shipments- $619.2 Million)
Industrial Machinery, Including Computers (29%)
Arms And Ammunition; Parts And Accessories Thereof (22%)
Electric Machinery Etc; Sound Equip; Tv Equip; Pts (12%)
Nat Etc Pearls, Prec Etc Stones, Pr Met Etc; Coin (12%)
Special Classification Provisions, Nesoi (7%)
Optic, Photo Etc, Medic Or Surgical Instrments Etc (4%)
Aircraft, Spacecraft, And Parts Thereof (2%)
Plastics And Articles Thereof (1%)
Articles Of Iron Or Steel (1%)
Tools, Cutlery Etc. Of Base Metal & Parts Thereof (1%)
Other (8%)
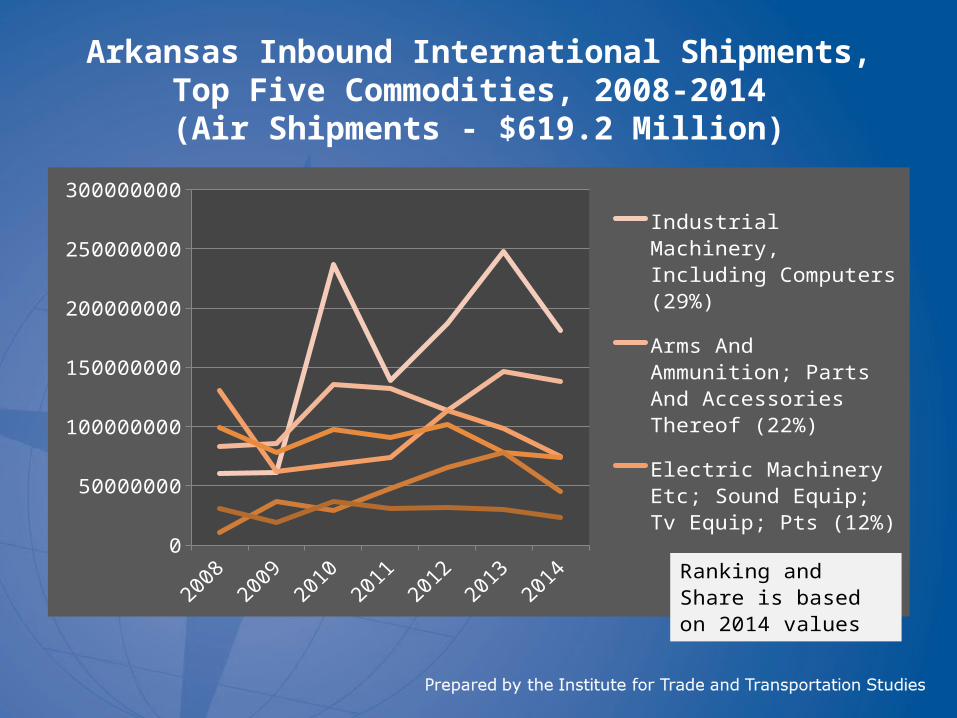
Arkansas Inbound International Shipments, Top Five Commodities, 2008-2014
(Air Shipments - $619.2 Million)
20082009
20102011
20122013
20140
50000000
100000000
150000000
200000000
250000000
300000000Industrial Machinery, Includ-ing Computers (29%)
Arms And Ammunition; Parts And Accessories Thereof (22%)
Electric Machinery Etc; Sound Equip; Tv Equip; Pts (12%)
Nat Etc Pearls, Prec Etc Stones, Pr Met Etc; Coin (12%)
Special Classification Pro-visions, Nesoi (7%)
Optic, Photo Etc, Medic Or Surgical Instrments Etc (4%)
Ranking and Share is based on 2014 values
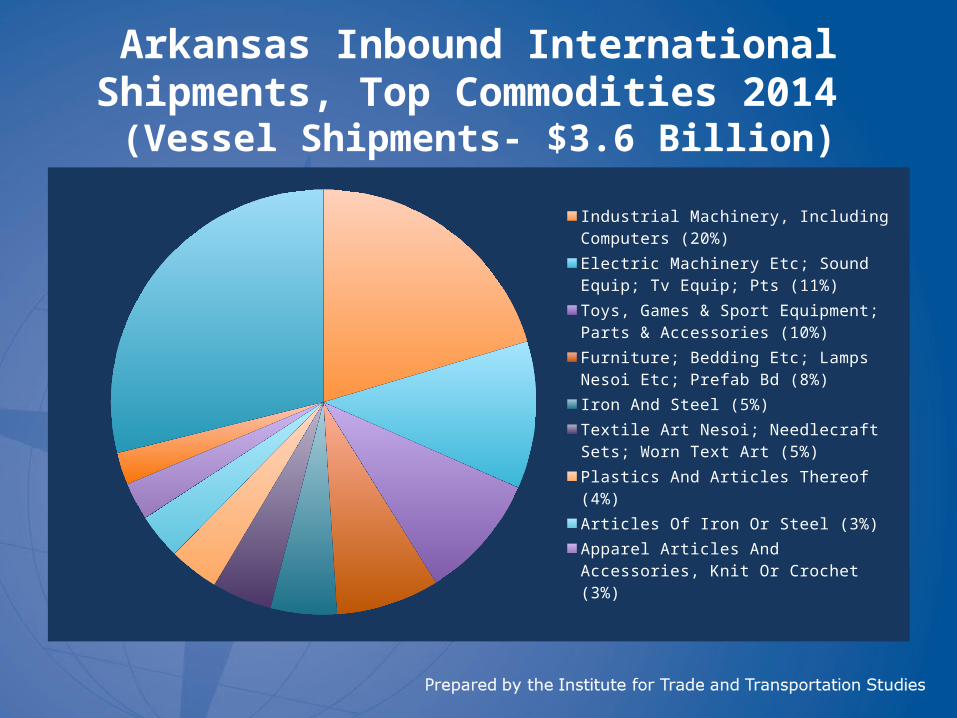
Arkansas Inbound International Shipments, Top Commodities 2014
(Vessel Shipments- $3.6 Billion)
Industrial Machinery, Including Computers (20%)
Electric Machinery Etc; Sound Equip; Tv Equip; Pts (11%)
Toys, Games & Sport Equipment; Parts & Ac-cessories (10%)
Furniture; Bedding Etc; Lamps Nesoi Etc; Prefab Bd (8%)
Iron And Steel (5%)
Textile Art Nesoi; Needlecraft Sets; Worn Text Art (5%)
Plastics And Articles Thereof (4%)
Articles Of Iron Or Steel (3%)
Apparel Articles And Accessories, Knit Or Crochet (3%)
Vehicles, Except Railway Or Tramway, And Parts Etc (2%)
Other (29%)

Arkansas Inbound International Shipments, Top Five Commodities, 2008-2014 (Vessel Shipments - $3.6 Billion)
20082009
20102011
20122013
20140
100,000,000
200,000,000
300,000,000
400,000,000
500,000,000
600,000,000
700,000,000
800,000,000
Industrial Machinery, In-cluding Computers (20%)
Electric Machinery Etc; Sound Equip; Tv Equip; Pts (11%)
Toys, Games & Sport Equipment; Parts & Ac-cessories (10%)
Furniture; Bedding Etc; Lamps Nesoi Etc; Prefab Bd (8%)
Iron And Steel (5%)
Ranking and Share is based on 2014 values

Inbound International Shipments

Arkansas Inbound International Shipments, Top Partners 2014
(All modes - $7.6 Billion)
China (33%) France (21%)
Canada (12%) Mexico (8%)
Germany (4%) India (3%)
Taiwan (2%) Japan (2%)
United Kingdom (1%) Italy (1%)
Other (13%)
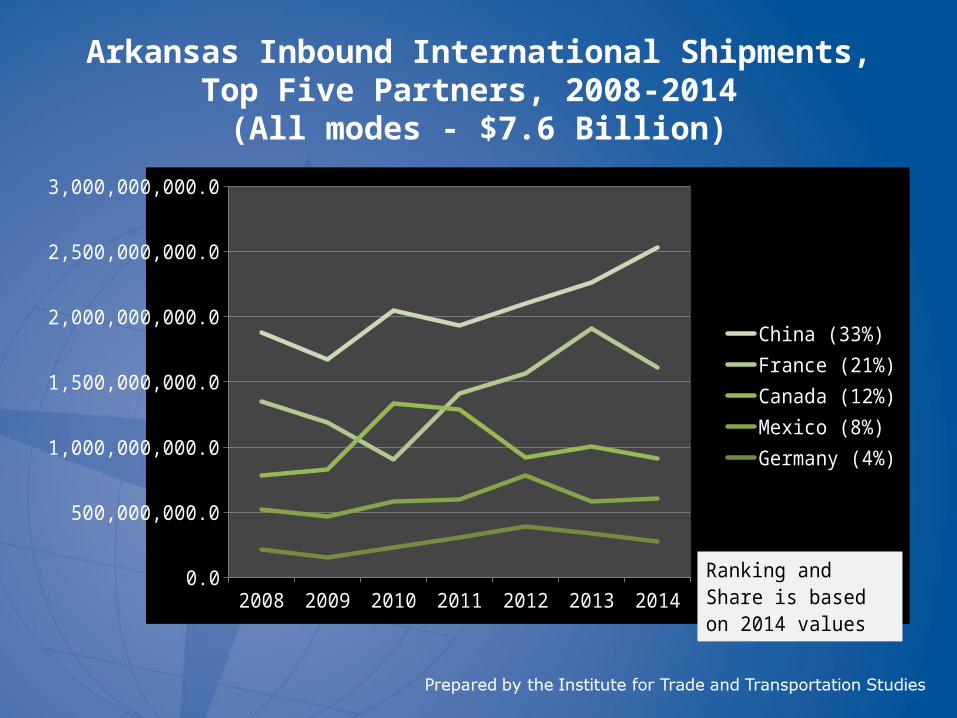
Arkansas Inbound International Shipments, Top Five Partners, 2008-2014
(All modes - $7.6 Billion)
2008 2009 2010 2011 2012 2013 20140.0
500,000,000.0
1,000,000,000.0
1,500,000,000.0
2,000,000,000.0
2,500,000,000.0
3,000,000,000.0
China (33%)France (21%)Canada (12%)Mexico (8%)Germany (4%)
Ranking and Share is based on 2014 values

Arkansas Inbound International Shipments, Top Partners 2014 (Air Shipments- $619.2 Million)
China (32%)
Germany (13%)
United Kingdom (9%)
Netherlands (6%)
India (6%)
France (5%)
Canada (5%)
Italy (3%)
Japan (2%)
Vietnam (2%)
Other (17%)

Arkansas Inbound International Shipments, Top Five Partners, 2008-2014
(Air Shipments - $619.2 Million)
20082009
20102011
20122013
20140
50,000,000
100,000,000
150,000,000
200,000,000
250,000,000
300,000,000
China (32%)Germany (13%)United Kingdom (9%)Netherlands (6%)India (6%)
Ranking and Share is based on 2014 values

Arkansas Inbound International Shipments, Top Partners 2014
(Vessel Shipments- $3.6 Billion)
China (57%)
Germany (5%)
India (5%)
Taiwan (4%)
Japan (3%)
Italy (2%)
Sweden (2%)
Korea, Republic Of (2%)
Israel (2%)
Vietnam (2%)
Other (18%)
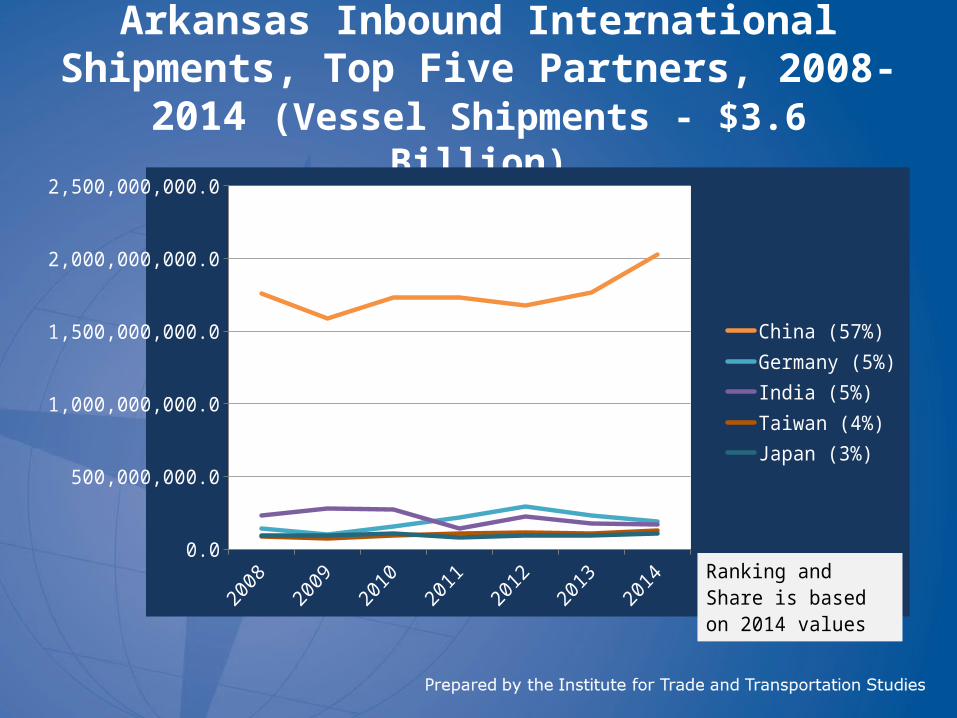
Arkansas Inbound International Shipments, Top Five Partners, 2008-2014 (Vessel Shipments - $3.6 Billion)
0.0
500,000,000.0
1,000,000,000.0
1,500,000,000.0
2,000,000,000.0
2,500,000,000.0
China (57%)Germany (5%)India (5%)Taiwan (4%)Japan (3%)
Ranking and Share is based on 2014 values