Aqua eSolutions, Soluciones Software Sector Textil y Moda - Aqua eFashion
Upload
truonghanhCategory
view
219download
1
StateofArkansaseSolutionsBenchmarkingReport2015
StrategicNetworksGroup,Inc.2015 www.sngroup.com Page1of36
ArkansaseSolutionsBenchmarkingReport
March2015
Preparedfor
StrategicNetworksGroup,Inc.|www.sngroup.com|CONFIDENTIAL
StateofArkansaseSolutionsBenchmarkingReport2015
StrategicNetworksGroup,Inc.2015 www.sngroup.com Page2of36
TableofContents
ExecutiveSummary..................................................................................................................4
1 OrganizationalAssessment...............................................................................................81.1 RespondentProfile.................................................................................................................81.2 OrganizationalConnectivityCharacteristics..........................................................................11
1.2.1 InternetSpeeds...................................................................................................................111.2.2 Cost.....................................................................................................................................151.2.3 Satisfaction..........................................................................................................................15
1.3 BroadbandUtilizationandBenefits......................................................................................161.3.1 UtilizationPatterns..............................................................................................................161.3.2 BroadbandandDecidingWheretoLocate.........................................................................201.3.3 BroadbandBenefitsandImpacts........................................................................................21
1.4 BarriersandAdoptionIssues................................................................................................221.4.1 BarrierstoAdoption............................................................................................................221.4.2 ExpertiseandKnowledgeIssues.........................................................................................221.4.3 SkillsAcquisition..................................................................................................................23
1.5 FinancialandEmploymentImpactsfromInternetUse..........................................................24
2 Benchmarks....................................................................................................................262.1 TheDigitalEconomyIndex...................................................................................................262.2 UtilizationBenchmarks.........................................................................................................27
3 ComparativeAnalysis......................................................................................................30
StateofArkansaseSolutionsBenchmarkingReport2015
StrategicNetworksGroup,Inc.2015 www.sngroup.com Page3of36
ListofFigures
Figure1–ResponsesbyRegion.....................................................................................................................8Figure2-ResponsesbyLevelofUrbanization..............................................................................................8Figure3-ResponsesbyEmploymentSizeofOrganization(NumberofEmployees)...................................9Figure4-ResponsesbyIndustrySector.....................................................................................................10Figure5–HowBusinessesandNonprofitOrganizationsConnecttotheInternetinArkansas.................11Figure6–Speed-TestResultsforAverageUploadSpeeds(businessesandnonprofitorganizations).......12Figure7-Speed-TestResultsforAverageDownloadSpeeds(businessesandnonprofitorganizations)...12Figure8–AverageUploadSpeedsbySector...............................................................................................13Figure9–Speed-TestResultsbyTypeofConnectivity(allsectors)...........................................................13Figure10–DownloadSpeeds(mbps)byConnectionandLevelofUrbanization(allsectors)....................14Figure11–UploadSpeeds(mbps)byConnectionandLevelofUrbanization(allsectors).........................14Figure12–InternetCostsbyTypeofConnection(allsectors)...................................................................15Figure13–eCommerceUsesofBroadband...............................................................................................16Figure14–eProcessUsesofBroadband....................................................................................................17Figure15–BusinessUtilizationofMobileInternet....................................................................................18Figure16–UseofWeb-enabledMobileDevices.......................................................................................18Figure17–PercentageofBusinessesUsingCloudBasedServices............................................................19Figure18–MotivatingDriversofAdoptionofCloudServices...................................................................19Figure19-Mobileapplicationsusedbybusinesses...................................................................................20Figure20–ImportanceofBroadbandBenefitsforBusinesses..................................................................21Figure21–BarrierstoGreaterBusinessesUseoftheInternet..................................................................22Figure22–PreferredMethodsforAcquiringInternalKnowledge.............................................................23Figure23–AnnualRevenuesandCostSavingsfromInternetUtilization..................................................24Figure24–SummaryofEmploymentImpactsofBusinessResponses(FullandPartTimecombined).....25Figure25–SummaryofEmploymentImpactsSpecifictoInternetUse(FullandPartTimecombined)...25Figure26-SummaryofEmploymentImpactsSpecifictoInternetUse(FullandPartTimecombined)....27Figure27–UtilizationBenchmarks(DEi)forBusinessesbyLevelofUrbanization....................................28Figure28–UtilizationBenchmarks(DEi)forBusinessesbyRegion...........................................................28Figure29–UtilizationBenchmarks(DEi)forBusinessesbySizeofBusiness.............................................29Figure30–UtilizationBenchmarks(DEi)byIndustrySector......................................................................29Figure31-Differentindustrysectorsfrommetropolitanareas.................................................................31Figure32-Differentindustrysectorsfromnon-metropolitanareas.........................................................31Figure33-Businessesfromfivedifferentsizerangesinmetropolitanareas............................................32Figure34-Businessesfromfivedifferentsizerangesinnon-metropolitanareas.....................................32
ArkansaseSolutionsBenchmarkingReport2015
StrategicNetworksGroup.Inc.2015 www.sngroup.com Page4of36
ExecutiveSummaryThiseSolutionsBenchmarking(eSB)ReportisadocumentationofdatacollectedinArkansasbetweenNovember2014andFebruary2015.Thissummaryprovidesanunderstandingofcurrentbroadbandaccess,adoptionandutilizationpatternsaroundthestate.
ResponseLevels:Atotalof1,532organizationscontributedtothebroadbandbenchmarkingeffort.Theorganizationsconsistedof1,236commercialbusinesses,95governmententitiesand201non-profitorganizations.BusinessesandOrganizationsConnectivity:Whileonly1.5%ofrespondentsfailedtomeettheoriginalFCCdefinitionofbroadband(768kbpsormoreinatleastonedirection),speedtestresultsduringtheassessmentshowedthatahighpercentageofrespondentsweresignificantlybelowtherecentlyannouncedFCCstandardforbroadband1.Ofthosetakingthespeedtest,63.1%haduploadspeedsoflessthanthenewstandardof3mbps,while80%failedtomeetthenewdownloadstandardof25mbps.Inrecentyears,wirelessnetworksandmobiledeviceshaveincreasinglybecomeafactorinhowpeoplecommunicate,andhowbusinessesandorganizationsbringefficiencytotheiroperations.Over83%ofbusinessesuseasmartphoneand76.8%useaweb-enabledlaptopcomputer.Lookingtocapitalizeonthesenewerchannelsofcommunications,47.6%ofbusinesseshavenonethelessrecognizedtheimportanceofmobilesappsandhavetailoredtheirexistingwebsitestomobiledevices.Further,26.9%percentofbusinessesareplanningtooptimizetheirwebsitesformobilebrowsers.InternetUtilizationPatterns:Almost80%ofbusinessesusetheInternettopurchasegoodsandservicesonline.Incontrast,only40.3%ofbusinessessellgoodsandservicesonlineandjustover36.8%deliverservicesandcontentonline.Section1.3looksatthelevelofadoptionofdifferenttypesofInternetapplications,aswellascloudsolutions,useofmobileservices,andwhichimpactsofInternetusearemostvaluedbytheirusers.Barriers:SecurityandprivacyconcernsarethetwobarrierstoInternetutilizationthatratethehighestinimportance,with40%and29%ofbusinesses,respectively,ratingthemasveryimportantbarriers.FinancialandEmploymentImpactsofInternetUse:Whileover1,682newpositionswerecreatedbyrespondingbusinessesinthepreceding12months,thesebusinessesalsoexperiencedsizeablejobreductions,resultinginanetjobincreaseof1,290positions.ThenetjobincreaseattributedtousingtheInternetwas461positionsor29.4%ofallnewjobs.Section1.5outlinesemploymentimpacts,aswellasreportedimpactsonrevenuesandcostsinrespondingorganizations.
1http://www.washingtonpost.com/blogs/the-switch/wp/2015/01/29/the-fcc-has-set-a-new-faster-definition-for-broadband/
ArkansaseSolutionsBenchmarkingReport2015
StrategicNetworksGroup.Inc.2015 www.sngroup.com Page5of36
BenchmarksforOrganizations:Section2providesstatewidebenchmarkingtocomparehowdifferentregionsandindustrysectorsutilizetheInternet.KeyconclusionsarethatsizeofbusinessandgeographiclocationarekeyfactorsinthelevelofInternetutilization.LargerandmoremetropolitanbusinessesutilizetheInternetmorethansmallerandmoreruralbusinesses.Inessence,thereisadigitaldivideorutilizationgap,betweensmallandlargebusinesses.
ArkansaseSolutionsBenchmarkingReport2015
StrategicNetworksGroup.Inc.2015 www.sngroup.com Page6of36
IntroductionThiseSolutionsBenchmarking(eSB)ReportisasummaryreportthatprovidesinsightsintocurrentInternetaccess,adoptionandutilizationpatternsacrossArkansas.OnbehalfofConnectArkansas,SNGreachedouttocommercialandnon-commercialorganizationsacrossthestatetoencourageparticipationintheonlineassessment.Businesses,non-profitorganizationsandsomegovernmententitieswereaskedtocompleteaself-assessmentintheformofanonlinesurveythatcollectedinformationontheavailabilityofbroadband(high-speedInternetaccess),howbroadbandisbeingusedintheorganization,alongwithquestionsthatwouldhelpidentifybenefits,driversandbarrierstoadoptionandutilization.Whileitisnotpossibletoincludeeveryquestionandresponsefromtheassessmenthere,thiseSBreportprovidesinsightsintokeyfindingsthatpointtogapsandopportunitiesforincreasingbroadbandutilization.Inadditiontotheinformationpresentedinthisreport,allthedatacollectedthroughthisinitiativeisavailablethroughanonlineplatformcalledtheDigitalEconomyAnalyticsPlatform(DEAP),whichthestaffofConnectArkansascanaccess.TheinsightscontainedwithinthiseSBreportshouldbeusedasaguidefordevelopinganoverallbroadbandutilizationstrategy.Thereportisorganizedintothefollowingsections:
• IntroductionandMethodologyOverview–Abriefdescriptionofthebenchmarkinginitiative,anoverviewofthekeymethodsused,andscopeofresearchandanalysis.
• KeyFindings–SummaryandhighlightsfromdataprovidedbyArkansasbusinesses.
• BenchmarksforAnalysisofInternetUtilization–Asabenchmarkingprocess,SNGhascreated
theDigitalEconomyIndex(DEi)tocompareInternetusebetweengroupsbyvariouscharacteristics,suchasindustry,businesssize,andgeographiclocation.Benchmarkscreatereferencepointsagainstwhichtheperformanceofanyestablishmentorgroupcanbecompared.
• MethodologyOverview–Thecoremethodologyisfoundedonprimaryresearchconsistingof
datacollectionthroughanonlineself-assessmentofbothcommercialandnon-commercialorganizations.InformationwascollecteddirectlyfromInternetusersinthefollowingcategories:userprofile,Internetutilization,InternetbenefitsandbarrierstoInternetuse.
Theorganizationalassessmentsweremadeavailableforonlineaccessthroughoneoftwomeans:
• Individualbusinessesandnon-commercialorganizations2wereinvitedtoparticipateviadirectemailinvitationssentfromalarge,statewidecontactlist.
2Thisreportcategorizesorganizationsintofourareas:businesses,non-profitorganizations,andgovernmententities.Theterm“non-commercialorganizations”includesbothnon-profitorganizationsandgovernmententities.
ArkansaseSolutionsBenchmarkingReport2015
StrategicNetworksGroup.Inc.2015 www.sngroup.com Page7of36
• Businessesandnon-commercialorganizationswereencouragedthroughavarietyofcommunicationschannelstoaccessaweblinktotheonlineassessment.
Emailinvitationsweresentdirectlyto34,300organizationsacrossArkansas,providingaccesstotheonlineassessment.TheinitialemailinvitationwassentonNovember20th,2014andreminderemailsweresentroughlyeverysevendayswiththeassessmentsprocessclosingonFebruary18th,2015.Atotalof1,532organizationscontributedtothebroadbandbenchmarkingeffort.Theorganizationsconsistedof1,236commercialbusinesses,95governmententitiesand201non-profitorganizations.ThiseSolutionsBenchmarkingReportprovidesaveryusefuloverviewofInternetconnectivityandutilizationcharacteristicsinArkansas.AdditionaldatafromtheassessmentandbenchmarkingeffortisprovidedthroughtheArkansasDEAPwebsite,whichisdescribedinAppendixB.Themajorityofrespondentsfullycompletedtheassessments.However,partiallycompletedassessmentsareincludedintheanalysisonthebasisthattheresponsesprovidedarevalidandusefuleveniftherespondentchosenottocompletetheentireassessment.Therefore,everydatachartinthisreportindicatestheN=valuethatprovidesthenumberofdatapointsincludedtogenerateeachparticularfigure.FurtherdetailsonthemethodologyareprovidedinAppendixAwithabriefGlossaryofreportterminologyinAppendixB.
ArkansaseSolutionsBenchmarkingReport2015
StrategicNetworksGroup.Inc.2015 www.sngroup.com Page8of36
IsolatedSmallTown8%
Metropolitan59%
Micropolitan22%
SmallTown11%
1 OrganizationalAssessmentAccesstoandeffectiveuseoftheInternethasbecomeanessentialelementinthesurvivalandsuccessofbothcommercialandnon-commercialorganizationsintoday’seconomyaswellassocietyasawhole.ThissectionidentifieskeyfindingsrelatedtohoworganizationsandbusinessesusetheInternet,whattypesofbenefitstheyvaluemost,andwhichbarrierspreventmoreeffectiveuse.ThereportpaysspecialattentiontoInternetusebybusinesses.Thefindingsarebrokendownbykeyrespondentcharacteristicssuchasindustrysector,employmentsizeandconnectivitytype.
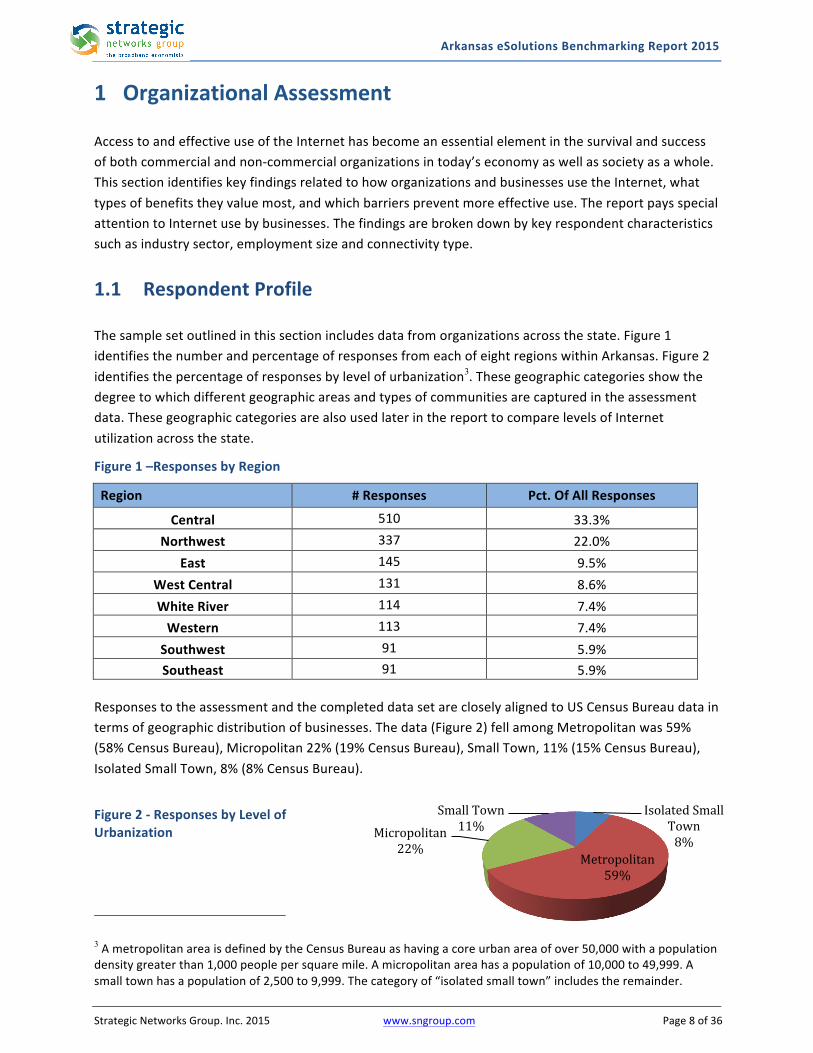
1.1 RespondentProfileThesamplesetoutlinedinthissectionincludesdatafromorganizationsacrossthestate.Figure1identifiesthenumberandpercentageofresponsesfromeachofeightregionswithinArkansas.Figure2identifiesthepercentageofresponsesbylevelofurbanization3.Thesegeographiccategoriesshowthedegreetowhichdifferentgeographicareasandtypesofcommunitiesarecapturedintheassessmentdata.ThesegeographiccategoriesarealsousedlaterinthereporttocomparelevelsofInternetutilizationacrossthestate.
Figure1–ResponsesbyRegion
Region #Responses Pct.OfAllResponses
Central 510 33.3%Northwest 337 22.0%
East 145 9.5%WestCentral 131 8.6%WhiteRiver 114 7.4%Western 113 7.4%Southwest 91 5.9%Southeast 91 5.9%
ResponsestotheassessmentandthecompleteddatasetarecloselyalignedtoUSCensusBureaudataintermsofgeographicdistributionofbusinesses.Thedata(Figure2)fellamongMetropolitanwas59%(58%CensusBureau),Micropolitan22%(19%CensusBureau),SmallTown,11%(15%CensusBureau),IsolatedSmallTown,8%(8%CensusBureau).
Figure2-ResponsesbyLevelofUrbanization
3AmetropolitanareaisdefinedbytheCensusBureauashavingacoreurbanareaofover50,000withapopulationdensitygreaterthan1,000peoplepersquaremile.Amicropolitanareahasapopulationof10,000to49,999.Asmalltownhasapopulationof2,500to9,999.Thecategoryof“isolatedsmalltown”includestheremainder.
ArkansaseSolutionsBenchmarkingReport2015
StrategicNetworksGroup.Inc.2015 www.sngroup.com Page9of36
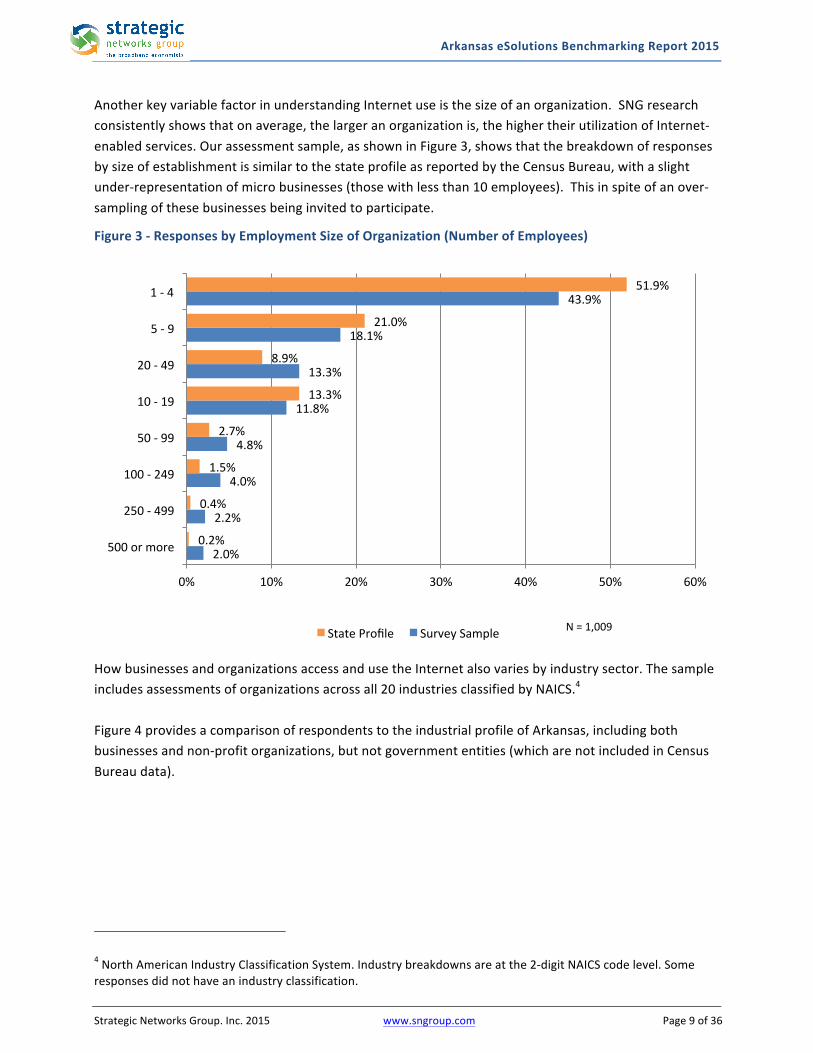
AnotherkeyvariablefactorinunderstandingInternetuseisthesizeofanorganization.SNGresearchconsistentlyshowsthatonaverage,thelargeranorganizationis,thehighertheirutilizationofInternet-enabledservices.Ourassessmentsample,asshowninFigure3,showsthatthebreakdownofresponsesbysizeofestablishmentissimilartothestateprofileasreportedbytheCensusBureau,withaslightunder-representationofmicrobusinesses(thosewithlessthan10employees).Thisinspiteofanover-samplingofthesebusinessesbeinginvitedtoparticipate.
Figure3-ResponsesbyEmploymentSizeofOrganization(NumberofEmployees)
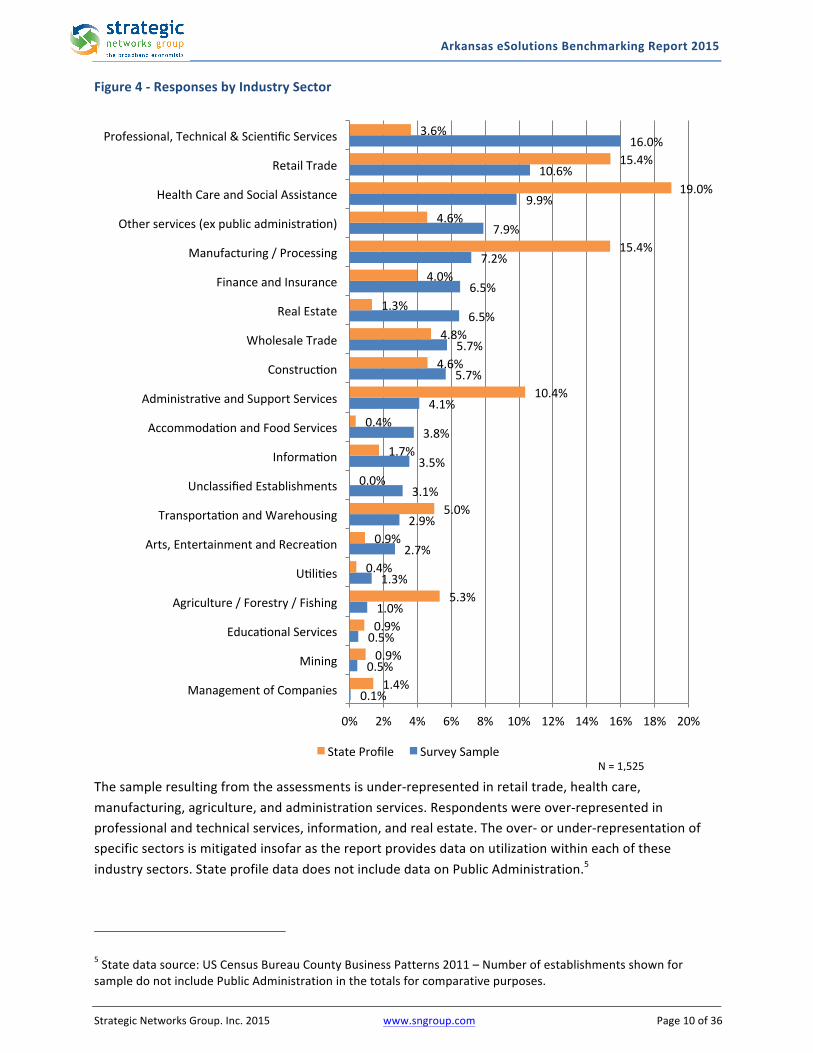
HowbusinessesandorganizationsaccessandusetheInternetalsovariesbyindustrysector.Thesampleincludesassessmentsoforganizationsacrossall20industriesclassifiedbyNAICS.4Figure4providesacomparisonofrespondentstotheindustrialprofileofArkansas,includingbothbusinessesandnon-profitorganizations,butnotgovernmententities(whicharenotincludedinCensusBureaudata).
4NorthAmericanIndustryClassificationSystem.Industrybreakdownsareatthe2-digitNAICScodelevel.Someresponsesdidnothaveanindustryclassification.
2.0%
2.2%
4.0%
4.8%
11.8%
13.3%
18.1%
43.9%
0.2%
0.4%
1.5%
2.7%
13.3%
8.9%
21.0%
51.9%
0% 10% 20% 30% 40% 50% 60%
500ormore
250-499
100-249
50-99
10-19
20-49
5-9
1-4
StateProfile SurveySample N=1,009
ArkansaseSolutionsBenchmarkingReport2015
StrategicNetworksGroup.Inc.2015 www.sngroup.com Page10of36
Figure4-ResponsesbyIndustrySector
Thesampleresultingfromtheassessmentsisunder-representedinretailtrade,healthcare,manufacturing,agriculture,andadministrationservices.Respondentswereover-representedinprofessionalandtechnicalservices,information,andrealestate.Theover-orunder-representationofspecificsectorsismitigatedinsofarasthereportprovidesdataonutilizationwithineachoftheseindustrysectors.StateprofiledatadoesnotincludedataonPublicAdministration.5 5Statedatasource:USCensusBureauCountyBusinessPatterns2011–NumberofestablishmentsshownforsampledonotincludePublicAdministrationinthetotalsforcomparativepurposes.
0.1%
0.5%
0.5%
1.0%
1.3%
2.7%
2.9%
3.1%
3.5%
3.8%
4.1%
5.7%
5.7%
6.5%
6.5%
7.2%
7.9%
9.9%
10.6%
16.0%
1.4%
0.9%
0.9%
5.3%
0.4%
0.9%
5.0%
0.0%
1.7%
0.4%
10.4%
4.6%
4.8%
1.3%
4.0%
15.4%
4.6%
19.0%
15.4%
3.6%
0% 2% 4% 6% 8% 10% 12% 14% 16% 18% 20%
ManagementofCompanies
Mining
EducaionalServices
Agriculture/Forestry/Fishing
Uiliies
Arts,EntertainmentandRecreaion
TransportaionandWarehousing
UnclassifiedEstablishments
Informaion
AccommodaionandFoodServices
AdministraiveandSupportServices
Construcion
WholesaleTrade
RealEstate
FinanceandInsurance
Manufacturing/Processing
Otherservices(expublicadministraion)
HealthCareandSocialAssistance
RetailTrade
Professional,Technical&ScienificServices
StateProfile SurveySampleN=1,525
ArkansaseSolutionsBenchmarkingReport2015
StrategicNetworksGroup.Inc.2015 www.sngroup.com Page11of36
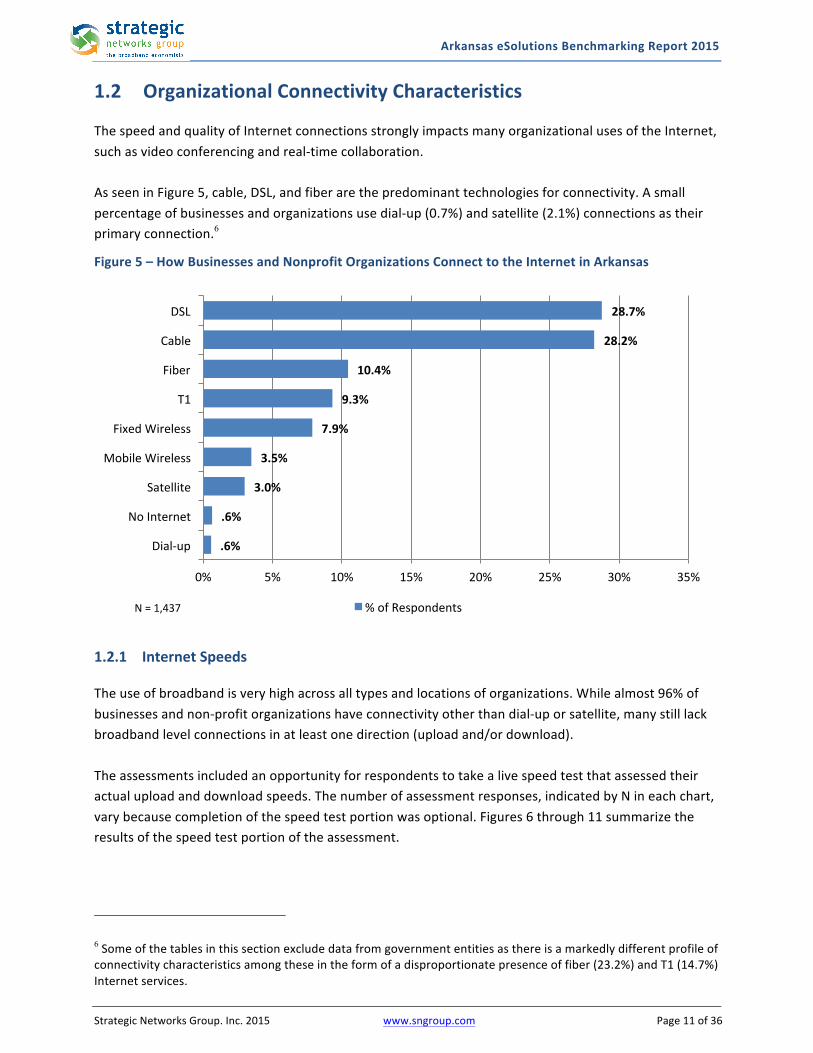
1.2 OrganizationalConnectivityCharacteristics ThespeedandqualityofInternetconnectionsstronglyimpactsmanyorganizationalusesoftheInternet,suchasvideoconferencingandreal-timecollaboration.AsseeninFigure5,cable,DSL,andfiberarethepredominanttechnologiesforconnectivity.Asmallpercentageofbusinessesandorganizationsusedial-up(0.7%)andsatellite(2.1%)connectionsastheirprimaryconnection.6
Figure5–HowBusinessesandNonprofitOrganizationsConnecttotheInternetinArkansas
1.2.1 InternetSpeedsTheuseofbroadbandisveryhighacrossalltypesandlocationsoforganizations.Whilealmost96%ofbusinessesandnon-profitorganizationshaveconnectivityotherthandial-uporsatellite,manystilllackbroadbandlevelconnectionsinatleastonedirection(uploadand/ordownload).Theassessmentsincludedanopportunityforrespondentstotakealivespeedtestthatassessedtheiractualuploadanddownloadspeeds.Thenumberofassessmentresponses,indicatedbyNineachchart,varybecausecompletionofthespeedtestportionwasoptional.Figures6through11summarizetheresultsofthespeedtestportionoftheassessment.
6Someofthetablesinthissectionexcludedatafromgovernmententitiesasthereisamarkedlydifferentprofileofconnectivitycharacteristicsamongtheseintheformofadisproportionatepresenceoffiber(23.2%)andT1(14.7%)Internetservices.
.6%
.6%
3.0%
3.5%
7.9%
9.3%
10.4%
28.2%
28.7%
0% 5% 10% 15% 20% 25% 30% 35%
Dial-up
NoInternet
Satellite
MobileWireless
FixedWireless
T1
Fiber
Cable
DSL
%ofRespondentsN=1,437
ArkansaseSolutionsBenchmarkingReport2015
StrategicNetworksGroup.Inc.2015 www.sngroup.com Page12of36
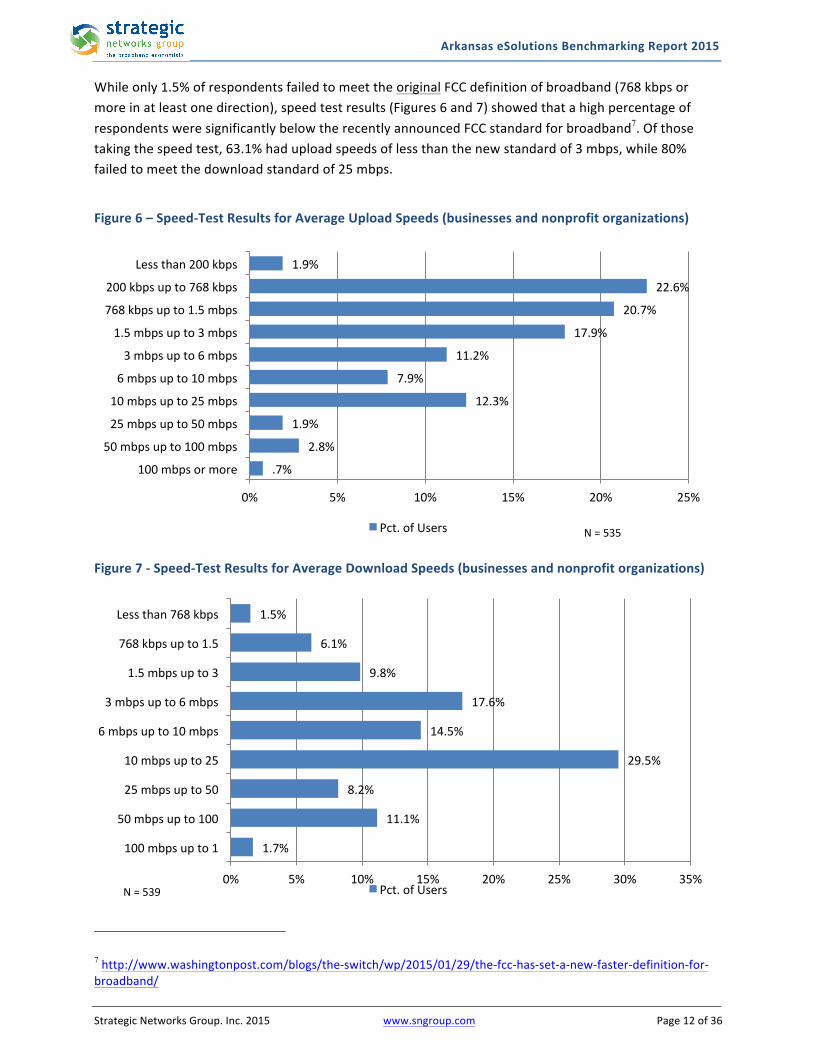
Whileonly1.5%ofrespondentsfailedtomeettheoriginalFCCdefinitionofbroadband(768kbpsormoreinatleastonedirection),speedtestresults(Figures6and7)showedthatahighpercentageofrespondentsweresignificantlybelowtherecentlyannouncedFCCstandardforbroadband7.Ofthosetakingthespeedtest,63.1%haduploadspeedsoflessthanthenewstandardof3mbps,while80%failedtomeetthedownloadstandardof25mbps.
Figure6–Speed-TestResultsforAverageUploadSpeeds(businessesandnonprofitorganizations)
Figure7-Speed-TestResultsforAverageDownloadSpeeds(businessesandnonprofitorganizations)
7http://www.washingtonpost.com/blogs/the-switch/wp/2015/01/29/the-fcc-has-set-a-new-faster-definition-for-broadband/
.7%
2.8%
1.9%
12.3%
7.9%
11.2%
17.9%
20.7%
22.6%
1.9%
0% 5% 10% 15% 20% 25%
100mbpsormore
50mbpsupto100mbps
25mbpsupto50mbps
10mbpsupto25mbps
6mbpsupto10mbps
3mbpsupto6mbps
1.5mbpsupto3mbps
768kbpsupto1.5mbps
200kbpsupto768kbps
Lessthan200kbps
Pct.ofUsers N=535
1.7%
11.1%
8.2%
29.5%
14.5%
17.6%
9.8%
6.1%
1.5%
0% 5% 10% 15% 20% 25% 30% 35%
100mbpsupto1
50mbpsupto100
25mbpsupto50
10mbpsupto25
6mbpsupto10mbps
3mbpsupto6mbps
1.5mbpsupto3
768kbpsupto1.5
Lessthan768kbps
Pct.ofUsersN=539
ArkansaseSolutionsBenchmarkingReport2015
StrategicNetworksGroup.Inc.2015 www.sngroup.com Page13of36
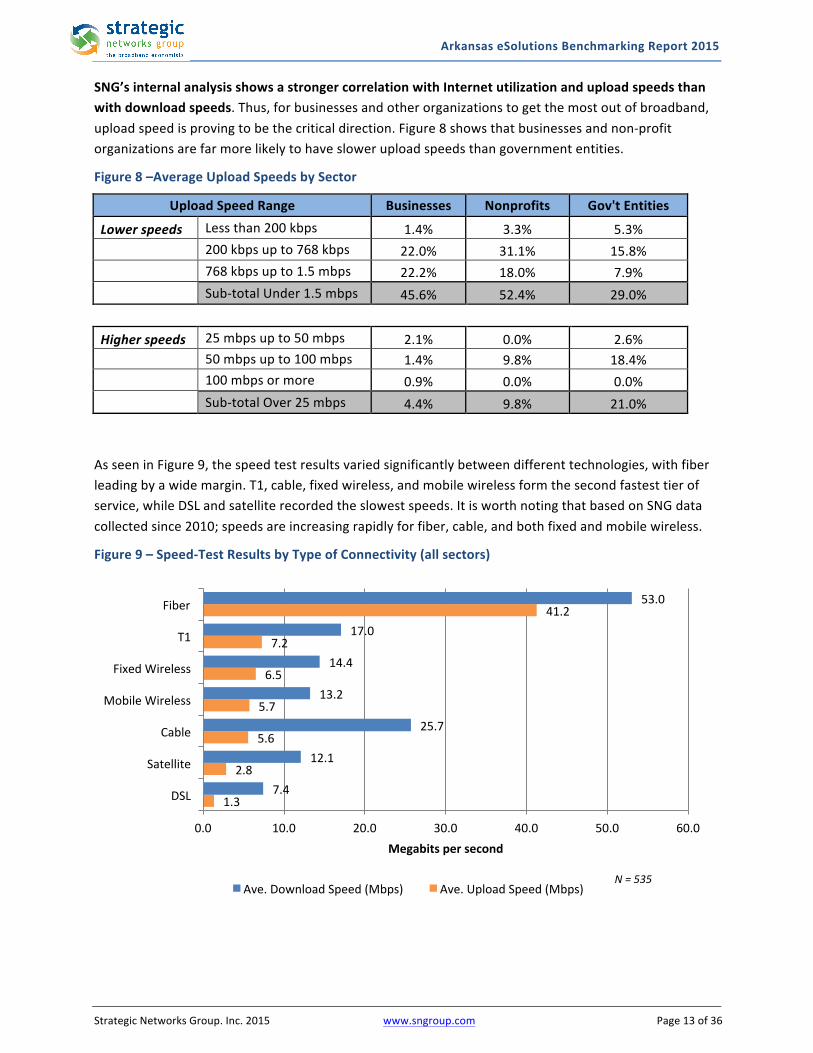
SNG’sinternalanalysisshowsastrongercorrelationwithInternetutilizationanduploadspeedsthanwithdownloadspeeds.Thus,forbusinessesandotherorganizationstogetthemostoutofbroadband,uploadspeedisprovingtobethecriticaldirection.Figure8showsthatbusinessesandnon-profitorganizationsarefarmorelikelytohavesloweruploadspeedsthangovernmententities.
Figure8–AverageUploadSpeedsbySector
UploadSpeedRange Businesses Nonprofits Gov'tEntities
Lowerspeeds Lessthan200kbps 1.4% 3.3% 5.3% 200kbpsupto768kbps 22.0% 31.1% 15.8% 768kbpsupto1.5mbps 22.2% 18.0% 7.9% Sub-totalUnder1.5mbps 45.6% 52.4% 29.0%
Higherspeeds 25mbpsupto50mbps 2.1% 0.0% 2.6% 50mbpsupto100mbps 1.4% 9.8% 18.4% 100mbpsormore 0.9% 0.0% 0.0% Sub-totalOver25mbps 4.4% 9.8% 21.0%AsseeninFigure9,thespeedtestresultsvariedsignificantlybetweendifferenttechnologies,withfiberleadingbyawidemargin.T1,cable,fixedwireless,andmobilewirelessformthesecondfastesttierofservice,whileDSLandsatelliterecordedtheslowestspeeds.ItisworthnotingthatbasedonSNGdatacollectedsince2010;speedsareincreasingrapidlyforfiber,cable,andbothfixedandmobilewireless.
Figure9–Speed-TestResultsbyTypeofConnectivity(allsectors)
1.3
2.8
5.6
5.7
6.5
7.2
41.2
7.4
12.1
25.7
13.2
14.4
17.0
53.0
0.0 10.0 20.0 30.0 40.0 50.0 60.0
DSL
Satellite
Cable
MobileWireless
FixedWireless
T1
Fiber
Megabitspersecond
Ave.DownloadSpeed(Mbps) Ave.UploadSpeed(Mbps)N=535
ArkansaseSolutionsBenchmarkingReport2015
StrategicNetworksGroup.Inc.2015 www.sngroup.com Page14of36
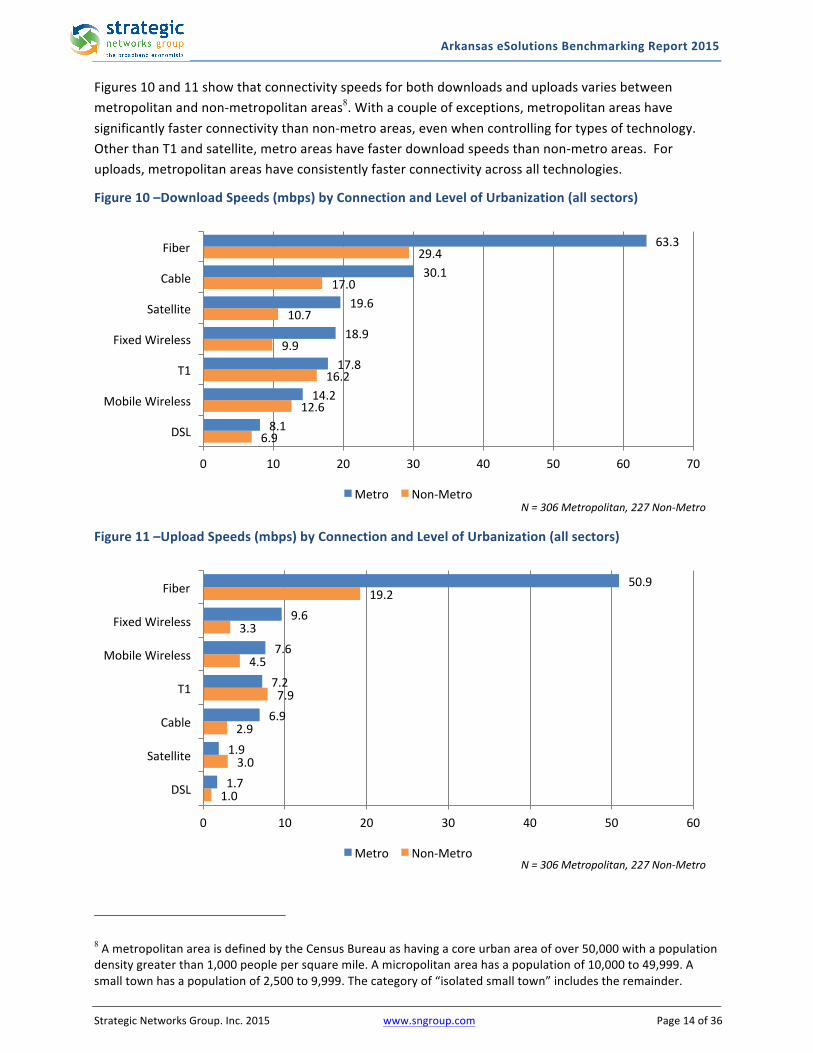
Figures10and11showthatconnectivityspeedsforbothdownloadsanduploadsvariesbetweenmetropolitanandnon-metropolitanareas8.Withacoupleofexceptions,metropolitanareashavesignificantlyfasterconnectivitythannon-metroareas,evenwhencontrollingfortypesoftechnology.OtherthanT1andsatellite,metroareashavefasterdownloadspeedsthannon-metroareas.Foruploads,metropolitanareashaveconsistentlyfasterconnectivityacrossalltechnologies.
Figure10–DownloadSpeeds(mbps)byConnectionandLevelofUrbanization(allsectors)
Figure11–UploadSpeeds(mbps)byConnectionandLevelofUrbanization(allsectors)
8AmetropolitanareaisdefinedbytheCensusBureauashavingacoreurbanareaofover50,000withapopulationdensitygreaterthan1,000peoplepersquaremile.Amicropolitanareahasapopulationof10,000to49,999.Asmalltownhasapopulationof2,500to9,999.Thecategoryof“isolatedsmalltown”includestheremainder.
6.9
12.6
16.2
9.9
10.7
17.0
29.4
8.1
14.2
17.8
18.9
19.6
30.1
63.3
0 10 20 30 40 50 60 70
DSL
MobileWireless
T1
FixedWireless
Satellite
Cable
Fiber
Metro Non-MetroN=306Metropolitan,227Non-Metro
1.0
3.0
2.9
7.9
4.5
3.3
19.2
1.7
1.9
6.9
7.2
7.6
9.6
50.9
0 10 20 30 40 50 60
DSL
Satellite
Cable
T1
MobileWireless
FixedWireless
Fiber
Metro Non-MetroN=306Metropolitan,227Non-Metro
ArkansaseSolutionsBenchmarkingReport2015
StrategicNetworksGroup.Inc.2015 www.sngroup.com Page15of36
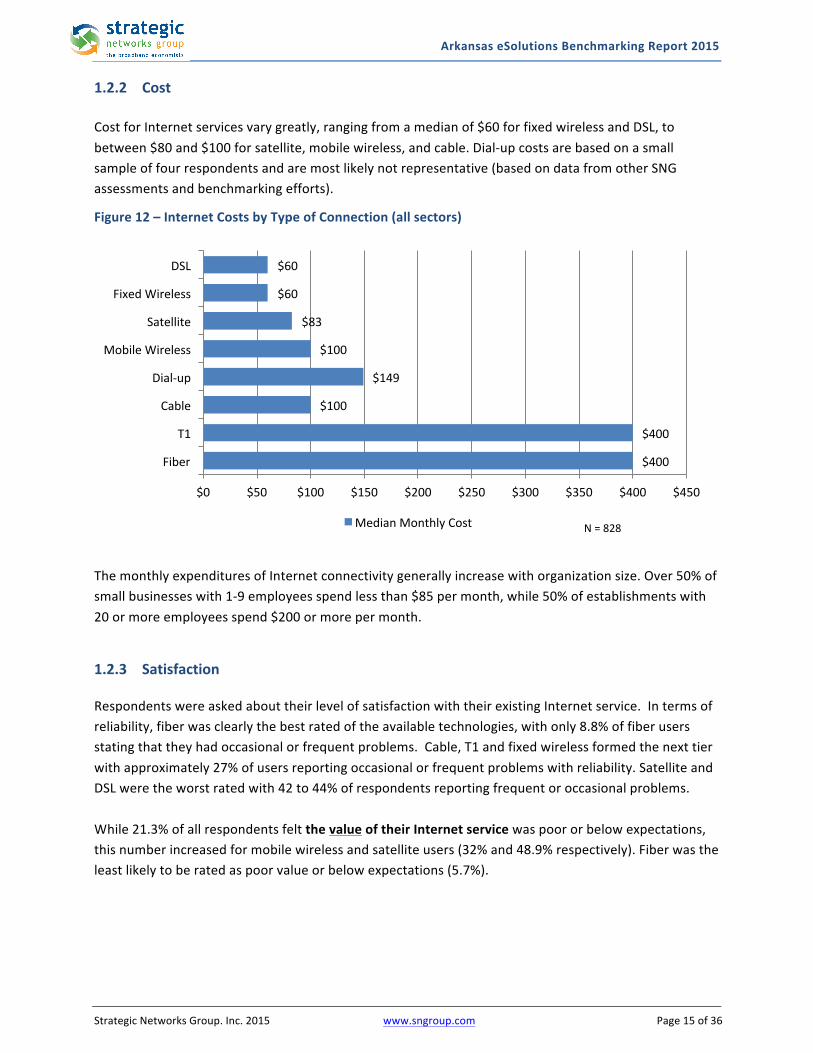
1.2.2 CostCostforInternetservicesvarygreatly,rangingfromamedianof$60forfixedwirelessandDSL,tobetween$80and$100forsatellite,mobilewireless,andcable.Dial-upcostsarebasedonasmallsampleoffourrespondentsandaremostlikelynotrepresentative(basedondatafromotherSNGassessmentsandbenchmarkingefforts).
Figure12–InternetCostsbyTypeofConnection(allsectors)
ThemonthlyexpendituresofInternetconnectivitygenerallyincreasewithorganizationsize.Over50%ofsmallbusinesseswith1-9employeesspendlessthan$85permonth,while50%ofestablishmentswith20ormoreemployeesspend$200ormorepermonth.
1.2.3 SatisfactionRespondentswereaskedabouttheirlevelofsatisfactionwiththeirexistingInternetservice.Intermsofreliability,fiberwasclearlythebestratedoftheavailabletechnologies,withonly8.8%offiberusersstatingthattheyhadoccasionalorfrequentproblems.Cable,T1andfixedwirelessformedthenexttierwithapproximately27%ofusersreportingoccasionalorfrequentproblemswithreliability.SatelliteandDSLweretheworstratedwith42to44%ofrespondentsreportingfrequentoroccasionalproblems.While21.3%ofallrespondentsfeltthevalueoftheirInternetservicewaspoororbelowexpectations,thisnumberincreasedformobilewirelessandsatelliteusers(32%and48.9%respectively).Fiberwastheleastlikelytoberatedaspoorvalueorbelowexpectations(5.7%).
$400
$400
$100
$149
$100
$83
$60
$60
$0 $50 $100 $150 $200 $250 $300 $350 $400 $450
Fiber
T1
Cable
Dial-up
MobileWireless
Satellite
FixedWireless
DSL
MedianMonthlyCost N=828
ArkansaseSolutionsBenchmarkingReport2015
StrategicNetworksGroup.Inc.2015 www.sngroup.com Page16of36
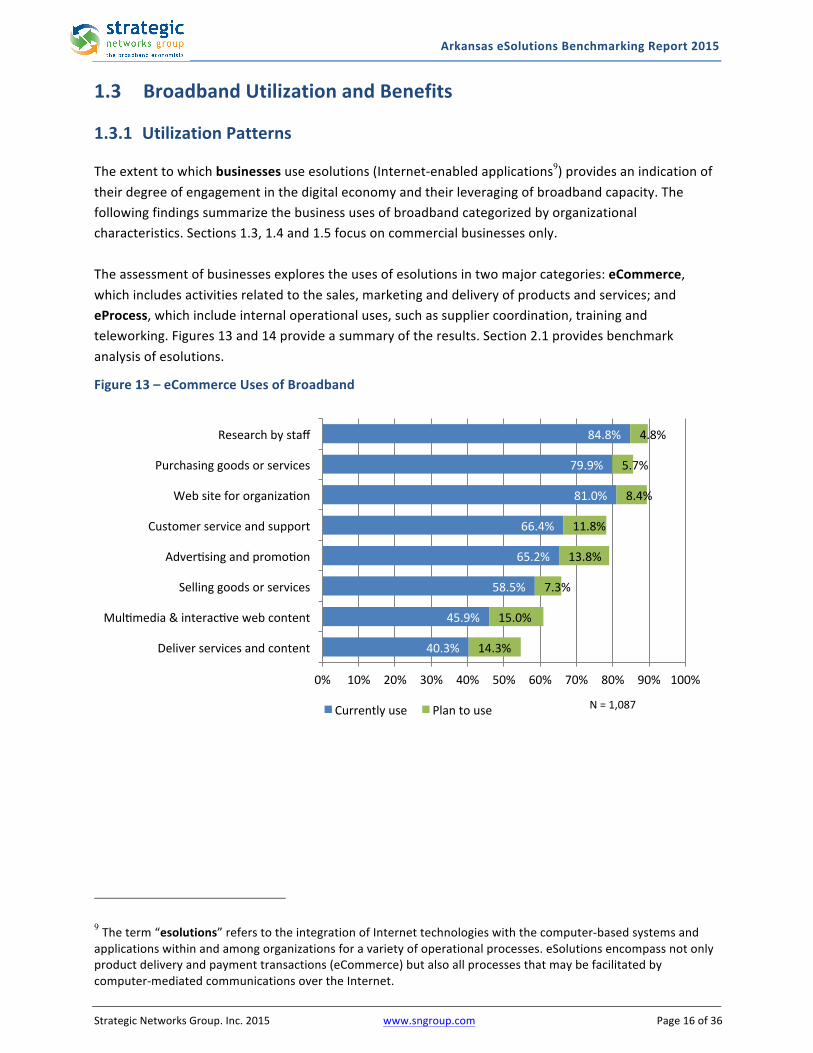
1.3 BroadbandUtilizationandBenefits1.3.1 UtilizationPatternsTheextenttowhichbusinessesuseesolutions(Internet-enabledapplications9)providesanindicationoftheirdegreeofengagementinthedigitaleconomyandtheirleveragingofbroadbandcapacity.Thefollowingfindingssummarizethebusinessusesofbroadbandcategorizedbyorganizationalcharacteristics.Sections1.3,1.4and1.5focusoncommercialbusinessesonly.Theassessmentofbusinessesexplorestheusesofesolutionsintwomajorcategories:eCommerce,whichincludesactivitiesrelatedtothesales,marketinganddeliveryofproductsandservices;andeProcess,whichincludeinternaloperationaluses,suchassuppliercoordination,trainingandteleworking.Figures13and14provideasummaryoftheresults.Section2.1providesbenchmarkanalysisofesolutions.
Figure13–eCommerceUsesofBroadband
9Theterm“esolutions”referstotheintegrationofInternettechnologieswiththecomputer-basedsystemsandapplicationswithinandamongorganizationsforavarietyofoperationalprocesses.eSolutionsencompassnotonlyproductdeliveryandpaymenttransactions(eCommerce)butalsoallprocessesthatmaybefacilitatedbycomputer-mediatedcommunicationsovertheInternet.
40.3%
45.9%
58.5%
65.2%
66.4%
81.0%
79.9%
84.8%
14.3%
15.0%
7.3%
13.8%
11.8%
8.4%
5.7%
4.8%
0% 10% 20% 30% 40% 50% 60% 70% 80% 90% 100%
Deliverservicesandcontent
Mulimedia&interacivewebcontent
Sellinggoodsorservices
Adverisingandpromoion
Customerserviceandsupport
Websitefororganizaion
Purchasinggoodsorservices
Researchbystaff
Currentlyuse Plantouse N=1,087
ArkansaseSolutionsBenchmarkingReport2015
StrategicNetworksGroup.Inc.2015 www.sngroup.com Page17of36
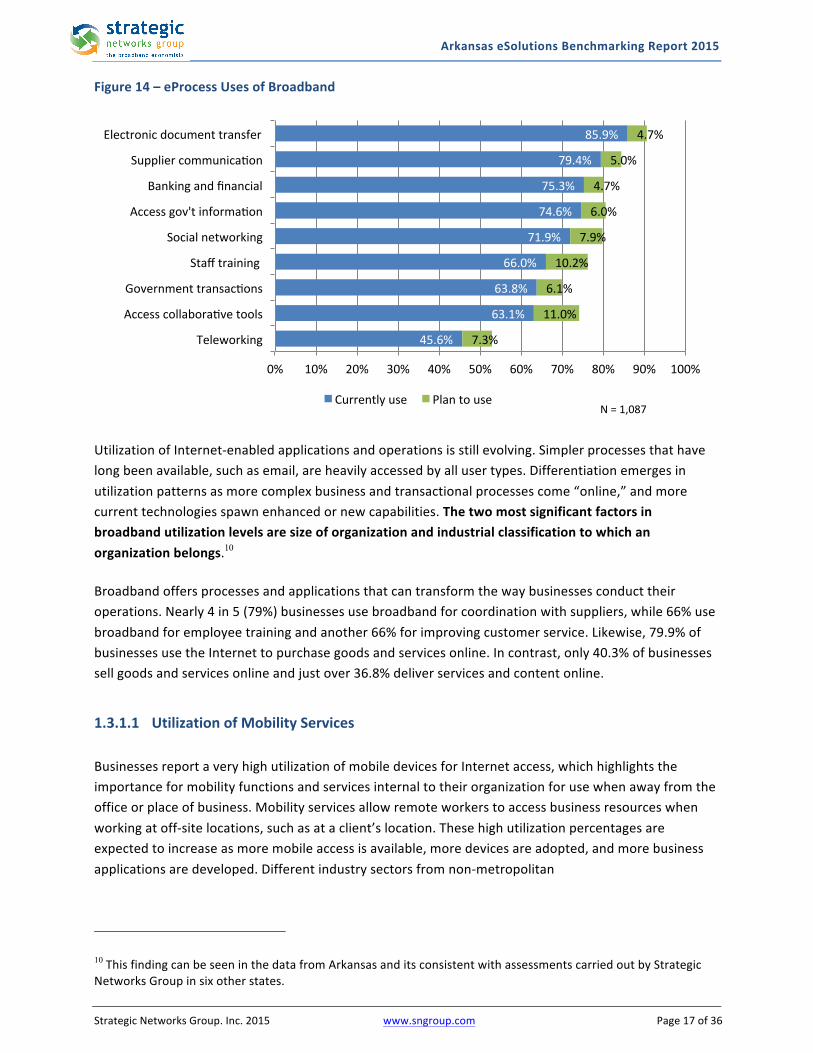
Figure14–eProcessUsesofBroadband
UtilizationofInternet-enabledapplicationsandoperationsisstillevolving.Simplerprocessesthathavelongbeenavailable,suchasemail,areheavilyaccessedbyallusertypes.Differentiationemergesinutilizationpatternsasmorecomplexbusinessandtransactionalprocessescome“online,”andmorecurrenttechnologiesspawnenhancedornewcapabilities.Thetwomostsignificantfactorsinbroadbandutilizationlevelsaresizeoforganizationandindustrialclassificationtowhichanorganizationbelongs.10Broadbandoffersprocessesandapplicationsthatcantransformthewaybusinessesconducttheiroperations.Nearly4in5(79%)businessesusebroadbandforcoordinationwithsuppliers,while66%usebroadbandforemployeetrainingandanother66%forimprovingcustomerservice.Likewise,79.9%ofbusinessesusetheInternettopurchasegoodsandservicesonline.Incontrast,only40.3%ofbusinessessellgoodsandservicesonlineandjustover36.8%deliverservicesandcontentonline.
1.3.1.1 UtilizationofMobilityServicesBusinessesreportaveryhighutilizationofmobiledevicesforInternetaccess,whichhighlightstheimportanceformobilityfunctionsandservicesinternaltotheirorganizationforusewhenawayfromtheofficeorplaceofbusiness.Mobilityservicesallowremoteworkerstoaccessbusinessresourceswhenworkingatoff-sitelocations,suchasataclient’slocation.Thesehighutilizationpercentagesareexpectedtoincreaseasmoremobileaccessisavailable,moredevicesareadopted,andmorebusinessapplicationsaredeveloped.Differentindustrysectorsfromnon-metropolitan
10ThisfindingcanbeseeninthedatafromArkansasanditsconsistentwithassessmentscarriedoutbyStrategicNetworksGroupinsixotherstates.
45.6%
63.1%
63.8%
66.0%
71.9%
74.6%
75.3%
79.4%
85.9%
7.3%
11.0%
6.1%
10.2%
7.9%
6.0%
4.7%
5.0%
4.7%
0% 10% 20% 30% 40% 50% 60% 70% 80% 90% 100%
Teleworking
Accesscollaboraivetools
Governmenttransacions
Stafftraining
Socialnetworking
Accessgov'tinformaion
Bankingandfinancial
Suppliercommunicaion
Electronicdocumenttransfer
Currentlyuse PlantouseN=1,087
ArkansaseSolutionsBenchmarkingReport2015
StrategicNetworksGroup.Inc.2015 www.sngroup.com Page18of36
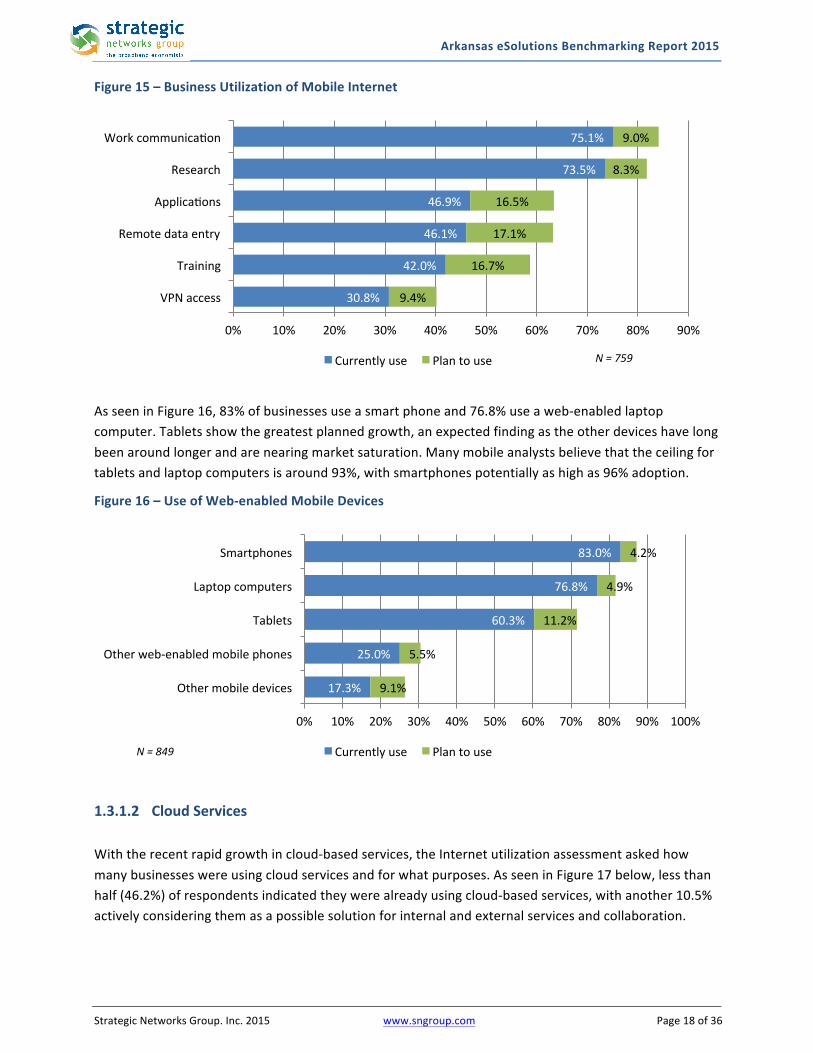
Figure15–BusinessUtilizationofMobileInternet
AsseeninFigure16,83%ofbusinessesuseasmartphoneand76.8%useaweb-enabledlaptopcomputer.Tabletsshowthegreatestplannedgrowth,anexpectedfindingastheotherdeviceshavelongbeenaroundlongerandarenearingmarketsaturation.Manymobileanalystsbelievethattheceilingfortabletsandlaptopcomputersisaround93%,withsmartphonespotentiallyashighas96%adoption.
Figure16–UseofWeb-enabledMobileDevices
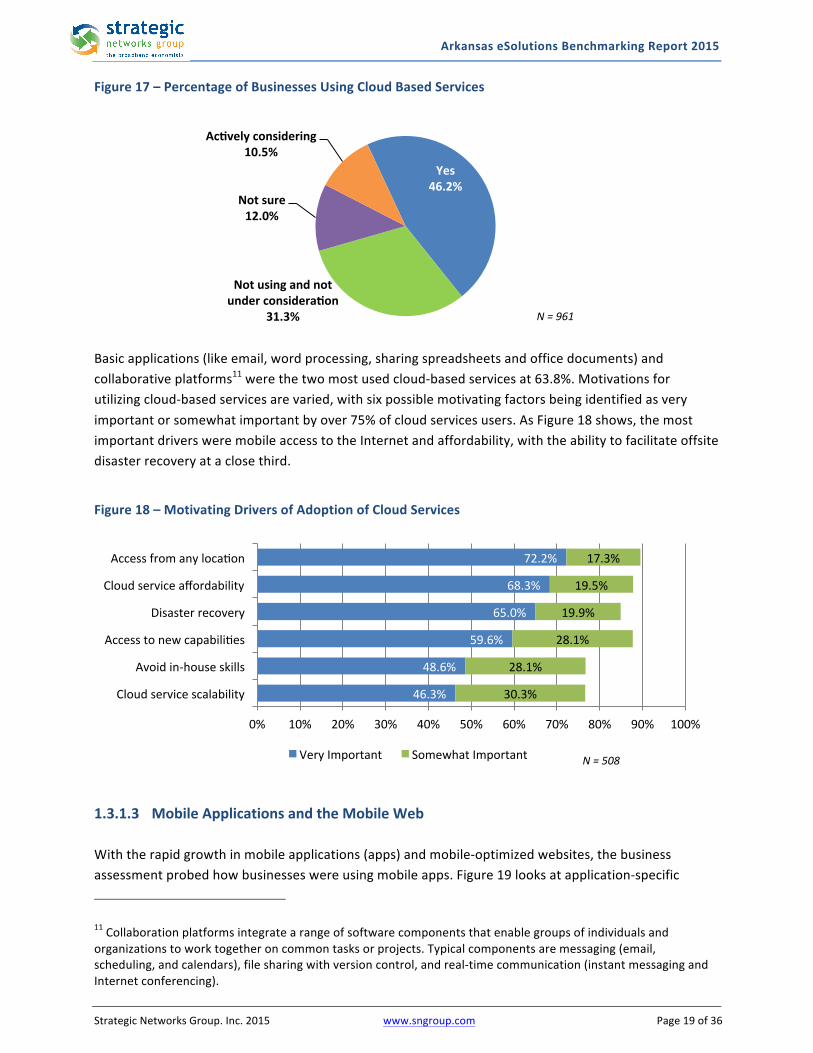
1.3.1.2 CloudServicesWiththerecentrapidgrowthincloud-basedservices,theInternetutilizationassessmentaskedhowmanybusinesseswereusingcloudservicesandforwhatpurposes.AsseeninFigure17below,lessthanhalf(46.2%)ofrespondentsindicatedtheywerealreadyusingcloud-basedservices,withanother10.5%activelyconsideringthemasapossiblesolutionforinternalandexternalservicesandcollaboration.
30.8%
42.0%
46.1%
46.9%
73.5%
75.1%
9.4%
16.7%
17.1%
16.5%
8.3%
9.0%
0% 10% 20% 30% 40% 50% 60% 70% 80% 90%
VPNaccess
Training
Remotedataentry
Applicaions
Research
Workcommunicaion
Currentlyuse Plantouse N=759
17.3%
25.0%
60.3%
76.8%
83.0%
9.1%
5.5%
11.2%
4.9%
4.2%
0% 10% 20% 30% 40% 50% 60% 70% 80% 90% 100%
Othermobiledevices
Otherweb-enabledmobilephones
Tablets
Laptopcomputers
Smartphones
Currentlyuse PlantouseN=849
ArkansaseSolutionsBenchmarkingReport2015
StrategicNetworksGroup.Inc.2015 www.sngroup.com Page19of36
Figure17–PercentageofBusinessesUsingCloudBasedServices
Basicapplications(likeemail,wordprocessing,sharingspreadsheetsandofficedocuments)andcollaborativeplatforms11werethetwomostusedcloud-basedservicesat63.8%.Motivationsforutilizingcloud-basedservicesarevaried,withsixpossiblemotivatingfactorsbeingidentifiedasveryimportantorsomewhatimportantbyover75%ofcloudservicesusers.AsFigure18shows,themostimportantdriversweremobileaccesstotheInternetandaffordability,withtheabilitytofacilitateoffsitedisasterrecoveryataclosethird.
Figure18–MotivatingDriversofAdoptionofCloudServices
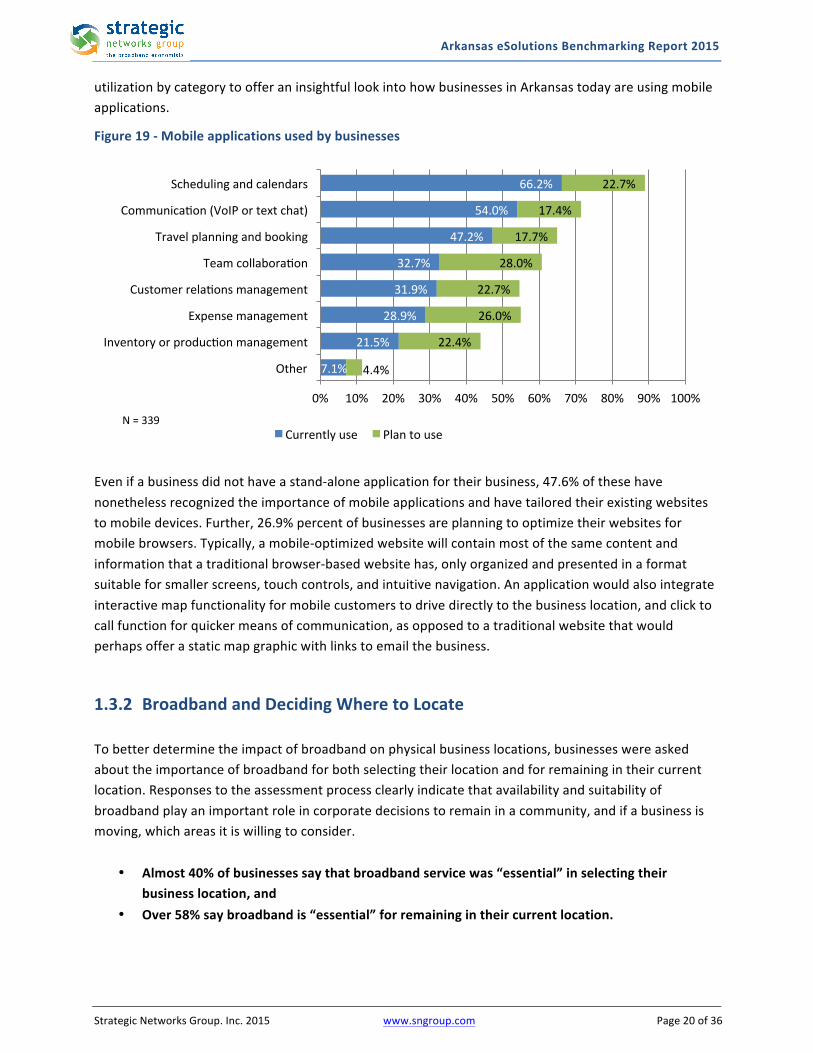
1.3.1.3 MobileApplicationsandtheMobileWebWiththerapidgrowthinmobileapplications(apps)andmobile-optimizedwebsites,thebusinessassessmentprobedhowbusinesseswereusingmobileapps.Figure19looksatapplication-specific
11Collaborationplatformsintegratearangeofsoftwarecomponentsthatenablegroupsofindividualsandorganizationstoworktogetheroncommontasksorprojects.Typicalcomponentsaremessaging(email,scheduling,andcalendars),filesharingwithversioncontrol,andreal-timecommunication(instantmessagingandInternetconferencing).
Yes46.2%
Notusingandnotunderconsideradon
31.3%
Notsure12.0%
Acdvelyconsidering10.5%
N=961
46.3%
48.6%
59.6%
65.0%
68.3%
72.2%
30.3%
28.1%
28.1%
19.9%
19.5%
17.3%
0% 10% 20% 30% 40% 50% 60% 70% 80% 90% 100%
Cloudservicescalability
Avoidin-houseskills
Accesstonewcapabiliies
Disasterrecovery
Cloudserviceaffordability
Accessfromanylocaion
VeryImportant SomewhatImportant N=508
ArkansaseSolutionsBenchmarkingReport2015
StrategicNetworksGroup.Inc.2015 www.sngroup.com Page20of36
utilizationbycategorytoofferaninsightfullookintohowbusinessesinArkansastodayareusingmobileapplications.
Figure19-Mobileapplicationsusedbybusinesses
Evenifabusinessdidnothaveastand-aloneapplicationfortheirbusiness,47.6%ofthesehavenonethelessrecognizedtheimportanceofmobileapplicationsandhavetailoredtheirexistingwebsitestomobiledevices.Further,26.9%percentofbusinessesareplanningtooptimizetheirwebsitesformobilebrowsers.Typically,amobile-optimizedwebsitewillcontainmostofthesamecontentandinformationthatatraditionalbrowser-basedwebsitehas,onlyorganizedandpresentedinaformatsuitableforsmallerscreens,touchcontrols,andintuitivenavigation.Anapplicationwouldalsointegrateinteractivemapfunctionalityformobilecustomerstodrivedirectlytothebusinesslocation,andclicktocallfunctionforquickermeansofcommunication,asopposedtoatraditionalwebsitethatwouldperhapsofferastaticmapgraphicwithlinkstoemailthebusiness.1.3.2 BroadbandandDecidingWheretoLocateTobetterdeterminetheimpactofbroadbandonphysicalbusinesslocations,businesseswereaskedabouttheimportanceofbroadbandforbothselectingtheirlocationandforremainingintheircurrentlocation.Responsestotheassessmentprocessclearlyindicatethatavailabilityandsuitabilityofbroadbandplayanimportantroleincorporatedecisionstoremaininacommunity,andifabusinessismoving,whichareasitiswillingtoconsider.
• Almost40%ofbusinessessaythatbroadbandservicewas“essential”inselectingtheirbusinesslocation,and
• Over58%saybroadbandis“essential”forremainingintheircurrentlocation.
7.1%
21.5%
28.9%
31.9%
32.7%
47.2%
54.0%
66.2%
4.4%
22.4%
26.0%
22.7%
28.0%
17.7%
17.4%
22.7%
0% 10% 20% 30% 40% 50% 60% 70% 80% 90% 100%
Other
Inventoryorproducionmanagement
Expensemanagement
Customerrelaionsmanagement
Teamcollaboraion
Travelplanningandbooking
Communicaion(VoIPortextchat)
Schedulingandcalendars
Currentlyuse PlantouseN=339
ArkansaseSolutionsBenchmarkingReport2015
StrategicNetworksGroup.Inc.2015 www.sngroup.com Page21of36
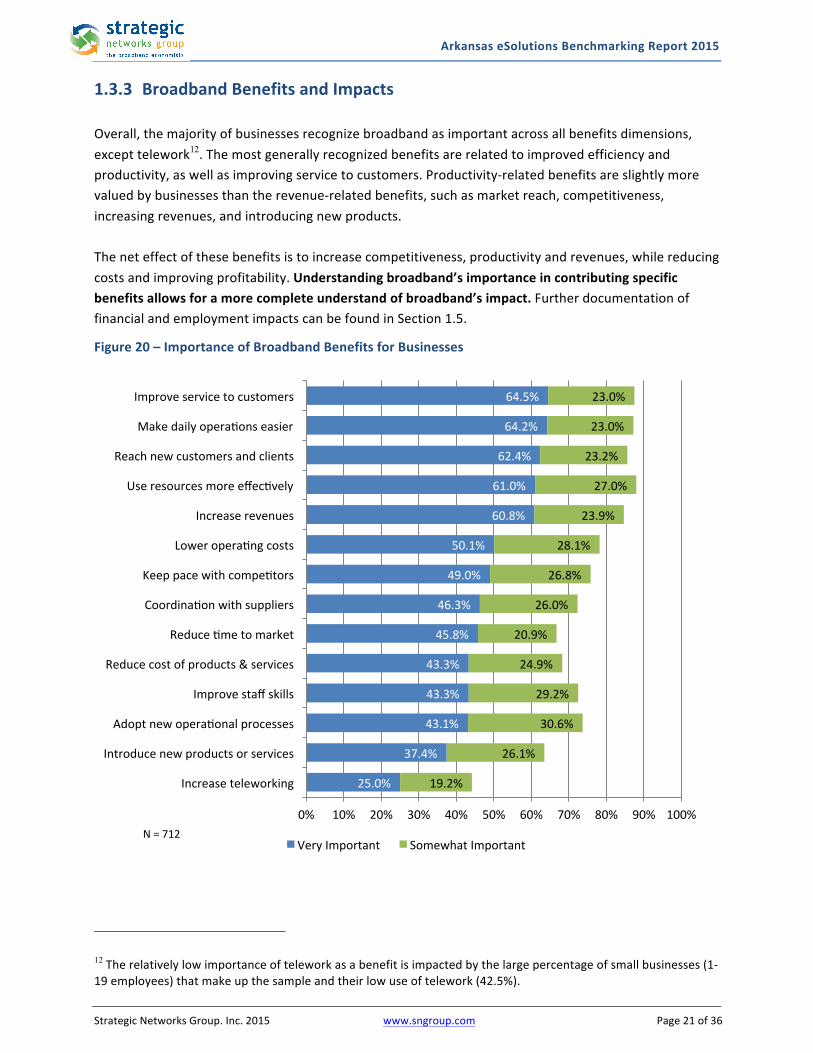
1.3.3 BroadbandBenefitsandImpactsOverall,themajorityofbusinessesrecognizebroadbandasimportantacrossallbenefitsdimensions,excepttelework12.Themostgenerallyrecognizedbenefitsarerelatedtoimprovedefficiencyandproductivity,aswellasimprovingservicetocustomers.Productivity-relatedbenefitsareslightlymorevaluedbybusinessesthantherevenue-relatedbenefits,suchasmarketreach,competitiveness,increasingrevenues,andintroducingnewproducts.Theneteffectofthesebenefitsistoincreasecompetitiveness,productivityandrevenues,whilereducingcostsandimprovingprofitability.Understandingbroadband’simportanceincontributingspecificbenefitsallowsforamorecompleteunderstandofbroadband’simpact.FurtherdocumentationoffinancialandemploymentimpactscanbefoundinSection1.5.
Figure20–ImportanceofBroadbandBenefitsforBusinesses
12Therelativelylowimportanceofteleworkasabenefitisimpactedbythelargepercentageofsmallbusinesses(1-19employees)thatmakeupthesampleandtheirlowuseoftelework(42.5%).
25.0%
37.4%
43.1%
43.3%
43.3%
45.8%
46.3%
49.0%
50.1%
60.8%
61.0%
62.4%
64.2%
64.5%
19.2%
26.1%
30.6%
29.2%
24.9%
20.9%
26.0%
26.8%
28.1%
23.9%
27.0%
23.2%
23.0%
23.0%
0% 10% 20% 30% 40% 50% 60% 70% 80% 90% 100%
Increaseteleworking
Introducenewproductsorservices
Adoptnewoperaionalprocesses
Improvestaffskills
Reducecostofproducts&services
Reduceimetomarket
Coordinaionwithsuppliers
Keeppacewithcompeitors
Loweroperaingcosts
Increaserevenues
Useresourcesmoreeffecively
Reachnewcustomersandclients
Makedailyoperaionseasier
Improveservicetocustomers
VeryImportant SomewhatImportantN=712
ArkansaseSolutionsBenchmarkingReport2015
StrategicNetworksGroup.Inc.2015 www.sngroup.com Page22of36
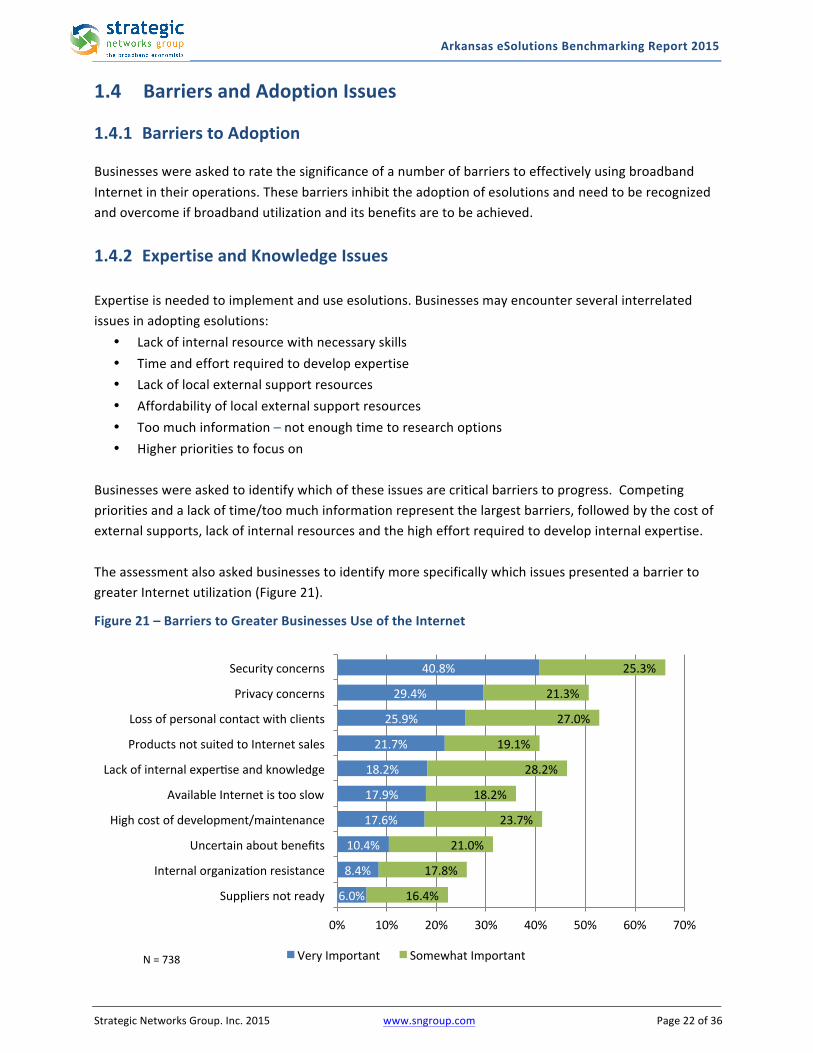
1.4 BarriersandAdoptionIssues1.4.1 BarrierstoAdoptionBusinesseswereaskedtoratethesignificanceofanumberofbarrierstoeffectivelyusingbroadbandInternetintheiroperations.Thesebarriersinhibittheadoptionofesolutionsandneedtoberecognizedandovercomeifbroadbandutilizationanditsbenefitsaretobeachieved.
1.4.2 ExpertiseandKnowledgeIssuesExpertiseisneededtoimplementanduseesolutions.Businessesmayencounterseveralinterrelatedissuesinadoptingesolutions:
• Lackofinternalresourcewithnecessaryskills• Timeandeffortrequiredtodevelopexpertise• Lackoflocalexternalsupportresources• Affordabilityoflocalexternalsupportresources• Toomuchinformation–notenoughtimetoresearchoptions• Higherprioritiestofocuson
Businesseswereaskedtoidentifywhichoftheseissuesarecriticalbarrierstoprogress.Competingprioritiesandalackoftime/toomuchinformationrepresentthelargestbarriers,followedbythecostofexternalsupports,lackofinternalresourcesandthehigheffortrequiredtodevelopinternalexpertise.TheassessmentalsoaskedbusinessestoidentifymorespecificallywhichissuespresentedabarriertogreaterInternetutilization(Figure21).
Figure21–BarrierstoGreaterBusinessesUseoftheInternet
6.0%
8.4%
10.4%
17.6%
17.9%
18.2%
21.7%
25.9%
29.4%
40.8%
16.4%
17.8%
21.0%
23.7%
18.2%
28.2%
19.1%
27.0%
21.3%
25.3%
0% 10% 20% 30% 40% 50% 60% 70%
Suppliersnotready
Internalorganizaionresistance
Uncertainaboutbenefits
Highcostofdevelopment/maintenance
AvailableInternetistooslow
Lackofinternalexperiseandknowledge
ProductsnotsuitedtoInternetsales
Lossofpersonalcontactwithclients
Privacyconcerns
Securityconcerns
VeryImportant SomewhatImportantN=738
ArkansaseSolutionsBenchmarkingReport2015
StrategicNetworksGroup.Inc.2015 www.sngroup.com Page23of36
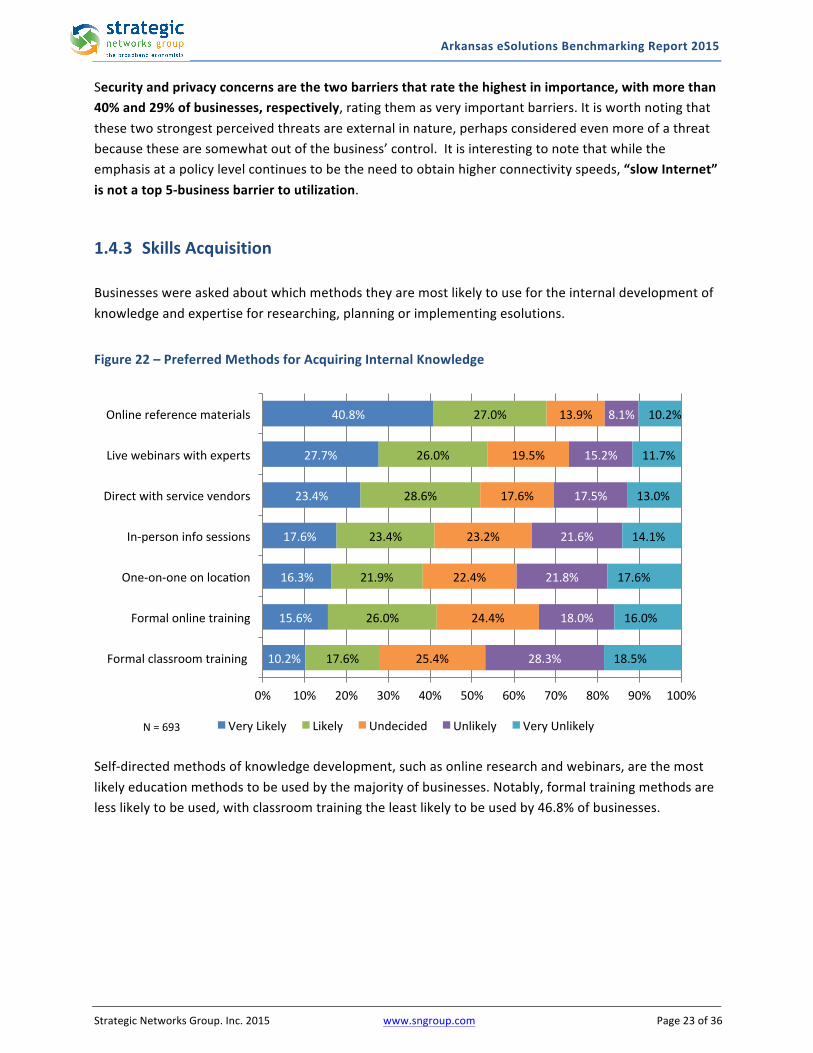
Securityandprivacyconcernsarethetwobarriersthatratethehighestinimportance,withmorethan40%and29%ofbusinesses,respectively,ratingthemasveryimportantbarriers.Itisworthnotingthatthesetwostrongestperceivedthreatsareexternalinnature,perhapsconsideredevenmoreofathreatbecausethesearesomewhatoutofthebusiness’control.Itisinterestingtonotethatwhiletheemphasisatapolicylevelcontinuestobetheneedtoobtainhigherconnectivityspeeds,“slowInternet”isnotatop5-businessbarriertoutilization.1.4.3 SkillsAcquisitionBusinesseswereaskedaboutwhichmethodstheyaremostlikelytousefortheinternaldevelopmentofknowledgeandexpertiseforresearching,planningorimplementingesolutions.
Figure22–PreferredMethodsforAcquiringInternalKnowledge
Self-directedmethodsofknowledgedevelopment,suchasonlineresearchandwebinars,arethemostlikelyeducationmethodstobeusedbythemajorityofbusinesses.Notably,formaltrainingmethodsarelesslikelytobeused,withclassroomtrainingtheleastlikelytobeusedby46.8%ofbusinesses.
10.2%
15.6%
16.3%
17.6%
23.4%
27.7%
40.8%
17.6%
26.0%
21.9%
23.4%
28.6%
26.0%
27.0%
25.4%
24.4%
22.4%
23.2%
17.6%
19.5%
13.9%
28.3%
18.0%
21.8%
21.6%
17.5%
15.2%
8.1%
18.5%
16.0%
17.6%
14.1%
13.0%
11.7%
10.2%
0% 10% 20% 30% 40% 50% 60% 70% 80% 90% 100%
Formalclassroomtraining
Formalonlinetraining
One-on-oneonlocaion
In-personinfosessions
Directwithservicevendors
Livewebinarswithexperts
Onlinereferencematerials
VeryLikely Likely Undecided Unlikely VeryUnlikelyN=693
ArkansaseSolutionsBenchmarkingReport2015
StrategicNetworksGroup.Inc.2015 www.sngroup.com Page24of36
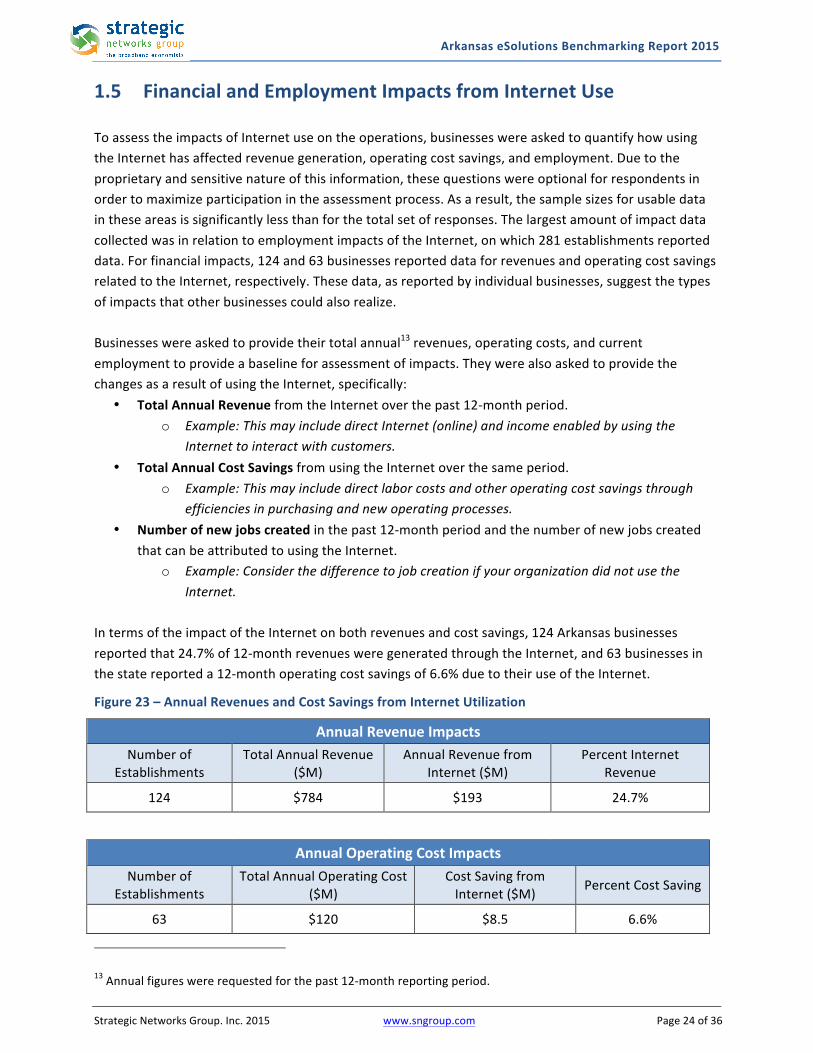
1.5 FinancialandEmploymentImpactsfromInternetUseToassesstheimpactsofInternetuseontheoperations,businesseswereaskedtoquantifyhowusingtheInternethasaffectedrevenuegeneration,operatingcostsavings,andemployment.Duetotheproprietaryandsensitivenatureofthisinformation,thesequestionswereoptionalforrespondentsinordertomaximizeparticipationintheassessmentprocess.Asaresult,thesamplesizesforusabledataintheseareasissignificantlylessthanforthetotalsetofresponses.ThelargestamountofimpactdatacollectedwasinrelationtoemploymentimpactsoftheInternet,onwhich281establishmentsreporteddata.Forfinancialimpacts,124and63businessesreporteddataforrevenuesandoperatingcostsavingsrelatedtotheInternet,respectively.Thesedata,asreportedbyindividualbusinesses,suggestthetypesofimpactsthatotherbusinessescouldalsorealize.Businesseswereaskedtoprovidetheirtotalannual13revenues,operatingcosts,andcurrentemploymenttoprovideabaselineforassessmentofimpacts.TheywerealsoaskedtoprovidethechangesasaresultofusingtheInternet,specifically:
• TotalAnnualRevenuefromtheInternetoverthepast12-monthperiod.o Example:ThismayincludedirectInternet(online)andincomeenabledbyusingthe
Internettointeractwithcustomers.• TotalAnnualCostSavingsfromusingtheInternetoverthesameperiod.
o Example:Thismayincludedirectlaborcostsandotheroperatingcostsavingsthroughefficienciesinpurchasingandnewoperatingprocesses.
• Numberofnewjobscreatedinthepast12-monthperiodandthenumberofnewjobscreatedthatcanbeattributedtousingtheInternet.
o Example:ConsiderthedifferencetojobcreationifyourorganizationdidnotusetheInternet.
IntermsoftheimpactoftheInternetonbothrevenuesandcostsavings,124Arkansasbusinessesreportedthat24.7%of12-monthrevenuesweregeneratedthroughtheInternet,and63businessesinthestatereporteda12-monthoperatingcostsavingsof6.6%duetotheiruseoftheInternet.
Figure23–AnnualRevenuesandCostSavingsfromInternetUtilization
AnnualRevenueImpactsNumberof
EstablishmentsTotalAnnualRevenue
($M)AnnualRevenuefrom
Internet($M)PercentInternet
Revenue
124 $784 $193 24.7%
AnnualOperatingCostImpacts
NumberofEstablishments
TotalAnnualOperatingCost($M)
CostSavingfromInternet($M) PercentCostSaving
63 $120 $8.5 6.6%
13Annualfigureswererequestedforthepast12-monthreportingperiod.
ArkansaseSolutionsBenchmarkingReport2015
StrategicNetworksGroup.Inc.2015 www.sngroup.com Page25of36
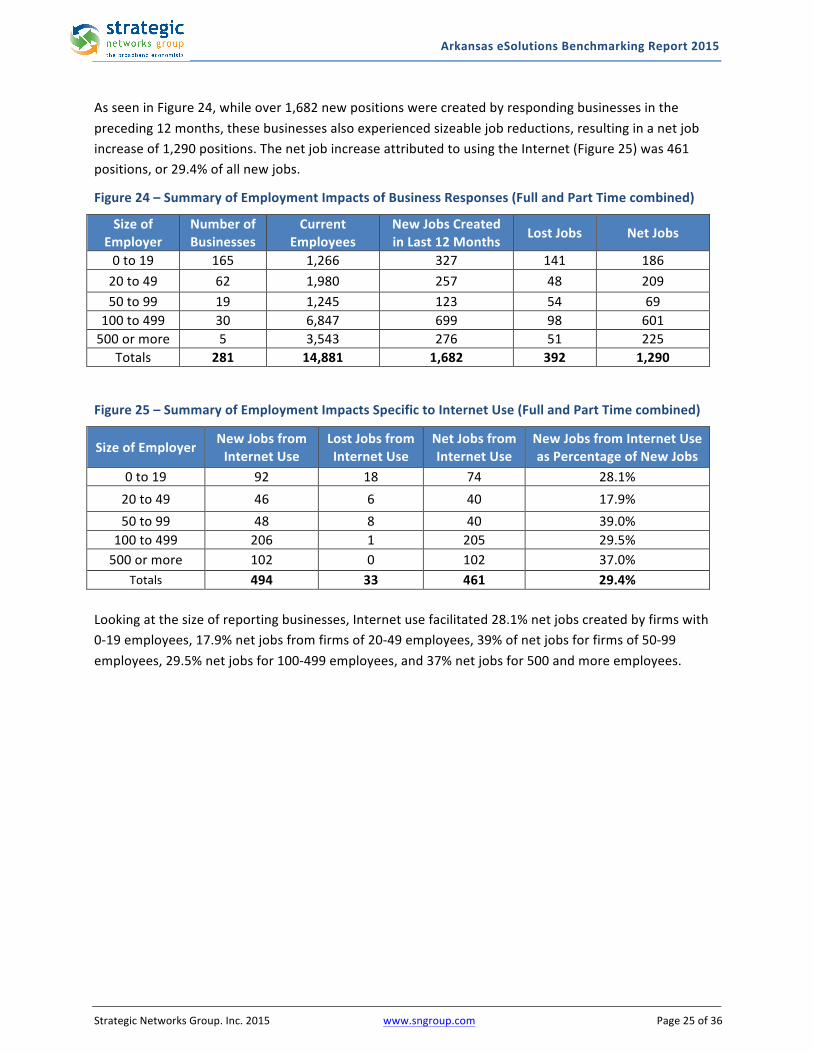
AsseeninFigure24,whileover1,682newpositionswerecreatedbyrespondingbusinessesinthepreceding12months,thesebusinessesalsoexperiencedsizeablejobreductions,resultinginanetjobincreaseof1,290positions.ThenetjobincreaseattributedtousingtheInternet(Figure25)was461positions,or29.4%ofallnewjobs.
Figure24–SummaryofEmploymentImpactsofBusinessResponses(FullandPartTimecombined)
SizeofEmployer
NumberofBusinesses
CurrentEmployees
NewJobsCreatedinLast12Months LostJobs NetJobs
0to19 165 1,266 327 141 18620to49 62 1,980 257 48 20950to99 19 1,245 123 54 69
100to499 30 6,847 699 98 601500ormore 5 3,543 276 51 225
Totals 281 14,881 1,682 392 1,290
Figure25–SummaryofEmploymentImpactsSpecifictoInternetUse(FullandPartTimecombined)
SizeofEmployer NewJobsfromInternetUse
LostJobsfromInternetUse
NetJobsfromInternetUse
NewJobsfromInternetUseasPercentageofNewJobs
0to19 92 18 74 28.1%20to49 46 6 40 17.9%50to99 48 8 40 39.0%
100to499 206 1 205 29.5%500ormore 102 0 102 37.0%
Totals 494 33 461 29.4%Lookingatthesizeofreportingbusinesses,Internetusefacilitated28.1%netjobscreatedbyfirmswith0-19employees,17.9%netjobsfromfirmsof20-49employees,39%ofnetjobsforfirmsof50-99employees,29.5%netjobsfor100-499employees,and37%netjobsfor500andmoreemployees.
ArkansaseSolutionsBenchmarkingReport2015
StrategicNetworksGroup.Inc.2015 www.sngroup.com Page26of36
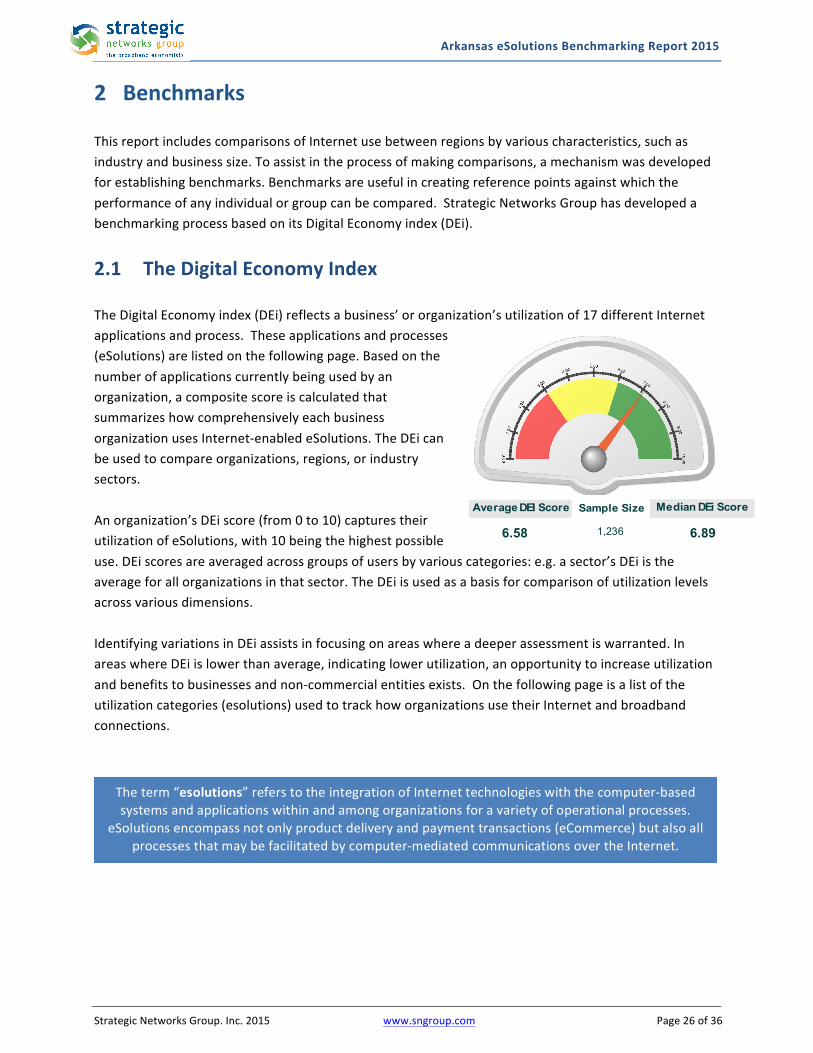
2 BenchmarksThisreportincludescomparisonsofInternetusebetweenregionsbyvariouscharacteristics,suchasindustryandbusinesssize.Toassistintheprocessofmakingcomparisons,amechanismwasdevelopedforestablishingbenchmarks.Benchmarksareusefulincreatingreferencepointsagainstwhichtheperformanceofanyindividualorgroupcanbecompared.StrategicNetworksGrouphasdevelopedabenchmarkingprocessbasedonitsDigitalEconomyindex(DEi).
2.1 TheDigitalEconomyIndexTheDigitalEconomyindex(DEi)reflectsabusiness’ororganization’sutilizationof17differentInternetapplicationsandprocess.Theseapplicationsandprocesses(eSolutions)arelistedonthefollowingpage.Basedonthenumberofapplicationscurrentlybeingusedbyanorganization,acompositescoreiscalculatedthatsummarizeshowcomprehensivelyeachbusinessorganizationusesInternet-enabledeSolutions.TheDEicanbeusedtocompareorganizations,regions,orindustrysectors.Anorganization’sDEiscore(from0to10)capturestheirutilizationofeSolutions,with10beingthehighestpossibleuse.DEiscoresareaveragedacrossgroupsofusersbyvariouscategories:e.g.asector’sDEiistheaverageforallorganizationsinthatsector.TheDEiisusedasabasisforcomparisonofutilizationlevelsacrossvariousdimensions.IdentifyingvariationsinDEiassistsinfocusingonareaswhereadeeperassessmentiswarranted.InareaswhereDEiislowerthanaverage,indicatinglowerutilization,anopportunitytoincreaseutilizationandbenefitstobusinessesandnon-commercialentitiesexists.Onthefollowingpageisalistoftheutilizationcategories(esolutions)usedtotrackhoworganizationsusetheirInternetandbroadbandconnections.
Theterm“esolutions”referstotheintegrationofInternettechnologieswiththecomputer-basedsystemsandapplicationswithinandamongorganizationsforavarietyofoperationalprocesses.
eSolutionsencompassnotonlyproductdeliveryandpaymenttransactions(eCommerce)butalsoallprocessesthatmaybefacilitatedbycomputer-mediatedcommunicationsovertheInternet.
Average DEI Score Sample Size Median DEi Score
6.58 6.89 1,236
ArkansaseSolutionsBenchmarkingReport2015
StrategicNetworksGroup.Inc.2015 www.sngroup.com Page27of36
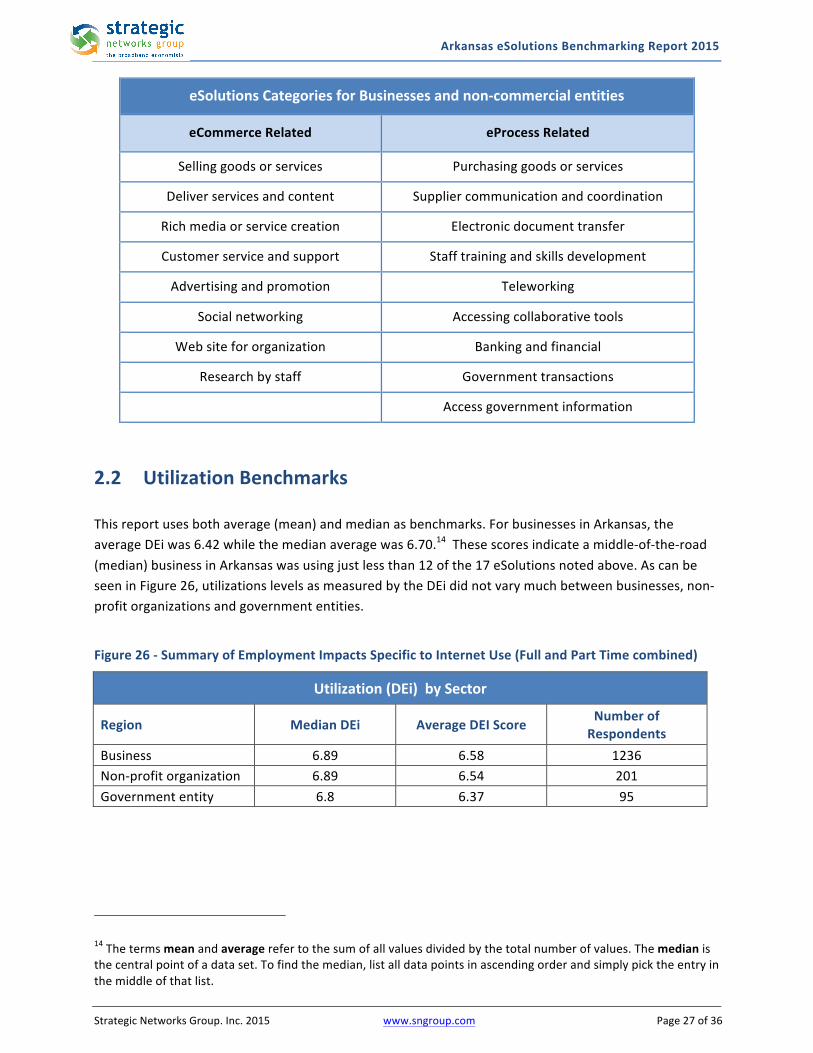
eSolutionsCategoriesforBusinessesandnon-commercialentities
eCommerceRelated eProcessRelated
Sellinggoodsorservices Purchasinggoodsorservices
Deliverservicesandcontent Suppliercommunicationandcoordination
Richmediaorservicecreation Electronicdocumenttransfer
Customerserviceandsupport Stafftrainingandskillsdevelopment
Advertisingandpromotion Teleworking
Socialnetworking Accessingcollaborativetools
Websitefororganization Bankingandfinancial
Researchbystaff Governmenttransactions
Accessgovernmentinformation
2.2 UtilizationBenchmarksThisreportusesbothaverage(mean)andmedianasbenchmarks.ForbusinessesinArkansas,theaverageDEiwas6.42whilethemedianaveragewas6.70.14Thesescoresindicateamiddle-of-the-road(median)businessinArkansaswasusingjustlessthan12ofthe17eSolutionsnotedabove.AscanbeseeninFigure26,utilizationslevelsasmeasuredbytheDEididnotvarymuchbetweenbusinesses,non-profitorganizationsandgovernmententities.
Figure26-SummaryofEmploymentImpactsSpecifictoInternetUse(FullandPartTimecombined)
Utilization(DEi)bySector
Region MedianDEi AverageDEIScore NumberofRespondents
Business 6.89 6.58 1236Non-profitorganization 6.89 6.54 201Governmententity 6.8 6.37 95
14Thetermsmeanandaveragerefertothesumofallvaluesdividedbythetotalnumberofvalues.Themedianisthecentralpointofadataset.Tofindthemedian,listalldatapointsinascendingorderandsimplypicktheentryinthemiddleofthatlist.
ArkansaseSolutionsBenchmarkingReport2015
StrategicNetworksGroup.Inc.2015 www.sngroup.com Page28of36
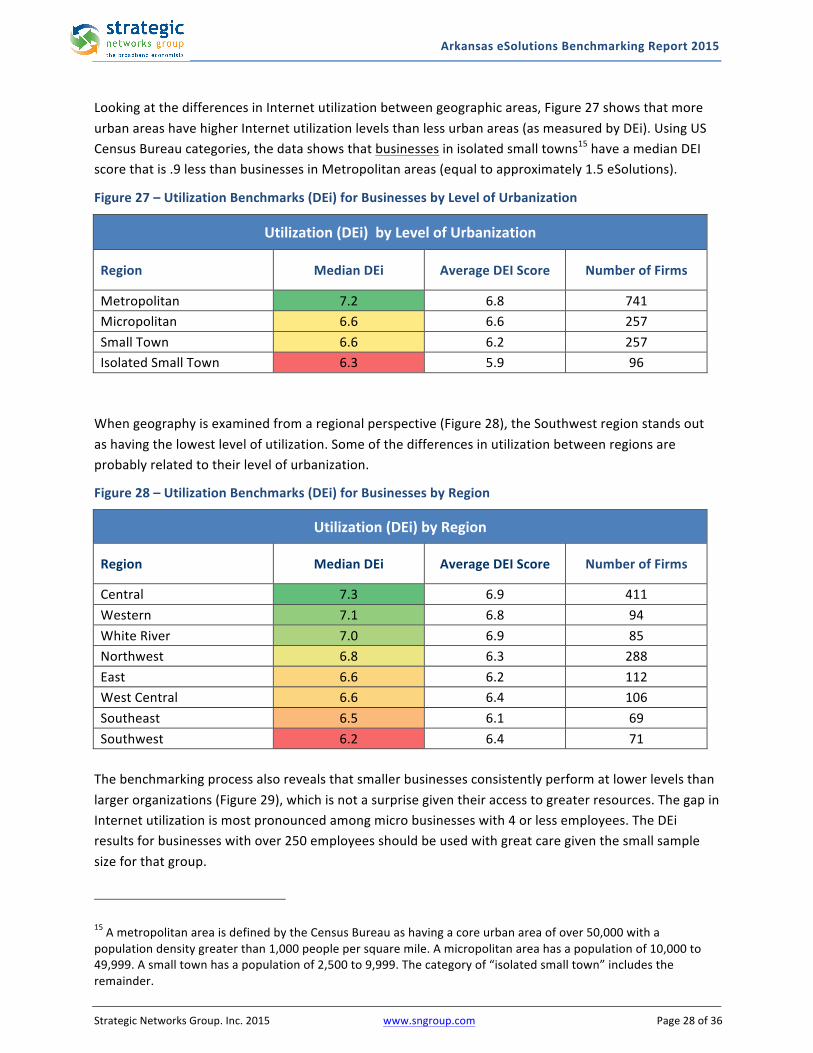
LookingatthedifferencesinInternetutilizationbetweengeographicareas,Figure27showsthatmoreurbanareashavehigherInternetutilizationlevelsthanlessurbanareas(asmeasuredbyDEi).UsingUSCensusBureaucategories,thedatashowsthatbusinessesinisolatedsmalltowns15haveamedianDEIscorethatis.9lessthanbusinessesinMetropolitanareas(equaltoapproximately1.5eSolutions).
Figure27–UtilizationBenchmarks(DEi)forBusinessesbyLevelofUrbanization
Utilization(DEi)byLevelofUrbanization
Region MedianDEi AverageDEIScore NumberofFirms
Metropolitan 7.2 6.8 741Micropolitan 6.6 6.6 257SmallTown 6.6 6.2 257IsolatedSmallTown 6.3 5.9 96Whengeographyisexaminedfromaregionalperspective(Figure28),theSouthwestregionstandsoutashavingthelowestlevelofutilization.Someofthedifferencesinutilizationbetweenregionsareprobablyrelatedtotheirlevelofurbanization.
Figure28–UtilizationBenchmarks(DEi)forBusinessesbyRegion
Utilization(DEi)byRegion
Region MedianDEi AverageDEIScore NumberofFirms
Central 7.3 6.9 411Western 7.1 6.8 94WhiteRiver 7.0 6.9 85Northwest 6.8 6.3 288East 6.6 6.2 112WestCentral 6.6 6.4 106Southeast 6.5 6.1 69Southwest 6.2 6.4 71Thebenchmarkingprocessalsorevealsthatsmallerbusinessesconsistentlyperformatlowerlevelsthanlargerorganizations(Figure29),whichisnotasurprisegiventheiraccesstogreaterresources.ThegapinInternetutilizationismostpronouncedamongmicrobusinesseswith4orlessemployees.TheDEiresultsforbusinesseswithover250employeesshouldbeusedwithgreatcaregiventhesmallsamplesizeforthatgroup.
15AmetropolitanareaisdefinedbytheCensusBureauashavingacoreurbanareaofover50,000withapopulationdensitygreaterthan1,000peoplepersquaremile.Amicropolitanareahasapopulationof10,000to49,999.Asmalltownhasapopulationof2,500to9,999.Thecategoryof“isolatedsmalltown”includestheremainder.
ArkansaseSolutionsBenchmarkingReport2015
StrategicNetworksGroup.Inc.2015 www.sngroup.com Page29of36
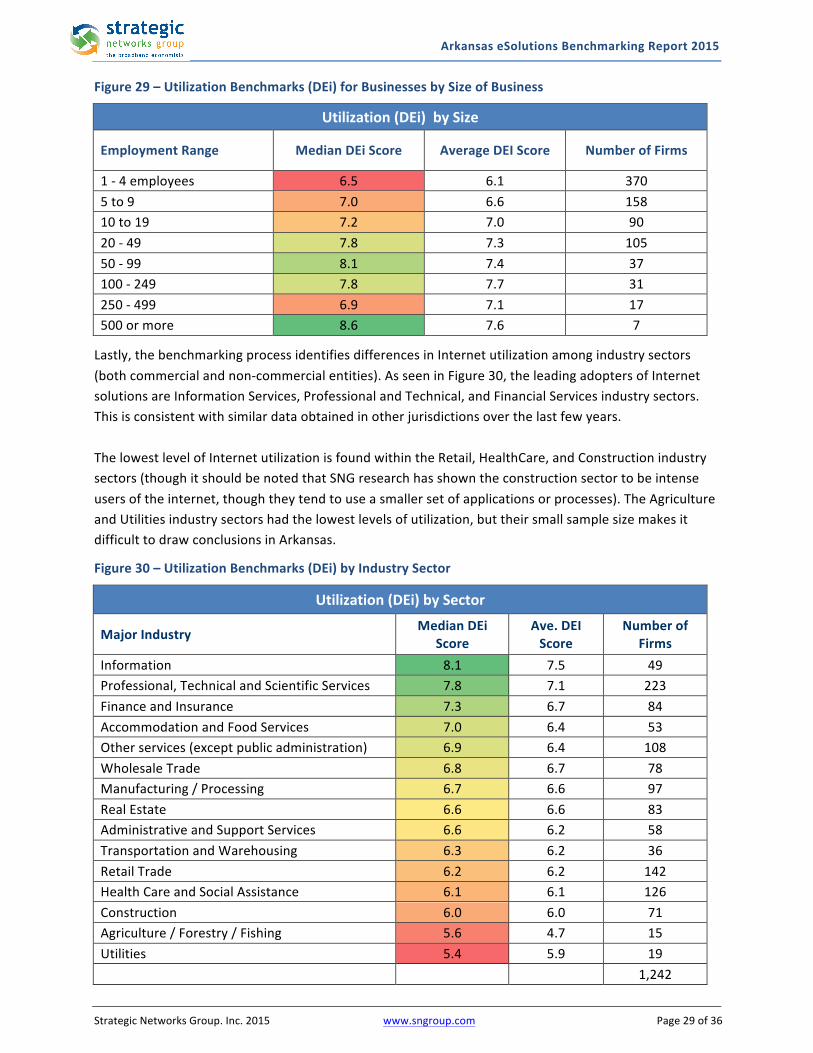
Figure29–UtilizationBenchmarks(DEi)forBusinessesbySizeofBusiness
Utilization(DEi)bySize
EmploymentRange MedianDEiScore AverageDEIScore NumberofFirms
1-4employees 6.5 6.1 3705to9 7.0 6.6 15810to19 7.2 7.0 9020-49 7.8 7.3 10550-99 8.1 7.4 37100-249 7.8 7.7 31250-499 6.9 7.1 17500ormore 8.6 7.6 7
Lastly,thebenchmarkingprocessidentifiesdifferencesinInternetutilizationamongindustrysectors(bothcommercialandnon-commercialentities).AsseeninFigure30,theleadingadoptersofInternetsolutionsareInformationServices,ProfessionalandTechnical,andFinancialServicesindustrysectors.Thisisconsistentwithsimilardataobtainedinotherjurisdictionsoverthelastfewyears.ThelowestlevelofInternetutilizationisfoundwithintheRetail,HealthCare,andConstructionindustrysectors(thoughitshouldbenotedthatSNGresearchhasshowntheconstructionsectortobeintenseusersoftheinternet,thoughtheytendtouseasmallersetofapplicationsorprocesses).TheAgricultureandUtilitiesindustrysectorshadthelowestlevelsofutilization,buttheirsmallsamplesizemakesitdifficulttodrawconclusionsinArkansas.
Figure30–UtilizationBenchmarks(DEi)byIndustrySector
Utilization(DEi)bySector
MajorIndustry MedianDEiScore
Ave.DEIScore
NumberofFirms
Information 8.1 7.5 49Professional,TechnicalandScientificServices 7.8 7.1 223FinanceandInsurance 7.3 6.7 84AccommodationandFoodServices 7.0 6.4 53Otherservices(exceptpublicadministration) 6.9 6.4 108WholesaleTrade 6.8 6.7 78Manufacturing/Processing 6.7 6.6 97RealEstate 6.6 6.6 83AdministrativeandSupportServices 6.6 6.2 58TransportationandWarehousing 6.3 6.2 36RetailTrade 6.2 6.2 142HealthCareandSocialAssistance 6.1 6.1 126Construction 6.0 6.0 71Agriculture/Forestry/Fishing 5.6 4.7 15Utilities 5.4 5.9 19 1,242
ArkansaseSolutionsBenchmarkingReport2015
StrategicNetworksGroup.Inc.2015 www.sngroup.com Page30of36
3 ComparativeAnalysisThissectionprovidesacomparativeanalysisofthelevelsofInternetutilizationbybusinessesandorganizationsinArkansasascomparedtofivebenchmarkstates.ThetablesinthisdocumentincluderesultsfromanassessmentcarriedoutacrossArkansasfromNovember2014toFebruary2015.Theseresultsarecomparedtoresultsfromstatewideassessmentscarriedoutinfivestatesbetween2012andJanuary2015.Thesefivestatesarereferredtoas“benchmarkstates”andincludeoneeasternseaboardstateandfourmid-westernstates.Resultsfromthesecomparisonsneedtobeusedcautiously.Eachstatewillhaveadifferentsocio-economicprofile,whichstronglyinfluencesInternetuse.Moreover,datacollectedinArkansasismorerecentthanthatfromthebenchmarkstates.Allthingsbeingotherwiseequal,onewouldexpectresultsfromArkansastoshowhigherlevelsofInternetutilizationasSNGanalysisshowsthatInternetutilizationincreaseswithtime.ThetablesinthissectionaredesignedtocompareresultsfromArkansasandthebenchmarkstates.Thefourtableswerechosenbecausetheycontrolforandisolatethekeyfactorsofsize,location,andindustrysector,therebycomparing“applestoapples”,asmuchaspossible.Withtheprecedingdesignconsiderationsinmind,thissectioncontainsfourtableswithcomparisonsof:
1. Differentindustrysectors16frommetropolitanareas(populationsover50,000);2. Differentindustrysectorsfromnon-metropolitanareas(populationsunder50,000);3. Businessesfromfivedifferentsizeranges(numberofemployees)inmetropolitanareas;and4. Businessesfromfivedifferentsizerangesinnon-metropolitanareas.
InordertomakecomparisonsofInternetutilization,thisaddendumusestheDigitalEconomyindex(DEi)asdescribedinSection2.KeepinginmindthatutilizationlevelswouldhaveincreasedbetweenwhendatawascollectedinArkansasandtheBenchmarkStates(2012–2015),thefollowingobservationscanbemade:
• Inbothmetropolitanandnon-metropolitanareas,benchmarkstateshadsimilaroverallDEiscorestoArkansas.(Note:anumberofindustrysectorsareascontainedsamplesizestoosmallforcomparisons).
• Inmetropolitanareas,mostindustrysectorsinArkansas:o hadutilizationlevelssimilartotheirpeersininformation,finance,professional&
technical,manufacturingo performedwellbelowtheirpeersinretail,realestate,andtransport&warehousing
• Innon-metropolitanareas,Arkansasindustrysectorsthat:
16Industriesarebasedon2-digitNAICScodeleveldatafromUSCBCountyBusinessPatterns2011.FullnamesofindustriesfromNAICSdefinitionsareabbreviatedforthistable.
ArkansaseSolutionsBenchmarkingReport2015
StrategicNetworksGroup.Inc.2015 www.sngroup.com Page31of36
o showedwellincomparisontotheirpeersincludedprofessional&technicalservicesandrealestate
o performedwellbelowtheirpeersincludedfinance,wholesaletrade,health&socialservices,andmanufacturing
Figure31-Differentindustrysectorsfrommetropolitanareas
BenchmarkStates Arkansas
MajorIndustry-Metropolitan SampleSize MedianDEi MedianDEi Sample
Size Variance
Information 458 7.8 8.1 25 0.29Finance&Insurance 478 7.6 7.8 47 0.15Professional&TechnicalServices 1,467 7.4 7.7 159 0.29RealEstate 308 7.3 6.4 44 -0.87RetailTrade 693 7.2 6.1 73 -1.06Administrative&SupportServices 323 7.0 7.0 40 0Manufacturing/Processing 692 7.0 6.8 50 -0.19Otherservices(exc.publicadmin) 616 7.0 7.2 61 0.19WholesaleTrade 444 6.9 7.3 52 0.39Transportation&Warehousing 168 6.8 6.0 21 -0.78HealthCare&SocialAssistance 645 6.6 6.6 73 0Construction 443 6.3 6.5 47 0.16Allsectors 9,797 7.1 7.1 881 0
Figure32-Differentindustrysectorsfromnon-metropolitanareas
BenchmarkStates Arkansas
MajorIndustry-Non-Metropolitan SampleSize MedianDEi MedianDEi Sample
Size Variance
Finance&Insurance 395 7.28 5.34 37 -1.94Information 330 7.18 7.28 24 0.10Manufacturing/Processing 321 7.09 6.5 47 -0.59WholesaleTrade 164 7.04 5.64 26 -1.40RealEstate 190 6.6 7.77 39 1.17Professional&TechnicalServices 424 6.5 7.77 63 1.27RetailTrade 462 6.46 6.21 69 -0.25Otherservices(exc.publicadmin) 378 6.31 6.7 47 0.39HealthCare&SocialAssistance 410 6.21 5.53 53 -0.68Construction 243 5.92 5.92 24 0Allsectors 6,094 6.5 6.5 589 0Figures3and4demonstratehowcommercialbusinessesinArkansascomparetotheirpeersandcompetitorsofasimilarsizeandlocationinthebenchmarkstates.Thefollowingobservationsarehighlighted:
ArkansaseSolutionsBenchmarkingReport2015
StrategicNetworksGroup.Inc.2015 www.sngroup.com Page32of36
• Inmetropolitanareas,ArkansasorganizationshadslightlyhigherlevelsofInternetutilizationthanthebenchmarkstates,thoughtheslightdifferencecanprobablybeattributedtoArkansasdatabeingmorerecent(i.e.2015vs2013and2012data).
• Innon-metro(“rural”)areas,whileoverallutilizationlevelsweresimilar,microbusinesses(lessthan5employees)performedmarkedlybetterthantheirpeersinbenchmarkstates.
Figure33-Businessesfromfivedifferentsizerangesinmetropolitanareas
MetropolitanBusinesses BenchmarkStates Arkansas
SizeofBusinessby#ofEmployees SampleSize MedianDEi MedianDEi SampleSize
1–4 3,263 6.41 6.41 2515–9 1,633 7.09 7.38 11310–19 1,369 7.18 7.38 7520–49 1,372 7.28 8.06 8450ormore 1,741 7.77 7.86 86
9,696* 7.09 7.18 908
Figure34-Businessesfromfivedifferentsizerangesinnon-metropolitanareas
Non-MetroBusinesses BenchmarkStates ArkansasSizeofBusinessby#of
Employees SampleSize MedianDEi MedianDEi SampleSize
1-4 1,914 5.73 6.36 1905-9 940 6.41 6.21 7010-19 755 6.80 6.31 4420-49 744 6.99 7.18 4950ormore 1,060 7.38 7.86 44 6,094* 6.5 6.55 620Concludingnote:amorecompleteanalysisonInternetutilizationandconnectivityisincludedinthetworeportsnotedbelow.Thesereportsalsoincludeadescriptionofthemethodologyusedcollectdata.
• ArkansaseSolutionsBenchmarking,February2015–ThisreportprovidesbasicdataonhowbusinessesandotherorganizationsacrossArkansasutilizetheInternet.ThereporthighlightsdifferencesinInternetutilizationthatprovideallowbusinessesandorganizationstoidentifywheretheymaybelaggingtheirpeersandhowtheycanimprovetheirproductivityandprofitability.
• ArkansaseStrategiesReport,February2015–Thisreportbuildsontheprecedingreportby
identifyingkeystrategiesandrecommendationsforcommunitiesandindividualbusinessesacrossArkansas.
ArkansaseSolutionsBenchmarkingReport2015
StrategicNetworksGroup.Inc.2015 www.sngroup.com Page33of36
AppendixA- DataCollectionMethodsandResultsThecoremethodologyisfoundedonprimaryresearchviadatacollectionthroughonlineassessmentsofbusinessesandnon-commercialorganizations.TheassessmentcollectsinformationdirectlyfromInternetusersinthefollowingcategories:UserProfile–informationthatcharacterizeeachrespondentforpurposesofstatisticalanalysisbasedonusercharacteristics,e.g.organizationsizebyemployment,timeofInternetuse;orlocation.InternetUtilization–thecurrentandplannedusesoftheInternetacrossmultiplecategoriesrelevanttohowbusinessesandnon-commercialentitiesmayusetheInternet.TheprimarytypeofInternetconnectionusedisalsoidentifiedforselectedcrosstabulationswithotherresponsedata.InternetBenefits–informationonhowbusinessesandnon-commercialentitiesassessthebenefitsofusingtheInternet.Barriers-informationontheimportanceoffactorsthatpreventorinhibitbusinessesandnon-commercialentitiesfromtakingfulladvantageoftheInternet.Theassessmentsaremadeavailableforonlineaccessthroughoneoftwomeans:
• Individualbusinessesandnon-commercialorganizationswereinvitedtoparticipateviadirectemailinvitationssentfromalarge,statewidecontactlist.
• Inaddition,businessesandnon-commercialorganizationswereencouragedthroughavarietyofothercommunicationschannelstoaccessalinktotheassessment.
Theoverallerrormarginforstatisticalanalysisis+/-2.9%(witha95%ConfidenceInterval).17Thesampleerrormarginindicatestheaccuracyofthestatisticsderivedinrelationtohowtheyrepresentthelargerpopulation.Usinga95%ConfidenceInterval,astatisticshouldfallwithintheerrormarginfor95%ofanyrandomsamplesofthepopulation.Thesampleerrormarginiscalculatedbasedonthesamplesize,thepopulationsize,andtheconfidenceinterval.For95%confidenceintervalandforpopulationsmuchlargerthanthesample,thesamplingerroris0.98dividedbythesquarerootofN,whereNisthesamplesize.Forthisreportallpopulationsizesaremuchlargerthanthesamplesizes.Thefollowingisanexampleforinterpretationofstatisticsprovidedinthisreport:
• 61.9%oforganizationsusetheInternetforsellinggoodsorservicesonline.• ThesamplesizefororganizationsreportingInternetutilizationis745,providingasampleerror
marginof+/-3.6%witha95%confidenceinterval.Thismeansthatanysimilarsampleofthepopulationoforganizationsacrossthestatewillresultinastatisticforsellinggoodsorservicesonebetween58.3%and65.5%(61.9%+/-3.6%)95%ofthetime.Thestatisticwouldfalloutsidethisrange5%ofthetimeforotherrandomsamplesofthepopulation.Inpracticaltermsthesamplingerrorcanbetakenastheaccuracyofthestatisticasitappliestotheentirepopulation.
17Theerrormarginat95%ConfidenceIntervalisoftenreferredtoas+/-X%accuracy,19timesoutof20.Errormarginsincreasefordetailedanalysisthatusessubsetsoftheoverallsample.Whereapplicable,samplesizesandsampleerrormarginsareindicated–example:N=1,428[2.6%].
ArkansaseSolutionsBenchmarkingReport2015
StrategicNetworksGroup.Inc.2015 www.sngroup.com Page34of36
Smallersamplesizesresultinlargersamplingerrors.Whencomparingstatisticsbetweentwoindependentsamples,thesampleerrorsforeachsamplemustbeconsideredtodetermineifthedifferenceissignificant.Wherethehigherendofastatistic(X%+errormargin)forsampleAislessthanthelowerendofthesamestatistic(Y%–errormargin)forsampleB,thedifferencecanbeconsideredstatisticallysignificant.Wherethedifferencebetweenstatisticsiswithinthesamplingerrormarginranges,thensuchdifferencesmaynotberealorsignificantforotherrandomsamplesofthesamesizes.Forsimplicityofreportingthestatisticsarestatedasgivenwithsamplesizesandsamplingerrormarginsprovidedforinterpretation.
ArkansaseSolutionsBenchmarkingReport2015
StrategicNetworksGroup.Inc.2015 www.sngroup.com Page35of36
AppendixB- GlossaryArkansaseSolutionsBenchmarkingReport:ThisreportpresentstheresultsofassessmentsofInternetusecarriedoutfortheStateofArkansas.Theassessmentscollectedinformationfrombusinessesandnon-commercialorganizationsregardingtheavailabilityofbroadband(highspeedInternetaccess)anditsuses,benefits,driversandbarriers.Thislargelydescriptivereportresultsprovideinsightintogapsandopportunitiesforincreasingbroadbandutilizationbybusinessesandnon-commercialentities.DigitalEconomyAnalysisPlatform(DEAP):TheDEAPhasbeendevelopedasanonlineresourcethatprovidesclientswithaccesstothedatacollectionresultsandtheabilitytocustomizetheiranalysisacrossarangeofvariables,includingindustrysectororgeographicregion.TheDEAPisaccessedonlinebyauthorizedusers.UsersarepresentedwithdashboardsforbusinessesandCAIs.Eachdashboardisorganizedaroundaseriesofpagesfocusedonspecifictopics,e.g.Connectivity,Utilization,DEi,Impacts,etc.Withineachpageisasetofpredefinedreportsthatpresentachartand/ortableofprocessedresultsfromthedatasets.eSolutions:referstotheintegrationofInternettechnologieswiththeinternalcomputer-basedsystemsandapplicationswithinoramongorganizationsforavarietyofoperationalprocesses.eSolutionsencompassnotonlyproductdeliveryandpaymenttransactions(e-commerce)butalsoallprocessesthatmaybefacilitatedbycomputer-mediatedcommunicationsovertheInternet.eProcess:usesoftheInternetwhichincludeinternaloperationaluses,suchassuppliercoordination,trainingandteleworking.eCommerce:usesoftheInternetwhichincludeactivitiesrelatedtothesales,marketinganddeliveryofproductsandservices;and,ArkansasDigitalEconomyIndex:TheDigitalEconomyindex(DEi)ispartofthebenchmarkingprocessandprovidesreferencepointsagainstwhichtheperformanceofanyindividualorgroupcanbecompared.TheDEisummarizesanorganization’sutilizationof17Internetapplicationsandprocess.BasedonthenumberofapplicationscurrentlybeingusedbyabusinessesorCAI,acompositescoreiscalculatedthatsummarizeshowcomprehensivelyeachorganizationusesInternet-enabledeSolutions.TheDEicanbeusedtocompareorganizations,regions,orindustrysectors.Utilizationreferstothethirdstageinthebroadbanddevelopmentprocess.Thefirststageisprovidingacommunityororganizationwithaccess(availability)totheInternet.ThesecondstageisadoptionortheprocesswherebyapersonororganizationstartstoactuallyusetheInternet.ThethirdstageisutilizationwherebyapersonororganizationusestheirInternetconnectiontocreatevalue.ManypeopleandorganizationshaveaccessandhaveadoptedtheInternet,butarerelativelyineffectiveinhowtheyuseandderivebenefitsfromtheInternet.Thefieldofanalysislabeled“utilization”explorespatternsofInternetuseandhowthesepatternscanbeenhanced.

ArkansaseStrategyReport
March2015
Preparedfor
StrategicNetworksGroup,Inc.|www.sngroup.com|CONFIDENTIAL
Arkansase-StrategyReport2015
StrategicNetworksGroup.Inc.2015 www.sngroup.com Page2of25
TableofContents
TableofFigures.....................................................................................................2
SummaryandRecommendations..........................................................................3
1. StartingPoints.................................................................................................91.1 OrganizationandObjectivesoftheReport............................................................................91.2 WhatisBroadband?............................................................................................................101.3 TheDigitalEconomyindex(DEi)..........................................................................................11
2. BroadbandUtilizationbyOrganizations.........................................................132.1.1 InternetConnectivity..........................................................................................................132.1.2 UtilizationbyIndustry........................................................................................................142.1.3 DifferencesinUtilization:GapsandOpportunities............................................................15
2.2 WhatContributestotheDifferentLevelsofUtilization?......................................................152.3 IdentifyingPriorityInternetApplications.............................................................................172.4 TheAdoptionProcess..........................................................................................................192.5 BarrierstoImprovedUtilization..........................................................................................20
3. SummaryandNextSteps...............................................................................22
Appendix1:Glossary..........................................................................................23
TableofFiguresFigure1:TopIndustrySectorsInArkansas...............................................................................................14Figure2:AverageInternetUtilizationbyIndustrySector........................................................................14Figure3:BusinessInternetUsagebyLevelofUrbanization......................................................................16Figure4:BusinessInternetUsagebyRegion.............................................................................................16Figure5:Utilization(medianDEiScore)byOrganizationalSize................................................................16Figure6:ImpactofLocationonUtilization,bySizeofOrganization.......................................................17Figure7:DifferenceinUtilizationofSpecificeSolutionsbySizeofOrganization...................................18Figure8:PlannedAdoptionofSpecificeSolutionsbySmallBusinesses.................................................19Figure9:BarrierstoAdoptionofeSolutionsamongBusinesseswithlessthan50Employees..............21
Arkansase-StrategyReport2015
StrategicNetworksGroup,Inc.2015 www.sngroup.com Page3of25
SummaryandRecommendationsManycommunitiesandcountiesacrossArkansasaredealingwitheconomicdislocationandanagingpopulation1.Mostruralareasfacetheadditionalchallengeofthesteadyshiftofpopulationfromruraltourbanareas2.Inthefaceofthesechallenges,howcancommunitiesandbusinessesmaximizetheircompetitiveness,whileimprovingtheirqualityoflife?Oneareawithsignificantpotentialisbroadband(seeSection2.2foradefinition),whichcanbeleveragedintotangiblebenefitsforcommunitiesandbothcommercialandnon-commercialorganizations.Thisreportanditscompaniondocument,ArkansaseSolutionsBenchmarking3,demonstrateshowbusinessescanbecomemoreproductive,competitive,andreachintonewmarkets.ThefirststepinbenefitingfrombroadbandisacquiringconnectivityoraccesstotheInternet.Andonceaccessisacquired,thesecondstepisadoption,wherebybusinessesandotherorganizationsbegintousetheirhigh-speedInternetaccessonaregularbasis.Thethird(andsometimesmostdifficulttoachieve)stageinbroadbanddevelopmentisutilization.ThismeansusingtheInternetinincreasinglyproductivewaysthatbringconcretebenefits,suchasjobs,newsavingsandrevenues,andimprovedqualityoflife.Thisreportfocusesonutilizationasthethirdstageofbroadbanddevelopment.
UtilizingBroadbandThisreportrevealsthattheabilitytoutilizeorleveragebroadbandvariessignificantlyacrosscommercialandnon-commercialorganizations.Notallcommunitieshavebeenabletoturnthepotentialofbroadbandintomeasurablesuccessintermsofjobs,companyattractionandretention,anincreasedtaxbaseandmoreefficientandeffectivecitizenservices.ManybusinessesandorganizationsstruggleintheireffortstousetheInternettogenerateincreasedrevenues.Turningpotentialintorealityrequiresskills,training,andbothformalandinformalsupport.Incommunitiesthatalreadyhavealarge,diverse,andmoderneconomyandworkforce,buildingbroadbandinfrastructuremaybesufficienttorealizethepotentialofbroadband.However,manyindustrysectors,communities,andbusinesseshavelimitedInternetrelatedskillsandcapacity.Benchmarkingdatashowthatformanycommunities,especiallyinnon-metropolitanareas,utilizing
1RuralProfileofArkansas2013–Social&EconomicTrendsAffectingRuralArkansas:UniversityofArkansas,DivisionofAgriculture,ResearchandExtension.2SeevariouspublicationsofDavidMcGranahanfromtheUSDA:http://www.ers.usda.gov/ers-staff-directory/david-mcgranahan.aspx.3Asummaryofthefindingsfromthe2015benchmarkingeffortcanbefoundintheArkansaseSolutionsBenchmarkingReport(February2015)whichislargelydescriptiveanddoesnotincludesomeoftheanalysisnortherecommendationsinthisreport.
Arkansase-StrategyReport2015
StrategicNetworksGroup,Inc.2015 www.sngroup.com Page4of25
broadbandoftenlags(Section2.2),evenwithstate-of-the-artconnectivity4available.Theresultisthatthesecommunitiesandbusinessesmissoutonmanyofthebenefitsofbroadband.Moreimportantly,overtime,thesecommunitiesareatriskofbecomingeconomicallylesscompetitiveandgenerallylessattractivetohouseholdsandbusinesses5.Itisautilizationgapthatcancreatebothaneconomicdivideaswellasopportunitiesforunder-utilizers.Thisreportexamineshowbusinessesandnon-commercialorganizationsinArkansasdifferintheirutilizationofbroadbandandwheretheycanlooktomakeimprovements.Thereportshowsindetailhowdifferentindustrysectorsandbusinesstypescomparetoeachother,especiallybetweenandwithinregions.Thereportprovidesinsightsanddatathatallowcommunitiesandorganizationstoassesswheretheystandandidentifywhatkindsofactionswillimprovetheirperformanceandbenefits.ThereportincludesrecommendationsforhowtheStateofArkansasanditscommunitiescanimproveutilizationofbroadbandbyitsbusinessesandnon-commercialorganizations,therebyimprovingtheireconomiesandqualityoflife.Recommendationsarebrokendownintothreeareas:
1. GapsandopportunitiesinuseoftheInternetandbroadband;2. KeybarrierstoimprovingtheuseandbenefitsoftheInternetandbroadband;and3. Thebestwaystobuildskillsandabilities.
Analysisandrecommendationsfocusprimarilyonbusinesses,althoughtherecommendationsmayalsobeappliedtonon-profitorganizationsandgovernmententities.AmoredetaileddescriptionoftheimpactsofInternetutilizationonbusinessrevenuesandemploymentcanbefoundintheArkansaseSolutionsBenchmarkingReport(February2015)whichisamorecompleteanddescriptivepresentationoftheassessment/surveyresults,whereasthisdocumentismorestrategicandprescriptive.
4ThisstatementissupportedbydatafromeSolutionsBenchmarkingeffortsundertakenbyStrategicNetworksGroups(SNG)innon-metropolitancommunitiesthathavehadbroadbandforanextendedperiodoftime.ThestatementisalsosupportedbycommentsmadebyInternetServiceProvidersduringruralbroadbandplanningworkshopsfacilitatedbySNG.5Almost40%ofbusinessesparticipatinginthebroadbandbenchmarkingeffortinArkansasstatedthatbroadbandservicewas“essential”inselectingtheirbusinesslocation,andover58%saybroadbandis“essential”forremainingintheircurrentlocation.ArkansaseSolutionsBenchmarkingReport(February2015),page20.
ThisreportusesdatacollectedbetweenNovember2014andFebruary2015acrossArkansas.Atotalof1,532organizationscontributedtothebroadbandbenchmarkingeffort.Theorganizationsconsistedof1,236businesses,95governmententitiesand201nonprofits.
Arkansase-StrategyReport2015
StrategicNetworksGroup,Inc.2015 www.sngroup.com Page5of25
RecommendationsTohelpstakeholdersandcommunitiesbetterunderstandandusethisreport,recommendationshavebeenstructuredaroundfundamentalquestionsthatleadersanddecision-makersfaceintermsofleveragingbroadbandforthesocio-economicbenefitoftheircommunitiesandconstituents.ThebasisfortheserecommendationscanbefoundinSection2ofthisReport.1.Howimportantishigh-speedInternetaccesstoArkansas,itscommunities,anditsresidents?Inthe21stcentury,broadbandaccesshasbecomeanessentialpartofacommunity’sinfrastructure,abusiness’internalandexternaloperations,andahousehold’sparticipationintheircommunitylife.Availabilityandmeaningfuluseofhigh-speedInternetaccessaredirectlytiedtoacommunity’sviability,competitiveness,andqualityoflife.However,therearesignificantdifferencesbetweencommunitiesinqualityofInternetconnectivityandtheirproductiveuseoftheInternet.CurrentInternetusagevarieswidelyandisexploredinthevarioussectionsofthisreport.Eachcountyorcommunityhasitsownuniquecharacteristics,assets,andchallenges.Consequently,eachcountyorcommunityrequiresstrategiesandinitiativesthataddressitsuniquesituation.Recommendation#1:Eachcountyorcommunityshoulddevelopitsownstrategyandinitiativesbased
onitsowncharacteristics,values,andpriorities.Prioritiesandtargetsshouldincludeinfrastructurecoverageandcapabilities,aswellashighlevelsofadoptionofthoseeSolutionsneededtoremaincompetitive.Whilefocustendstorevolvearoundattractingbetteravailabilityandspeed–spendtimetodriveutilizationofwhatisavailable.
2.Istheavailabilityofhigh-speedInternetaccessstillanissueformanyareasofArkansas?Whilethevastmajorityofbusinessesandnon-commercialorganizationsreportthattheyhaveInternetconnectivity,63.1%ofrespondentshaduploadspeedsoflessthantheFCC’snewbroadbandstandardof3mbps,while80%failedtomeettheFCCbroadbanddownloadstandardof25mbps.Moreover,muchofthephysicalInternetinfrastructureinnon-metroareasconsistsofoldertechnologythatprovidesInternetspeedsandcapacitywellbelowthatofmostArkansasmetropolitanareas.Theissue
Broadbandwasalsoconsidered“essential”forselectinglocationby
40%ofbusinesses,aswellas“essential”forremaininginlocation
by58%ofbusinesses.BenchmarkingDataforAransas,
February2015.
Arkansase-StrategyReport2015
StrategicNetworksGroup,Inc.2015 www.sngroup.com Page6of25
ofpoorornoInternetservicesalsoremainsacriticalissueinsomeruralresidentialareas.Toremaincompetitive,communitiesneedrobust6andaffordableconnectivitythatalsosupportsmobiledevices.Theuseofmobiledevicesandapplicationsfor“untetheredaccess”isexpectedtocontinuetogrowandbecomeincreasinglyintegratedintohoworganizationsusetheInternettoenableadditionalopportunitiesforincreasingworkeffectivenessandproductivity.TheavailabilityofeffectivemobileInternetaccesswillbecomeincreasinglyimportantasanadjuncttowiredaccessformanyorganizations,especiallythosewithmobileworkers.Recommendation#2:Undertakeeffortsatthelocalleveltoidentifyareaswithouthigh-speedInternet
andtodeveloplocalsolutionsthataddresstheproblem.LocalandregionalinitiativesshouldencouragemobilewirelessInternetServiceProvidersandtelecommunicationscompaniestoextend4GandLTEcapabilitiestoareascurrentlywithoutsuchservice.
3.WherearethemajorgapsorweaknessesinutilizationoftheInternetanditsapplications?KeygapsinInternetutilizationarerelatedtodegreeof“rurality,”businesssize,andindustrysector.Prioritizingindustrysectorsandothereconomicgroupsmustbedonewithinalocal,orregionalcontext.Localandcountylevelplanningwillneedtoconsideradditionalfactorsandconsiderations,suchasindustrysectorsindecline,orregionalstrategiesfordevelopingspecificsectors.Ingeneral,focusshouldbeonindustrysectorsthatmakethelargestcontributiontotheeconomyandthathavethegreatestgrowthpotential.Recommendation#3: Ratherthanundertakingbroadbutuntargetedefforts,broadbandinitiatives
shouldfocusonindustriesthathavethehighesteconomiccontributionandhighestgrowthpotentialwithineachregion.Threesectorsthatshouldbegivenpriorityarehealthandsocialservices,retail,andconstruction.
4.HowcanweusetheInternet’spotentialtomaximizejobcreation?Smalltomediumsizedorganizationswith1to49employeesshouldbeafocusforallregions.Thissegmentisimportantforthefollowingreasons:
• Itincludes95.2%ofallestablishmentsinArkansas.• Theseorganizationsexperiencetheweakestutilizationlevelscomparedtoorganizationswith
largernumbersofemployees.
6RobustconnectivitycanbedefinedasInternetconnectivitythatisreliable24hoursaday,withconsistenthighuploadanddownloadspeedsthatmeettheFCCdefinitionofbroadband.
Arkansase-StrategyReport2015
StrategicNetworksGroup,Inc.2015 www.sngroup.com Page7of25
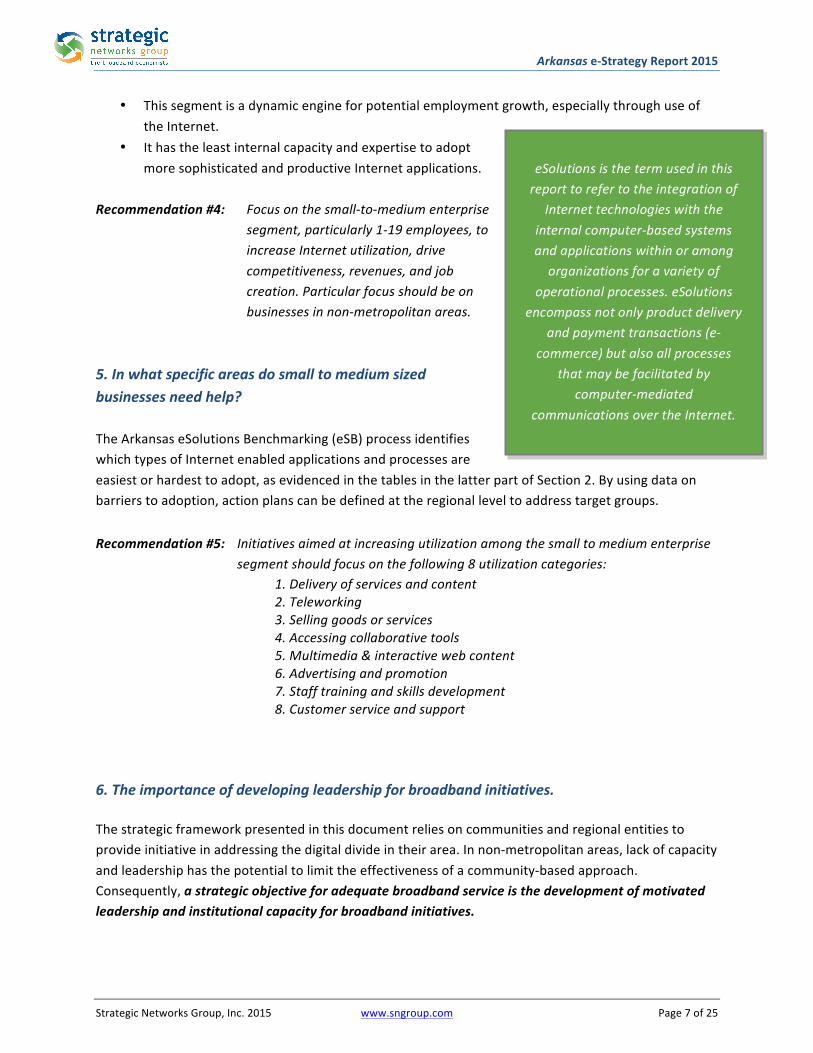
eSolutionsisthetermusedinthisreporttorefertotheintegrationof
Internettechnologieswiththeinternalcomputer-basedsystemsandapplicationswithinoramongorganizationsforavarietyof
operationalprocesses.eSolutionsencompassnotonlyproductdelivery
andpaymenttransactions(e-commerce)butalsoallprocesses
thatmaybefacilitatedbycomputer-mediated
communicationsovertheInternet.
• Thissegmentisadynamicengineforpotentialemploymentgrowth,especiallythroughuseoftheInternet.
• IthastheleastinternalcapacityandexpertisetoadoptmoresophisticatedandproductiveInternetapplications.
Recommendation#4: Focusonthesmall-to-mediumenterprise
segment,particularly1-19employees,toincreaseInternetutilization,drivecompetitiveness,revenues,andjobcreation.Particularfocusshouldbeonbusinessesinnon-metropolitanareas.
5.Inwhatspecificareasdosmalltomediumsizedbusinessesneedhelp?TheArkansaseSolutionsBenchmarking(eSB)processidentifieswhichtypesofInternetenabledapplicationsandprocessesareeasiestorhardesttoadopt,asevidencedinthetablesinthelatterpartofSection2.Byusingdataonbarrierstoadoption,actionplanscanbedefinedattheregionalleveltoaddresstargetgroups.Recommendation#5: Initiativesaimedatincreasingutilizationamongthesmalltomediumenterprise
segmentshouldfocusonthefollowing8utilizationcategories:1.Deliveryofservicesandcontent2.Teleworking3.Sellinggoodsorservices4.Accessingcollaborativetools5.Multimedia&interactivewebcontent6.Advertisingandpromotion7.Stafftrainingandskillsdevelopment8.Customerserviceandsupport
6.Theimportanceofdevelopingleadershipforbroadbandinitiatives.Thestrategicframeworkpresentedinthisdocumentreliesoncommunitiesandregionalentitiestoprovideinitiativeinaddressingthedigitaldivideintheirarea.Innon-metropolitanareas,lackofcapacityandleadershiphasthepotentialtolimittheeffectivenessofacommunity-basedapproach.Consequently,astrategicobjectiveforadequatebroadbandserviceisthedevelopmentofmotivatedleadershipandinstitutionalcapacityforbroadbandinitiatives.
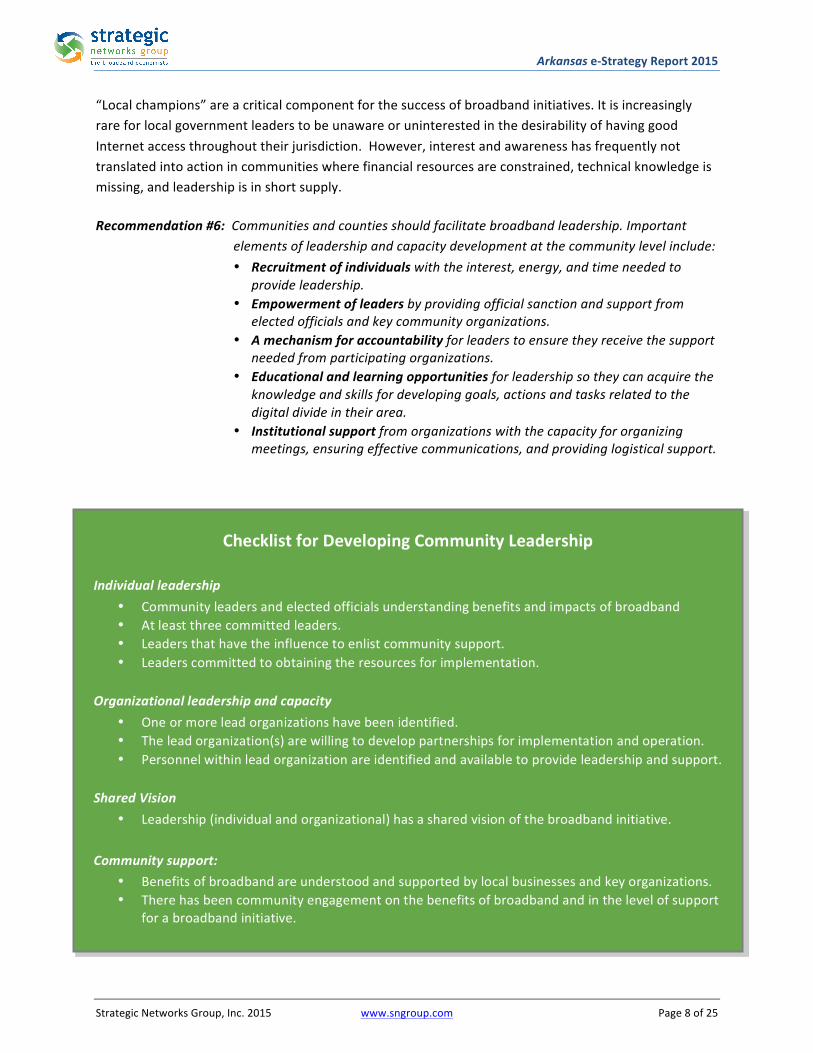
Arkansase-StrategyReport2015
StrategicNetworksGroup,Inc.2015 www.sngroup.com Page8of25
“Localchampions”areacriticalcomponentforthesuccessofbroadbandinitiatives.ItisincreasinglyrareforlocalgovernmentleaderstobeunawareoruninterestedinthedesirabilityofhavinggoodInternetaccessthroughouttheirjurisdiction.However,interestandawarenesshasfrequentlynottranslatedintoactionincommunitieswherefinancialresourcesareconstrained,technicalknowledgeismissing,andleadershipisinshortsupply.Recommendation#6:Communitiesandcountiesshouldfacilitatebroadbandleadership.Important
elementsofleadershipandcapacitydevelopmentatthecommunitylevelinclude:• Recruitmentofindividualswiththeinterest,energy,andtimeneededto
provideleadership.• Empowermentofleadersbyprovidingofficialsanctionandsupportfrom
electedofficialsandkeycommunityorganizations.• Amechanismforaccountabilityforleaderstoensuretheyreceivethesupport
neededfromparticipatingorganizations.• Educationalandlearningopportunitiesforleadershipsotheycanacquirethe
knowledgeandskillsfordevelopinggoals,actionsandtasksrelatedtothedigitaldivideintheirarea.
• Institutionalsupportfromorganizationswiththecapacityfororganizingmeetings,ensuringeffectivecommunications,andprovidinglogisticalsupport.
ChecklistforDevelopingCommunityLeadershipIndividualleadership
• Communityleadersandelectedofficialsunderstandingbenefitsandimpactsofbroadband• Atleastthreecommittedleaders.• Leadersthathavetheinfluencetoenlistcommunitysupport.• Leaderscommittedtoobtainingtheresourcesforimplementation.
Organizationalleadershipandcapacity
• Oneormoreleadorganizationshavebeenidentified.• Theleadorganization(s)arewillingtodeveloppartnershipsforimplementationandoperation.• Personnelwithinleadorganizationareidentifiedandavailabletoprovideleadershipandsupport.
SharedVision
• Leadership(individualandorganizational)hasasharedvisionofthebroadbandinitiative.Communitysupport:
• Benefitsofbroadbandareunderstoodandsupportedbylocalbusinessesandkeyorganizations.• Therehasbeencommunityengagementonthebenefitsofbroadbandandinthelevelofsupport
forabroadbandinitiative.
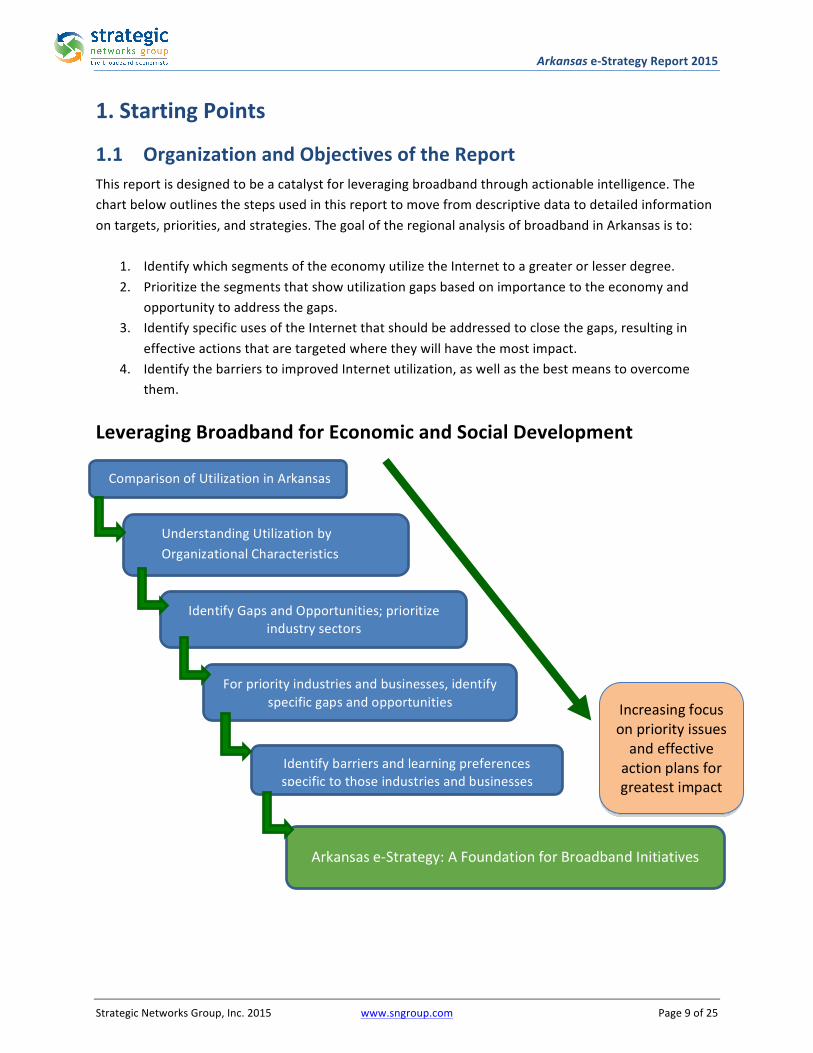
Arkansase-StrategyReport2015
StrategicNetworksGroup,Inc.2015 www.sngroup.com Page9of25
1. StartingPoints
1.1 OrganizationandObjectivesoftheReportThisreportisdesignedtobeacatalystforleveragingbroadbandthroughactionableintelligence.Thechartbelowoutlinesthestepsusedinthisreporttomovefromdescriptivedatatodetailedinformationontargets,priorities,andstrategies.ThegoaloftheregionalanalysisofbroadbandinArkansasisto:
1. IdentifywhichsegmentsoftheeconomyutilizetheInternettoagreaterorlesserdegree.2. Prioritizethesegmentsthatshowutilizationgapsbasedonimportancetotheeconomyand
opportunitytoaddressthegaps.3. IdentifyspecificusesoftheInternetthatshouldbeaddressedtoclosethegaps,resultingin
effectiveactionsthataretargetedwheretheywillhavethemostimpact.4. IdentifythebarrierstoimprovedInternetutilization,aswellasthebestmeanstoovercome
them.
LeveragingBroadbandforEconomicandSocialDevelopment
ComparisonofUtilizationinArkansas
UnderstandingUtilizationbyOrganizationalCharacteristics
IdentifyGapsandOpportunities;prioritizeindustrysectors
Forpriorityindustriesandbusinesses,identifyspecificgapsandopportunities
Identifybarriersandlearningpreferencesspecifictothoseindustriesandbusinesses
Arkansase-Strategy:AFoundationforBroadbandInitiatives
Increasingfocusonpriorityissuesandeffectiveactionplansforgreatestimpact
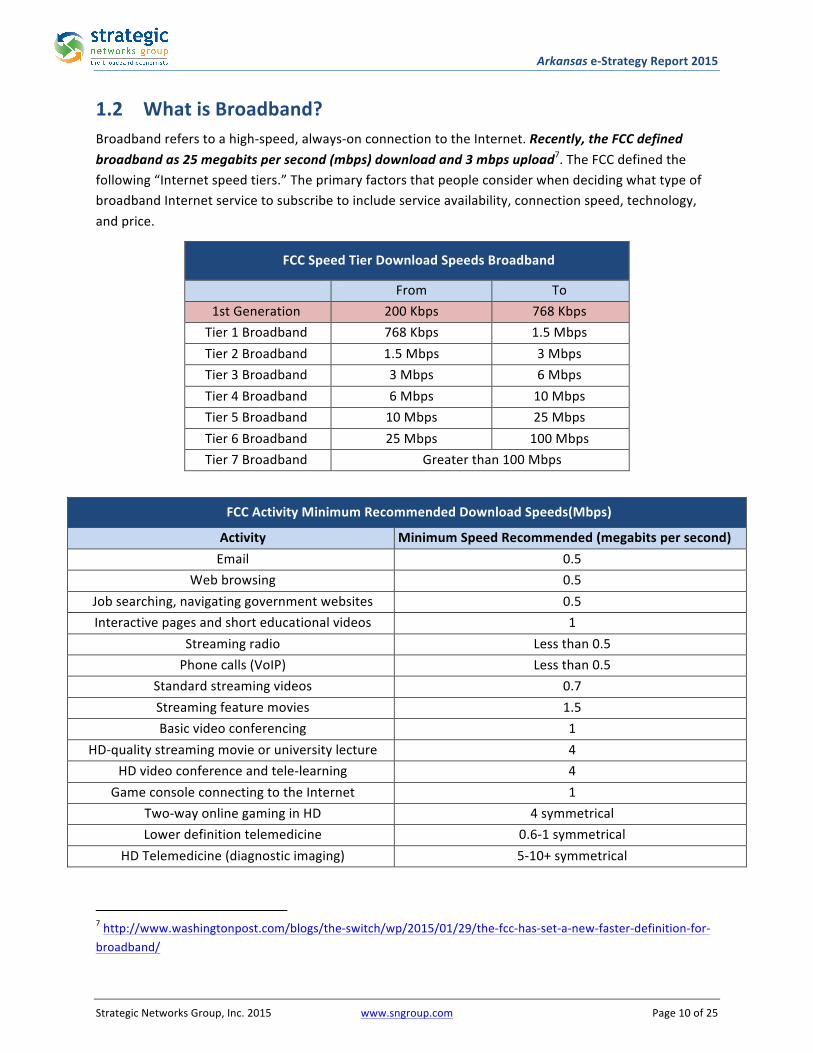
Arkansase-StrategyReport2015
StrategicNetworksGroup,Inc.2015 www.sngroup.com Page10of25
1.2 WhatisBroadband?Broadbandreferstoahigh-speed,always-onconnectiontotheInternet.Recently,theFCCdefinedbroadbandas25megabitspersecond(mbps)downloadand3mbpsupload7.TheFCCdefinedthefollowing“Internetspeedtiers.”TheprimaryfactorsthatpeopleconsiderwhendecidingwhattypeofbroadbandInternetservicetosubscribetoincludeserviceavailability,connectionspeed,technology,andprice.
FCCSpeedTierDownloadSpeedsBroadband
From To1stGeneration 200Kbps 768KbpsTier1Broadband 768Kbps 1.5MbpsTier2Broadband 1.5Mbps 3MbpsTier3Broadband 3Mbps 6MbpsTier4Broadband 6Mbps 10MbpsTier5Broadband 10Mbps 25MbpsTier6Broadband 25Mbps 100MbpsTier7Broadband Greaterthan100Mbps
FCCActivityMinimumRecommendedDownloadSpeeds(Mbps)
Activity MinimumSpeedRecommended(megabitspersecond)Email 0.5
Webbrowsing 0.5Jobsearching,navigatinggovernmentwebsites 0.5Interactivepagesandshorteducationalvideos 1
Streamingradio Lessthan0.5Phonecalls(VoIP) Lessthan0.5
Standardstreamingvideos 0.7Streamingfeaturemovies 1.5Basicvideoconferencing 1
HD-qualitystreamingmovieoruniversitylecture 4HDvideoconferenceandtele-learning 4
GameconsoleconnectingtotheInternet 1Two-wayonlinegaminginHD 4symmetricalLowerdefinitiontelemedicine 0.6-1symmetrical
HDTelemedicine(diagnosticimaging) 5-10+symmetrical
7http://www.washingtonpost.com/blogs/the-switch/wp/2015/01/29/the-fcc-has-set-a-new-faster-definition-for-broadband/
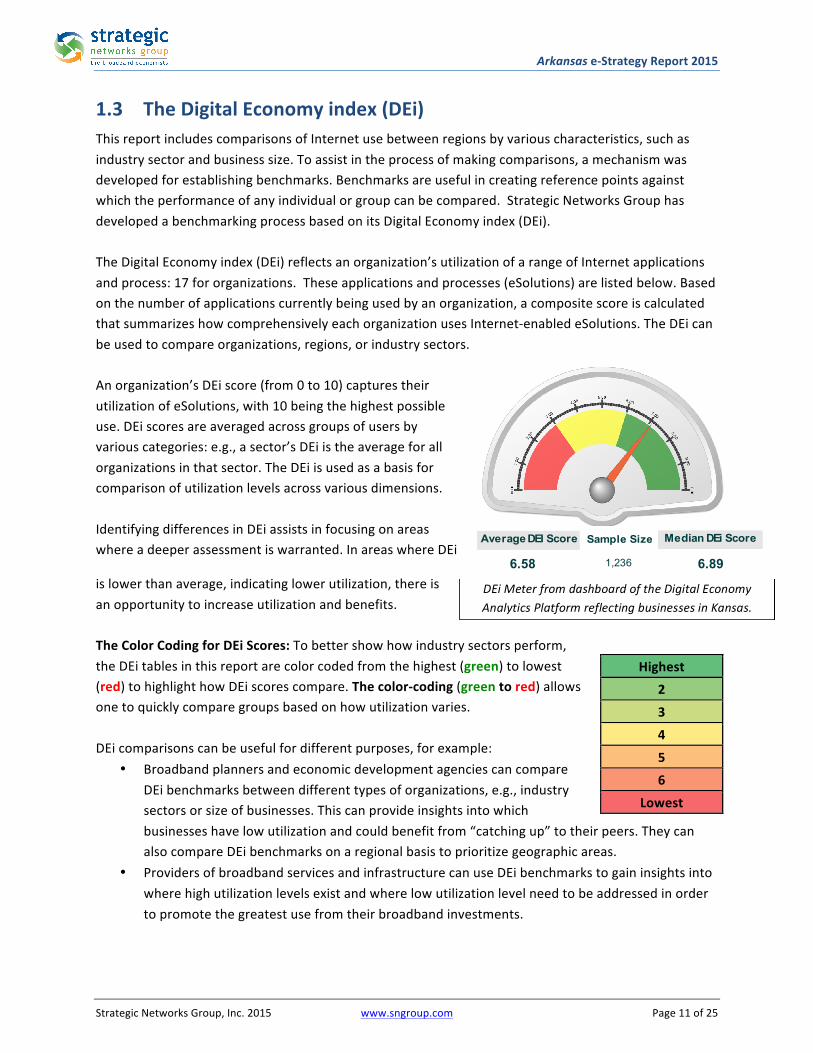
Arkansase-StrategyReport2015
StrategicNetworksGroup,Inc.2015 www.sngroup.com Page11of25
DEiMeterfromdashboardoftheDigitalEconomyAnalyticsPlatformreflectingbusinessesinKansas.
1.3 TheDigitalEconomyindex(DEi)ThisreportincludescomparisonsofInternetusebetweenregionsbyvariouscharacteristics,suchasindustrysectorandbusinesssize.Toassistintheprocessofmakingcomparisons,amechanismwasdevelopedforestablishingbenchmarks.Benchmarksareusefulincreatingreferencepointsagainstwhichtheperformanceofanyindividualorgroupcanbecompared.StrategicNetworksGrouphasdevelopedabenchmarkingprocessbasedonitsDigitalEconomyindex(DEi).TheDigitalEconomyindex(DEi)reflectsanorganization’sutilizationofarangeofInternetapplicationsandprocess:17fororganizations.Theseapplicationsandprocesses(eSolutions)arelistedbelow.Basedonthenumberofapplicationscurrentlybeingusedbyanorganization,acompositescoreiscalculatedthatsummarizeshowcomprehensivelyeachorganizationusesInternet-enabledeSolutions.TheDEicanbeusedtocompareorganizations,regions,orindustrysectors.
Anorganization’sDEiscore(from0to10)capturestheirutilizationofeSolutions,with10beingthehighestpossibleuse.DEiscoresareaveragedacrossgroupsofusersbyvariouscategories:e.g.,asector’sDEiistheaverageforallorganizationsinthatsector.TheDEiisusedasabasisforcomparisonofutilizationlevelsacrossvariousdimensions.IdentifyingdifferencesinDEiassistsinfocusingonareaswhereadeeperassessmentiswarranted.InareaswhereDEi
islowerthanaverage,indicatinglowerutilization,thereisanopportunitytoincreaseutilizationandbenefits.TheColorCodingforDEiScores:Tobettershowhowindustrysectorsperform,theDEitablesinthisreportarecolorcodedfromthehighest(green)tolowest(red)tohighlighthowDEiscorescompare.Thecolor-coding(greentored)allowsonetoquicklycomparegroupsbasedonhowutilizationvaries.DEicomparisonscanbeusefulfordifferentpurposes,forexample:
• BroadbandplannersandeconomicdevelopmentagenciescancompareDEibenchmarksbetweendifferenttypesoforganizations,e.g.,industrysectorsorsizeofbusinesses.Thiscanprovideinsightsintowhichbusinesseshavelowutilizationandcouldbenefitfrom“catchingup”totheirpeers.TheycanalsocompareDEibenchmarksonaregionalbasistoprioritizegeographicareas.
• ProvidersofbroadbandservicesandinfrastructurecanuseDEibenchmarkstogaininsightsintowherehighutilizationlevelsexistandwherelowutilizationlevelneedtobeaddressedinordertopromotethegreatestusefromtheirbroadbandinvestments.
Highest23456
Lowest
Average DEI Score Sample Size Median DEi Score
6.58 6.89 1,236
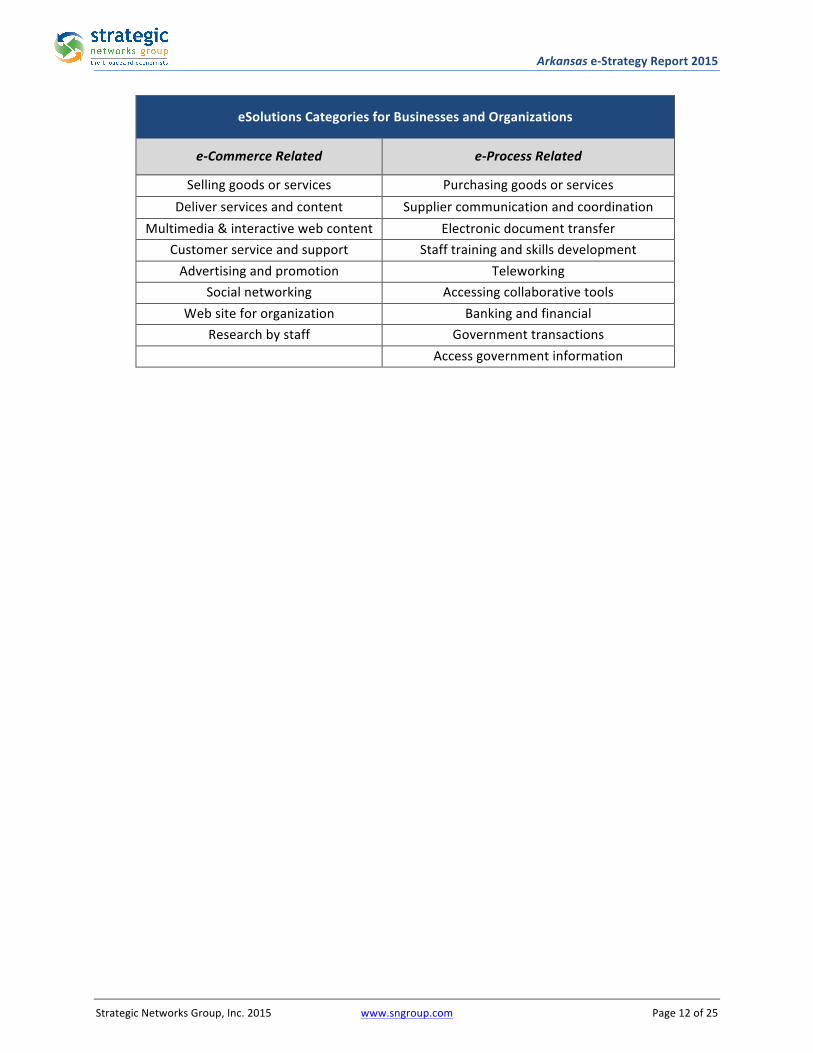
Arkansase-StrategyReport2015
StrategicNetworksGroup,Inc.2015 www.sngroup.com Page12of25
eSolutionsCategoriesforBusinessesandOrganizations
e-CommerceRelated e-ProcessRelated
Sellinggoodsorservices PurchasinggoodsorservicesDeliverservicesandcontent Suppliercommunicationandcoordination
Multimedia&interactivewebcontent ElectronicdocumenttransferCustomerserviceandsupport StafftrainingandskillsdevelopmentAdvertisingandpromotion Teleworking
Socialnetworking AccessingcollaborativetoolsWebsitefororganization Bankingandfinancial
Researchbystaff Governmenttransactions Accessgovernmentinformation
Arkansase-StrategyReport2015
StrategicNetworksGroup,Inc.2015 www.sngroup.com Page13of25
Recommendation#1:Eachcountyorcommunityshoulddevelopitsownstrategyandinitiativesbasedonitsowncharacteristics,values,andpriorities.Prioritiesandtargetsshouldincludeinfrastructurecoverageandcapabilities,aswellashighlevelsofadoptionofthoseeSolutionsneededtoremaincompetitive.
Recommendation#2:Undertakeeffortsatthelocalleveltoidentifyareaswithouthigh-speedInternetandtodeveloplocalsolutions.LocalandregionalinitiativesshouldencouragemobilewirelessInternetServiceProvidersandtelecommunicationscompaniestoextend4GandLTEcapabilitiestoareascurrentlywithoutsuchservice.
2. BroadbandUtilizationbyOrganizationsAmongbusinessesandnon-commercialorganizationsthereiswiderangeofutilizationofInternetinfrastructure.ThisreportexploreshowproductiveuseoftheInternetandesolutionsisrelatedtothesizeofacommunityorregion,andthetypesofindustrysectorsthatmakeupitseconomy.ThedatapresentedinthissectionshowhowtheeconomiccompositionofArkansasanditscommunitiesimpactsInternetuse,aswellastheabilitytobenefitfromthepotentialthattheInternetofferstocommunitiesandorganizations.TheassessmentofInternetutilizationreviewedinthisreportincludescommercialandnon-commercialorganizationsacrossallindustrysectorsandemploymentsizes.TounderstandwhycommunitiesandregionsdifferintheirInternetutilizationlevels,itisveryinstructivetoexplore:
1. Howutilizationvariesbyindustryandsector.2. Howemploymentsizeaffectsutilization.3. HowthedegreeofurbanizationwithineachregionisrelatedtoInternetutilization.4. TheInternetapplicationsandprocessesslowesttobeadopted.
Becauseeachcommunityandcountryisdistinctinimportantways,animportantstrategicdecisionistodevelopinitiativesatthelocalorregionallevel.Whilestategovernmentresourcescanplayanimportantroleandstatepoliciesandregulationsprovideacommonframework,initiativeshaveproventobemosteffectivewhendrivenbyanddesignbylocalandregionalstakeholders.
2.1.1 InternetConnectivity
Whilethisreportfocusesprimarilyonhowcommercialandnon-commercialorganizationsutilizetheInternettoderiveconcretebenefits,itisimpossibletoignoretheongoingimportanceofthequalityofthebroadbandinfrastructurethatorganizationshaveavailabletothem.AsnotedintheArkansaseSolutionsBenchmarkingReport,broadbandinfrastructureisoftendatedanddoesnotmeettherequirementsoforganizationsinthearea.CurrentlevelsofconnectivityfallwellshortoftheFCCdefinitionofbroadband.AsseeninFigure9laterinthisdocument,17.7%ofbusinessesidentifyinadequateInternetconnectivityasaveryimportantbarriertoimprovingtheirutilizationoftheInternet.
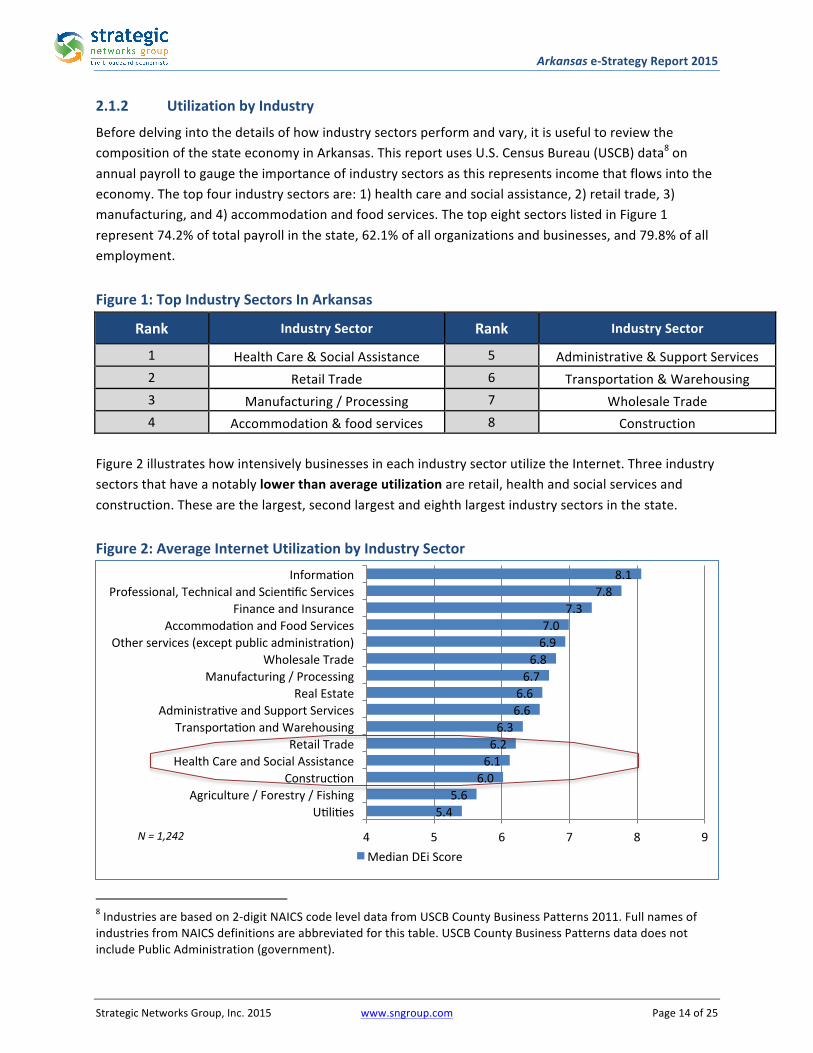
Arkansase-StrategyReport2015
StrategicNetworksGroup,Inc.2015 www.sngroup.com Page14of25
2.1.2 UtilizationbyIndustry
Beforedelvingintothedetailsofhowindustrysectorsperformandvary,itisusefultoreviewthecompositionofthestateeconomyinArkansas.ThisreportusesU.S.CensusBureau(USCB)data8onannualpayrolltogaugetheimportanceofindustrysectorsasthisrepresentsincomethatflowsintotheeconomy.Thetopfourindustrysectorsare:1)healthcareandsocialassistance,2)retailtrade,3)manufacturing,and4)accommodationandfoodservices.ThetopeightsectorslistedinFigure1represent74.2%oftotalpayrollinthestate,62.1%ofallorganizationsandbusinesses,and79.8%ofallemployment.Figure1:TopIndustrySectorsInArkansas
Rank IndustrySector Rank IndustrySector
1 HealthCare&SocialAssistance 5 Administrative&SupportServices2 RetailTrade 6 Transportation&Warehousing3 Manufacturing/Processing 7 WholesaleTrade4 Accommodation&foodservices 8 Construction
Figure2illustrateshowintensivelybusinessesineachindustrysectorutilizetheInternet.Threeindustrysectorsthathaveanotablylowerthanaverageutilizationareretail,healthandsocialservicesandconstruction.Thesearethelargest,secondlargestandeighthlargestindustrysectorsinthestate.Figure2:AverageInternetUtilizationbyIndustrySector
8Industriesarebasedon2-digitNAICScodeleveldatafromUSCBCountyBusinessPatterns2011.FullnamesofindustriesfromNAICSdefinitionsareabbreviatedforthistable.USCBCountyBusinessPatternsdatadoesnotincludePublicAdministration(government).
5.45.6
6.06.16.26.3
6.66.66.76.86.97.0
7.37.8
8.1
4 5 6 7 8 9
UllilesAgriculture/Forestry/Fishing
ConstruclonHealthCareandSocialAssistance
RetailTradeTransportalonandWarehousing
AdministralveandSupportServicesRealEstate
Manufacturing/ProcessingWholesaleTrade
Otherservices(exceptpublicadministralon)AccommodalonandFoodServices
FinanceandInsuranceProfessional,TechnicalandScienlficServices
Informalon
MedianDEiScore
N=1,242
Arkansase-StrategyReport2015
StrategicNetworksGroup,Inc.2015 www.sngroup.com Page15of25
Recommendation#3: Ratherthanundertakingbroadbutuntargetedefforts,broadbandinitiativesshouldfocusonindustriesthathavethehighesteconomiccontributionandhighestgrowthpotentialwithineachregion.Threesectorsthatshouldbegivenpriorityarethehealthandsocialservices,retail,andconstructionsectors.
2.1.3 DifferencesinUtilization:GapsandOpportunities
DifferencesinutilizationofInternetapplicationsandprocesses(referredtointhisreportaseSolutions)indicateareaswithpotentialforimprovement,givenwhatpeers(orcompetitors)aredoingwithinthesameindustrysector.AlowDEiscoresuggestsfirmswouldbenefitfromexploringwhicheSolutionsmightimproveperformance.InArkansas,someoftheindustrysectorsorgroupsexhibitlowlevelsofutilization.Addressinglowlevelsofutilizationshouldbeapriorityiffirmsaretocompeteoutsidetheirownregionalmarkets,orifthereislocalcompetitionfromoutsidefirms.Businessesandnon-commercialorganizationswithlowlevelsofutilizationwillbelesscompetitiveandproductiveiftheyareusingfewereSolutionsthanfirmsandorganizationselsewhere.However,theprocessofprioritizingbusinessorsectorsshouldalsoincludeassessingitspotentialforcreatingnewjobsandprotectingexistingjobs.Acompetitiveandproductivecompanyororganizationismorelikelytoretainexistingjobsandcreatenewjobs,especiallyinanexpandingindustry.
2.2 WhatContributestotheDifferentLevelsofUtilization?Anumberoffactorshelptoexplaindifferencesinutilizationbetweenorganizationsandbetweenregions.Locationofanorganizationinanon-metropolitanareaisonesuchfactor.Organizations(bothcommercialandnon-commercial)outsideofametropolitanareadonotbenefitfromadensenetworkofsupportsandskilledlaborpools.Consequently,asFigures4and5show,businesseslocatedoutsideofametropolitanarea9orinalessdenselypopulatedregionexperienceadistinctdisadvantage,withlowerlevelsofutilizationofeSolutions.Knowingwhichgeographyareasarelikelytohavethelowerutilizationallowsgovernmentsandindustryorganizationtotargettheirbroadbandinitiatives.
9AmetropolitanareaisdefinedbytheCensusBureauashavingacoreurbanareaofover50,000withapopulationdensitygreaterthan1,000peoplepersquaremile.AMicropolitanareahasapopulationof10,000to49,999.Asmalltownhasapopulationof2,500to9,999.Thecategoryof“isolatedsmalltown”includestheremainder.
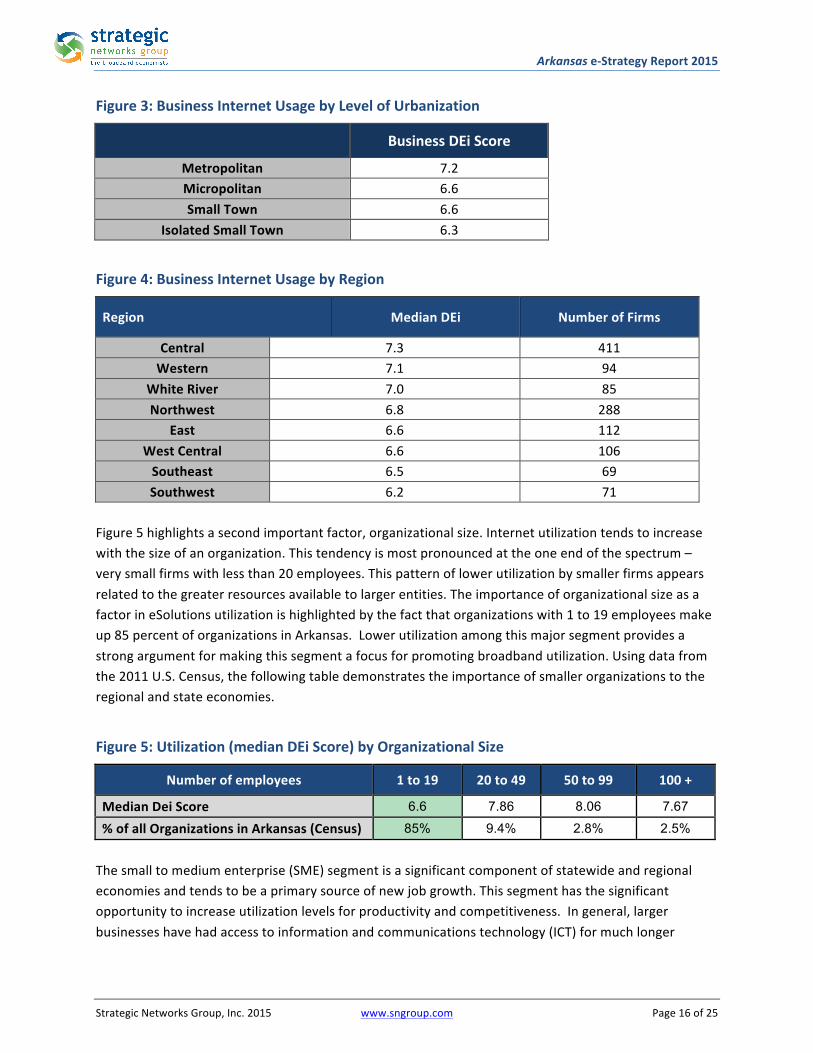
Arkansase-StrategyReport2015
StrategicNetworksGroup,Inc.2015 www.sngroup.com Page16of25
Figure3:BusinessInternetUsagebyLevelofUrbanization
BusinessDEiScore
Metropolitan 7.2 Micropolitan 6.6 SmallTown 6.6
IsolatedSmallTown 6.3
Figure4:BusinessInternetUsagebyRegion
Region MedianDEi NumberofFirms
Central 7.3 411Western 7.1 94
WhiteRiver 7.0 85Northwest 6.8 288
East 6.6 112WestCentral 6.6 106Southeast 6.5 69Southwest 6.2 71
Figure5highlightsasecondimportantfactor,organizationalsize.Internetutilizationtendstoincreasewiththesizeofanorganization.Thistendencyismostpronouncedattheoneendofthespectrum–verysmallfirmswithlessthan20employees.Thispatternoflowerutilizationbysmallerfirmsappearsrelatedtothegreaterresourcesavailabletolargerentities.TheimportanceoforganizationalsizeasafactorineSolutionsutilizationishighlightedbythefactthatorganizationswith1to19employeesmakeup85percentoforganizationsinArkansas.Lowerutilizationamongthismajorsegmentprovidesastrongargumentformakingthissegmentafocusforpromotingbroadbandutilization.Usingdatafromthe2011U.S.Census,thefollowingtabledemonstratestheimportanceofsmallerorganizationstotheregionalandstateeconomies.
Figure5:Utilization(medianDEiScore)byOrganizationalSize
Numberofemployees 1to19 20to49 50to99 100+
MedianDeiScore 6.6 7.86 8.06 7.67
%ofallOrganizationsinArkansas(Census) 85% 9.4% 2.8% 2.5% Thesmalltomediumenterprise(SME)segmentisasignificantcomponentofstatewideandregionaleconomiesandtendstobeaprimarysourceofnewjobgrowth.Thissegmenthasthesignificantopportunitytoincreaseutilizationlevelsforproductivityandcompetitiveness.Ingeneral,largerbusinesseshavehadaccesstoinformationandcommunicationstechnology(ICT)formuchlonger
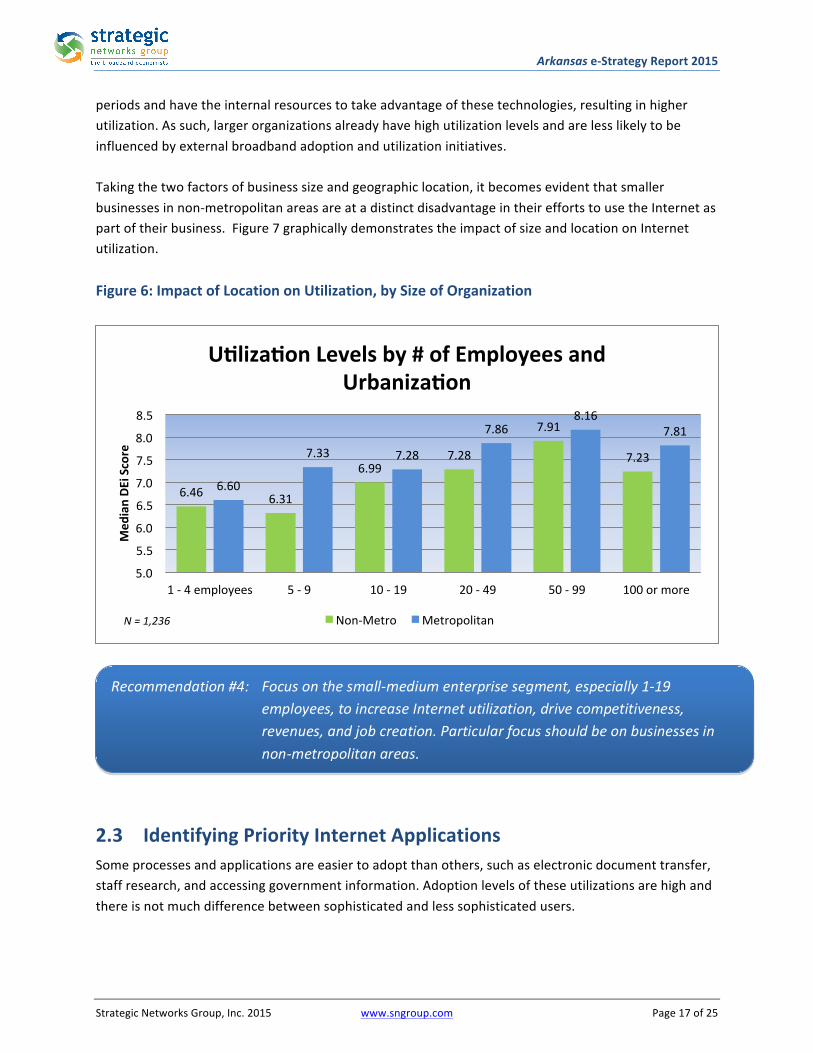
Arkansase-StrategyReport2015
StrategicNetworksGroup,Inc.2015 www.sngroup.com Page17of25
Recommendation#4: Focusonthesmall-mediumenterprisesegment,especially1-19employees,toincreaseInternetutilization,drivecompetitiveness,revenues,andjobcreation.Particularfocusshouldbeonbusinessesinnon-metropolitanareas.
periodsandhavetheinternalresourcestotakeadvantageofthesetechnologies,resultinginhigherutilization.Assuch,largerorganizationsalreadyhavehighutilizationlevelsandarelesslikelytobeinfluencedbyexternalbroadbandadoptionandutilizationinitiatives.Takingthetwofactorsofbusinesssizeandgeographiclocation,itbecomesevidentthatsmallerbusinessesinnon-metropolitanareasareatadistinctdisadvantageintheireffortstousetheInternetaspartoftheirbusiness.Figure7graphicallydemonstratestheimpactofsizeandlocationonInternetutilization.Figure6:ImpactofLocationonUtilization,bySizeofOrganization
2.3 IdentifyingPriorityInternetApplicationsSomeprocessesandapplicationsareeasiertoadoptthanothers,suchaselectronicdocumenttransfer,staffresearch,andaccessinggovernmentinformation.Adoptionlevelsoftheseutilizationsarehighandthereisnotmuchdifferencebetweensophisticatedandlesssophisticatedusers.
6.46 6.31
6.997.28
7.91
7.23
6.60
7.33 7.28
7.868.16
7.81
5.0
5.5
6.0
6.5
7.0
7.5
8.0
8.5
1-4employees 5-9 10-19 20-49 50-99 100ormore
Med
ianDE
iScore
UblizabonLevelsby#ofEmployeesandUrbanizabon
Non-Metro MetropolitanN=1,236
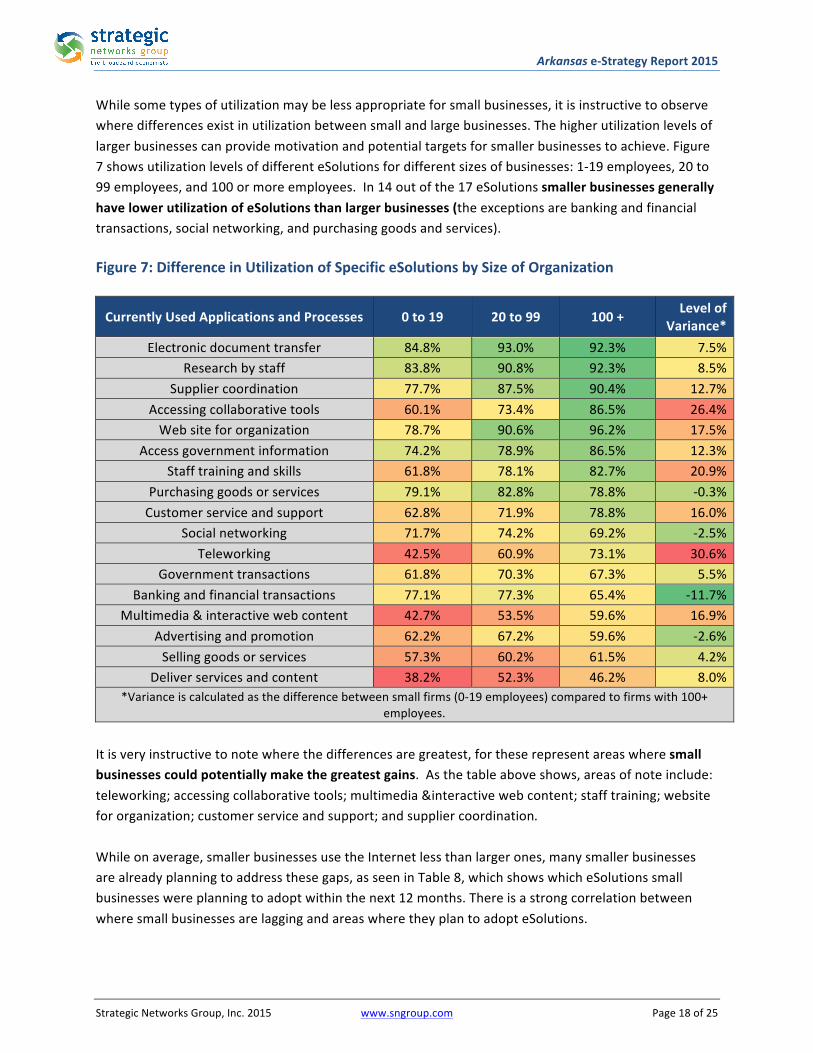
Arkansase-StrategyReport2015
StrategicNetworksGroup,Inc.2015 www.sngroup.com Page18of25
Whilesometypesofutilizationmaybelessappropriateforsmallbusinesses,itisinstructivetoobservewheredifferencesexistinutilizationbetweensmallandlargebusinesses.Thehigherutilizationlevelsoflargerbusinessescanprovidemotivationandpotentialtargetsforsmallerbusinessestoachieve.Figure7showsutilizationlevelsofdifferenteSolutionsfordifferentsizesofbusinesses:1-19employees,20to99employees,and100ormoreemployees.In14outofthe17eSolutionssmallerbusinessesgenerallyhavelowerutilizationofeSolutionsthanlargerbusinesses(theexceptionsarebankingandfinancialtransactions,socialnetworking,andpurchasinggoodsandservices).Figure7:DifferenceinUtilizationofSpecificeSolutionsbySizeofOrganization
CurrentlyUsedApplicationsandProcesses 0to19 20to99 100+ LevelofVariance*
Electronicdocumenttransfer 84.8% 93.0% 92.3% 7.5%Researchbystaff 83.8% 90.8% 92.3% 8.5%
Suppliercoordination 77.7% 87.5% 90.4% 12.7%Accessingcollaborativetools 60.1% 73.4% 86.5% 26.4%Websitefororganization 78.7% 90.6% 96.2% 17.5%
Accessgovernmentinformation 74.2% 78.9% 86.5% 12.3%Stafftrainingandskills 61.8% 78.1% 82.7% 20.9%
Purchasinggoodsorservices 79.1% 82.8% 78.8% -0.3%Customerserviceandsupport 62.8% 71.9% 78.8% 16.0%
Socialnetworking 71.7% 74.2% 69.2% -2.5%Teleworking 42.5% 60.9% 73.1% 30.6%
Governmenttransactions 61.8% 70.3% 67.3% 5.5%Bankingandfinancialtransactions 77.1% 77.3% 65.4% -11.7%
Multimedia&interactivewebcontent 42.7% 53.5% 59.6% 16.9%Advertisingandpromotion 62.2% 67.2% 59.6% -2.6%Sellinggoodsorservices 57.3% 60.2% 61.5% 4.2%
Deliverservicesandcontent 38.2% 52.3% 46.2% 8.0%*Varianceiscalculatedasthedifferencebetweensmallfirms(0-19employees)comparedtofirmswith100+
employees.Itisveryinstructivetonotewherethedifferencesaregreatest,fortheserepresentareaswheresmallbusinessescouldpotentiallymakethegreatestgains.Asthetableaboveshows,areasofnoteinclude:teleworking;accessingcollaborativetools;multimedia&interactivewebcontent;stafftraining;websitefororganization;customerserviceandsupport;andsuppliercoordination.Whileonaverage,smallerbusinessesusetheInternetlessthanlargerones,manysmallerbusinessesarealreadyplanningtoaddressthesegaps,asseeninTable8,whichshowswhicheSolutionssmallbusinesseswereplanningtoadoptwithinthenext12months.ThereisastrongcorrelationbetweenwheresmallbusinessesarelaggingandareaswheretheyplantoadopteSolutions.
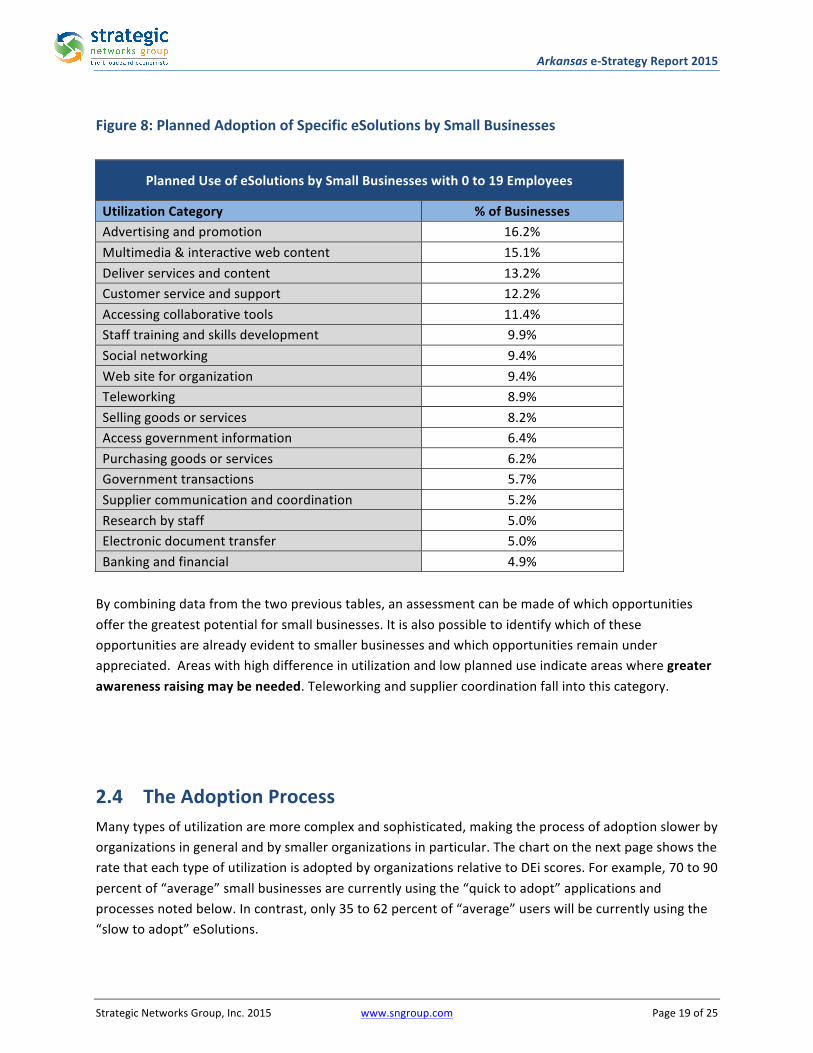
Arkansase-StrategyReport2015
StrategicNetworksGroup,Inc.2015 www.sngroup.com Page19of25
Figure8:PlannedAdoptionofSpecificeSolutionsbySmallBusinesses
PlannedUseofeSolutionsbySmallBusinesseswith0to19Employees
UtilizationCategory %ofBusinessesAdvertisingandpromotion 16.2%Multimedia&interactivewebcontent 15.1%Deliverservicesandcontent 13.2%Customerserviceandsupport 12.2%Accessingcollaborativetools 11.4%Stafftrainingandskillsdevelopment 9.9%Socialnetworking 9.4%Websitefororganization 9.4%Teleworking 8.9%Sellinggoodsorservices 8.2%Accessgovernmentinformation 6.4%Purchasinggoodsorservices 6.2%Governmenttransactions 5.7%Suppliercommunicationandcoordination 5.2%Researchbystaff 5.0%Electronicdocumenttransfer 5.0%Bankingandfinancial 4.9%Bycombiningdatafromthetwoprevioustables,anassessmentcanbemadeofwhichopportunitiesofferthegreatestpotentialforsmallbusinesses.Itisalsopossibletoidentifywhichoftheseopportunitiesarealreadyevidenttosmallerbusinessesandwhichopportunitiesremainunderappreciated.Areaswithhighdifferenceinutilizationandlowplanneduseindicateareaswheregreaterawarenessraisingmaybeneeded.Teleworkingandsuppliercoordinationfallintothiscategory.
2.4 TheAdoptionProcessManytypesofutilizationaremorecomplexandsophisticated,makingtheprocessofadoptionslowerbyorganizationsingeneralandbysmallerorganizationsinparticular.ThechartonthenextpageshowstheratethateachtypeofutilizationisadoptedbyorganizationsrelativetoDEiscores.Forexample,70to90percentof“average”smallbusinessesarecurrentlyusingthe“quicktoadopt”applicationsandprocessesnotedbelow.Incontrast,only35to62percentof“average”userswillbecurrentlyusingthe“slowtoadopt”eSolutions.
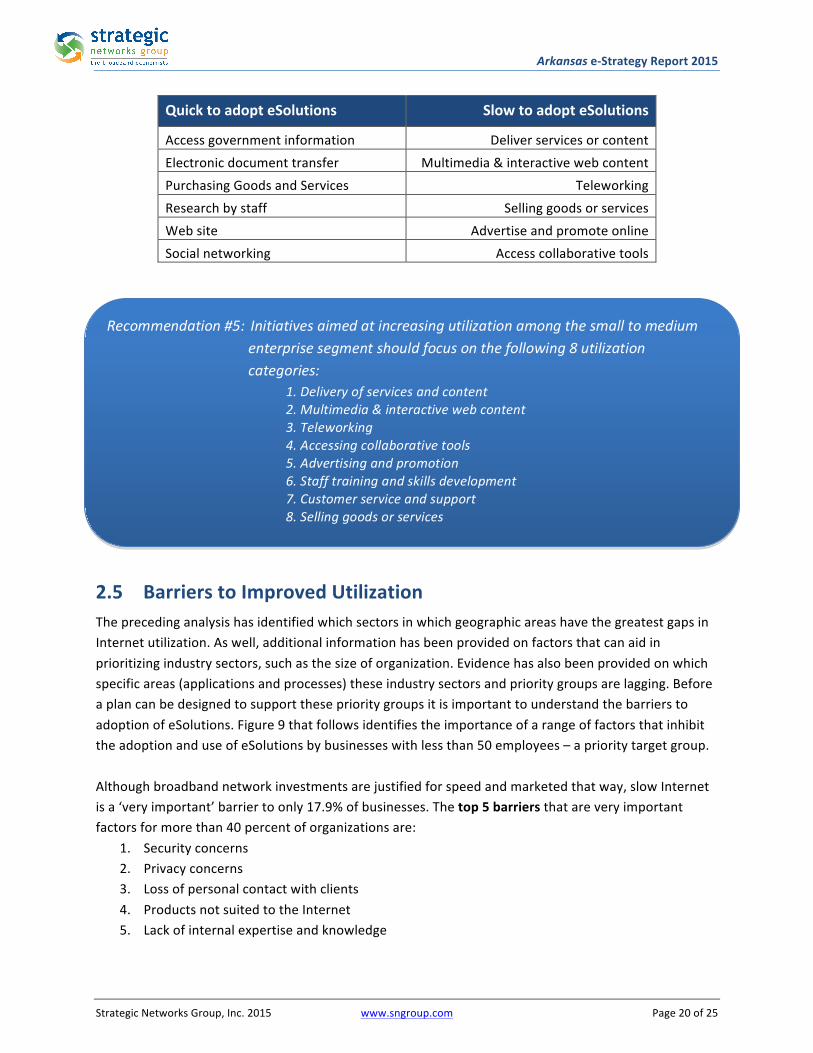
Arkansase-StrategyReport2015
StrategicNetworksGroup,Inc.2015 www.sngroup.com Page20of25
QuicktoadopteSolutions SlowtoadopteSolutions
Accessgovernmentinformation DeliverservicesorcontentElectronicdocumenttransfer Multimedia&interactivewebcontentPurchasingGoodsandServices TeleworkingResearchbystaff SellinggoodsorservicesWebsite AdvertiseandpromoteonlineSocialnetworking Accesscollaborativetools
2.5 BarrierstoImprovedUtilizationTheprecedinganalysishasidentifiedwhichsectorsinwhichgeographicareashavethegreatestgapsinInternetutilization.Aswell,additionalinformationhasbeenprovidedonfactorsthatcanaidinprioritizingindustrysectors,suchasthesizeoforganization.Evidencehasalsobeenprovidedonwhichspecificareas(applicationsandprocesses)theseindustrysectorsandprioritygroupsarelagging.BeforeaplancanbedesignedtosupporttheseprioritygroupsitisimportanttounderstandthebarrierstoadoptionofeSolutions.Figure9thatfollowsidentifiestheimportanceofarangeoffactorsthatinhibittheadoptionanduseofeSolutionsbybusinesseswithlessthan50employees–aprioritytargetgroup.Althoughbroadbandnetworkinvestmentsarejustifiedforspeedandmarketedthatway,slowInternetisa‘veryimportant’barriertoonly17.9%ofbusinesses.Thetop5barriersthatareveryimportantfactorsformorethan40percentoforganizationsare:
1. Securityconcerns2. Privacyconcerns3. Lossofpersonalcontactwithclients4. ProductsnotsuitedtotheInternet5. Lackofinternalexpertiseandknowledge
Recommendation#5:Initiativesaimedatincreasingutilizationamongthesmalltomediumenterprisesegmentshouldfocusonthefollowing8utilizationcategories:
1.Deliveryofservicesandcontent2.Multimedia&interactivewebcontent3.Teleworking4.Accessingcollaborativetools5.Advertisingandpromotion6.Stafftrainingandskillsdevelopment7.Customerserviceandsupport8.Sellinggoodsorservices
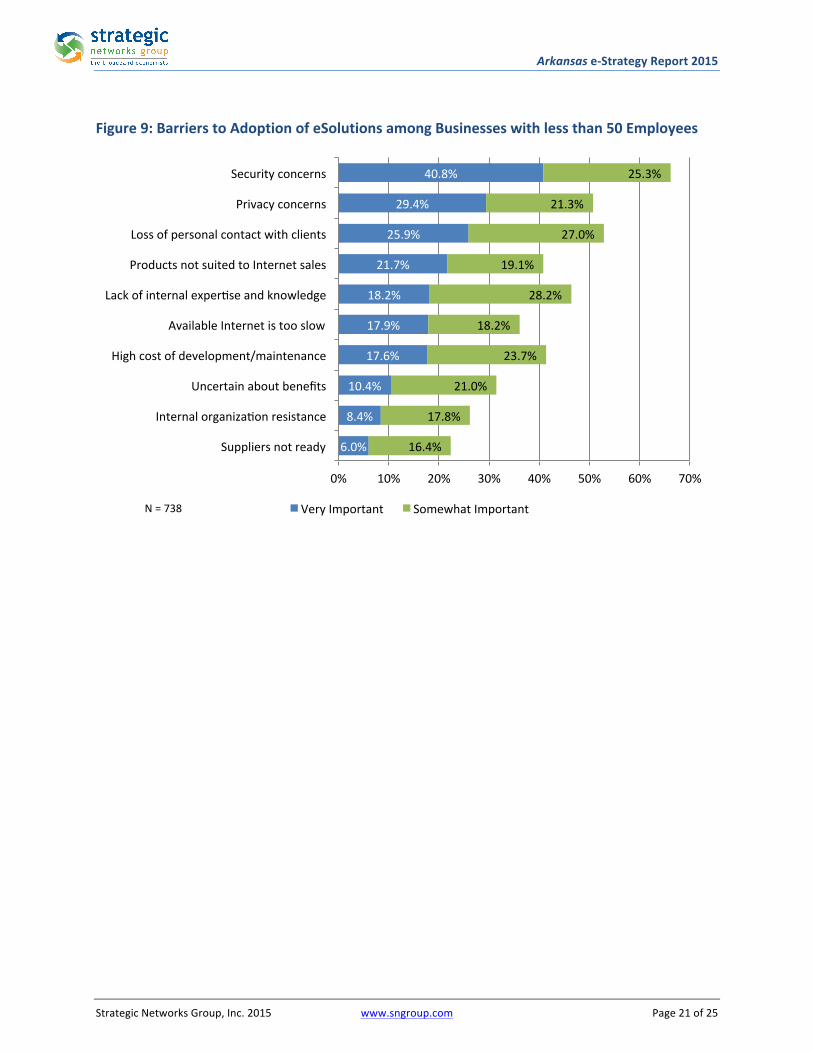
Arkansase-StrategyReport2015
StrategicNetworksGroup,Inc.2015 www.sngroup.com Page21of25
Figure9:BarrierstoAdoptionofeSolutionsamongBusinesseswithlessthan50Employees
6.0%
8.4%
10.4%
17.6%
17.9%
18.2%
21.7%
25.9%
29.4%
40.8%
16.4%
17.8%
21.0%
23.7%
18.2%
28.2%
19.1%
27.0%
21.3%
25.3%
0% 10% 20% 30% 40% 50% 60% 70%
Suppliersnotready
Internalorganizalonresistance
Uncertainaboutbenefits
Highcostofdevelopment/maintenance
AvailableInternetistooslow
Lackofinternalexperlseandknowledge
ProductsnotsuitedtoInternetsales
Lossofpersonalcontactwithclients
Privacyconcerns
Securityconcerns
VeryImportant SomewhatImportantN=738
Arkansase-StrategyReport2015
StrategicNetworksGroup,Inc.2015 www.sngroup.com Page22of25
3. SummaryandNextStepsThisreportanalyzeshoworganizationsinArkansasutilizebroadband.Itconsidersdifferentindustrysectors,organizationalsizeandregionaldifferences.Italsoconsiderswhatkindsofactionswillimprovetheirperformanceandhowtheycouldbenefitfurtherfrombroadband.Theobjectiveofbenchmarkingutilizationofesolutions(Internet-enabledapplications)istoprovide“actionableintelligence”togovernments,stakeholders,andindividualsongaps,barriersandopportunitiesforgrowth.TakingactionontherecommendationsincludedinthisreportwillenableArkansastomovetowardstherealizationoffurtherbenefitsfrombroadband.However,thestrategicframeworkpresentedinthisdocumentreliesoncommunitiesandregionalentitiestoprovideinitiativeinaddressingthedigitaldivideintheirarea.Innon-metropolitanareas,lackofcapacityandleadershiphasthepotentialtolimittheeffectivenessofacommunity-basedapproach.Consequently,astrategicobjectiveforadequatebroadbandserviceisthedevelopmentofmotivatedleadershipandinstitutionalcapacityforbroadbandinitiatives.10.“Localchampions”areacriticalcomponentforthesuccessofbroadbandinitiatives.ItisincreasinglyrareforlocalgovernmentleaderstobeunawareoruninterestedinthedesirabilityofhavinggoodInternetaccessthroughouttheirjurisdiction.However,interestandawarenesshasfrequentlynottranslatedintoactionincommunitieswherefinancialresourcesareconstrained,technicalknowledgeismissing,andleadershipisinshortsupply
10Thecommentsinthissectionregardingpossiblelackofcapacityinnon-metropolitanareasandtheimportanceofleadershiparebasedonSNG’sexperienceinbroadbandplanninginruralareasacrosstheUSandCanada.Recognitionoftheseissuescanalsobefoundinbroadbandplanningreportsfromanumberofstates,includingVirginia,KentuckyandNorthCarolinawhereSNGhasworked.Aparticularlywell-articulatedstatementcomesfromastateleaderinVirginia:“OnecommoncharacteristicofallVirginia’scurrentbroadbandprojectsisthepresenceofstrong,dedicatedleadership(individualand/orcommittee)whounderstandthebroadbandimperativeandarewillingtocommittime,energyandscarceresourcestoinsurethattheircommunityisnotleftbehind.”AsquotedinCommunityBroadbandPlanningStrategies,developedfortheCenterforInnovativeTechnologybyStrategicNetworksGroup,January2013,page5.
Recommendation#6:communitiesandcountiesshouldfacilitatebroadbandleadership.Importantelementsofleadershipandcapacitydevelopmentatthecommunitylevelinclude:
• Recruitmentofindividualswiththeinterest,energy,andtimeneededtoprovideleadership.• Empowermentofleadersbyprovidingofficialsanctionandsupportfromelectedofficialsand
keycommunityorganizations.• Amechanismforaccountabilityforleadersbacktoorganizationsprovidingsupportand
sanction.• Educationalandlearningopportunitiesforleadershipsotheycanacquiretheknowledgeand
skillsfordevelopinggoals,actionsandtasksrelatedtothedigitaldivideintheirarea.• Institutionalsupportfromorganizationswiththecapacityfororganizingmeetings,ensuring
effectivecommunications,andprovidinglogisticalsupport.
Appendix1:Glossarye-StrategyReport:ThisreportexamineshoworganizationsinArkansasdifferintheirutilizationofbroadbandandwheretheycanlooktomakeimprovements.Thereportshowsindetailhowdifferentindustrysectorsandorganizationaltypescomparetoeachother,especiallybetweenandwithinregions.Thereportprovidesinsightsandhardevidencethatallowsregionsandorganizationstoassesswheretheystand.ThereportprovidesrecommendationsonstrategiesforimprovingtheirInternetperformanceandbenefits.eSolutionsBenchmarkingTechnicalReport:Thisreportpresentstheresultsofsurvey-basedresearchcarriedoutfortheStateofArkansas.Thesurveyscollectedinformationfrombusinessesandorganizationsontheavailabilityofbroadband(highspeedInternetaccess)anditsuses,benefits,driversandbarriers.Thislargelydescriptivereportresultsprovideinsightintogapsandopportunitiesforincreasingbroadbandutilizationbyorganizations.Thepolicy,planningandprogramimplicationsforArkansasanditsregionsaredealtwithinaseparatereport:theArkansase-StrategyReport.DigitalEconomyAnalysisPlatform(DEAP):TheDEAPhasbeendevelopedasanonlineresourcethatprovidesclientswithaccesstothedatacollectionresultsandtheabilitytocustomizetheiranalysisacrossarangeofvariables,includingindustrysectororgeographicregion.TheDEAPisaccessedonlinebyauthorizedusers.Usersarepresentedwithdashboards.Eachdashboardisorganizedaroundaseriesofpagesfocusedonspecifictopics,e.g.Connectivity,Utilization,DEi,Impacts,etc.Withineachpageisasetofpredefinedreportsthatpresentachartand/ortableofprocessedresultsfromthedatasets.eStrategies:e-StrategiesarehighlevelplansforachievingoneormoregoalsrelatedtoimprovedaccesstoandutilizationofbroadbandInternet.eStrategiesdefineacourseofactionthatismostlikelytosuccessfuladdressopportunities,challengesorbarriersrelated.Strategiesareusuallyseenasdistinctfromdetailedactionplanswhichdealwithspecificissuesof“who,what,whenandhow”.eSolutions:referstotheintegrationofInternettechnologieswiththeinternalcomputer-basedsystemsandapplicationswithinoramongorganizationsforavarietyofoperationalprocesses.eSolutionsencompassnotonlyproductdeliveryandpaymenttransactions(e-commerce)butalsoallprocessesthatmaybefacilitatedbycomputer-mediatedcommunicationsovertheInternet.e-Process:usesoftheInternetwhichincludeinternaloperationaluses,suchassuppliercoordination,trainingandteleworking.e-Commerce:usesoftheInternetwhichincludeactivitiesrelatedtothesales,marketinganddeliveryofproductsandservices;and,ArkansasDigitalEconomyIndex(DEi):TheDigitalEconomyindex(DEi)ispartofthebenchmarkingprocessandprovidesreferencepointsagainstwhichtheperformanceofanyindividualorgroupcanbecompared.TheDEisummarizesanorganization’sutilizationofarangeof17Internetapplicationsandprocess.Basedonthenumberofapplicationscurrentlybeingusedbyanorganization,acompositescoreiscalculatedthatsummarizeshowcomprehensivelyeachorganizationusesInternet-enabledeSolutions.TheDEicanbeusedtocompareorganizations,regions,orindustrysectors.Utilizationreferstothethirdstageinthebroadbanddevelopmentprocess.Thefirststageisprovidingacommunity,householdororganizationwithaccess(availability)totheInternet.Thesecondstageisadoption
Arkansase-StrategyReport2015
StrategicNetworksGroup,Inc.2015 www.sngroup.com Page24of25
ortheprocesswherebyapersonororganizationstartstoactuallyusetheInternet.ThethirdstageisutilizationwherebyapersonororganizationusestheirInternetconnectiontocreatevalue.ManypeopleandorganizationshaveaccessandhaveadoptedtheInternet,butarerelativelyineffectiveinhowtheyuseandderivebenefitsfromtheInternet.Thefieldofanalysislabeled“utilization”explorespatternsofInternetuseandhowthesepatternscanbeenhanced.

Arkansase-StrategyReport2015
StrategicNetworksGroup,Inc.2015 www.sngroup.com Page25of25