Arkansas Cancer Facts & Figures · Gigi White, CTR, Program Director, Arkansas . Central Cancer...
44
Arkansas Cancer Facts & Figures 1997-2005
Transcript of Arkansas Cancer Facts & Figures · Gigi White, CTR, Program Director, Arkansas . Central Cancer...

Arkansas Cancer
Facts & Figures
1997-2005

Ark
ansa
s C
ance
r Fac
ts &
Fig
ures
1
Arkansas Cancer Facts & Figures, 1997-2005March 2009Published ByArkansas Central Cancer RegistryArkansas Department of Health
Report Prepared by:Appathurai Balamurugan MD, MPHSection Chief, Chronic Disease Epidemiology Section, Arkansas Department of Health Assistant Professor, Department of Epidemiology,UAMS Fay W. Boozman College of Public Health
Contributors and Reviewers:
Gordon Reeve, PhD, Branch Chief, Epidemiology Branch
John Senner, PhD, Branch Chief, Health Statistics Branch
Gina Redford, MAP, Agency Program Coordinator, Health Statistics Branch
LaTonya Bynum, BS, Senior Programmer/Analyst, Health Statistics Branch
Gigi White, CTR, Program Director, Arkansas Central Cancer Registry
Chris Fisher, BS, Systems Programmer, Arkansas Central Cancer Registry
Barbara Hager, MPH, Section Chief, Comprehensive Cancer Section
Rupa Sharma, MSPH, Senior Epidemiologist, Chronic Disease Epidemiology Section
Wanda Simon, MS, Senior Epidemiologist, Chronic Disease Epidemiology Section
Cornelya Dorbin, MPA, Executive Director, Arkansas Cancer Coalition
Report Design and LayoutHealth Communications & Marketing
This publication was supported by Grant/Cooperative Agreement Number 1U58DP000828 from the Centers for Disease Control and Prevention, its contents are solely the responsibility of the authors and do not necessarily represent the official views of the Centers for Disease Control and Prevention.
Thank you to the American Cancer Society for their long standing annual publication Cancer Facts and Figures. Arkansas patterned this state report after their publication.
Table of Contents
Executive Summary 2
Introduction 3
Chapter 1: All Cancer Sites 4
Chapter 2: Lung Cancer 6
Chapter 3: Prostate Cancer 11
Chapter 4: Female Breast Cancer 16
Chapter 5: Colorectal Cancer 22
Chapter 6: Ovarian Cancer 27
Chapter 7: Cervical Cancer 32
References 37
Tables 38, 39
Glossary 40
Arkansas Demographics 41

Ark
ansa
s C
ance
r Fac
ts &
Fig
ures
2
Executive SummaryThe Arkansas Central Cancer Registry (ACCR) is a population-based registry whose goal is to collect timely and complete data on all cancer cases diagnosed in the state. ACCR data are used to identify populations at increased risk of cancer, investigate public concerns of suspected excess of cancer due to environmental or other factors, and monitor trends in cancer incidence and mortality so that appropriate and timely interventions are undertaken.
The Arkansas Cancer Facts & Figures report is intended to describe the burden of cancer in the state for Arkansas Cancer Coalition members, policy makers, researchers and other interested parties. This information will provide assistance in prioritizing interventions. The report describes the invasive cancers in Arkansas in terms of new cancer cases and deaths due to cancer for the period 1997 through 2005. For female breast cancer, the data includes both invasive and in situ cancers.
Key Findings from This Report
Cancer is the second leading cause of death in Arkansas and in the United States. •
Cancer is expected to exceed heart disease as the world’s top killer by 2010.•
Approximately 14,840 Arkansans were estimated to be diagnosed with cancer, and 6,350 to die due to cancer • in Arkansas in 2008.
The age-adjusted mortality rates of all cancers in Arkansas have been at or above the national average during • the period 1997-2005.
The age-adjusted incidence rates of all cancers in Arkansas have been at or below the national average • during the period 1997-2005.
Lung cancer remains the leading cause of death due to cancers among men and women in Arkansas and the • United States.
Prostate and breast cancers remain the number one cancer diagnoses among men and women respectively • in Arkansas and the United States.
Lifestyle factors such as cigarette smoking, consumption of foods with high fat and physical inactivity remain • as major risk factors for many cancers.
Exec
utiv
e Su
mm
ary

Ark
ansa
s C
ance
r Fac
ts &
Fig
ures
3
Intr
oduc
tion
IntroductionCancer is a term used for diseases in which abnormal cells divide without control and invade other tissues and parts of the body. The many types of cancers have different causes, population distributions, courses of illness and responses to treatment and survival. Cancer is the second leading cause of death in Arkansas and in the United States. According to the World Health Organization, cancer is expected to surpass heart disease as the world’s top killer by 2010.
Cancer Estimates 1
An alarming 1,437,180 new cancer cases were estimated to be diagnosed and 565,650 people were estimated to die due to cancer in the United States in 2008. Approximately 14,840 Arkansans were estimated to be diagnosed with cancer, and 6,350 to die due to cancer in Arkansas in 2008. The reporting of cancer incidence and mortality data for 2008 has not been completed.
Signs & Symptoms 2
The signs and symptoms vary by the type of cancer. Some of the possible signs include:
New thickening or lump in the breast or any other • part of the bodyNew mole or obvious change in the appearance of • an existing moleA sore that does not heal• Nagging cough or hoarseness• Changes in bowel or bladder habits• Persistent indigestion or difficulty swallowing• Unexplained changes in weight• Unusual bleeding or discharge•
Risk Factors 2
The median age at diagnosis3 and risk factors for cancer vary by the type of cancer. However, some of the common risk factors are:
Lifestyle factors such as cigarette smoking, • consumption of foods with high fat and physical inactivityExposure to certain chemicals or radiation• Excessive exposure to harmful rays of the sun•
Prevention & Early Detection 4
Prevention would be the key for certain types of cancer. Avoidance of risk factors could reduce the risk of developing other types of cancers. Early detection of certain cancers may save lives.

Ark
ansa
s C
ance
r Fac
ts &
Fig
ures
4
Cha
pter
1: A
ll C
ance
r Site
s
Chapter 1: All Cancer SitesMortality
For the period 1997 through 2005, there were 55,262 Arkansas deaths due to all cancers • this translates to approximately 6,140 deaths per year. The age-adjusted mortality rates of all cancers in Arkansas have been at or above the national average during the same period
(Figure 1.1).
Incidence
For the period 1997 through 2005, there were 116,758 newly diagnosed cases of all cancers, • this translates to approximately 12,973 cases per year in Arkansas. The age-adjusted incidence rate of all cancers in Arkansas has been at or below the national average during the same period (Figure 1.2).

Ark
ansa
s C
ance
r Fac
ts &
Fig
ures
5

Ark
ansa
s C
ance
r Fac
ts &
Fig
ures
6
Cha
pter
2: L
ung
Can
cer
Chapter 2: Lung CancerApproximately 2,640 Arkansans were estimated to be diagnosed with lung cancer, and 2,210 to die due to lung cancer in Arkansas in 2008.1
Signs & Symptoms 2
The median age at diagnosis for lung cancer was 71 years of age.3 Common signs and symptoms are:
Lung cancer at its early stage does not cause any • symptoms. As the cancer progresses, the common symptoms • include: persistent cough, shortness of breath, constant chest pain, coughing up blood, frequent lung infection such as pneumonia, hoarse voice, weight loss and feeling tired.
Risk Factors 2
Tobacco use is a major risk factor for lung cancer. • Secondhand smoke exposure also increases the risk.Radon is a radioactive gas that can accumulate in • buildings and mines and can increase the risk.Asbestos exposure. • Family history of lung cancer.• Environmental exposure to certain metals like • chromium, cadmium and arsenic.
Prevention & Early Detection 4
The U.S. Preventive Services Task Force • concludes that the evidence is insufficient to recommend for or against screening asymptomatic persons for lung cancer with low dose computerized tomography, chest x-ray, sputum examination or a combination of these tests.Not smoking is the best way to prevent lung • cancer. Smoking cessation, avoiding exposure to secondhand smoke and certain metals that increase the risk are some strategies to prevent lung cancer.
Treatment & Survival 2
Most common treatment methods include surgery, • radiation therapy, chemotherapy and targeted therapy.The overall 5-year survival rate was 15.2%.•

Ark
ansa
s C
ance
r Fac
ts &
Fig
ures
7
Arkansas Facts & FiguresMortality
For the period 1997 through 2005, there were 18,306 deaths due to lung cancer; this translates to • approximately 2,034 deaths per year in Arkansas. The age-adjusted mortality rates of lung cancer in Arkansas have been above the national • average, during the same period (Figure 2.1).
The age-adjusted mortality rate of lung cancer was significantly higher among males compared to • females (Figure 2.2).

Ark
ansa
s C
ance
r Fac
ts &
Fig
ures
8
Incidence
For the period 1997 through 2005, there were 21,506 newly diagnosed cases of lung cancer; • this translates to approximately 2,389 cases per year in Arkansas. The age-adjusted incidence rates of lung cancer in Arkansas have been above the national • average during the same period (Figure 2.3).
The age-adjusted incidence rate of lung cancer was significantly higher among males compared to • females (Figure 2.4).

Ark
ansa
s C
ance
r Fac
ts &
Fig
ures
9
Stage at Diagnosis
Only 18% percent of Arkansans diagnosed with lung cancer were diagnosed at the localized • stage, 25% were diagnosed at a regional stage and 49% were diagnosed at a distant stage (Figure 2.5).

Ark
ansa
s C
ance
r Fac
ts &
Fig
ures
10

Ark
ansa
s C
ance
r Fac
ts &
Fig
ures
11
Cha
pter
3: P
rost
ate
Can
cer
Chapter 3: Prostate CancerApproximately 1,980 men were estimated to be diagnosed with prostate cancer and 360 men to die due to prostate cancer in Arkansas in 2008.1
Signs & Symptoms 2
The median age at diagnosis for prostate cancer was 68 years of age.3 Common signs and symptoms are:
Men with prostate cancer may not have any • symptoms. For men who present with symptoms, the common • symptoms are: weak or interrupted urine flow, difficulty in starting and stopping the urine flow, pain or burning during urination, difficulty having an erection and frequent pain in lower back or thigh.
Risk Factors 2
Age over 65 years.• Family history of prostate cancer.• African Americans are at increased risk of developing • prostate cancer compared to other racial groups.Certain prostate changes like prostate intraepithelial • neoplasia.Certain genome changes in men increase the risk.•
Prevention & Early Detection 4
The prostate-specific antigen (PSA) blood test and • digital rectal exam (DRE) are common screening methods for prostate cancer. The US Preventive Services Task Force (USPSTF) concludes that the current evidence is insufficient to assess the balance of benefits and harms of prostate cancer screening in men younger than age 75 years.The USPSTF recommends against screening for • prostate cancer in men age 75 years or older.
Treatment & Survival 2
Most common treatment methods included watchful • waiting, some type of surgery (i.e. prostatectomy), radiation therapy, chemotherapy, and hormonal therapy.The overall 5-year survival rate was 98.9%.•

Ark
ansa
s C
ance
r Fac
ts &
Fig
ures
12
Arkansas Facts & FiguresMortality
For the period 1997 through 2005, there were 3,110 deaths due to prostate cancer, this • translates to approximately 345 deaths per year in Arkansas. The age-adjusted mortality rates of prostate cancer in Arkansas have been at or above the • national average during the same period (Figure 3.1).
The age-adjusted mortality rate of prostate cancer was significantly higher among blacks • compared to whites. The mortality rate also increased with age (Figure 3.2)

Ark
ansa
s C
ance
r Fac
ts &
Fig
ures
13
Incidence
For the period 1997 through 2005, there were 17,822 newly diagnosed cases of prostate cancer, • this translates to approximately 1,980 cases per year in Arkansas. The age-adjusted incidence rates of prostate cancer in Arkansas have been at or below the • national average for the period 1997-2004. In 2005, the incidence rate in Arkansas was higher than the national average (Figure 3.3).
The age-adjusted incidence rate of prostate cancer was significantly higher among blacks • compared to whites. The incidence rate also increased with age (Figure 3.4).

Ark
ansa
s C
ance
r Fac
ts &
Fig
ures
14
Stage at Diagnosis
Eighty-three percent of Arkansans diagnosed with prostate cancer were diagnosed at a localized • stage, 9% were diagnosed at a regional stage and 4% were diagnosed at a distant stage (Figure 3.5).

Ark
ansa
s C
ance
r Fac
ts &
Fig
ures
15

Ark
ansa
s C
ance
r Fac
ts &
Fig
ures
16
Cha
pter
4: F
emal
e B
reas
t Can
cer
(Inva
sive
and
In s
itu)
Chapter 4: Female Breast Cancer (Invasive and In situ)Approximately 1,790 women were estimated to be diagnosed with breast cancer and 410 women to die due to breast cancer in Arkansas in 2008.1
Signs & Symptoms 2
The median age at diagnosis for breast cancer was 61 years of age.3 Common signs and symptoms are:
Painless mass/lump in breast, nipple retraction or tenderness, nipple discharge, skin dimpling and other skin • changes. The earliest sign could be an abnormality that appears on a mammogram or is felt either by the individual • through self-breast exam or by a clinical breast exam.
Risk Factors 2
Age – The risk of breast cancer increases with age.• Family history of breast cancer.• Certain breast changes like atypical hyperplasia increases the risk.• Gene changes (BRCA1, BRCA2) increase the risk.• Other risk factors are early menarche, late menopause, oral contraceptive use, postmenopausal estrogen • replacement, nulliparity (no children) dietary factors such as increased fat intake can increase the risk.
Prevention & Early Detection 4
The US Preventive Services Task Force recommends that women aged 40 years and older should receive • screening mammography, with or without clinical breast examination, every 1-2 years.Early detection via mammography and clinical breast exams has been shown to reduce mortality from breast • cancer.
Treatment & Survival 2
Most common treatment methods were some type of surgery (i.e. lumpectomy, mastectomy), radiation therapy, • chemotherapy, hormonal therapy or biological therapy.The overall 5-year survival rate was 88.7%•
Ark
ansa
s C
ance
r Fac
ts &
Fig
ures
17
Cha
pter
4: F
emal
e B
reas
t Can
cer
(Inva
sive
and
In s
itu)
Arkansas Facts & Figures
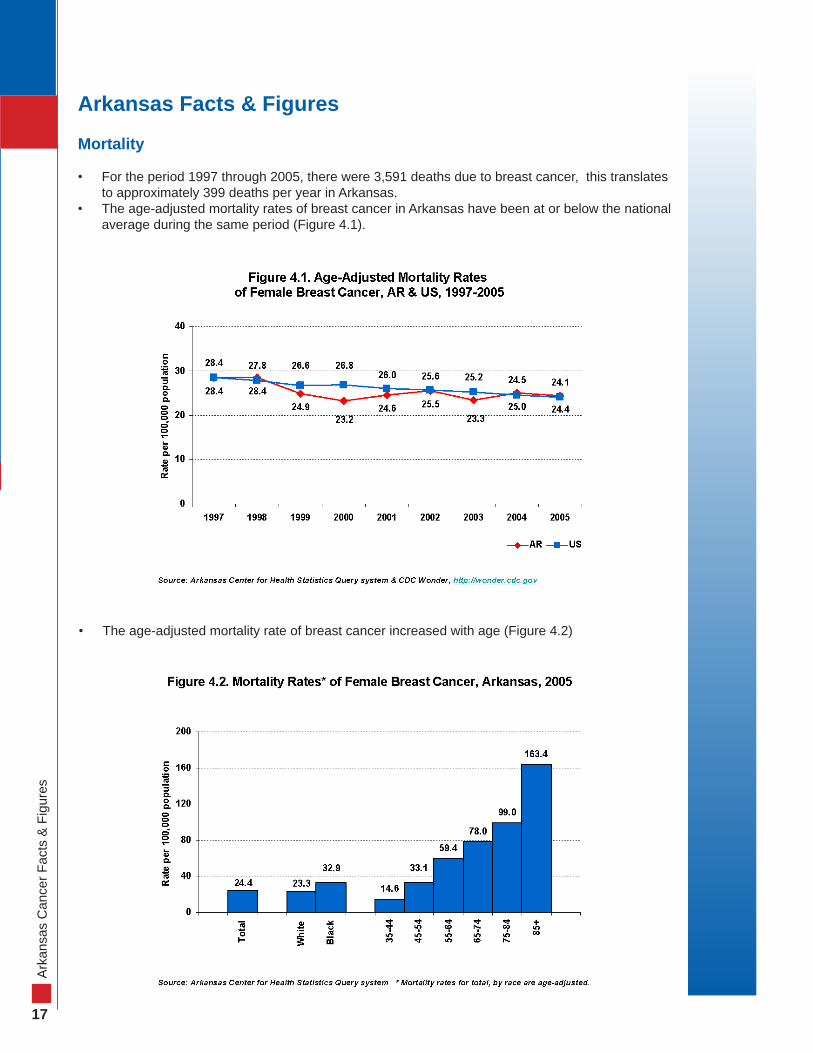
Mortality
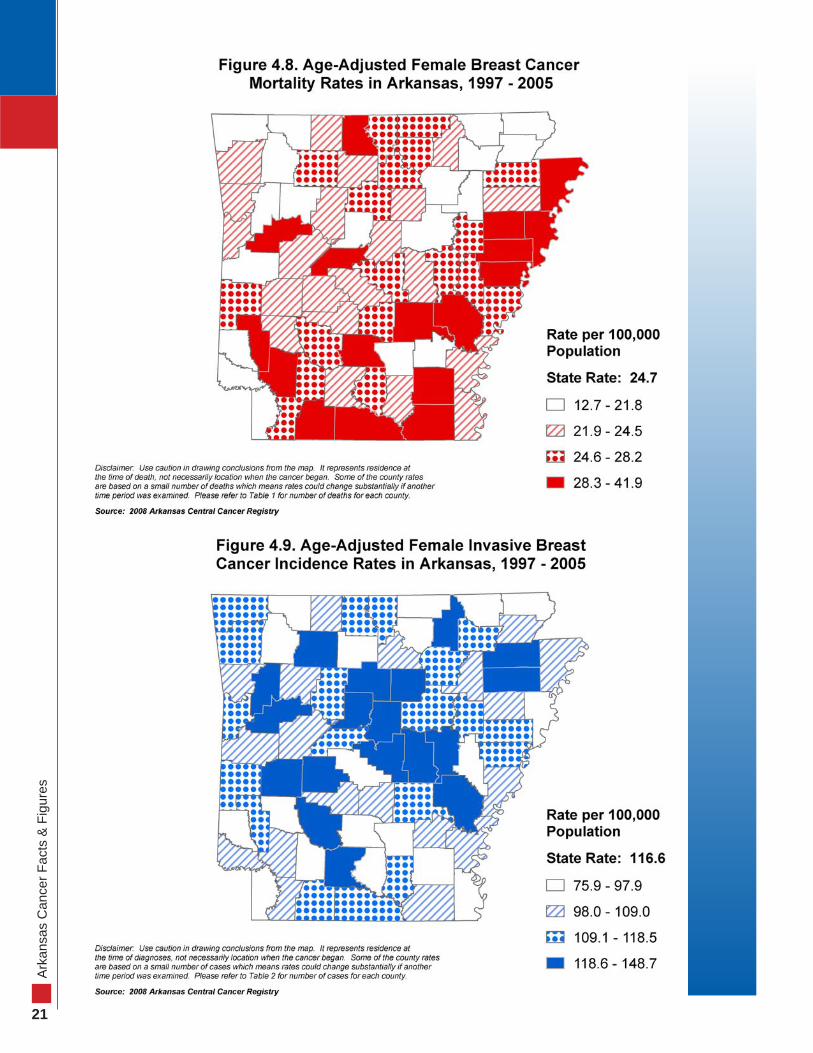
For the period 1997 through 2005, there were 3,591 deaths due to breast cancer, this translates • to approximately 399 deaths per year in Arkansas. The age-adjusted mortality rates of breast cancer in Arkansas have been at or below the national • average during the same period (Figure 4.1).
The age-adjusted mortality rate of breast cancer increased with age (Figure 4.2)•

Ark
ansa
s C
ance
r Fac
ts &
Fig
ures
18
Incidence
For the period 1997 through 2005, there were 16,175 newly diagnosed cases of breast cancer, • which translates to approximately 1,797 cases per year in Arkansas. The age-adjusted incidence rates of breast cancer in Arkansas have been below the national • average during the same period (Figure 4.3).
The age-adjusted incidence rate of breast cancer increased with age (Figure 4.4).•

Ark
ansa
s C
ance
r Fac
ts &
Fig
ures
19
Stage at Diagnosis
Fifty-eight percent of Arkansans diagnosed with breast cancer were diagnosed at a localized • stage, 36% were diagnosed at a regional stage and 5% were diagnosed at a distant stage (Figure 4.5).
In Situ Breast Cancers among Females
An in situ breast cancer, also called ductal carcinoma in situ or intraductal carcinoma, is a cancer in which abnormal cells are found in the lining of a breast duct. The abnormal cells have not spread outside the duct to other tissues in the breast. In some cases, it may become invasive cancer and spread to other tissues.
Incidence
For the period 1997 through 2005, there were 3,111 newly diagnosed cases of in situ breast • cancer among females, this translates to approximately 345 cases per year in Arkansas.

Ark
ansa
s C
ance
r Fac
ts &
Fig
ures
20
The age-adjusted incidence rates of in situ breast cancer among females in Arkansas have been • below the national average during the same period (Figure 4.6).
The age-adjusted incidence rate of in situ breast cancer among females increased with age until • 84 years of age (Figure 4.7).
Ark
ansa
s C
ance
r Fac
ts &
Fig
ures
21

Ark
ansa
s C
ance
r Fac
ts &
Fig
ures
22
Cha
pter
5: C
olor
ecta
l Can
cer
Chapter 5: Colorectal CancerApproximately 1,690 Arkansans were estimated to be diagnosed with colorectal cancer and 580 to die due to colorectal cancer in Arkansas in 2008.1
Signs & Symptoms 2
The median age at diagnosis for colorectal cancer was 71 years of age.3 Common signs and symptoms are associated with change in bowel habits:
Constipation or diarrhea, feeling that the bowel • does not empty completely. Blood in the stools, rectal bleeding and cramping • pain in the abdomen.Losing weight with no known reason and feeling • very tired all the time.
Risk Factors 2
Ages older than 50 years - 90% of people with • colorectal cancers are diagnosed after age 50.Family history of colorectal cancer.• Diet high in fat (especially animal fat) and low in • calcium, folate and fiber may increase the risk of colorectal cancer.Cigarette smoking.• Presence of colorectal polyps, ulcerative colitis or • Crohn’s disease.
Prevention & Early Detection 4
The U.S. Preventive Services Task Force • recommends screening for colorectal cancer using fecal occult blood testing, sigmoidoscopy or colonoscopy, in adults beginning at 50 years of age and continuing until age 75 years of age.A fecal occult blood test is recommended every • year after the age of 50. A flexible sigmoidoscopy is recommended every 3-5 years after the age of 50 and a colonoscopy may also be recommended by the physician every 10 years to detect colorectal cancer at an early stage.
Treatment & Survival 2
Most common treatment methods included surgery, • chemotherapy, biological therapy and radiation therapy.The overall 5-year survival rate was 64.4%.•

Ark
ansa
s C
ance
r Fac
ts &
Fig
ures
23
Arkansas Facts & FiguresMortality
For the period 1997 through 2005, there were 5,423 deaths due to colorectal cancer which • translates to approximately 602 deaths per year in Arkansas. The age-adjusted mortality rates of colorectal cancer in Arkansas have been above national • average since 1999 (Figure 5.1).
The age-adjusted mortality rate of colorectal cancer was significantly higher among males and • blacks, and it increased with age (Figure 5.2).

Ark
ansa
s C
ance
r Fac
ts &
Fig
ures
24
Incidence
For the period 1997 through 2005, there were 13,275 newly diagnosed cases of colorectal • cancer, this translates to approximately 1,475 cases per year in Arkansas. The age-adjusted incidence rates of colorectal cancer in Arkansas have been above the national • average since 2003 (Figure 5.3).
The age-adjusted incidence rate of colorectal cancer was significantly higher among males and • blacks, and it increased with age (Figure 5.4).

Ark
ansa
s C
ance
r Fac
ts &
Fig
ures
25
Stage at Diagnosis
Only 40% of Arkansans diagnosed with colorectal cancer were diagnosed at a localized stage, 35% were • diagnosed at a regional stage and 20% were diagnosed at a distant stage (Figure 5.5).

Ark
ansa
s C
ance
r Fac
ts &
Fig
ures
26

Ark
ansa
s C
ance
r Fac
ts &
Fig
ures
27
Cha
pter
6: O
varia
n C
ance
r
Chapter 6: Ovarian CancerOvarian cancer accounts for about 3% of all cancers among women. Approximately 21,650 women were estimated to be diagnosed with ovarian cancer and 15,520 women to die due to ovarian cancer in the United States in 2008. 1
Signs & Symptoms 2
The median age at diagnosis for ovarian cancer was 63 years of age.3 Early ovarian cancer may not cause obvious symptoms. Signs and symptoms may become evident as the cancer grows. They are:
Pain or pressure in the abdomen, pelvis, back or • legs. Bloating or swelling of the abdomen.• Indigestion, gas, constipation or diarrhea.• Feeling very tired all the time.•
Risk Factors 2
Family history of cancer.• Personal history of cancer.• Age over 55.• Never pregnant.• Studies have suggested that women who take • estrogen by itself (without progesterone) for 10 or more years may have an increased risk.
Prevention & Early Detection 4
The U.S. Preventive Services Task Force • recommends against routine screening for ovarian cancer.The combination of a thorough pelvic exam, • transvaginal ultrasound and a blood test for the tumor marker CA125 may be offered to women who are at high risk of ovarian cancer.
Treatment & Survival 2
Ovarian cancer is usually managed by • gynecologists, medical oncologists and radiation oncologists. The usual treatment methods included surgery, chemotherapy and occasionally radiation therapy.The overall 5-year survival rate was 45.5%•

Ark
ansa
s C
ance
r Fac
ts &
Fig
ures
28
Arkansas Facts & FiguresMortality
For the period 1997 through 2005, there were 1,264 deaths due to ovarian cancer, this • translates to approximately 140 deaths per year in Arkansas. The age-adjusted mortality rates of ovarian cancer in Arkansas have been at or below the • national average during the same period (Figure 6.1).
The age-adjusted mortality rate of ovarian cancer increased with age until 84 years of age • (Figure 6.2).

Ark
ansa
s C
ance
r Fac
ts &
Fig
ures
29
Incidence
For the period 1997 through 2005, there were 1,695 newly diagnosed cases of ovarian cancer, • which translates to approximately 188 cases per year in Arkansas. The age-adjusted incidence rates of ovarian cancer in Arkansas have been at or below national • average during the same period (Figure 6.3).
The age-adjusted incidence rate of ovarian cancer increased with age until 84 years of age • (Figure 6.4).

Ark
ansa
s C
ance
r Fac
ts &
Fig
ures
30
Stage at Diagnosis
Only 13% of Arkansans diagnosed with ovarian cancer were diagnosed at a localized stage, • 20% were diagnosed at a regional stage and 58% were diagnosed at a distant stage (Figure 6.5).

Ark
ansa
s C
ance
r Fac
ts &
Fig
ures
31

Ark
ansa
s C
ance
r Fac
ts &
Fig
ures
32
Cha
pter
7: C
ervi
cal C
ance
r
Chapter 7: Cervical CancerApproximately 11,070 women were estimated to be diagnosed with cervical cancer, and 3,870 women to die due to cervical cancer in the United States in 2008. 1
Signs & Symptoms 2
The median age at diagnosis for cervical cancer was 48 years of age.3 Common signs and symptoms are:
Abnormal vaginal bleeding • Increased vaginal discharge•
Risk Factors 2
HPV infection, which is a sexually transmitted • infection.Lack of regular Pap tests.• Smoking.• Multiple sexual partners.• Using birth control pills for a long time.• Having many children.• Daughters of women who had been given • diethylstilbestrol during pregnancy between 1940 and 1971.
Prevention & Early Detection 4
The US Food and Drug Administration (FDA) has • approved the first vaccine (Gardasil) to prevent the most common HPV infections that cause cervical cancer for use in females aged 9-26 years.A Pap test is recommended for women who are • 18 years of age, or have been sexually active.
Treatment & Survival 2
Electrocoagulation, cryotherapy, laser ablation • and local surgery were the typical treatment modalities for pre-invasive lesions.Surgery, radiation or chemotherapy were typical • treatment methods for cervical cancers.The overall 5-year survival rate was 71.2%.•

Ark
ansa
s C
ance
r Fac
ts &
Fig
ures
33
Arkansas Facts & FiguresMortality
For the period 1997 through 2005, there were 488 deaths due to cervical cancer this translates • to approximately 54 deaths per year in Arkansas. The age-adjusted mortality rates of cervical cancer in Arkansas have been at or above the • national average during the same period (Figure 7.1).
The age-adjusted mortality rate of cervical cancer was significantly higher among blacks • compared to whites (Figure 7.2).
Ark
ansa
s C
ance
r Fac
ts &
Fig
ures
34
Incidence
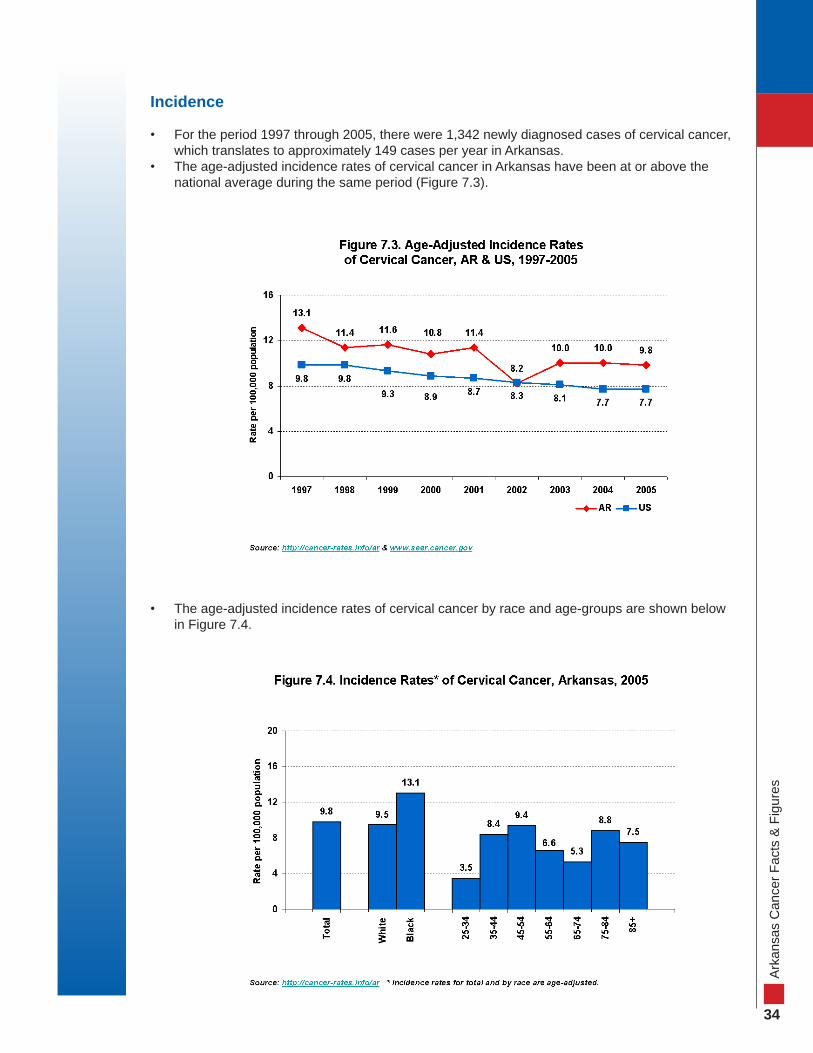
For the period 1997 through 2005, there were 1,342 newly diagnosed cases of cervical cancer, • which translates to approximately 149 cases per year in Arkansas. The age-adjusted incidence rates of cervical cancer in Arkansas have been at or above the • national average during the same period (Figure 7.3).
The age-adjusted incidence rates of cervical cancer by race and age-groups are shown below • in Figure 7.4.

Ark
ansa
s C
ance
r Fac
ts &
Fig
ures
35
Stage at Diagnosis
Forty-nine percent of Arkansans diagnosed with cervical cancer were diagnosed at a localized • stage, 33% were diagnosed at a regional stage and 14% were diagnosed at a distant stage (Figure 7.5).

Ark
ansa
s C
ance
r Fac
ts &
Fig
ures
36

Ark
ansa
s C
ance
r Fac
ts &
Fig
ures
37
Ref
eren
ces
References
1. American Cancer Society. Cancer Facts & Figures 2008. Atlanta: American Cancer Society: 2008.
2. National Cancer Institute. U.S. National Institutes of Health. www.cancer.gov
3. Surveillance, Epidemiology and End Results. SEER Stat Fact Sheets. National Cancer Institute. www.seer.cancer.gov
4. U.S. Preventive Services Task Force. Agency for HealthCare Research and Quality.
5. Cancer Prevention and Control. Centers for Disease Control and Prevention. Department of Health and Human Services.
6. U.S Census Bureau. www.census.gov

Ark
ansa
s C
ance
r Fac
ts &
Fig
ures
38
Table 1. Age-Adjusted Mortality Rates & Counts by Cancer Site & by County, Arkansas, 1997-2005
County All Cancers Lung Cancer Prostate Cancer Female Breast Cancer Colorectal Cancer Ovarian Cancer Cervical CancerCases Rate Cases Rate Cases Rate Cases Rate Cases Rate Cases Rate Cases Rate
Arkansas 508 223.6 173 75.9 25 30 35 31.2 59 25.6 12 9.5 ~ 3.9***
Ashley 561 237.3 170 72.2 37 40.5 41 31.3 44 18.4 18 13.9 9 8.2***
Baxter 1387 211.9 485 73.2 68 22.5 85 25.9 141 21.2 43 13.3 ~ 1.5***
Benton 2617 171.1 788 50.6 125 19.4 176 21.7 277 18.2 70 8.4 17 2.3Boone 756 192.1 246 61.9 45 27.3 50 23.9 80 20.7 20 9.3 8 3.8***
Bradley 270 187.6 96 66.8 11 18.7 15 22.7 23 15.4 ~ 3.9*** ~ 1.9***
Calhoun 151 241.3 50 79.4 9 36.4*** 9 28.2*** 14 22.8 ~ 5.0*** ~ 6.0***
Carroll 553 194.5 157 55 35 30.9 33 21.4 57 19.9 15 9.7 ~ 1.9***
Chicot 327 224.7 94 63.2 33 58.8 19 24.3 32 21.2 ~ 3.4*** 6 9.2***
Clark 430 186.4 136 60 37 40.2 32 27.6 43 18.2 16 12.9 5 4.0***
Clay 491 224.6 175 81 24 27.3 28 21.6 59 26.4 7 6.5*** ~ 1.6***
Cleburne 626 188.6 230 68.3 42 31 40 22.3 58 18 8 4.1*** ~ 0.5***
Cleveland 170 199.6 56 66.2 12 30.2 9 18.1*** 9 10.1*** ~ 4.4*** ~ 2.0***
Columbia 637 235.9 185 68.2 42 41.4 51 34.3 62 23.7 12 7 12 8.3Conway 438 193.7 134 58.8 31 35 26 21.8 42 18.9 11 9.2 0 0.0***
Craighead 1440 203.3 439 61.9 50 19.7 115 27.5 148 20.9 42 10.3 15 4Crawford 1014 222.4 366 78.5 45 28.4 60 23.7 86 19.3 17 6.7 9 3.6***
Crittenden 986 258.2 309 80.3 67 57.3 68 30 100 26 26 11.4 12 5.5Cross 460 243.5 144 76.3 30 42.9 37 35.3 43 22.6 9 7.9*** ~ 3.8***
Dallas 239 231 76 74 14 31.3 17 33.6 25 24.1 ~ 5.8*** ~ 2.2***
Desha 297 194.9 89 58.5 23 37.9 21 24.5 40 26.4 ~ 4.8*** ~ 4.7***
Drew 361 211.1 132 77.1 18 28.1 26 28.4 45 26.4 ~ 4.3*** 0 0.0***
Faulkner 1203 189.8 424 66.4 60 28.8 84 23.1 131 21 32 8.9 11 3.1Franklin 405 207.6 146 76.5 25 31.1 22 21.3 30 14.7 8 7.2*** ~ 3.9***
Fulton 316 198.9 113 69.8 15 22.8 22 26.8 28 17.9 ~ 3.2*** ~ 2.4***
Garland 2340 192 804 65.3 138 26.2 140 22.4 216 17.5 55 8.1 8 1.8***
Grant 316 212.6 103 69.6 13 24.4 24 27.3 22 14.7 7 8.8*** ~ 4.7***
Greene 730 196.7 269 71.6 38 28.9 30 15.3 77 20.9 22 10.9 ~ 2.1***
Hempstead 485 208.5 168 73.7 35 41 38 29.4 47 20 11 9.1 6 5.2***
Hot Spring 699 213.6 245 74.1 29 21.8 40 23.6 72 22 8 3.8*** ~ 0.7***
Howard 362 238.9 123 83.6 17 26.5 26 32.2 26 16 6 7.7*** ~ 5.5***
Independence 754 216.1 278 78.8 37 27.2 37 19.4 67 19.3 21 11.3 6 3.6***
Izard 407 223.7 156 84.1 31 37.2 22 24.6 41 21.9 6 6.9*** ~ 5.2***
Jackson 466 230.1 163 79.8 32 42.5 19 17.7 40 20.3 6 5.2*** ~ 2.6***
Jefferson 1722 222.7 529 69 126 45 126 29.4 180 23.2 33 7.5 12 2.9Johnson 465 197.5 173 73.5 32 35.2 24 20.2 37 15.7 14 11.3 ~ 1.1***
Lafayette 214 212.4 66 68 15 35.5 10 25.8 23 21.6 5 9.1*** ~ 9.5***
Lawrence 472 228.1 199 96.6 28 33.7 14 12.7 39 18.7 8 6.4*** 9 8.5***
Lee 293 249 93 79.6 21 44.6 25 41.9 29 23.9 6 10.8*** ~ 7.4***
Lincoln 232 189.5 84 70.4 8 19.4*** 12 19.7 23 18 7 10.6*** ~ 3.6***
Little River 303 209.8 97 66.2 19 33.9 16 21.5 33 22.3 5 6.1*** ~ 5.5***
Logan 547 220 200 80.9 40 41.4 38 29.6 48 18.9 ~ 3.0*** ~ 3.4***
Lonoke 929 214.2 310 71.6 43 28.8 60 23.9 110 25.5 23 9.3 8 3.3***
Madison 263 180.8 81 55.2 22 36.5 16 21 27 18.6 ~ 3.9*** ~ 1.2***
Marion 438 197.7 146 64.3 13 15.3 37 31.9 38 17.3 7 6.5*** ~ 4.6***
Miller 799 204.5 266 68.1 48 35 43 20.1 97 24.6 14 6.1 10 4.7Mississippi 1052 238.3 354 79.8 50 32 75 30.4 125 28.1 31 12.4 15 6.7Monroe 282 240.3 104 87.8 14 30.6 16 25 33 27.5 8 11.5*** ~ 3.1***
Montgomery 211 178.3 70 56.5 7 12.1*** 14 24.5 18 15.6 10 14.4 ~ 5.9***
Nevada 226 207.1 72 67.2 19 44.3 17 27.5 20 17.7 ~ 4.9*** ~ 3.8***
Newton 209 220 73 75.4 10 24.2 13 26.4 9 10.1*** 7 13.7*** ~ 5.4***
Ouachita 689 216.2 241 75.8 44 35.5 38 23.4 58 18 11 6 ~ 1.9***
Perry 218 204.8 83 76.5 12 29.3 16 29.4 24 23.1 ~ 6.7*** ~ 1.6***
Phillips 650 265.7 188 76.8 66 78.3 39 27.4 69 27.7 17 12.3 10 7Pike 273 204.4 90 69.2 12 21.7 16 23.1 26 19.3 5 5.9*** 0 0.0***
Poinsett 615 239.5 217 83 34 37.6 34 24.5 59 23.2 11 7.1 ~ 2.8***
Polk 538 226.2 171 71.1 37 38.9 33 26.7 60 25 12 9.4 ~ 1.9***
Pope 1048 209.9 346 69.1 56 29.6 68 24.4 90 18 21 7.5 11 4.1Prairie 264 233.5 83 73.5 24 47.7 15 26.5 32 27.3 10 16 ~ 1.6***
Pulaski 6536 210.1 2093 67.5 322 30.7 470 25.6 587 18.8 157 8.5 60 3.4Randolph 448 212.1 150 70.8 20 23.7 20 17.8 61 28.5 5 3.8*** ~ 2.5***
St Francis 645 261.4 194 78 50 57.3 55 39.2 75 30.9 16 11.9 8 6.0***
Saline 1460 188.3 508 64.2 64 23 96 22.6 119 15.4 30 7 15 3.6Scott 271 230.8 92 78.4 20 46.4 14 19.7 26 23 5 7.2*** ~ 6.2***
Searcy 235 223.8 90 84.7 11 22.5 12 23.2 24 22 8 17.2*** ~ 3.3***
Sebastian 2227 206 728 67.8 111 28.3 153 24.5 215 19.9 54 8.5 21 3.8Sevier 314 215.9 102 70.2 16 30.1 13 16.6 25 17.3 8 9.8*** 6 9.0***
Sharp 512 205 147 57.8 34 31.3 33 23.7 42 16.9 9 6.4*** 8 7.7***
Stone 288 194.2 90 57.7 7 11.2*** 21 27.8 34 24 8 11.2*** ~ 4.5***
Union 1133 227.7 348 70.9 69 36.6 89 31.8 94 18.5 28 9.3 13 5.9Van Buren 490 204.5 172 69.5 32 30.2 32 24.7 40 17.1 9 6.0*** 7 7.8***
Washington 2377 198.6 745 62.3 125 30.3 158 23.4 252 21.3 65 9.6 16 2.4White 1394 212.8 515 78.5 94 36.3 76 20.8 149 22.8 30 8.4 18 5.6Woodruff 257 263.8 89 90.7 24 61.5 13 25.9 35 35.8 5 9.7*** ~ 4.5***
Yell 521 240.5 185 85.2 18 20.5 30 24.3 54 24.8 14 11.4 5 4.9***
*** Rates on case counts less than 10 may be unstable. ~ Case counts less than 5 are not displayed.

Ark
ansa
s C
ance
r Fac
ts &
Fig
ures
39
Table 2. Age-Adjusted Incidence Rates & Counts by Cancer Site & by County, Arkansas, 1997-2005
County All Cancers Lung Cancer Prostate Cancer Female Breast Cancer Colorectal Cancer Ovarian Cancer Cervical CancerCases Rate Cases Rate Cases Rate Cases Rate Cases Rate Cases Rate Cases Rate
Arkansas 550 446.8 179 80.3 154 161.8 143 124 113 50 19 17.1 18 18.6Ashley 600 458.7 200 83.9 175 168.2 133 108.8 126 53 22 17.1 10 8.4Baxter 1881 544.8 576 89.4 562 178.3 367 118.1 387 60.2 48 16.2 16 8.2Benton 3480 389.1 962 62 1119 153.8 924 116.7 702 46.1 96 11.8 50 6.9Boone 1005 456.8 277 70.9 275 154.1 220 108.4 197 50.6 19 9.1 14 8.6Bradley 307 405 106 75.8 82 135.5 84 118.5 64 46.3 5 6.5*** 8 13.8***
Calhoun 145 425.5 48 76.4 22 83.4 29 88.8 31 50 ~ 13.7*** ~ 13.0***
Carroll 602 370.7 179 61.1 181 134.7 134 91.7 118 41.4 19 12.2 11 8.5Chicot 311 401.8 110 76 109 174.9 64 88.6 71 49.6 ~ 5.0*** 9 13.5***
Clark 581 472.6 170 75.5 183 187.2 153 134.7 107 46.4 20 16.7 16 15.1Clay 489 421.4 182 84.1 109 114.8 98 94.2 135 62.3 13 12.2 9 11.4***
Cleburne 877 474.9 282 84 273 167.3 190 120.9 152 46.6 19 11.3 10 8Cleveland 219 446 62 70.9 83 205 37 79.5 39 46.6 ~ 9.5*** ~ 9.6***
Columbia 696 486.4 224 84.2 187 167 155 115.8 139 53.3 21 13.8 24 18.8Conway 519 426.8 164 72.1 137 136.7 130 119 97 43.3 16 14.1 12 13.1Craighead 1865 454.7 571 80.2 344 113.5 517 132.2 355 49.7 59 15.3 38 10.5Crawford 1171 423.7 385 80.5 272 122.6 252 99.7 216 47.1 25 9.7 25 10.1Crittenden 803 361.1 297 76.2 127 82.7 206 91.3 196 50.8 17 7.4 21 9.3Cross 427 409.6 170 89.8 86 105.8 109 106.9 85 45.3 11 10.9 11 11.4Dallas 248 466.6 77 78.5 78 173.9 39 76.6 60 60.8 6 11.6*** ~ 8.2***
Desha 373 453.7 136 91 120 191 84 101.7 77 51.2 5 6.3*** 5 7.5***
Drew 422 442.8 136 79.5 145 194.8 81 91 98 58.1 8 9.0*** 10 11.8Faulkner 1849 477.9 533 82.7 433 152.2 438 122 348 54.5 39 10.8 33 8.9Franklin 501 473.8 155 82.5 107 124.5 120 128.9 89 45.4 12 13.9 11 13.1Fulton 331 382.3 112 70.3 71 92.4 66 85.7 77 49.4 ~ 4.3*** 5 6.6***
Garland 3626 548 1113 91.4 1142 203.2 776 130.7 717 58.7 76 11.9 49 11.1Grant 437 488.7 141 92.1 125 180.2 88 106.7 69 44.8 10 12.4 6 7.5***
Greene 940 450.6 305 80.8 168 105.4 201 103.6 202 55 16 8.7 21 12.4Hempstead 508 408.4 170 76 159 164.2 127 105.5 113 49.8 9 7.1*** 15 12.1Hot Spring 828 456.3 300 90.9 202 135.4 170 103.8 147 45.3 14 7.3 17 12.6Howard 415 520.5 154 107.6 93 145.3 87 112.2 77 52.4 13 16.7 12 18.5Independence 911 461.7 313 89 258 167.3 218 116.7 165 47.7 22 12.5 19 11.2Izard 473 482 177 97.7 157 182.4 86 96.7 94 50 15 16.7 9 15.5***
Jackson 452 429.9 176 87.4 93 109 114 105.6 114 57.9 6 5.5*** 9 10.3***
Jefferson 1978 462.4 641 83.9 619 191.8 475 115.5 429 55.8 34 8.1 42 10.7Johnson 545 418.7 182 77.8 118 112.8 125 105.9 123 52.7 10 8.4 7 6.5***
Lafayette 211 399.1 78 79.4 78 173.8 48 98 48 49.4 9 16.4*** 8 19.1***
Lawrence 568 517.8 233 115.1 134 151.2 112 113.6 115 56.4 15 13.7 17 21.2Lee 276 442 101 87.6 52 105.8 65 116 70 60.8 ~ 7.9*** 6 12.7***
Lincoln 296 434.5 115 96.2 82 156.8 58 98.5 61 48.7 9 13.4*** 7 13.0***
Little River 360 440 125 86.3 108 162.8 84 109 86 58.7 6 7.3*** 5 8.9***
Logan 658 478.3 223 91.4 155 136.7 148 119 126 51.1 8 7.3*** 16 14.5Lonoke 1300 492.3 381 86.2 319 161.9 318 129.3 224 51 37 14.8 31 12.5Madison 318 388.6 100 67.4 80 119.6 72 97.9 59 40.6 12 16.5 8 13.3***
Marion 577 469.5 175 77.7 149 134.4 119 109.3 110 49.1 9 9.1*** 8 8.9***
Miller 998 451.6 344 88.3 256 154.4 195 92.9 232 59.8 21 9.8 15 8Mississippi 1031 423 380 85.7 233 130.3 246 101.5 255 57.9 30 12.3 31 13.8Monroe 314 506 111 95.8 82 166.1 57 97.4 71 61.3 10 16.1 8 18.0***
Montgomery 252 395.2 78 64.9 60 102.4 66 119.8 38 32.2 8 12.8*** ~ 1.4***
Nevada 250 432.7 81 75.1 99 213.3 51 95.7 54 50.9 ~ 5.4*** 5 11.7***
Newton 207 396 64 65.5 54 123.5 56 125.7 29 31.7 7 13.6*** ~ 6.4***
Ouachita 858 506.1 288 92 227 172.2 203 123.2 168 53.3 17 10.8 21 15.4Perry 289 474.7 86 79.3 88 170.6 60 112 54 52.1 ~ 3.3*** 6 13.0***
Phillips 473 362.2 167 67.5 127 130.4 130 98.1 113 47 12 9.1 16 12.3Pike 320 464.5 99 75.8 68 116.5 60 92 65 49.5 9 12.6*** 6 13.1***
Poinsett 688 484.4 255 97.6 126 112.8 163 122.6 134 53 16 11.1 14 12.2Polk 588 455.4 200 85 133 121.8 134 116.7 137 57.1 20 16.5 8 8.3***
Pope 1317 460.2 442 88.5 268 121.2 313 117.5 248 49.5 39 14.2 34 13.2Prairie 306 511.7 106 94.9 89 174.7 74 141.6 66 59.6 10 19.5 7 17.5***
Pulaski 9520 527.8 2631 84.2 2690 206.1 2666 148.7 1553 49.5 213 11.8 185 10.6Randolph 505 437.7 171 81.1 106 113 94 92.2 126 60 6 5.9*** 15 14.5St Francis 536 387.8 199 80.3 105 101.3 147 110.2 140 56.6 14 10.6 16 13.6Saline 1494 317.4 421 52 372 96.3 321 75.9 257 32.6 42 9.6 23 5.6Scott 294 455.9 101 86.5 79 151.9 57 98.4 56 48.1 ~ 6.2*** 6 11.7***
Searcy 250 444.8 100 93.3 65 125.3 44 86.7 50 48.5 9 18.9*** 5 13.7***
Sebastian 2567 421.7 796 74.2 639 140.5 690 118.4 544 50.4 68 11.3 44 8.2Sevier 346 430.9 120 82.7 97 150.5 64 84.5 63 42.9 10 12.8 8 11.7***
Sharp 655 483.3 237 95.3 176 147.2 163 135.1 124 48 15 11.4 10 11.2Stone 327 391.8 102 65.6 86 114.9 78 103.8 65 43.3 5 5.9*** 11 18Union 1152 436.4 402 84 239 120.7 290 114.6 221 45.1 40 13.9 37 17.3Van Buren 552 432.1 193 81.9 164 139.5 133 120.6 90 36.6 6 6.2*** 11 14.8Washington 2771 385.5 830 68.9 671 130.1 788 117.3 546 45.5 96 14.3 50 7.5White 1971 533.5 668 102.2 509 175.6 396 116.5 365 56.5 44 13 43 13.9Woodruff 269 528.7 108 113.7 82 208.4 58 113.6 63 65.5 10 22.6 5 13.5***
Yell 557 471.4 230 108 107 112.3 114 103.7 120 55.3 21 19 9 9.1***
*** Rates on case counts less than 10 may be unstable. ~ Case counts less than 5 are not displayed.

Ark
ansa
s C
ance
r Fac
ts &
Fig
ures
40
Glo
ssar
y
GlossaryAge-adjusted rates: A rate calculated in a manner that allows for the comparison of populations with different age distributions.
Age-specific rates: The incidence or mortality rate of a specific age group, calculated per 100,000 people.
Incidence: The rate of new cases calculated by taking the number of new cases within a specified time period divided by the size of the population initially at risk.
In situ cancer: A noninvasive cancer in which abnormal cancer cells are found in the lining of the organ in which the cancer developed, but which have not spread to other tissues.
Invasive cancer: The abnormal cancer cells have spread to other tissues.
Median: The number in the middle of a distribution: half the values are above the median and half are below the median. Mortality: The death rate calculated by taking the number of deaths within a specified time period divided by the size of the population during that time period.
Risk factor: A characteristic or behavior that is consistently associated with increased probability of a disease or event.
Stage at diagnosis: Stage provides a measure of disease progression, detailing the degree to which the cancer has advanced.
Localized: Cancer that is limited to the organ in which it began, without evidence of spread.
Regional: Cancer that has spread beyond the original (primary) site to nearby lymph nodes or organs and tissues.
Distant: Cancer that has spread from the primary site to distant organs or distant lymph nodes. Unstaged: Cancer for which there is not enough information to indicate a stage.
Survival: The proportion of patients alive at a specified point in time subsequent to the diagnosis of their cancer
A note about the data presented in the report
It must be noted that in 1999, a new cause-of-death tabulation was developed in the form of ICD-10 (International Classification of Diseases) codes. Before 1999, the ICD-9 classification was used. There are differences in mortality rates between the two codes. In this document, however, adjustments have been made in mortality rates with respect to ICD-9 and ICD-10 codes so that they are comparable over time.

Ark
ansa
s C
ance
r Fac
ts &
Fig
ures
41
Arkansas DemographicsArkansas, the Natural State, is home to 2.8 million people. 6
Some general information about Arkansas
The following facts were obtained from the 2007 U.S. Census estimates:
Total population 2,834,797 ►Females 51.0%• Males 49.0%•
Age distribution ►Persons under 20 years 27.4%• Persons 20-44 years 33.3%• Persons 45-64 years 25.2%• Persons 65 years and over 14.0%•
Racial/Ethnic distribution ►Whites 81.1%• Blacks or African Americans 16.1%• Asian 1.3%• American Indian/Native American 1.5%• Other 0.2%•
Median household income $38,239 ►
Persons below the poverty level as ► defined by the U.S. Census 17.6%
Ark
ansa
s D
emog
raph
ics

Ark
ansa
s C
ance
r Fac
ts &
Fig
ures
42
Requests for additional copies should be directed to:
Arkansas Central Cancer RegistryArkansas Department of Health4815 W. Markham, Slot 7Little Rock, AR 72205(501) 661-2463, (501) 661-2891(Fax)Or visit the web site at http://www.healthyarkansas.com/arkcancer/arkcancer.html

Arkansas Cancer Facts & FiguresPublished March, 2009