![172 FERC ¶ 61,047 · 172 FERC ¶ 61,047 . DEPARTMENT OF ENERGY . Federal Energy Regulatory Commission . 18 CFR Parts 37 and 38 [Docket Nos. RM05-5-029, RM05-5-030] Standards for](https://static.fdocuments.us/doc/165x107/600664bf18db3c455500a643/172-ferc-61047-172-ferc-61047-department-of-energy-federal-energy-regulatory.jpg)
Arizona Corporation Commission Docket No. E-00000D … · Arizona Corporation Commission Docket No....
151
Arizona Corporation Commission Docket No. E-00000D-03-0047 Decision No. _______ THIRD BIENNIAL TRANSMISSION ASSESSMENT 2004-2013 November 30, 2004 Prepared by Arizona Corporation Commission Staff and KEMA Inc. 4400 Fair Lakes Court Fairfax, VA 22033
Transcript of Arizona Corporation Commission Docket No. E-00000D … · Arizona Corporation Commission Docket No....

Arizona Corporation Commission
Docket No. E-00000D-03-0047
Decision No. _______
THIRD
BIENNIAL TRANSMISSION ASSESSMENT
2004-2013
November 30, 2004
Prepared by Arizona Corporation Commission Staff and
KEMA Inc. 4400 Fair Lakes Court
Fairfax, VA 22033


Third Biennial Transmission Assessment 2004-2013 Docket No. E-00000D-03-0047 i
Executive Summary
A.R.S. §40-360.02.E states “The (Ten-Year) plans shall be reviewed biennially by the commission and the commission shall issue a written decision regarding the adequacy of the existing and planned transmission facilities in this state to meet the present and future energy needs of this state in a reliable manner.” This Third Biennial Transmission Assessment (“BTA”) was undertaken by the Arizona Corporation Commission (“ACC” or “Commission”) Staff (“Staff”) to fulfill the above stated statutory obligation.
The Ten-Year transmission plans filed in January 2003 and 2004 under Docket No. E-00000D-03-0047 are the subject of this assessment. Of particular interest are the many activities related to the collaborative regional planning process. Reliability Must Run (“RMR”) studies were submitted in 2003 and 2004 by industry to address concerns identified in Staff’s Second BTA and are also the topic of this assessment.
Staff’s approach in organizing the Third BTA remained the same as for the Second BTA. Staff relied on analyzing the Ten-Year studies, RMR Studies, and other technical reports and documents filed with the Commission by the various organizations rather than performing technical studies of their own. Staff hired a consulting organization, KEMA, to assist in this effort.
Staff uses a set of guiding principles to determine whether the Arizona transmission system will be adequate during the next ten-year period. Staff’s guiding principles are based upon best engineering practices established in Arizona, coupled with the use of regional and national reliability council criteria and standards, and related state and federal policies.
The reliability of an existing or planned electric system under existing, alternative or future operating conditions can only be determined by technical simulation studies, including load flow, stability and short circuit analysis. Such studies require the application of a set of study criteria to measure the system’s performance. In assessing the Arizona transmission system adequacy, Staff and KEMA critically reviewed and analyzed the transmission planning documents assembled by Staff and addressed the following questions:
1. Do the proposed Arizona transmission system plans meet the load serving requirements of the state during the 2004-2013 time period in a reliable manner?
2. Was the transmission planning process conducted in accordance with the transmission planning principles and good utility practices accepted by the power industry?
3. What steps were taken in the new transmission planning studies to effectively address the Commission’s concerns raised in the First and Second BTA about the adequacy of the state's transmission system to reliably support the competitive wholesale market emerging in Arizona?

Executive Summary ii November 2004
4. Do the generation interconnection practices in Arizona adequately reflect technical aspects of the generation interconnection policies as defined in Federal Energy Regulatory Commission (“FERC”) Orders 2003 and 2003-A?
5. Do the transmission plans adequately reflect North America Electric Reliability Council’s (“NERC”) latest activities related to compliance with the transmission planning standards, as well as compliance with Western Electricity Coordinating Council (“WECC”) reliability standards?
This transmission assessment represents the professional opinion of Commission Staff and its Consultant, KEMA. The BTA is not an evaluation of individual transmission provider’s facilities or quality of service. This BTA report does not set Commission policy and does not recommend specific action for any individual Arizona transmission provider. It assesses the adequacy of Arizona’s transmission system to reliably meet existing and future energy needs of the state. This transmission assessment will not become official unless and until it is adopted by Commission Decision.
Staff offers the following conclusions for Commission consideration:
1. The electric industry in Arizona has been very responsive to concerns raised in the Commission’s
Second BTA.
2. Extensive regional studies addressing the interstate transmission needs have been conducted in a
collaborative process.
3. Transmission providers have performed reliability-must-run studies for each local transmission
import constrained area they serve and have complied with the Second BTA RMR requirements.
4. Numerous new transmission and generation projects have been announced and filed with the
Commission since its First and Second BTAs and some of those projects have been constructed.
5. In general, the existing and proposed Arizona transmission system meets the load serving
requirements of the state in a reliable manner:
a. Many planned Extra High Voltage (“EHV”) and High Voltage (“HV”) projects will
increase transmission system capability to support increased interstate power transfers,
and to provide reliable transfers within the state of Arizona.
b. The planned EHV system appears to be adequate throughout the study period. As is often the case, plans for the later years of the period are less well defined than those in the early years. Future reports should include more discussion of alternate additions considered for the final five years of the study period. This will allow the Commission and public to be better informed regarding future possibilities.

Third Biennial Transmission Assessment 2004-2013 Docket No. E-00000D-03-0047 iii
c. The RMR studies show that the RMR areas will have load-serving capacity sufficient to
provide reliable supply during the next ten-year period. Problems are identified in the
Yuma area in 2004 and Santa Cruz Country area in 2004-2008, but are addressed in the
RMR study. The Phoenix area is determined as deficient in local operating reserves in
2013. The Arizona Public Service Company (“APS”) and Salt River Project (“SRP”) are
currently investigating solutions to mitigate this Phoenix area deficiency.
d. The RMR studies show no economic justification for additional transmission projects as
an alternative to dispatch of local area generation. However, Staff is concerned with
some inconsistent data among the utilities and would like increased transparency in
energy production modeling, data and assumptions used in economic studies. Major
disturbances in the Phoenix area are being addressed by the Commission in a separate
proceeding. Utilities serving major Arizona urban areas should assess existing major
facilities regarding such extreme multiple contingencies and describe the actions they
have taken to address such contingencies.
e. The planned Arizona transmission system meets the WECC and NERC single
contingency criteria (N-1).
f. Since interconnection of merchant plants commenced at the Palo Verde Hub, the Palo
Verde east transmission system capability has increased from 3810 MW to 6970 MW as
a result of several transmission upgrades. Two new 500 kV transmission line projects
within Arizona are proposed as additional reinforcements in 2007 through 2011. The Palo
Verde to TS5 to Raceway and Palo Verde to Browning projects will significantly
increase the outlet capability of the Palo Verde Hub to Arizona.
6. No transmission improvements have been made to the pre-existing 2800 MW Palo Verde west
transmission system capability to delivery power to California. Therefore, transmission from
Palo Verde to California is inadequate to allow all new Palo Verde Hub generation full access to
the California market. Three 500 kV transmission projects are being studied to remedy such
market limitation between Arizona, California and Nevada.
7. There is very little existing long-term firm transmission capacity available to export or import
energy over Arizona’s transmission system. Studies investigating transmission additions required
between Arizona and California and between New Mexico and Arizona continue to explore the
scope, participation and timing of alternative projects.

Executive Summary iv November 2004
8. Some new power plants have interconnected to Arizona’s bulk transmission system via a single
transmission line or tie rather than continuing Arizona’s best engineering practices of multiple
lines emanating from power plants. As interconnection of new transmission lines are considered
for the Palo Verde Hub, they should be encouraged to terminate at these new power plant
switchyards in order to mitigate this regional reliability concern.
Concerns outlined by Staff in the above conclusions are not easily or quickly resolved. The public’s best interest warrants effective and decisive remedies. Therefore, Staff offers the following recommendations for Commission consideration and action:
Ø Continue to support use of:
a. “Guiding Principles for ACC Staff Determination of Electric System Adequacy and
Reliability” (attached as Appendix A) to aid Staff in its determination of adequacy and
reliability of power plant and transmission line projects,
b. NERC and WECC criteria and FERC policies for adequacy and reliability assessments of
the transmission system, and
c. Collaborative planning study forums of transmission providers, merchant plant
developers, and other interested parties for the purpose of:
1. Ensuring consumer benefits of generation additions and cost–effective transmission
enhancements and interconnections.
Ø Endorse Staff’s recommendation that:
a. RMR studies continue to be performed and filed with ten year plans in even numbered
years for inclusion in future BTA reports and that:
1. Future RMR studies provide more transparent information on input data and
economic dispatch assumptions, and
2. Arizona utilities collaborate with the Staff to develop and effectively implement more
stringent criteria as appropriate for RMR areas in the 2006 BTA.
b. All future interconnections proposed at the Palo Verde Hub, either new generation or new
transmission line, must perform a risk assessment of the Hub to ascertain to what degree
the proposed project mitigates the pre-existing risks to extreme outage events. This
assessment must precede a project’s application for a CEC with the Commission. The
recommendations of the Palo Verde Risk Assessment report should be followed if a
proposed project would otherwise exacerbate the existing risk at the Hub.

Third Biennial Transmission Assessment 2004-2013 Docket No. E-00000D-03-0047 v
c. The Fourth BTA address and document:
1. Compliance with single contingency criteria overlapped with the bulk power system
facilities maintenance (N-1-1) (for the first year of the BTA analysis) as required by
WECC and NERC.
2. Extreme contingency outages studied for Arizona’s major generation hubs and major
transmission stations including identification of associated risks and consequences if
mitigating infrastructure improvements are not planned.


Contents
Third Biennial Transmission Assessment 2004-2013 Docket No. E-00000D-03-0047 vii
Executive Summary.............................................................................................................................i
List of Figures .................................................................................................................................. ix
List of Tables ....................................................................................................................................x
1. Overview .....................................................................................................................................1 1.1 Assessment Authority...........................................................................................................1 1.2 Previous Biennial Transmission Assessments - Conclusions and Recommendations .................1
1.2.1 First Biennial Transmission Assessment....................................................................1 1.2.2 Second Biennial Transmission Assessment................................................................2
1.3 Third Biennial Assessment - Purpose and Framework ............................................................4 1.3.1 Purpose ...................................................................................................................4 1.3.2 Framework..............................................................................................................5
2. Related Regulatory Activities ........................................................................................................9 2.1 Relevant FERC Orders and Actions, and Arizona Industry Response.......................................9
2.1.1 FERC Activities Following the August 14, 2003 Blackout ..........................................9 2.1.2 FERC Large Generation Interconnection Standards .................................................. 14 2.1.3 FERC Standard Market Design ............................................................................... 17 2.1.4 Update on the FERC RTO Order 2000 and WestConnect RTO ................................. 19
2.2 Arizona Corporation Commission Actions ........................................................................... 20 2.2.1 Arizona Implementation of Special Reliability Requirements.................................... 20 2.2.2 Electric Re-Structuring Activities............................................................................ 21 2.2.3 2003 Competitive Resources Solicitation .....................Error! Bookmark not defined. 2.2.4 Commission Concern on Local Area Transmission Constraints and RMR.................. 21 2.2.5 Arizona Electric Utility Reorganizations .................................................................. 22 2.2.6 Arizona Independent Scheduling Administrator ....................................................... 23
2.3 Western Governors Association Efforts ............................................................................... 24
3. Transmission Planning ................................................................................................................27 3.1 Transmission Reliability Standards...................................................................................... 27
3.1.1 NERC Reliability Standards.................................................................................... 27 3.1.2 WECC Reliability Standards ................................................................................... 31 3.1.3 Arizona Utilities Transmission Planning Standards................................................... 34 3.1.4 Transmission Ratings ............................................................................................. 35
3.2 Arizona Transmission Planning Processes ........................................................................... 37 3.2.1 Regional Transmission Planning Affecting Arizona.................................................. 37 3.2.2 Arizona Planning Practices for Local Area Transmission Constraints ........................ 44
4. Adequacy of Existing System......................................................................................................47 4.1 System Description ............................................................................................................ 47 4.2 Local Area Transmission Constraints .................................................................................. 51 4.3 Palo Verde Hub Operational Issues ..................................................................................... 51
4.3.1 Palo Verde Hub Transmission Constraints ............................................................... 52 4.3.2 Palo Verde Risk Assessment................................................................................... 54

Contents
Contents viii November 2004
5. Adequacy of the Future System...................................................................................................61 5.1 Phoenix-Tucson EHV System Assessment........................................................................... 61 5.2 Arizona-California EHV System Assessment....................................................................... 65 5.3 Arizona-New Mexico EHV System Adequacy..................................................................... 67 5.4 Navajo Transmission Project............................................................................................... 69 5.5 Phoenix-Tucson HV system adequacy................................................................................. 71 5.6 Western Arizona HV System Assessment............................................................................ 78 5.7 Conclusions on Adequacy of EHV and HV Arizona Transmission System............................. 78
6. Local-Area Transmission System.................................................................................................79 6.1 Arizona Reliability Must-Run Generation Requirements....................................................... 79
6.1.1 RMR Conditions and Study Methodology................................................................ 80 6.1.2 Summary of the 2003 and 2004 RMR Studies Process.............................................. 84
6.2 Transmission Import Constraint Areas................................................................................. 87 6.2.1 Phoenix Area RMR Conditions and Imports Assessment .......................................... 87 6.2.2 Yuma Area RMR Conditions and Import Assessment............................................... 97 6.2.3 Tucson Area RMR Conditions and Import Assessment........................................... 103 6.2.4 Mohave Area RMR Conditions and Import Assessment.......................................... 108 6.2.5 Santa Cruz County RMR Conditions and Import Assessment.................................. 110
7. Generation Update .................................................................................................................... 113 7.1 Merchant Plant Ten-Year Plans Reported for the Second BTA............................................ 113 7.2 Status of the Merchant Plant Ten-Year Plans Reported in the Second BTA.......................... 114 7.3 Status of Plants Scheduled for Future Years Operation Reported in the Second BTA............ 115
8. Future Generation ..................................................................................................................... 117 8.1.1 2003 and 2004 Generation Interconnection Requests.............................................. 117
9. Conclusions ............................................................................................................................. 121
10. Recommendations .................................................................................................................... 123
APPENDICES ............................................................................................................................... 125 Appendix A: Guiding Principles for ACC Staff Determination of Electric System Adequacy and Reliability ................................................................................................................................ 127 Appendix B: 2004 BTA Workshop I and II List Attendees ........................................................ 129 Appendix C: Information Resources ......................................................................................... 133 Appendix D: List of new projects and project changes ............................................................... 135

Contents
Third Biennial Transmission Assessment 2004-2013 Docket No. E-00000D-03-0047 ix
Figures Figure 1: Total Transfer Capabilities for Key WECC Transmission Paths (2003) .................................33 Figure 2: Western Interconnection Paths ...........................................................................................34 Figure 3: Six Sub-Regional Planning Groups in the WECC................................................................38 Figure 4: Transmission Area of STEP-AC Planning Group.................................................................41 Figure 5 Areas Covered by SWAT Study Groups..............................................................................42 Figure 6: Arizona EHV Transmission System....................................................................................50 Figure 7 Local Area Transmission Constraints ..................................................................................51 Figure 8: Palo Verde Transmission System........................................................................................52 Figure 9: Generic Model of Hub Concept ..........................................................................................58 Figure 10: Arizona EHV Transmission Area System and Plans...........................................................62 Figure 11: Arizona-California Area Transmission System..................................................................65 Figure 12: Arizona-California Short-Term Transmission Improvements ..............................................66 Figure 13: Major Arizona-New Mexico EHV Transmission ...............................................................67 Figure 14: Navajo Transmission Project Concept...............................................................................69 Figure 15: Phoenix-Tucson Area EHV Transmission System..............................................................71 Figure 16: Phoenix Area HV Transmission System............................................................................72 Figure 17: Tucson Area HV Transmission System.............................................................................73 Figure 18: 2003 and 2004 RMR Study Framework ............................................................................80 Figure 19: RMR Conditions .............................................................................................................81 Figure 20: 2004 BTA Arizona Load Pocket Areas .............................................................................87 Figure 21: New Projects Strengthening the Phoenix-Area Transmission System ..................................89 Figure 22: Phoenix Area Reserves ....................................................................................................94 Figure 23: Phoenix Area Load Serving Capability..............................................................................96 Figure 24: New Projects Strengthening the Yuma Area Transmission System......................................98 Figure 25: Yuma Area Load Serving Capability............................................................................... 103 Figure 26: Addition of New Projects in TEP.................................................................................... 104 Figure 27: Study System for Mohave County .................................................................................. 109
Contents
Contents x November 2004
List of Tables Table 1: NERC Transmission System Standards-Normal and Contingency Conditions .........................29 Table 2: WECC Paths in Arizona ......................................................................................................34 Table 3: Existing Arizona Power Plants Owned by Arizona Utilities ...................................................48 Table 4 Merchant Plant Additions in Arizona Since the First Biennial Transmission Assessment.........49 Table 5: New Transmission Lines and Stations Added Since the Second BTA.....................................50 Table 6: Gross Generation Interconnected to the Hub.........................................................................53 Table 7: Palo Verde transmission and generation capability ................................................................53 Table 8: Arizona Planned EHV Transmission Additions .....................................................................63 Table 9: Long-Range Transmission “Needs” of Parties in the AZ-NM Region.....................................68 Table 10: Arizona Planned HV Transmission Additions .....................................................................74 Table 11: Summary 2004 RMR Studies Results.................................................................................85 Table 12: Phoenix Area Facilities Additions ......................................................................................91 Table 13: Phoenix Area Critical Outages...........................................................................................92 Table 14: Phoenix Area Maximum Load Serving Capability...............................................................93 Table 15: Generating Unit Operational Characteristics .......................................................................95 Table 16: Yuma Area Facility Additions ......................................................................................... 100 Table 17: Yuma Area Critical Outages............................................................................................ 101 Table 18: Yuma Area Maximum Load Serving Capability................................................................ 101 Table 19: TEP Area Facility Additions ............................................................................................ 105 Table 20: TEP Area Critical Outages .............................................................................................. 105 Table 21: SIL, MLSC, and Annual Costs for Dispatch to Mitigate RMR Conditions .......................... 107 Table 22: SIL, MLSC, and Annual Costs for Dispatch to Mitigate RMR Conditions .......................... 110 Table 23: SIL, MLSC, and Annual Costs for Dispatch to Mitigate RMR Conditions .......................... 111 Table 24: Generation Projects Proposed for Interconnection in Arizona............................................. 114 Table 25: Status of Generation Plants Scheduled for Future Years .................................................... 115

Third Biennial Transmission Assessment 2004-2013 Docket No. E-00000D-03-0047 1
1. Overview
1.1 Assessment Authority
Arizona statutes require every organization contemplating construction of any transmission line within Arizona during a ten-year period to file a ten-year plan with the Arizona Corporation Commission (“ACC
or Commission”) on or before January 31 of each year.1 In 1999, the Arizona state legislature placed a statutory obligation with the ACC to biennially review the plans filed with the Commission and “issue a written decision regarding the adequacy of the existing and planned transmission facilities in Arizona to meet the present and future energy needs of the state in a reliable manner.”2
In 2001, the Arizona legislature further modified the Arizona Power Plant and Transmission Line Siting statutes resulting in two new statutory requirements related to filing of plans with the Commission. Every organization contemplating construction of a new power plant within Arizona is now required to file a plan with the Commission 90 days before filing an application for a Certificate of Environmental Compatibility (“CEC”).3 Additionally, all plans filed with the Commission are to be accompanied by power flow and stability analysis reports showing the effect of plant interconnections on the current (and future) Arizona electric transmission system.4
1.2 Previous Biennial Transmission Assessments - Conclusions and Recommendations
1.2.1 First Biennial Transmission Assessment
The Utilities Division Staff (“Staff”) of the ACC initiated its First Biennial Transmission Assessment (“BTA”) in 2000, under Docket No. E-00000A-01-0120. The Commission’s decision was rendered in July 2001.
In its First BTA, the Commission determined that the State of Arizona (“State”) transmission system was not adequate5 to provide reliable supply to the State electrical load, neither for the present nor for the future conditions.
These conclusions were based upon the following findings6:
1 A.R.S. § 40-360.02.A 2 A.R.S. § 40-360.02.G 3 A.R.S. § 40-360.02.B 4 A.R.S. § 40-360.02.C.7 5 BTA 2002-2011, Page 2 6 BTA 2002-2011, Page 2

Overview 2 November 2004
§ There was very little additional long-term firm regional transmission capacity available to export or import energy over Arizona’s transmission system.
§ Southeastern Arizona utilities relied upon restoration of service, rather than continuity of service, following transmission outages due to service via radial transmission lines.
§ There were transmission import constraints for three geographical load zones in Arizona: the Phoenix metropolitan area, Tucson, and Yuma. Planned transmission enhancements failed to resolve this situation in a timely manner.
§ The existing and planned additions to the Palo Verde transmission system failed to accommodate the full output of all new power plants proposing to interconnect at Palo Verde, requiring procedures to be developed for curtailment and scheduling restriction.
§ Some proposed power plants were being interconnected to Arizona’s bulk transmission system via a single transmission line or tie rather than continuing Arizona’s best engineering practice of multiple lines emanating from power plants.
The Commission adopted the following two concepts for Staff’s measurement of Arizona’s transmission system adequacy and security:
1. There should be sufficient transmission import capability to reliably serve all loads in a utility's service area without limiting access to more economical or a less polluting remote generation.
2. New power plants must have sufficient interconnected transmission capacity to reliably deliver their full output without use of remedial action schemes or displacing existing generation at the same interconnection for single contingency (N-1) outages.
1.2.2 Second Biennial Transmission Assessment
The Staff initiated its Second BTA in 2002, under Docket No. E-00000A-02-0065. Written decision No. 65476 of that assessment was rendered on December 19, 2002.
In its Second BTA, the Commission concluded that the electric industry had been very responsive 7 to concerns raised in its First BTA. The BTA process was built upon an extensive collaborative transmission planning process open to all stakeholders. In addition, some merchant power plant developers had begun proposing transmission system reinforcements to resolve transmission barriers to the wholesale market. Transmission providers had agreed to participate in Reliability-Must-Run (“RMR”) study processes for transmission-constrained areas with which they are interconnected. Most
7 BTA 2002-2011, Executive Summary, Page ii
Third Biennial Transmission Assessment 2004-2013 Docket No. E-00000D-03-0047 3
importantly, numerous new transmission projects had been announced and filed with the Commission since its First BTA.
The Commission concluded that the existing and planned Arizona transmission system generally met the load serving requirements of the state in a reliable manner. However, the Commission had several concerns about the adequacy of the state’s transmission system to reliably support the competitive wholesale market emerging in Arizona. These concerns included:
§ Limited access by competitive wholesale generators’ to local Arizona markets, due to local transmission import constraints, that results in local RMR generation requirements.
§ Failure of planned Palo Verde transmission system additions to accommodate the full output of all new power plants connected at the Palo Verde Hub.
§ Limited additional long-term firm transmission capacity available to export or import energy over Arizona’s transmission system.
§ A single transmission line or tie being used to connect some new power plants to Arizona’s bulk transmission system rather than continuing Arizona’s best engineering practices of multiple connections from power plants.
The above concerns are not easy to resolve. Nevertheless, the Commission approved and ordered in its Decision No. 65476 the following actions:
1. Continue to support use of the “Guiding Principles for ACC Staff Determination of Electric System Adequacy and Reliability” to aid Staff in its determination of adequacy and reliability of power plant and transmission line projects.
2. Request Staff to commence rule making proceedings to determine how: a. Utility distribution companies (“UDCs”) should ensure sufficient transmission
import capacity to reliably serve all loads in its service area without limiting access to more economical or less polluting remote generation8, and
b. New power plants should demonstrate sufficient transmission capacity exists to reliably and economically deliver their full output without use of remedial action schemes for single contingency (N-1) outages or displacing existing generation at the interconnection.
8 Each utility distribution company also has an obligation to assure that adequate transmission import capability is available to meet the load requirements of all distribution customers in its service area. This requirement is also coupled with a requirement that Arizona utilities competitively procure 100% of their standard offer requirements, with at least 50% procured through competitive bidding. This later requirement was stayed by the Commission in Decision No. 61969, for Staff to determine the proper level of competitive solicitation. Staff used these guiding principles, criteria, standards and rules for this biennial transmission assessment.

Overview 4 November 2004
3. Encourage transmission providers to continue to investigate and study, in a collaborative fashion, local area import constraints in accordance with the RMR Study Plan outlined in Section 7.2 of the 2002 BTA.
4. Continue to encourage collaborative study activities between transmission providers and merchant plant developers for the purpose of:
a. Ensuring consumer benefits of generation additions and cost–effective transmission enhancements and interconnections, and
b. Facilitating restructuring of the electric utility industry to reliably serve Arizona consumers at just and reasonable rates via a competitive wholesale market.
1.3 Third Biennial Assessment - Purpose and Framework
1.3.1 Purpose
The Commission undertook the Third BTA, which evaluates the Ten-Year transmission plans filed in January 2003 and 2004, under Docket No. E-00000D-03-0047. This report fulfills the Commission’s statutory obligation to review these transmission plans and assess whether the Arizona transmission system is adequate. The 2003 and 2004 RMR Studies are also the subject of this 2004 assessment. Of particular interest are the adjustments made by the industry to address the concerns identified in the Commission’s First and Second BTAs. Staff hired a consulting organization, KEMA Inc. (“KEMA”) to assist Staff in this effort.
The adequacy of an existing or planned electric system is determined by technical simulation studies. Such studies require the use of: databases, software and transmission planning reliability standards, and planning assumptions. The process assumes that the Arizona transmission utilities conduct their own studies, participate in the collaborative regional planning process, and present the study results in the Ten-Year Plan reports and at public workshops. Staff and KEMA reviewed and analyzed all these study reports assembled by Staff, and organized two workshops. Staff relied on the technical reports and documents filed with the Commission by the various organizations, rather than performing technical studies of their own.
Staff used a set of guiding principles to aid it in determining the adequacy and reliability of both transmission and generation systems.9 Staff’s guiding principles are based upon best engineering practices established in Arizona coupled with the use of Western Electricity Coordinating Council
9 Guiding Principles for ACC Staff Determination of Electric System Adequacy and Reliability: Appendix A Arizona’s Best Engineering Practices, Jerry D. Smith, ACC, pre -filed comments for the Gila Bend Power Plant Hearing, Docket No. E-00000V-00-0106, November 9, 2000

Third Biennial Transmission Assessment 2004-2013 Docket No. E-00000D-03-0047 5
(“WECC”)10 and North American Electric Reliability Council (“NERC”)11 planning standards. Staff and KEMA critically reviewed and analyzed the transmission planning documents assembled by Staff and addressed the following questions:
1. Do the proposed Arizona transmission system plans meet the load serving requirements of the state during the 2004-2013 period, in a reliable manner?
2. Was the transmission planning process conducted in accordance with the transmission planning principles and good utility practices accepted by the power industry?
3. What steps were taken in the new transmission planning studies to effectively address the Commission’s concerns raised in the First and Second BTA about the adequacy of the state's transmission system to reliably support the competitive wholesale market emerging in Arizona?
4. Do the generation interconnection practices in Arizona adequately reflect technical aspects of the generation interconnection policies as defined in the Federal Energy Regulatory Commission (“FERC”) Orders 2003 and 2003-A?
5. Do the transmission plans adequately reflect NERC’s latest activities related to compliance with the transmission planning standards, as well as compliance with WECC reliability standards?
1.3.2 Framework
Staff and KEMA made use of a three-stage process to facilitate the electric industry’s participation in the third BTA:
1. Workshop I: Industry Presentation;
2. Preparation of Initial Draft Report and Industry Comments on Draft; and
3. Workshop II: Staff/KEMA Presentation and Final Report.
An overview of each stage is described below.
Stage 1. Workshop I: Industry Presentation
Staff and KEMA organized and facilitated a one-day public Workshop on June 30, 2004. Transmission Providers and Regional Planning Groups presented information regarding their transmission expansion plans and related activities to supply native load customers for the next ten years. In addition, merchant transmission and wind generator developers reported on their development plans.12 The Workshop
10 http://www.wecc.biz/documents/standards/for_approval/2002JulyBODStandards.htm 11 http://www.nerc.com/~filez/pss-psg.html 12 The Workshop presentation materials are located on the ACC website: http://www.cc.state.az.us

Overview 6 November 2004
provided an informal setting to promote effective discussions of the presentations from transmission providers and merchant plant developers. The Workshop I participants13 included:
§ Arizona Transmission Providers
§ Merchant Transmission and Generation Developers
§ Arizona Power Plant and Transmission Line Siting Committee (“Siting Committee) Members
§ Consumer Advocates
§ Individual Interested Parties.14
The workshop was organized in to four panels—one for each topic. An open period of discussion and audience questions followed each panel presentation. To facilitate focused and meaningful presentations and discussions at the Workshop, Staff requested the participants to discuss four topics.
1. Regional planning updates provided by:
§ Seams Steering Group-Western Interconnection(“SSG-WI”) Planning Group
§ Southwest Transmission Expansion Plan (“STEP”)
§ Southwest Area Transmission (“SWAT”) Planning Group
2. Utilities’ Updates concerning Ten-Year Transmission Plans, providing details on transmission additions/upgrades/revisions since the Second Biennial Transmission Assessment:
§ Arizona Public Service Company (“APS”)
§ Salt River Project (“SRP”)
§ Southwest Transmission Cooperative (“SWTC”)
§ Tucson Electric Power (“TEP”) / UniSource Energy Services (“UES”)
§ Western Area Power Administration (“WAPA”)
§ Interstate Transmission Projects Located in Arizona
3. Developments at the Palo Verde Hub:
§ Risk Assessment and WECC Catastrophic Outage Guide, presented by Staff
§ Disturbances that occurred on July 28, 2003 and June 14, 2004
§ Experience of Palo Verde Hub interconnected generation plants
13 The list of Workshop I participants is included in Appendix B. 14 The Workshop presentation materials are located on the ACC website: http://www.cc.state.az.us

Third Biennial Transmission Assessment 2004-2013 Docket No. E-00000D-03-0047 7
4. National and Regional Transmission Issues including:
§ WestConnect/WesTTrans update
§ August 14, 2003 Eastern U.S. blackout implications for Arizona utilities
§ Right of way (“ROW”) vegetation management and bark beetle infestation mitigation
§ Federal reliability legislation
§ FERC large generator interconnection rule impacts
§ Technical transmission challenges re: interconnection of renewable generation
In addition to the four panels, the Staff presented their response to the 2004 RMR Study Results.
Staff’s opinion is that the Transmission Providers presented enough information to allow a suitable assessment of the status of Arizona’s transmission system reliability.
Stage 2. Preparation of initial draft report and industry comments on draft
Staff and KEMA provided the first draft of the 2004 BTA report for industry review and comment. The first draft of the report was based on the utilities’ filed plans and the participants’ responses to questions raised at Workshop I.15 The draft report and industry comments were placed on the Commission website to expedite the review process.
Stage 3. Workshop II: Staff/KEMA presentation and final report
Workshop II, organized on September 24, 2004, presented the Staff’s response to industry comments on the first draft of the 2004 BTA Report and allowed for discussion and questions. The Workshop again provided an informal setting to promote effective discussions of the presentations from transmission providers and merchant plant developers. The Workshop II participants included: 16
§ Arizona Transmission Providers
§ Merchant Transmission and Generation Developers
§ Siting Committee Members
§ Consumer Advocates
§ Service List Members.17
15 Transcripts of June 30, 2004 Workshop I 16 The lis t of Workshop II participants is included in Appendix B. 17 The Workshop presentation materials are located on the ACC website: http://www.cc.state.az.us

Overview 8 November 2004
The workshop was organized in one main session followed by an open period of discussion and audience questions. To facilitate focused and meaningful presentations and discussions at the Workshop, Staff provided a copy of the draft report several weeks before the Workshop.
The Staff and their consultant presented 5 major issues and 6 less significant issues for discussion. The 5 major issues were:
1. Near-term Palo Verde transmission’s ability to handle full generation output as discussed on draft BTA, page 3;
2. A similar issue discussed on draft BTA, page 57;
3. How the Arizona system meets the “n-1” criteria and relationship to RMR studies as discussed on draft BTA, page 3;
4. The economic viability of generators at the Palo Verde Hub as discussed on draft BTA, page 57; and
5. The responsibility of generators in regard to transmission expansion as discussed on draft BTA, page 3.
The 6 less significant issues were:
1. Specific wording regarding the RMR studies discussed on draft BTA, page 3;
2. Consistency in data used in the RMR studies as discussed on draft BTA, page 49;
3. What party should maintain a study database as discussed on draft BTA, page 19;
4. Inconsistent and inaccurate generation data in Table 15 as discussed on draft BTA, page 96;
5. The need for new capacity in the Phoenix area by 2012 in regard to RMR studies as discussed on draft BTA, page 97; and
6. The treatment of the costs assigned to un-served energy in the RMR studies as discussed on draft BTA, page 97.
In addition, there was a presentation by SRP regarding the installed generation and transmission capacity at the Palo Verde Hub during the 2000-2010 period.
All the issues presented were resolved successfully as a result of the Workshop discussions and are reflected in this final report.

Third Biennial Transmission Assessment 2004-2013 Docket No. E-00000D-03-0047 9
2. Related Regulatory Activities
This section describes selected regulatory and industry activities since the 2002 BTA. Only those activities related to transmission infrastructure, transmission grid expansion at regional and sub-regional levels, transmission congestion, transmission reliability, and transmission rights and pricing are described. This section considers how such activities relate to the transmission expansion, siting and analysis in Arizona.
2.1 Relevant FERC Orders and Actions, and Arizona Industry Response
2.1.1 FERC Activities Following the August 14, 2003 Blackout
On August 14, 2003, an electric power blackout occurred that affected large portions of the Northeast and Midwest United States and Ontario, Canada. The following day, a U.S.-Canada Power System Outage Task Force (“Task Force”) was established to investigate the causes of the blackout and recommend measures to reduce the possibility of future outages.
The Final Report of this Task Force (April 5, 2004) identified four categories of causes: 1. Inadequate system understanding;
2. Inadequate situational awareness;
3. Inadequate tree trimming; and
4. Inadequate reliability coordinator diagnostic support
Although none of the categories related to transmission planning issues, the Final Report found that several entities violated NERC operating policies and planning standards, directly contributing to the blackout. The Final Report found that many of NERC's policies are unclear and ambiguous. In addition the task force report found that tree contact with transmission lines was a precipitating factor in the blackout.
The FERC took prompt action in response to recommendations issued by the Task Force by clarifying its power grid reliability policies and objectives. In a related order, FERC directed transmission-operating utilities to report on vegetation management practices in transmission corridors.

Regulatory Activities 10 November 2004
2.1.1.1 FERC Policy Statement on Bulk Power System Reliability
FERC issued a Policy Statement on Matters Related to Bulk Power System Reliability. 18 (Issued April 19, 2004). This policy statement responded to recommendations in the U.S.-Canada Power System Outage Task Force's Interim and Final Blackout Reports on initiatives FERC should undertake. It also responded to comments submitted after FERC’s December 1, 2003 public conference on actions it should take to promote reliable transmission service in interstate commerce.
The Policy Statement clarified FERC’s policy with regard to:
§ The need to promptly modify existing bulk power system reliability standards, to translate them into clear and enforceable requirements.
§ Public utility compliance with industry reliability standards and possible FERC action to address specific bulk power system reliability issues.
§ Cost recovery of prudent bulk power system reliability expenditures.
§ The need for communication and cooperation between FERC and the States.
§ The need for communication and cooperation among FERC, Canada and Mexico regarding reliability issues.
§ Consideration of reliability in FERC’s decision-making.
§ Limitations on utility liability.
The Policy Statement immediately took the following steps:
§ No new Independent System Operator (ISO) or Regional Transmission Operator (RTO) will be allowed to begin operations until its reliability capabilities are functional.
§ FERC will consider the reliability implications of its decisions, as appropriate.
§ FERC will appoint a staff task force to report on potential funding mechanisms for NERC and the regional reliability councils to ensure their independence from the utilities they monitor. The staff task force will work closely with FERC's Canadian counterparts, state regulatory authorities, NERC, regional reliability councils and the industry.
§ FERC staff was directed to draft a memorandum of understanding (“MOU”) defining NERC's working relationship with FERC. The MOU will clarify FERC’s appropriate role in NERC oversight and the respective reliability responsibilities of both NERC and FERC.
18 FERC DOCKET No. PL04-5-000 Policy Statement on Matters Related to Power System Reliability http://www.ferc.gov/whats-new/comm-meet/041404/E-6.pdf

Third Biennial Transmission Assessment 2004-2013 Docket No. E-00000D-03-0047 11
2.1.1.2 FERC Order on Vegetation Management Practices
FERC also issued a companion vegetation management order.19 (issued April 19, 2004) FERC sought to minimize the risk of another regional blackout and ordered all entities that own, operate or control designated transmission facilities to report on their vegetation management practices by June 17, 2004.
The Order, applicable to the lower 48 states, was directed to approximately 200 transmission providers, regardless of whether they are subject to FERC’s jurisdiction as a public utility, in accordance with FERC’s reporting authority. Designated transmission facilities are power lines of 230 kV or higher as well as tie -line interconnection facilities between control areas or balancing authority areas (regardless of voltage rating) and "critical" lines as previously designated by a regional reliability council.
The Order directed the transmission providers to: § Describe in detail the vegetation management practices and standards that the provider
uses for vegetation control near designated transmission facilities;
§ List those designated facilities under the provider's control;
§ Indicate how often the facilities are inspected for vegetation management purposes and indicate when the most recent survey was completed;
§ Indicate whether any necessary remediation has been completed as of June 14, 2004; and
§ Describe any factors that prevent or unduly delay adequate vegetation management.
FERC directed that the reports also must be submitted to appropriate state regulatory commissions, NERC and the relevant reliability coordinators:
“In order that this information be received before the summer peak load season, which typically has maximum transmission line loading and continued vegetation growth, this report should be submitted by June 17, 2004 to the Commission, the appropriate State commissions20, the North American Electric Reliability Council (“NERC”) and the relevant reliability authorities.”21
19 FERC Docket No. EL04-52-000 Reporting by Transmission Providers on Vegetation Management Practices Related to Designated Transmission Facilities http://www.ferc.gov/whats-new/comm-meet/041404/E-7.pdf 20 Some transmission providers are not subject to the jurisdiction of a State Commission. We request, however, that they serve a copy of the report on all State Commissions for States in which their transmission facilities are located. 21 FERC Order Requiring Reporting by Transmission Providers on Vegetation Management Practices Related To Designated Transmission Facilities, 107 FERC ¶ 61,053, Page 1-2. A reliability authority is the entity responsible for the safe and reliable operation of the interconnected transmission system for its defined "reliability authority area." This term is replacing the term "reliability coordinator" which has the same meaning and is still in common use in many areas. The term reliability authority as used in this order refers to the corporate entity responsible for reliability, which may be called either the reliability authority or the reliability coordinator for its area.

Regulatory Activities 12 November 2004
The ACC received the vegetation management reports from Arizona utilities as required22. Arizona is commonly thought of as a desert that does not require vegetation management. This is incorrect. For example, Salt River Project (“SRP”) alone has over eight million trees to maintain in and around its utility corridors. Vegetation management in Arizona is complicated by the involvement of federal agencies. In Arizona there are five National Forests, and 22 Forest Service districts, for which Federal authorities dictate to the utility how much clearance they can or cannot give around utility lines and when they can have right of way access for such activities. Numerous forest fires in Arizona and New Mexico have placed multiple transmission lines in operational jeopardy over the past five years due to inadequate vegetation management of transmission corridors. Therefore, the ACC, and other entities involved in requiring reliable service of transmission providers need to assure vegetation management receives proper and consistent attention irrespective of land ownership.
FERC’s September 7, 2004 report23 to Congress summarizes its findings and recommendations. In this report, the FERC also recommended that Congress enact legislation providing for mandatory, enforceable reliability rules. The FERC recognized that, while the data filed in response to the Vegetation Management Order revealed each transmission owner’s practice, it did not directly address how effective the practice has been in limiting preventable transmission line outages. The FERC did not ask for such data in the April request, because similar data are now being reported to the WECC and to NERC.
Transmission owners reported that they were not able to acquire all necessary permits to maintain their rights-of-way from various federal and state agencies. The transmission owners reported that vegetation management approvals on federally managed rights-of-way are particula rly problematic in the Western United States. However, FERC stated that this problem could be alleviated, at least in part, if the acquisition of these permits is made a higher priority on the part of transmission owners. For instance, transmission owners could allow additional lead-time to acquire many needed permits. The agencies responsible for issuing permits, however, should ensure that they have clear rules and procedures for issuing permits in a timely manner.
The FERC believes that better coordination among federal agencies and between the federal and state governments to develop clear, consistent policies and procedures for timely and effective vegetation management by transmission owners could help to alleviate many real and perceived obstacles to proper vegetation management.
22 These reports are available on FERC’s website. 23 Utility Vegetation Management and Bulk Electric Reliability Report from the Federal Energy Regulatory Commission, September 7, 2004.
FERC reported that Tucson Electric Power Co. did not perform all identified vegetation management remediation by the June 14, 2004 reporting date. Upon further review of the data submitted by TEP to FERC and the ACC and comments relative to the draft BTA Staff has determined that TEP had performed vegetation management remediation required for reliable operation of their system through the summer of 2004 and had delayed some additional vegetation management of a non-critical nature until the winter season..

Third Biennial Transmission Assessment 2004-2013 Docket No. E-00000D-03-0047 13
Summary of FERC’s Recommendations
1. The United States Congress should enact legislation to make reliability standards mandatory and enforceable under federal oversight.
2. Effective transmission vegetation management requires clear, unambiguous, enforceable standards that adequately describe actions necessary by each responsible party.
3. With respect to any jurisdictional issue that may arise involving vegetation management, it is important that state and federal regulators continue to coordinate so that jurisdictional considerations do not impede effective vegetation management.
4. Federal and state regulators should allow reasonable recovery for the costs of vegetation management expenses.
5. While permitting and environmental requirements properly protect public lands, the procedures implementing those protections may be inconsistent and time-consuming and have the potential to significantly hinder transmission vegetation management. The FERC should work with the Council on Environmental Quality (“CEQ”) and land management agencies to better coordinate these requirements.
6. Federal, state and local land managers should develop “rush” procedures and emergency exemptions to allow utilities to correct “danger” trees24 that threaten transmission lines, from both on and off documented rights-of-way.
7. Five-year vegetation management cycles should be shortened, and the FERC and states should look at the cost-effectiveness of more aggressive vegetation management practices.
8. Transmission owners should fully exercise their easement rights for vegetation management and better anticipate and manage the permitting process for scheduled vegetation management.
9. Variances in vegetation management practices may be resolved in the NERC vegetation management standard development process; if they are not, the FERC may seek to convene the industry, states and other stakeholders to address the remaining issues.
10. State regulators and the utility industry should work through the National Association of Regulatory Utility Commissions (“NARUC”), the National
24 A danger tree is a tree that is dead or dying and has the potential to fall into a right-of-way close to a line.

Regulatory Activities 14 November 2004
Conference of State Legislators, and other organizations to help state and local officials better understand and address transmission vegetation management.
2.1.2 FERC Large Generation Interconnection Standards
On July 24, 2003, FERC issued Order 2003, Standardization of Generator Interconnection Agreements and Procedures.25 The Final Rule became effective on October 20, 2003. The FERC adopted this rule to be used by Transmission Providers with Interconnection Customers proposing to interconnect a generator of more than 20 MW. The FERC initially required that all transmission providers amend their Open Access Transmission Tariffs (“OATT”) with the new standards by the end of October 2003. However, the October deadline was extended until January 20, 2004.
Summary of Final Rule
The final rule is composed of two parts: 1. Standard Large Generator Interconnection Procedures (“Final Rule LGIP”) sets
forth the procedures that Interconnection Customers and Transmission Providers are required to follow during the interconnection process. The Final Rule LGIP sets forth the legal rights and obligations of each party, addresses cost responsibility issues, and establishes a process for resolving disputes; and
2. Standard Large Generator Interconnection Agreement (“Final Rule LGIA”) applies to any new Interconnection Request to a Transmission Provider's Transmission System. New Interconnection Requests include those submitted after the effective date of this Final Rule and include requests to increase the capacity of, or modify the operating characteristics of, an existing Generating Facility that is interconnected with the Transmission Provider’s Transmission System. The FERC is not requiring any retroactive changes to individual (versus generic) interconnection agreements filed with the FERC prior to the effective date of this Final Rule.26
In its March 3, 2004 Order No. 2003-A, FERC reaffirmed its July 2003 rule (“Order 2003”).27 Responding to requests for clarification of its pricing policy for network upgrades, FERC made it clear that the transmission provider continues to have the option to charge the interconnected customer a transmission rate that is the higher of the incremental cost rate for the network upgrades required to 25 FERC Docket No. RM02-1-000; Order No. 2003, Standardization of Generator Interconnection Agreements and Procedures, (Issued July 24, 2003) http://www.ferc.gov/whats-new/comm-meet/072303/E-1.pdf 26 Docket No. RM02-1-000, Order 2003, July 24, 2003, Page 2 27 FERC Docket No. RM02-1-001; Order No. 2003-A, Standardization of Generator Interconnection Agreements and Procedures, (Issued March 3, 2004) http://www.ferc.gov/whats -new/comm-meet/030304/E-1.pdf

Third Biennial Transmission Assessment 2004-2013 Docket No. E-00000D-03-0047 15
interconnect its generating facility or the average embedded cost rate for the entire transmission system (including the cost of the network upgrades). FERC emphasized that allowing transmission providers to charge the “higher of” rate ensures that other transmission customers, including the transmission providers’ native load, will not subsidize network upgrades required to interconnect merchant generation.
FERC granted rehearing on two aspects of Order 2003’s method for reimbursing generators for the cost of financing network upgrades needed to complete the interconnection:
1. They will no longer require the transmission provider to provide credits to the interconnection customers for all of the transmission delivery services it takes on the system; instead credits are provided only for the transmission delivery service taken by the interconnecting generating facility.
2. They will allow the transmission provider to choose, five years from the commercial operation date of the generating facility, whether to reimburse the interconnection customer at that time for any remaining balance of the cost of financing network upgrades and accrued interest, or continue to provide credits beyond five years until no balance remains.
FERC also concluded, as it did in Order 2003, that it would allow additional flexibility to interconnection pricing proposals that are filed by an independent transmission provider. An independent transmission provider does not have an incentive to discourage new generation by competitors, and should be afforded more flexibility in manner of cost recovery. Consequently, an independent transmission provider has no obligation to reimburse generators for the financing of the network upgrades, but rather has an opportunity to offer transmission rights and financial products instead.
The new Generation Interconnection Standards establishes two types of interconnection: § Energy Resource Interconnection Service that allows the Interconnection Customer to
connect the Large Generating Facility to the Transmission System and be eligible to deliver the Large Generating Facility's output using the existing firm or non-firm capacity of the Transmission System on an "as available" basis. The interconnecting generator must make a separate application for transmission service with the Transmission Provider for transmission service. Energy Resource Interconnection Service does not provide any rights for transmission service. This type of interconnection usually requires minimal network upgrades if any.
§ Network Resource Interconnection Service requires the Transmission Provider to conduct the necessary studies and construct the Network Upgrades needed to integrate the Large Generating Facility: (1) in a manner comparable to that in which the Transmission Provider integrates its generating facilities to serve native load customers; or (2) in an Independent System Operator (“ISO”) or Regional Transmission Organization (“RTO”) with market based congestion management, in the same manner as all Network

Regulatory Activities 16 November 2004
Resources. Network Resource Interconnection Service does not provide any rights for transmission service; however, it does qualify the resource to serve network customer load using the transmission system.
An Energy Resource type of interconnection adopts the “minimum interconnection standard” that FERC established via numerous precedents to Orders 2003 and 2003-A. This type of interconnection usually does not require any network upgrades. Interconnecting a new generator at a substation that does not have sufficient transmission capacity to deliver the generator's full output for all load conditions and transmission system topologies, creates a generation pocket. This could require reducing the generator’s output or automatic unit tripping.
The Arizona utilities’ presentations at Workshop I provided useful information on generation interconnection requests in Arizona.28 Each transmission provider maintains its own generation interconnection queue, and keeps it publicly available at the utility page of the WesTTrans.net Open Access Same-time Information System (“OASIS”) website.29 For jointly owned facilities the operating agent takes the lead in the study work and shares results with the other owners. The Palo Verde transmission system has an interconnection procedure explicitly describing the steps required for generation interconnection with the hub. In the Palo Verde Hub case, there is also an ad hoc group, which looks at those impacts.
While this procedure complies with FERC Orders 2003 and 2003A, it would be valuable, from the Arizona resource planning perspective, that an organization such as SWAT maintains an integrated generation interconnection queue for the whole state. This integrated list would not have any legal implication on execution of the required studies or interconnection agreements, but would provide a quick insight on generators’ overall interest to interconnect in Arizona.
With regards to generation interconnection in Arizona, an additional problem is driven by the fact that many transmission lines are jointly owned by jurisdictional and non-jurisdictional entities. When this issue was raised before FERC, jurisdictional transmission providers, in cooperation with the non-jurisdictional entities, were instructed to propose changes to the ir joint participation agreements. Non-jurisdictional transmission entities may not pay transmission credits in the exact way jurisdictional entities must. Non-jurisdictional utilities with Safe Harbor Open Access Transmission Tariffs (“OATTs”), such as SRP, WAPA and SWTC, are required to charge rates for interconnections that are comparable to what such non-jurisdictional transmission entities charge their own or affilia ted generation for interconnection.
28 Workshop I Transcript, Page 167, Lines 17-25, and Page 168, line 1-6 29 The wesTTrans.net OASIS http://www.oatioasis.com/cwo_default.htm

Third Biennial Transmission Assessment 2004-2013 Docket No. E-00000D-03-0047 17
Western utilities, including Arizona’s, filed proposed variations from the pro forma LGIP and LGIA.
The utilities stated that the proposed variations were based on existing regional reliability standards applicable to WECC,
the Northwest Power Pool (“NWPP”),
and the Southwest Reserve Sharing Group
(“SRSG”). In its June 4, 2004 Order, FERC accepted in part, rejected in part, and modified in part, the
proposed regional reliability variations.30 It appears that FERC approved all significant reliability-standard related requirements.
2.1.3 FERC Standard Market Design
As noted in the 2002 BTA Assessment, FERC proposed a Standard Market Design (“SMD”). The purpose of the SMD was to have all regions of the US implement standardized wholesale power markets. FERC originally anticipated that a final SMD rule would be approved in 2003. However, due to the objections of numerous stakeholders, state regulators and Congressional delegations, FERC has not acted to finalize the rule.
FERC issued a White Paper entitled “Wholesale Power Market Platform” responding to the comments on FERC’s SMD proposal and providing direction for the final rule.31 The White Paper focuses on the formation of RTOs, and on sound wholesale market rules for all independent transmission organizations. Additionally, the White Paper indicates that the final rule will allow variable implementation schedules, depending on local needs.
According to the White Paper, the final ruling will focus on: § The formation of RTOs; and
§ Ensuring that all RTOs and ISOs have good wholesale market rules in place.
The final rule will require public utilities to join an RTO or ISO. The final rule will also allow for phased-in implementation customized to each region. FERC states that certain elements need to be in place for successful wholesale markets:
§ Regional Transmission Planning Process – FERC maintains that regional planning of the transmission grid is essential. The Final Rule will require technical assessments of the regional grid by the RTO or ISO. FERC expects the Final Rule to require the RTOs and ISOs to have a regional planning process in place as soon as possible.
§ Fair Cost Allocation for Existing and New Transmission – Costs associated with the existing grid (other than those directly assigned) will continue to be recovered though rates. The rates should be structured to allow customer access across multiple utility
30 http://www.ferc.gov/EventCalendar/Files/20040607074124-ER04-442-000.pdf 31 FERC White Paper: Wholesale Power Market Platform, (Issued April 28, 2003) http://www.ferc.gov/industries/electric/indus-act/smd/white_paper.pdf

Regulatory Activities 18 November 2004
grids in a region at a single rate. Regional state committees may agree on the form of access charge that will be filed by the RTO or ISO.
§ Market Monitoring and Market Power Mitigation – FERC intends to look closely at mitigation proposals to assure suitability for the RTO’s or ISO’s regional markets and for their compatibility with neighboring RTOs and ISOs.
§ Spot Markets to Meet Customers’ Real-Time Energy Needs – Under the Final Rule, the RTO or ISO will be constrained to use a real-time market for energy to resolve imbalances. The RTO or ISO in each region will be required to develop detailed market rules that will be included in the tariffs filed with FERC. Additionally, the RTO or ISO will be required to introduce a day-ahead market and a market for various ancillary services.
§ Transparency and Efficiency in Congestion Management – Regions will be required to develop a congestion-management approach that will protect against manipulation, will use the grid efficiently, and will promote use of the lowest cost generation.
§ Firm Transmission Rights (“FTRs”) – Those RTOs and ISOs that use location marginal pricing to manage congestion will be required to make firm physical transmission service available to customers. In the Final Rule, RTOs or ISOs that have not addressed FTRs will be required to do so.
§ Resource Adequacy Approaches – In the Final Rule, each region with an RTO or ISO will determine how it will ensure that there are adequate regional resources to meet customers’ needs.
Regional Independent Grid Operation – RTOs must meet the four minimum characteristics of independence, scope and regional configuration, operational authority, and short-term reliability. FERC notes that the lack of independence provides an incentive for those who own generation and operate transmission facilities to operate the system in ways that exclude competing suppliers and can allow the exercise of market power. This conflict of interest can be remedied through structural separation of transmission operation from other wholesale market activities.
FERC states that regional operation is crucial to reliability and efficiency. The final rule will allow flexibility on the scope and configuration of RTOs and ISOs, and will not require ISOs to meet the scope and regional configuration requirement. However, interregional coordination between RTOs and ISOs must be actively pursued.

Third Biennial Transmission Assessment 2004-2013 Docket No. E-00000D-03-0047 19
2.1.4 Update on the FERC RTO Order 2000 and WestConnect RTO
FERC’s Order 2000 presents FERC’s desire for RTOs across the continental United States.32 ISOs and RTOs have in fact been implemented in the Northeast part of the country (“PJM”, “NY-ISO”, “ISO-NE”), the Midwest region (“MISO”), and in California (“CAISO”).
FERC’s April 28, 2003 FERC White Paper emphasized their strong commitment to customer-based, competitive wholesale power markets, while underscoring an increasingly flexible approach to regional needs and outlining step-by-step elaborations of its key market design proposal. In its final rule, the White Paper said FERC would focus on the formation of RTOs and on ensuring that all independent transmission organizations have sound wholesale market rules. The final rule would allow implementation schedules to vary depending on local needs, and would allow for regional differences. The White Paper notes that FERC’s proposal has taken into consideration the experiences in this country and abroad in electric market design, including the effects of supply shortages, demand that does not respond to high prices, lack of price transparency in the marketplace, and the importance of market monitoring and market power mitigation.
In September 2001, Arizona Public Service Company, El Paso Electric Company, Public Service Company of New Mexico and Tucson Electric Power Company filed with FERC a Request for Declaratory Order that the proposed WestConnect RTO, developed through an open, participatory process that included, among others, Salt River Project and Western Area Power Administration, met the requirements of Order 2000. FERC issued a Declaratory Order on WestConnect in October 2002, conditionally accepting the filing. However, in its Declaratory Order and subsequent Order on Rehearing, FERC removed some of the transmission owners’ “must have” features and called into question the ultimate acceptability of others.
In response to FERC’s orders on the WestConnect RTO filing and the FERC SMD White Paper, issued April 2003, Southwest transmission owners, including investor-owned and non-jurisdictional utilities, decided to pursue development of a phased approach for the incremental and cost-effective implementation of wholesale transmission market improvements in the Southwest region that bring identified benefits to transmission customers. One of the significant steps in WestConnect’s phasing was partnering with other western utilities, including a number of non-jurisdictional transmission owners, to implement WesTTrans.net. WesTTrans.net is a common OASIS platform operated by a third party that is open to participation by all transmission providers in the Western Interconnection. The wesTTrans.net OASIS platform went on-line in March 2004 and now has 20 participating transmission owners.
WestConnect parties are working on steps to augment regional market interface and increase transmission market transparency. It will continue to work with stakeholders to identify additional cost-effective solutions to existing transmission market challenges that will benefit transmission customers. 32 FERC Order 2000, http://www.ferc.gov/legal/ferc -regs/land-docs/RM99-2A.pdf
Regulatory Activities 20 November 2004
2.2 Arizona Corporation Commission Actions
2.2.1 Arizona Implementation of Special Reliability Requirements
In order to obtain ACC Staff support for approval of applications for Certificate of Environmental Compatibility (“CEC”), new generators in Arizona cannot rely on generator unit tripping for a single transmission facility outage.33 Staff’s position is based on a principle that requires that adequate transmission is planned to assure reliable service of the full output of all interconnected generation without having to implement congestion management for single contingency transmission outages. In other words, Arizona wants energy from new generation to be firm rather than offered on an “as available basis.” This would imply Arizona’s preference for generation with Network Resource Interconnection Service as defined by FERC. The Commission has endorsed Staff’s position that generators and load serving entities share the obligation to ensure adequate and reliable transmission service in Arizona.34 Consequently, new generators are required before commencing commercial operation to demonstrate adequate transmission delivery without relying on remedial action such as generator tripping, load shedding or remedial action schemes for single contingency transmission outages.
Some of the new generation interconnections at the Palo Verde Hub have failed to adhere to this planning philosophy and therefore lack adequate near-term transmission capacity to deliver to some markets. By interconnecting via single transmission lines to the Palo Verde Hub these generation projects have also jeopardized the regional system reliability and supply for extreme outage contingencies. This practice also limits Arizona load serving entities’ purchase of firm capacity from such units unless they are willing to raise their own system reserve requirements for loss of these units as their largest single hazard. The recent practice of electronic tagging (“E-tag”) such merchants’ unit contingent power as a firm transmission transaction has also just recently become an issue for the WECC Operating Committee.
For the above reasons, Staff joined APS and SRP in sponsoring a new WECC planning guideline for consideration of extreme contingencies at large generation hubs. The guideline has gone through the WECC comment period and is not being pursued further due to lack of industry support. Nevertheless, Staff, APS and SRP have committed to implementing such guidelines in Arizona irrespective of WECC inaction. 35 In addition, Staff has been actively discussing with FERC Staff the need for a more balanced approach to considering reliability versus commercial practices both in a planning context and an operational context.
33 Guiding Principles for ACC Staff Determination of Electric System Adequacy and Reliability – See Appendix A, Generation, Under 1 34 Second BTA, Decision No. 65476. 35 Palo Verde to Southwest Valley (RUDD) 500 kV Line, Docket No. L-00000D-01-0115, Condition No. 23.

Third Biennial Transmission Assessment 2004-2013 Docket No. E-00000D-03-0047 21
2.2.2 Electric Re-Structuring Activities
The Commission issued a procedural order on January 22, 2002, which opened a generic docket on electric restructuring.36
A subsequent procedural order issued on February 8, 2002, served the purpose of consolidating the generic docket with the following related cases already active before the Commission:
§ Docket No. E-01345A-01-0822, APS variance request to A.A.C. R14-2-1606
§ Docket No. E-01933A-02-0069, TEP variance request to certain competition rule compliance dates
§ Docket No. E-01933A-98-0471, TEP application for approval of its stranded cost recovery
§ Docket No. E-00000A-01-0630, Proceedings concerning the Arizona Independent Scheduling Administrator (“AzISA”)
§ Docket No. E-00000A-02-0051-ETAL
§ Decision No. 65154 – Track A Proceedings
§ Decision No. 65143 – Track B Proceedings
The Track A proceeding concluded with a decision rendered by the Commission on September 10, 2002. 37
The opinion and order approved by the Commission was in general agreement with Staff’s recommendations on transmission issues and encouraged an industry-wide planning process to resolve transmission constraints.38
The Commission also believed that both transmission providers and merchant power plants should share the burden and obligation to resolve Arizona's transmission constraints. The FERC Order 2003 from July 2003 and 2003 A from March 2004 set up the clear rules on cost allocation and crediting policy related to the transmission upgrades now required for the new generators.
At the Track A hearing, APS agreed that all generators designated as network resources, including both utility and merchant generators, would have access to transmission currently used by the utilities to serve their native load customers. There was also testimony establishing that existing transmission constraints in Arizona will limit APS’ (and TEP’s) ability to deliver competitively procured supply to less than the required 50% of Standard Offer Service load.
2.2.3 Commission Concern on Local Area Transmission Constraints and RMR
The transmission constraints limiting APS’ and TEP’s ability to comply with the aforementioned Commission rules result from their dependence upon local RMR generation to serve their peak load 36 ACC Staff Report on the Generic Electric Restructuring, Docket No. E-00000A-02-0051, March 22, 2002 37 Decision No. 65154, Docket No. E-00000A-02-0051, et al., September 10, 2002. 38 Ibid, page 25 at line 23.

Regulatory Activities 22 November 2004
during certain hours of the year. RMR needs result from an economic decision to balance local generation and transmission capabilities to serve loads in the most economical manner. The Track A order stipulates that APS and TEP are to work with Staff to develop a 2002 study process to resolve RMR generation concerns and that such study plan results are to be included in the 2004 Biennial Transmission Assessment.39
This includes studying and analyzing the merits of existing dependence on RMR generation instead of building transmission to resolve transmission import constraints, and the merits of any future contemplated utilization of RMR to defer transmission projects. Until the 2004 Biennial Transmission Assessment is issued with RMR study plan results resolved, APS and TEP are to file annual RMR study reports with the Commission in concert with their January 31 annual ten-year plan for review prior to implementing any new RMR generation strategies.40
The 2003 and 2004 RMR procedural overview, defined through the ACC Track A Decision No. 65154, required that RMR studies be filed by APS and TEP (with the cooperation of the industry) by January of 2003. These studies were to analyze the 2003 – 2005 time-period. By January of 2004, APS and TEP were to complete their study efforts extending the time frame out for the 10-year period. Results of both RMR study efforts have been incorporated into the 2004 BTA report.
2.2.4 2003 Competitive Resources Solicitation
The Commission’s retail electric competition rules, in place since September 29, 1999, required that at least 50% of the power supply for Standard Offer Service by an investor owned utility distribution company (“UDC”) will be purchased through a competitive bid process.41
That same UDC has the obligation to assure that adequate transmission import capability is available to meet the load requirements of all distribution customers within its service area.
In its Track A order, the Commission stayed Rule 14-2-1606.B and required APS and TEP to competitively procure no less than all of Standard Offer Service requirements that they could not supply from utility-owned resources.42 Actions by the Commission and the utilities in 2002 and 2003 resulted in a competitive solicitation by APS and TEP for some generation requirements. That was referred to as Track B proceedings. The Track B proceedings decision43 required that the results of the 2003 - 2005 RMR studies should be reflected in the contestable load requirements that those two utilities would be required to bid in their competitive solicitation. The industry responded very effectively in getting that RMR information in a very short period of time.
39 Decision No. 65154, Docket No. E-00000A-02-0051, et al., September 2002. 40 Ibid, Finding of Fact 41. 41 A.A.C R14-2-1606.B, Decision No. 61969. 42 For this analysis, APS generation does not include the Redhawk and West Phoenix units owned by PWEC. 43 Track B, Final Decision No. 65743, Docket No. E-00000A-02-0051
Third Biennial Transmission Assessment 2004-2013 Docket No. E-00000D-03-0047 23
2.2.5 Arizona Electric Utility Reorganizations
Two major utility reorganizations have occurred in Arizona since the Second BTA report was issued. The Arizona Electric Power Cooperative (“AEPCO”) reorganized into three affiliate organizations to facilitate its participation in electric competition and direct access in Arizona. The resulting affiliates are the AEPCO generation affiliate, a transmission affiliate – Southwest Transmission Cooperative (“SWTC”), and a marketing affiliate – Sierra Southwest Cooperative Services. Secondly, UniSource Energy Corporation acquired the Citizens Utilities electric and gas facilities in Arizona and formed two new affiliates in 2003, UniSource Energy Services (“UES”) and UES Gas. There is a UniSource Energy Corporation application currently pending before the Commission seeking approval for purchase by a private investor group.
The Commission also has a third reorganization pending in the APS rate case. APS proposes to acquire and rate base its affiliate’s, Pinnacle West Energy Corporation, Arizona generation assets. There are a number of economically stressed new merchant plants currently constructed in Arizona in search of a sufficiently robust market or new ownership. This may lead to other acquisitions and mergers in the local industry.
2.2.6 Arizona Independent Scheduling Administrator (“AzISA”)
The AzISA is a non-profit corporation, created in 1998 under the laws of the state of Arizona, for the purpose of facilitating the development and function of competitive retail markets in Arizona. AzISA was created according to a Commission rule, which stipulates that the affected utilities that own and operate Arizona transmission facilities shall form an Arizona independent scheduling administrator.44 AzISA is focused on administrating Arizona retail transmission transactions according to protocols on file with FERC while WestConnect will be focused on all transmission transactions that occur within the RTO and with other RTOs.
The following planning related functions are required of AzISA, under R14-2-1609 (D):
§ The AzISA shall implement a transmission planning process that includes all AzISA participants and aids in identifying the timing and key characteristics of required reinforcements to Arizona transmission facilities to assure that the future load requirements of all participants will be met.
§ The AzISA Board adopted a staged implementation of its functions based on the extent to which a robust retail market would develop, and the status of implementing a Desert Star or WestConnect RTO. As a result of this staged implementation, the planning functions were postponed to Phase II of AzISA’s implementation plans. Important functions such
44 A.A.C. R14-2-1609.D.

Regulatory Activities 24 November 2004
as dispute resolution for those serving the competitive load in Arizona, and monitoring of OASIS functions, are included in Phase I of AzISA’s implementation.
§ AzISA was also to participate in state transmission planning studies such as those of the Central Arizona Transmission System (“CATS”) and Western Area Transmission System (“WATS”) study groups. AzISA’s role in such studies is to ensure that CATS satisfactorily addresses retail transmission needs and identifies transmission enhancements that would increase the load-serving capability in Arizona.
2.3 Western Governors Association Efforts
While it is not a regulatory body, the Western Governors Association (“WGA”) is addressing inter-state
bulk-power reliability coordination. Recent actions that took place in the West to advance the Governors’
energy policies for the region include the following:45
§ The Seams Steering Group-Western Interconnection issued its first
interconnection wide transmission plan, Framework for Expansion of the
Western Interconnection Transmission System, in October of 2003.
§ Sub-regional transmission planning has commenced on a grand scale in the
Western Interconnection:
– The Rocky Mountain Area Transmission (“RMAT”) study was launched in
September of 2003,
– The Southwest Transmission Expansion Planning (“STEP”) group completed
its first annual report and continues to study transmission needs between
Arizona, Southern California, Southern Nevada area and Northern Mexico,
– The CATS forum has concluded its third annual report and in 2004 morphed
into a larger sub-regional study forum called Southwest Area Transmission
(“SWAT”) that is considering transmission needs for Arizona, New Mexico,
Southern California , Nevada, Utah, and Colorado area and
– The Northwest Transmission Alternatives Committee (“NTAC”).
45 Western Governors’ Association 2003 Annual Report and Western Go vernor’s Association 2004 Annual Report.

Third Biennial Transmission Assessment 2004-2013 Docket No. E-00000D-03-0047 25
§ Twelve Governors and four federal agencies have signed the WGA Transmission
Permitting Protocol that provides for the collaborative review of proposed
interstate transmission lines.
§ A project has been launched to develop an interconnection-wide market for
Renewable Energy Certificates.
§ The value of a regional electricity body is currently being explored.
In April of 2004, the Western Governors' Association convened a North American Energy Summit. Summit participants discussed energy supply, demand and infrastructure issues facing the United States, Canada, and Mexico. Summit recommendations and action items were developed during breakout sessions in five general areas:46
§ Ensuring an efficient and reliable electricity system in the North American West.
§ Financing infrastructure development and new technologies – attracting capital, risk management and cross-border cooperation.
§ Developing renewable energy and increasing energy efficiency.
§ Seeking cooperative action on laws and policies across state, tribal, and international borders.
§ Guiding the future of oil, natural gas, coal and nuclear energy – clean
technologies, supply and demand, emission and waste strategies, carbon
sequestration, gasification and transportation.
Specific Summit recommendations relevant to transmission included:
1. In regard to Providing a Reliable and Efficient Western Electricity Grid the Governors should:
§ Support mandatory reliability standards. § Create a formal inter-regional state entity.
– Work with FERC to address competitive western wholesale markets, while states retain decisions on retail access.
– Ensure regional coordination on transmission planning/expansion. – Address financing of new transmission.
46 Western Governors’ Association, North American Energy Summit, April 16, 2004 Breakout Group Recommendations

Regulatory Activities 26 November 2004
§ Support the review and reform, if needed, of state transmission certification and siting laws. – Process should determine need first. – WGA Protocol is a good start on interstate coordination.
§ Support a phased approach to meeting the objectives of independent system operator/regional transmission organizations.
§ Support the development of vibrant and secure regional electricity markets that include a diverse mix of supply (including renewables) and demand resources.
§ Support efforts to stimulate the deployment of new transmission technologies. § Support funding for corridor designation work on federal lands. § Support expanded funding for training of electric system engineers (e.g., via
universities) and thereby expand the supply of engineers. § Recognize that Attorneys General need to be involved.
2. In regard to Fuel Choice and Transmission the Governors should:
§ Advocate the formulation and adoption of Transmission Policy. § Level the playing field between generation and power supply options. § Full utilization of existing transmission capacity, before building new. § Elimination of discriminatory practices: rate pancaking, renewables. § Proper cost allocation: beneficiaries and grid reliability.
– Legitimize the regional transmission planning venues within the WGA footprint.
§ Stakeholder Input: governmental, tribal, public, and industry. § Consideration of power supply and generation options: remote and at load. § Proactive: lead-time for transmission is longer than for generation. § Incentives for renewables (PTC) and improved environmental performance.

Third Biennial Transmission Assessment 2004-2013 Docket No. E-00000D-03-0047 27
3. Transmission Planning
Individual utilities within the state of Arizona plan and design their bulk transmission systems in accordance with the NERC, WECC regional Reliability Criteria for System Planning and Minimum Operating Reliability, guidelines established at the state level, and their own internal planning criteria, guidelines and methods. These planning practices are utilized to ensure that their respective systems are planned to provide reliable service to customers under various system conditions. In addition, they ensure that neighboring utilities and neighboring states plan their systems in a coordinated manner by following a consistent set of standards, guidelines and criteria in order to provide an economical and reliable supply of electricity.
This chapter addresses the standards and processes used by the Arizona utilities in developing transmission.
3.1 Transmission Reliability Standards
3.1.1 NERC Reliability Standards
The interconnected bulk electric systems in the United States, Canada, and the northern portion of Baja California, Mexico are comprised of many individual systems. Each system has its own: electrical characteristics; set of customers; geographic, weather, and economic conditions; and regulatory and political climates. By their very nature, the bulk electric systems involve multiple parties. Since all electric systems within an integrated network are electrically connected, whatever one system does can affect the reliability of the other systems. Therefore, to maintain the reliability of the interconnected bulk electric systems, all electric industry participants are required to comply with the NERC Planning Standards.
The NERC Planning Standards define the reliability of the interconnected bulk electric systems using the following two terms:
Adequacy — The ability of the electric systems to supply the aggregate electrical demand and energy requirements of their customers at all times, taking into account scheduled and reasonably expected unscheduled outages of system elements.
Security — The ability of the electric systems to withstand sudden disturbances such as electric short circuits or unanticipated loss of system elements.
It is usually considered that adequacy is related to system planning and security is related to system operation.

Transmission Planning 28 November 2004
NERC requires that systems must be planned to withstand the more probable forced outage and maintenance outage system contingencies at projected customer demand and anticipated electricity transfer levels. Extreme but less probable contingencies measure the robustness of the electric systems and should be evaluated for risks and consequences. NERC has four basic planning standards:47
S1. The interconnected transmission systems shall be planned, designed, and constructed such that with all transmission facilities in service and with normal (pre-contingency) operating procedures in effect, the network can deliver generator unit output to meet projected customer demands and provide contracted firm (non-recallable reserved) transmission services, at all demand levels, under the conditions defined in Category A of Table 1.
S2. The interconnected transmission systems shall be planned, designed, and constructed such that the network can be operated to supply projected customer demands and contracted firm (non-recallable reserved) transmission services, at all demand levels, under the conditions of the contingencies as defined in Category B of Table 1.
The transmission systems also shall be capable of accommodating planned bulk electric equipment maintenance outages and continuing to operate within thermal, voltage, and stability limits under the conditions of the contingencies as defined in Category B of Table 1.
S3. The interconnected transmission systems shall be planned, designed, and constructed such that the network can be operated to supply projected customer demands and contracted firm (non-recallable reserved) transmission services, at all demand levels, under the conditions of the contingencies as defined in Category C of Table 1. The controlled interruption of customer demand, the planned removal of generators, or the curtailment of firm (non-recallable reserved) power transfers may be necessary to meet this standard.
The transmission systems also shall be capable of accommodating planned bulk electric equipment maintenance outages and continuing to operate within thermal, voltage, and stability limits under the conditions of the contingencies as defined in Category C of Table 1.
S4. The interconnected transmission systems shall be evaluated for the risks and consequences of a number of each of the extreme contingencies that are listed under Category D of Table 1.
(NERC Planning Standards, September 16, 1997, Page 9-10)
In summary, NERC requires that transmission systems should be planned to withstand both single contingency (Category B), and double or multiple contingencies (Category C). In addition NERC requires that transmission systems should be planned to withstand the same set of contingencies with one bulk facility out of service for planned maintenance. The extreme contingencies (Category D) require that transmission systems be evaluated for the risks and consequences, but not for planning reinforcements.
47 NERC Planning Standards, September 16, 1997 ftp://www.nerc.com/pub/sys/all_updl/pc/pss/ps9709.pdf

Third Biennial Transmission Assessment 2004-2013 Docket No. E-00000D-03-0047 29
Table 1: NERC Transmission System Standards-Normal and Contingency Conditions
Contingencies
System Limits or Impacts
Category
Initiating Event(s) and Contingency Element(s)
Elements
Out of Service
Thermal Limits
Voltage Limits
System Stable
Loss of Demand or
Curtailed Firm Transfers
Cascading c Outages
A - No Contingencies
All Facilities in Service
None
Applicable
Rating a (A/R)
Applicable
Rating a (A/R)
Yes
No
No
Single Line Ground (SLG) or 3-Phase (3Ø) Fault, with Normal Clearing:
1. Generator 2. Transmission Circuit 3. Transformer
Loss of an Element without a Fault.
Single Single Single Single
A/R A/R A/R A/R
A/R A/R A/R A/R
Yes Yes Yes Yes
No b No b No b No b
No No No No
B - Event resulting in the loss of a single element.
Single Pole Block, Normal Clearingf:
4. Single Pole (dc) Line
Single
A/R
A/R
Yes
Nob
No
SLG Fault, with Normal Clearing f:
1. Bus Section 2. Breaker (failure or internal fault)
Multiple Multiple
A/R A/R
A/R A/R
Yes Yes
Planned/Controlledd Planned/Controlledd
No No
SLG or 3Ø Fault, with Normal Clearingf, Manual System Adjustments, followed by
another SLG or 3Ø Fault, with Normal Clearingf: 3. Category B (B1, B2, B3, or B4) contingency, manual system adjustments,
followed by another Category B (B1, B2, B3, or B4) contingency
Multiple
A/R
A/R
Yes
Planned/Controlledd
No
Bipolar Block, with Normal Clearingf:
4. Bipolar (dc) Line Fault (non 3Ø), with Normal Clearingf:
5. Any two circuits of a multiple circuit towerlineg
Multiple Multiple
A/R A/R
A/R A/R
Yes
Yes
Planned/Controlledd Planned/Controlledd
No No
C - Event(s) resulting in the loss of two or more (multiple) elements.
SLG Fault, with Delayed Clearing f (stuck breaker or protection system failure):
6. Generator 8. Transformer 7. Transmission Circuit 9. Bus Section
Multiple Multiple
A/R A/R
A/R A/R
Yes Yes
Planned/Controlledd Planned/Controlledd
No No

Transmission Planning 30 November 2004
D e - Extreme event resulting in two or more (multiple) elements removed or cascading out of service
3Ø Fault, with Delayed Clearing f (stuck breaker or protection system failure):
1. Generator 3. Transformer 2. Transmission Circuit 4. Bus Section
3Ø Fault, with Normal Clearingf:
5. Breaker (failure or internal fault) Other:
6. Loss of towerline with three or more circuits 7. All transmission lines on a common right-of way 8. Loss of a substation (one voltage level plus transformers) 9. Loss of a switching station (one voltage level plus transformers)
10. Loss of all generating units at a station 11. Loss of a large load or major load center 12. Failure of a fully redundant special protection system (or remedial action scheme) to
operate when required 13. Operation, partial operation, or misoperation of a fully redundant special protection
system (or remedial action scheme) in response to an event or abnormal system condition for which it was not intended to operate
14. Impact of sev ere power swings or oscillations from disturbances in another Regional Council.
Evaluate for risks and consequences. §
ay involve substantial loss of customer demand and generation in a widespread area or areas.
§ ortions or all of the interconnected systems may or may not achieve a new, stable operating point.
§ valuation of these events may require joint studies with neighboring systems.
a) Applicable rating (A/R) refers to the applicable normal and emergency facility thermal rating or system voltage limit as determined and consistently applied by the system or facility owner. Applicable ratings may include emergency ratings applicable for short durations as required to permit operating steps necessary to maintain system control. All ratings must be established consistent with applicable NERC Planning Standards addressing facility ratings.
b) Planned or controlled interruption of electric supply to radial customers or some local network customers, connected to or supplied by the faulted element or by the affected area, may occur in certain areas without impacting the overall security of the interconnected transmission systems. To prepare for the next contingency, system adjustments are permitted, including curtailments of contracted firm (non-recallable reserved) electric power transfers.
c) Cascading is the uncontrolled successive loss of system elements triggered by an incident at any location. Cascading results in widespread service interruption which cannot be restrained from sequentially spreading beyond an area predetermined by appropriate studies.
d) Depending on system design and expected system impacts, the controlled interruption of electric supply to customers (load shedding), the planned removal from service of certain generators, and/or the curtailment of contracted firm (non-recallable reserved) electric power transfers may be necessary to maintain the overall security of the interconnected transmission systems.
e) A number of extreme contingencies that are listed under Category D and judged to be critical by the transmission planning entity(ies) will be selected for evaluation. It is not expected that all possible facility outages under each listed contingency of Category D will be evaluated.
f) Normal clearing is when the protection system operates as designed and the fault is cleared in the time normally expected with proper functioning of the installed protection systems. Delayed clearing of a fault is due to failure of any protection system component such as a relay, circuit breaker, or current transformer (CT), and not because of an intentional design delay.
g) System assessments may exclude these events where multiple circuit towers are used over short distances (e.g., station entrance, river crossings) in accordance with Regional exemption criteria. Source: NERC Planning Standards, June 15, 2001

Third Biennial Transmission Assessment 2004-2013 Docket No. E-00000D-03-0047 31
3.1.2 WECC Reliability Standards
WECC provides the coordination that is essential for operating and planning a reliable and adequate electric power system for the western region of the continental USA, Canada, and Mexico. The WECC member systems’ transmission facilities are planned in accordance with the NERC/WECC Reliability Criteria for Transmission System Planning. These criteria establish the performance levels intended to limit the adverse effects of each member’s system operation on others, and recommend that each member system provide sufficient transmission capability to serve customers, to accommodate planned inter-area transfers, and to meet its transmission obligation to others.
The WECC Reliability Criteria adopted all the NERC criteria mentioned in section 3.1.1 and asks its members to comply with several additional requirements, two of which are more stringent than those in some other NERC regions:
WECC-S2 The NERC Category C.5 initiating event of a non-three phase fault with normal clearing shall also apply to the credible common mode contingency of two adjacent circuits on separate towers. The credibility of such an outage depends upon the credibility of the common mode failure. The credible outage of two circuits could result from a lightning storm or forest fire. Considerations in the determination of credibility should include line design; length; location, whether forested, agricultural, mountainous, etc.; outage history; operational guidelines; and separation between circuits.
WECC-S3 The common mode simultaneous outage of two generator units connected to the same switchyard, not addressed by the initiating events in NERC Category C, shall not result in cascading.
(NERC/WECC Planning Standard, August 8-9, 2002, Page 11)
In summary, WECC requires that the outage of two adjacent circuits on different towers or the outage of two units at the same plant meet Category C. This is in addition to the requirement that transmission systems should be capable of withstanding the same set of contingencies with one bulk facility out of service for planned maintenance. WECC also adds voltage dip and frequency deviation requirements for the effects of outages on neighboring systems. All except two WECC planning standards are at least as stringent as the NERC standards. The two exceptions are C2 and C9. 48 WECC currently has been granted a waiver for these standards and analysis is ongoing to determine whether NERC should grant a variance.49 This exception is not required by the Arizona utilities as they comply with NERC’s C2 and C9 standards.
48 C2-Breaker Failure, C9-Bus Section Failure 49 Resource and Transmission Adequacy Recommendations, Prepared by the Resource and Transmission Adequacy Task Force of the NERC Planning Committee NERC Board of Trustees June 15, 2004, Table 2 Transmission Adequacy, (Revised 2/23/04) ftp://www.nerc.com/pub/sys/all_updl/pc/rtatf/RTATF_ReportBOTapprvd_061504.pdf

Transmission Planning 32 November 2004
WECC’s Reliability Management System (“RMS”) agreement establishes a process to manage compliance with the established criteria. This process includes compliance monitoring, annual study reports, a project review and rating process, and an operating transfer capability policy group process. Compliance is ensured with regard to control performance, operating reserve and operating transfer capability, and disturbance control. While WECC members self-declare their compliance, WECC conducts compliance reviews through random audits. The RMS includes system operator requirements for managing transactions within major transmission path operating limits. WECC also addresses the unscheduled flow mitigation scheme approved by FERC.
For reliable operation of the western interconnection, WECC requires all entities to comply with their Minimum Operating Reliability Criteria (“MORC”)50. MORC is applicable to system operation under all conditions even when facilities required for secure and reliable operation have been delayed or forced out of service. MORC principles applicable to the transmission system operation are:
§ The interconnected power system shall be operated at all times so that system instability, uncontrolled separation, cascading outages, or voltage collapse will not occur as a result of single or multiple contingencies of sufficiently high likelihood.
§ Continuity of service to load is the primary objective of the MORC. Preservation of interconnections during disturbances is a secondary objective except when preservation of interconnections will minimize the magnitude of load interruption.
Since electric system reliability is so vital to Arizona, Staff contends that it is appropriate to apply the most specific and stringent criteria. Thus the Staff supports WECC’s MORC.
3.1.2.1 Transmission Paths in the WECC
A grouping or set of transmission lines connecting two areas is often referred to as a transmission Path. Transmission paths consist of one or more lines emanating from a common location or between two regions. The performance of each transmission line within a transmission path is interdependent upon the performance of other lines in the same path. The adequacy and security of the whole transmission system is often determined by the performance of key and critical transmission paths.
Transmission lines and paths are also rated in terms of their Total Transfer Capability (“TTC”). The TTC is the reliability limit of a transmission line or path. This rating is established by technical studies that consider the network topology and operational conditions affecting the adequacy and security of the transmission line or path. The thermal rating and the stability limit of transmission lines are both considered when establishing the TTC of transmission facilities.
50 http://www.wecc.biz/sdpp.html

Third Biennial Transmission Assessment 2004-2013 Docket No. E-00000D-03-0047 33
WECC has an established process for determining the TTC of major transmission paths in the western interconnection. The transmission path consisting of lines between Arizona and California has the largest TTC of any established path in the Western Interconnection. The map in Figure 1 shows the non-simultaneous TTC of the Arizona area for 2003.51
Figure 1: Total Transfer Capabilities for Key WECC Transmission Paths (2003)
160
160
2,9901,920
1,400
7,550
814
850
690
820
1,500420
420800
408
312
352
DC
DC
DC
The paths of interest to Arizona are shown in Figure 2, and are defined below in Table 2. A path of particular interest to Arizona is Path 49, East of Colorado River (“EOR”) that connects Arizona and California. Paths 22, 23, 50 and 51 all lie between Four Corners/San Juan and the Phoenix area.
51 WECC Ten –Year Coordinated Plan Summary, December 2003, Page 54

Transmission Planning 34 November 2004
Figure 2: Western Interconnection Paths
Table 2: WECC Paths in Arizona WECC Path # WECC Path Name 22 Southwest of Four Corners
Four Corners – Moenkopi Four Corners – Cholla #1 Four Corners – Cholla #2
23 Four Corners 345/500 kV Qualified Path 47 New Mexico -Greenlee 49 East of Colorado River 50 Cholla - Pinnacle Peak 51 Southern Navajo
3.1.3 Arizona Utilities Transmission Planning Standards
The utilities in Arizona plan their system facilities by following NERC and WECC reliability standards. In addition, each utility in the State develops its own internal reliability criteria and planning processes to assist in planning its EHV 345kV and above, HV transmission system, and local areas. Each utility plans

Third Biennial Transmission Assessment 2004-2013 Docket No. E-00000D-03-0047 35
the transmission system to operate with no thermal overloads on lines and equipment, and voltages within defined limits under normal and emergency conditions. The Arizona transmission system is planned based on NERC and WECC single contingency criteria.52 These criteria require that there should be no loss of load on the system for a single element contingency. There are credible disturbances, which are not probable, for which it is not economically feasible to protect against. These criteria recognize the need for direct load tripping for more severe disturbances, but the load tripping should be controlled to limit the adverse impact of the disturbance. Uncontrolled load shedding is unacceptable even under the most adverse, credible disturbance.
The Arizona utilities have provided detailed information regarding the assumptions, studies performed and criteria used in their 10-year plans. The studies include power-flow, stability, and short-circuit analyses. While it is not explicitly stated, it appears that the plans are developed to only meet NERC category A and B criteria—normal and single contingency conditions. No evaluations appear to be made of NERC category C or D criteria—multiple and extreme contingencies. As is discussed later in chapter 6 of this report, the utilities perform companion studies of transmission and generation requirements for local load pockets. In some cases, these studies include evaluations of NERC category C & D contingencies.
It is not unusual in the U.S.A. transmission planning practices that transmission systems supplying large urban areas (RMR areas) have more stringent criteria than used for the rest of the system. Staff recommends that Arizona utilities collaborate with the Staff to develop and effectively implement appropriate criteria for RMR areas in the 2006 BTA.
3.1.4 Transmission Ratings
Transmission facilities can be loaded up to their continuous or emergency ratings. The ratings may be set by thermal, stability, or voltage conditions. Thermal limits are set depending on the characteristics of the individual components, while stability and voltage limits depend on the topology and characteristics of the combined generation-transmission-load network.
3.1.4.1 Thermal Limits
Thermal limits relate to heating of equipment. High temperatures cause physical damage to the equipment and shorten the life of the equipment. In extreme heating conditions, the equipment can be damaged or destroyed. Utilities and manufacturers set temperature standards that are applied to different pieces of the transmission system to limit loss of life and avoid destroying equipment.
52 Workshop I Transcript, Page 165, Lines 9-17

Transmission Planning 36 November 2004
Each transmission line has a utility-defined thermal rating based upon size and type of conductor, and its design and construction. The capability of the line will also be impacted by required spacing and clearances for trees, shrubs, buildings, animals and various human activities. Each transmission line has a thermal rating based on its current carrying capacity measured in amperes. Such ratings are dependent upon ambient weather, temperature, wind, and atmospheric conditions. Other devices connected to a circuit such as switches, connectors, and metering equipment may also thermally limit transmission lines. The most restrictive device rating in series with the transmission line establishes the thermal rating used for that transmission line.
Circuit breakers and transformers are other major devices that have thermal ratings. These ratings are set by the manufacturers to prevent damage or destruction of the equipment. While thermal ratings are set based on ampere loading, they are usually converted to a megawatt rating assuming nominal voltage conditions. Thermal ratings are time dependent and may range from a short time emergency rating to a continuous rating.
3.1.4.2 Stability Limits
The limit of a group of transmission facilities may also be determined by stability or voltage limits. These represent limits on the system’s ability to successfully respond to contingencies, even if no thermal limits are exceeded.
For many system contingencies generators in different parts of the power system will “speed up” slightly while others will “slow down” slightly. The two areas will be briefly operating at very slightly different frequencies when this happens. In nearly all cases, the transmission system is strong enough to keep the two parts of the system connected so that they quickly return to normal speed (frequency). In these cases the system remains stable.
For a few system configurations and contingencies, the transmission system is not strong enough to maintain the two areas’ frequencies in balance. In these cases the two areas will separate from each other and operate isolated. This is an example of an unstable system condition.
In most cases, however, one or more of the islands will experience partial or full loss of load. This occurs because one, or more, of the areas will be importing from the others. Thus, when the transmission connection is lost the importing area will be unbalanced, with more load than generation. When the imbalance is large, the only option for the importing area is to shed load; causing a partial blackout. If the imbalance is very large a complete blackout of the island will occur. It is also possible for the exporting area to experience problems when the islands form.
There are situations in many systems, especially those in the western United States, where transfers are limited by stability problems before any thermal limits are reached. In these cases the transfer will be

Third Biennial Transmission Assessment 2004-2013 Docket No. E-00000D-03-0047 37
stability limited. These stability (and voltage) limits are established via technical studies that determine the maximum power that can be transferred over a group of lines.
3.1.4.3 Voltage Limits
For nearly all system contingencies different parts of the power system will experience changes in voltages. In some areas voltages rise; while in others voltages will fall. Usually equipment and system operators are able to adjust the voltages to maintain acceptable levels. If voltages rise too much, however, equipment can be damaged due to insulation or other hardware failures. If the voltages fall too low it may not be possible to control, and voltage will continue to fall, resulting in a blackout. The greatest risk is usually to an importing area where the lowest voltages will usually be experienced.
3.2 Arizona Transmission Planning Processes
Planning methods and guidelines are used as the basis for the development of future transmission facilities. Transmission plans are updated on a continuous basis to determine the projected facilities needs for each year over a ten-year period.
In addition to planning their transmission systems to meet their internal needs, the utilities in the State actively engage in a coordinated regional planning of transmission facilities in order to ensure that (a) there are no duplicate or redundant facility additions, and (b) the Extra High Voltage (“EHV”) and High Voltage (“HV”) transmission facilities are planned in the broader context of the needs of the State, and to take advantage of the diverse locations of load centers and generation complexes in the State. The nominal system voltages for EHV facilities are 345 kV and 500 kV. The nominal system voltage for HV facilities ranges from 115 kV to 230 kV.
The utilities in the State are also coordinating the planning activities with the utilities in the neighboring states to identify and construct interstate transmission facilities in order to take advantage of the import and export of competitive energy that would benefit the customers.
Since the 2002 BTA, with the encouragement of the ACC and its Staff, the planning process has become much more collaborative and regional. This is a significant improvement in the Arizona planning process. While individual transmission providers remain responsible for their individual transmission projects, the planning process has become so regional that plans are best presented on a regional basis, rather than by individual companies.
3.2.1 Regional Transmission Planning Affecting Arizona
Coordinated regional planning in Arizona dates back at least to the late 1960s when the NERC and its regional Councils were formed. The Arizona utilities were part of one of these regional Councils, the

Transmission Planning 38 November 2004
Western Systems Coordinating Council (“WSCC”). In the years since that time many regional planning coordinating groups have formed and evolved. The WECC has succeeded the WSCC. There are now six regional transmission-planning groups active in the WECC as shown in Figure 3. As shown on the figure, the sub-regional groups that are directly involved with transmission planning in Arizona are STEP and SWAT.
Figure 3: Six Sub-Regional Planning Groups in the WECC
3.2.1.1 Southwest Transmission Expansion Planning (“STEP”) Group
STEP was created as an ad-hoc group to coordinate transmission plans in the Arizona, Southern Nevada, Southern California, and Northern Mexico area. STEP first met in November 2002 and has met periodically since. Participants include representatives from utilit ies, independent power producers, state

Third Biennial Transmission Assessment 2004-2013 Docket No. E-00000D-03-0047 39
agencies/regulators and other stakeholders with an interest in the transmission system in Southern Nevada, Arizona and Southern California. STEP’s focus is on economically driven expansion projects that support the development of seamless west-wide markets while satisfying established reliability standards.
STEP goals and functions
The group adopted the following common goal:
To provide a forum where all interested parties are encouraged to participate in the planning, coordination, and implementation of a robust transmission system between the Arizona, Southern Nevada, Mexico, and Southern California areas that is capable of supporting a competitive, efficient, and seamless west-wide wholesale electricity market while meeting established reliability standards. The wide participation envisioned in this process is intended to result in a plan that meets a variety of needs and has a broad basis of support.
STEP performs 12 basic planning functions:
1. Produces a long-term bulk transmission expansion plan biennially.
2. Identifies current and future transmission congestion that is an impediment to the efficient operation of the western market.
3. Develops, through a collaborative process, strategic transmission options and specific alternative plans for reinforcing the transmission system and for reducing or eliminating congestion.
4. Reviews project-sponsored studies, if requested by the Project Sponsor.
5. Relies, as much as possible, on the technical studies conducted by Project Sponsors and studies conducted in other forums.
6. Performs technical studies without duplicating work performed by others.
7. Shares the study work and will normally be documented in a report.
8. Provides a forum to facilitate stakeholder development of projects through the planning effort.
9. Facilitates the phased implementation of completed plans.
10. Works closely with regulatory and governmental agencies in developing facility plans.
11. Closely coordinates with the other regional planning and reliability groups.
12. Provides a forum for discussing different approaches for funding potential transmission projects.

Transmission Planning 40 November 2004
In its first year, STEP conducted both technical and economic studies to develop transmission projects to mitigate inefficient congestion on the system. A large number of initial alternatives were narrowed down to one general expansion plan based on the studies and a consensus building process. The member systems began implementing several of the initial steps that can be implemented quickly and economically. These are discussed in section 5.2.
A separate sub-group of STEP was formed to focus on these short-term upgrades. The initial steps primarily involve upgrades to the series capacitors in several existing 500 kV lines. During 2004, STEP expects to agree on some of the larger system upgrades and to initiate their implementation.
Two other sub-groups were formed to make more detailed studies of specific areas. The first is developing a final plan for a new line between Arizona and California . The second is working on a new transmission line into San Diego. The planning and development of these two projects are taking place in parallel. These larger scale upgrades involve the construction of major new 500 kV lines. Altogether, the total cost of the economic transmission additions being developed by STEP is estimated to exceed one billion dollars.

Third Biennial Transmission Assessment 2004-2013 Docket No. E-00000D-03-0047 41
STEP Arizona-California
STEP Arizona-California (“STEP-AC”) covers the area on the east side of Path 49, as shown in Figure 4. The focus of the STEP-AC group is on the transmission transfer capability between Arizona and California. This means that there is some justified geographic overlap with other groups that are focused on the “internal” transmission needs of the areas within Arizona and California.
Figure 4: Transmission Area of STEP-AC Planning Group
N A V A J O
M O E N K O P I
W E S T W I N G
Y A V A P A I
P A L O V E R D E
M E A DM c C U L L O U G H
C R Y S T A L
M I D W A Y
A D E L A N T O
V A L L E Y
D E V E R S
S E R R A N O
L U G O
M I R A L O M A
E L D O R A D O
M A R K E T P L A CE
V I N C E N TR I N A L D I
T O L U C A
G I L A R I V E R
H A R Q U A H A L A
H A S S A Y A M P AR U D D
J O J O B AT O K Y R E N E
T O F O U RC O R N E R S
M I G U E L I M P E R I A LV A L L E Y
N O R T HG I L A
P E R K I N S
M O H A V EV I C T O R V I L L E
L I B E R T Y
H A R R YA L L E N
W e s to f
R i v e r East o fR i v e r
Phase Sh i f te r
500 kV l i ne
345 kV l i ne
C a lifo r n iaN ev a d a
Ne vada
A rizon a
Ariz
ona
Ca
lifo
rnia

Transmission Planning 42 November 2004
3.2.1.2 Southwest Area Transmission (“SWAT”) Study Group
SWAT is divided into five study areas as shown in Figure 5 each with its own study group. Four of these include facilities in Arizona (the exception is the New Mexico area). Each of these areas is a logical transmission region that involves multiple transmission providers. In each case, a participating SWAT member (typically a transmission provider or consultant) is designated as the lead entity that coordinates the necessary computer analyses.
Figure 5 Areas Covered by SWAT Study Groups
New MexicoLoad AreaStudy
Arizona/New Mexico EHVCATS EHV Study
Colorado RiverTransmission Study
CATS HV
SWAT area
Central Arizona Transmission System (“CATS”) Study Group
Historically, Arizona’s EHV transmission system has been developed to interconnect large generation resources to major load centers located in the Phoenix and Tucson metropolitan areas. The resultant transmission development within Arizona was a system that moved power to these two load centers from coal-fueled generation in the northeast and the Palo Verde Nuclear Generating Station (“Palo Verde”).

Third Biennial Transmission Assessment 2004-2013 Docket No. E-00000D-03-0047 43
In the past, each utility in Arizona developed their individual plans using a common system model of the transmission system. Some regional planning was also performed in the past as plans for joint participation projects were proposed to serve the diverse needs of the region. These individual ten-year plans were shared among the utilities before the annual filings with the ACC. This process has been improved by becoming more collaborative and open as a result of the efforts of the utilities, the Commission, and other stakeholders. This improved collaboration and openness has made it possible for the utilities to better identify joint solutions to meet future needs of Arizona and the region.
Part of this process includes the formation of the CATS study group. CATS has concluded its third annual study effort with a report used by most utilities as the foundation for filing their ten year plans with the Commission in January 2004. CATS is comprised of two subcommittees:
§ CATS-EHV — to investigate the extra-high voltage (345 and 500 kV) transmission network in central Arizona; and
§ CATS-HV — to investigate high voltage (115, 138 and 230 kV) transmission network needs in the Phoenix/Tucson area. In addition to APS and SRP, this study area includes facilities of irrigation districts, electric districts, Native American tribal lands, and small Arizona communities.
SWAT Arizona-New Mexico (“SWAT-AZ-NM”) Study Group
While this group has formed only recently, there have been several long-standing groups studying portions of the AZ-NM region. The SWAT AZ-NM is focused on the transmission needs of the eastern Arizona-Western New Mexico region. There were 27 people who attended the first meeting of the group earlier this year. Attendees discussed possible generation projects for the region that could total about 7,500 MW over the next 10 years.
SWAT Colorado River Transmission (“SWAT-CRT”) Study Group
SWAT-CRT was created as a sub region to the SWAT planning group. Its basic intent is to look at the needs for transmission and the current status of the transmission systems within western Arizona and southern Nevada. Membership, as with SWAT, is completely open. This group has merged with the STEP-AC group. The merged group reports to both SWAT & STEP. There are more than 20 entities that are participating or monitoring the SWAT-CRT/STEP-AC meetings and activities.
The study group is now pursuing a two-phase approach:
1. First, stressing the existing East of River path to investigate what can be done to increase transmission capability into northwestern Arizona and southern Nevada with the existing facilities.

Transmission Planning 44 November 2004
2. Second, investigating a new circuit that will connect APS’ proposed TS-5 project with the Lake Havasu area to Mohave, California.
They also are coordinating various proposed projects to increase capacities of Devers/Palo Verde, East of River to 9,000 MW and also the APS TS-5 project.
Other Areas Within Arizona
While there have been laudable activities by the various stakeholders to encourage and participate in regional coordinated transmission planning, not all transmission needs are regional. There are other areas not covered by a regional study group. There are also purely local transmission needs within the areas covered by the regional study groups. These areas are the responsibility of the utility serving the area. The needs of these areas have been included in the BTA filings of the Arizona utilities. These facilities have been planned based on the individual utility criteria. Examples include the 115 kV and 138 kV projects in the state and the several reconductoring projects proposed by TEP. (These projects are discussed later, in Chapter 5.)
3.2.1.3 Seams Steering Group
The Seams Steering Group-Western Interconnection (“SSG-WI”) committee was formed by the three western RTOs to facilitate reviews of issues related to the interfaces between the RTOs in the Western Interconnection (“WI”). A planning work group (“PWG”) was formed within SSG-WI to establish a collaborative planning mechanism to coordinate the transmission plans of Western RTOs. The Group’s scope addresses long term congestion issues and scheduling timelines that impact the marketing of energy between RTOs in the West. The Seams Steering Group-Western Interconnection issued its first interconnection wide transmission plan, Framework for Expansion of the Western Interconnection Transmission System, in October of 2003.
3.2.2 Arizona Planning Practices for Local Area Transmission Constraints
In the 2003 RMR, study the transmission providers worked collectively to quickly develop studies to respond to the Track B proceeding needs.53 Due to the short time available there was no opportunity to develop a collaborative process. There were numerous comments about the deficiencies of the 2003 “closed” process. The lessons learned from the 2003 process were: § Open the study process to all stakeholders, not just the transmission providers.
§ Provide opportunities for stakeholders to review and critique RMR results before the ACC workshop.
53 See section 2.2.1 beginning on page 20 for more information about Tacks A and B of the RMR process.

Third Biennial Transmission Assessment 2004-2013 Docket No. E-00000D-03-0047 45
§ Reach an agreement, to the extent possible, regarding the modeling of load and generation included in the Phoenix area.
§ Evaluate the extent to which operation of the various Phoenix-area generation mitigates Phoenix area import constraints.
§ Solve the confusion regarding implications of Mohave County RMR Study conclusions.
The 2004 RMR studies were much more collaborative. The study forum became integral to the regional CATS study program. The 2004 process allowed for input and/or participation from all groups of stakeholders. In comparison to the 2003 RMR study, the 2004 study:
§ Had a process and reviews open to all stakeholders and facilitated a review and comments at each stage of the process.
§ Used improved modeling and definition of the load and generation included in the Phoenix area.
§ Showed that the planned transmission improvements appear to mitigate the RMR concerns for the Yuma, Phoenix and Tucson areas.
§ Found that local Phoenix area generation reserve was an issue beginning in 2013.
§ Was unable to agree completely on whether Mohave County is an RMR area or if it is a contractually limited system.
§ Found additional transmission lines are needed in Santa Cruz County by 2008 to serve peak load and so that the county is no longer susceptible to extended interruptions of service for transmission outages. The county becomes transmission import constrained by 2010 even with the proposed second transmission line to Nogales.
It seems clear that the hard work of the transmission providers and the other stakeholders during the last two years has resulted in a quality work product that improved each year.
Four RMR study process recommendations are appropriate as part of the 2004 Biennial Transmission Assessment:
1. All of the Arizona utilities should continue performing RMR studies for all transmission import constrained local areas using a collaborative process similar to what occurred in 2004. The industry seemed to be satisfied with the degree to which it was included in the planning process.
2. Improvements should be made in some aspects of the economic analysis that accom-panies these types of studies. Data and assumptions should be consistent among the various utilities’ studies. To this end, the Staff suggests using the SSG-WI, or another

Transmission Planning 46 November 2004
common publicly available, database. In addition, there should be more transparency regarding the data input, assumptions used and the results of the economic analyses.
3. Conditions in Mohave County must be reviewed in order to understand whether mitigation is required due to constraints on the physical system or whether it can be managed through contractual or commercial practices.
4. The RMR 10-year study results should be filed with the 10-year transmission plans by January 31 of even numbered years to coincide with the Commission’s obligation to perform a BTA.
These recommendations offer a reasonable amount of study work required of the utilities while affording the ACC the opportunity to address the RMR condition on a systematic basis.

Third Biennial Transmission Assessment 2004-2013 Docket No. E-00000D-03-0047 47
4. Adequacy of Existing System
Adequacy, as discussed earlier, is the ability of the electric systems to supply the aggregate electrical demand and energy requirements of their customers at all times, taking into account scheduled and reasonably expected unscheduled outages of system elements. Adequacy is generally considered a planning issue related to the capability and amount of facilities installed. This section of the report addresses the adequacy of the existing Arizona transmission system.
The adequacy of an electric system is evaluated using computer simulation studies. These studies use databases, assumptions, and reliability criteria to ascertain transmission adequacy. The Arizona transmission utilities conduct these studies, participate in the collaborative regional planning process, and present the study results in the Ten-Year Plan reports and at public workshops. Staff and KEMA reviewed and analyzed all the study reports and documents filed with the Commission by the various organizations and have relied on these reports, rather than performing technical studies of their own.
4.1 System Description
The demand for electricity continues to grow in Arizona. The annual growth rate in retail sales experienced throughout Arizona in the period from 1993 through 2002 was 3.9 percent.54
The total installed generation has grown in the last several years with addition of the new plants. As of August 2004, total installed generation in Arizona is 20,795 MW. This includes 2,608 MW of federally owned hydro generation located along the Colorado River and marketed within Arizona by the Western Area Power Administration (“WAPA”). It excludes 3,645 MW of coal fired generation located in New Mexico that is partially owned by Arizona utilities. The existing generation plants constructed, owned, and operated by the electric utilities within the State of Arizona are provided in Table 3. All new power plants constructed since the First BTA are incorporated as existing Arizona system facilities in this report. Table 4 illustrates the changes in the status of merchant power plants since the First BTA.
54 Source: Department of Energy, Energy Information Administration, State Electricity Profiles 2002.

Adequacy of Existing System 48 November 2004
Table 3: Existing Arizona Power Plants Owned by Arizona Utilities
Plant Switchyard Voltage (kV) No. Units
Capacity
(MW)*
AZ Utility Capacity
(MW)*
AZ UtilityCapacity
(%)230 3 219 219 100.00%
Agua Fria 69 3 407 407 100.00% 230 3 388 388 100.00% 115 2 140 140 100.00% Apache 69 2 30 30 100.00%
Childs/Irving 69 4 5 5 100.00% 500 3 995 615 61.81%
Cholla 230 1 116 116 100.00%
Coronado 500 2 773 773 100.00% DMP 138 1 73 73 100.00% Fairview 69 1 16 16 100.00% Horse Mesa 115 4 128 128 100.00%
138 4 276 276 100.00% Sundt
46 2 155 155 100.00% 230 2 101 101 100.00%
Kyrene 69 3 163 163 100.00%
Mormon Flat 115 2 68 68 100.00% Navajo 500 3 2,255 1,522 67.49% North Loop 46 4 86 86 100.00%
230 1 54 54 100.00% Ocotillo
69 3 275 275 100.00% Palo Verde 500 3 3,810 2,377 62.39% Roosevelt 115 1 36 36 100.00% Saguaro 115 5 400 400 100.00%
230 2 184 184 100.00% Santan
69 2 184 184 100.00% Springerville 345 2 840 840 100.00% Stewart Mountain 115 1 13 13 100.00% YCA 69 1 55 0 0%
69 5 173 98 56.65% Yucca
161 1 22 0 0% 230 3 240 240 100.00%
W. Phoenix 69 3 94 94 100.00%
22 Plants Total 80 12,742 10,044 78.83% * Per WECC Existing Generation Data Base

Third Biennial Transmission Assessment 2004-2013 Docket No. E-00000D-03-0047 49
Table 4 Generation Plant Additions in Arizona Since the First Biennial Transmission Assessment
Facility Status Output (MW)
West Phoenix (Phase 1) In-Service 2001 120 Desert Basin In-Service 2001 570 Griffith Energy Project In-Service 2001 650 South Point In-Service 2001 540 Kyrene In-Service 2002 250 Arlington Valley 1 In-Service 2002 580 Redhawk 1 In-Service 2002 530 Redhawk 2 In-Service 2002 530 Sundance Energy Project #1 In-Service 2002 450 Gila River 1 In-Service 2003 520 Gila River 2 In-Service 2003 520 Gila River 3 In-Service 2003 520 Gila River 4 In-Service 2003 520 West Phoenix (Phase 2) In-Service 2003 500 Mesquite In-Service 2003 1,250 Harquahala In-Service 2003 1,040
Total 9,090
The existing transmission facilities within the state of Arizona are owned and operated by APS, SRP, TEP, UniSource Energy Services, SWTC and WAPA. Figure 6 illustrates the existing EHV transmission facilities in the State of Arizona. EHV facilities, rated at a nominal system voltage of 345 kV and 500 kV, are the backbone of the Western Interconnection transmission system.

Adequacy of Existing System 50 November 2004
Figure 6: Arizona EHV Transmission System
P a l o Verd
San Juan
Springerville
M e a d
McKinley
Greenlee
Eldorado
Glen Canyon
North Gila
Vail
South
Tortol i ta
Saguaro
KyreneJojoba
Coronado
Pinnacle P e a k
Navajo
Devers
Four Corners
Westwing
Cholla
Rudd
Liberty
Ocotil lo
Moenkopi
Crystal
McCullough
M o h a v e
Shiprock
Tucson
Browning
PhoenixHassayampa
Winchester
Gila River
Silver Creek
Apache
TS 3
Table 5: New Transmission Lines and Stations Added Since the Second BTA Year Description Voltage
2002 Jojoba – Gila River #1 and #2 500 kV
2003 Palo Verde -- Rudd 500 kV
2003 Liberty – Rudd 230 kV
2003 Saguaro – Tortolita #2 500 kV 2004 Winchester - Apache 230 kV

Third Biennial Transmission Assessment 2004-2013 Docket No. E-00000D-03-0047 51
4.2 Local Area Transmission Constraints
In addition to the overall needs of the Arizona transmission system, there are local transmission
constraints (See Figure 7). To address this issue, a method was established to address these load pockets.
The 2002 BTA defined local load pockets as geographic locations in an electric system where the load cannot be served using a normal economic merit-order generation dispatch due to transmission limitations. Handling these load pockets is discussed later, in Chapter 6.
Figure 7 Local Area Transmission Constraints
4.3 Palo Verde Hub Operational Issues
To support bilateral power trading, numerous electricity-trading hubs have emerged over the past few years. A hub is a location on the power grid representing a delivery point where power is sold and ownership changes hands. Potentially, each control area on the power grid could become a trading hub, but 10 hubs account for the bulk of power trading. Of these 10 major trading hubs, five of them are located in the western United States. One of these is the Palo Verde Hub that represents an important access point to the California market.
2002 BTAArizona EHV Transmission
San Juan
NavajoGlenCanyon
North Gila
PaloVerde
SilverKingKyreneLiberty
South
Saguaro
Vail
Greenlee
ChollaMohave
MeadFour Corners
Springerville
McKinley
Tortolita
Phoenix
Tucson
Yuma
Westwing Coronado
PinnaclePeak
Transmission ImportConstrained Areas
Approved New EHV Lines
EHV345 & 500 kV
San Juan
NavajoGlenCanyon
North Gila
PaloVerde
SilverKingKyreneLiberty
South
Saguaro
Vail
Greenlee
ChollaMohave
MeadFour Corners
Springerville
McKinley
Tortolita
Phoenix
Tucson
Yuma
Westwing Coronado
PinnaclePeak
Transmission ImportConstrained AreasTransmission ImportConstrained Areas
Approved New EHV LinesApproved New EHV Lines
EHV345 & 500 kV

Adequacy of Existing System 52 November 2004
4.3.1 Palo Verde Hub Transmission Constraints
The Palo Verde Nuclear Generating Station is located approximately 35 miles southwest of the Phoenix Metropolitan area. It is comprised of three nuclear generating units with a total net output of approximately 3,953 MW. Four merchant generator plants with an aggregate net output capacity of 3,830 MW are interconnected to the Palo Verde Hub via the Hassayampa Switchyard. Additional merchant generation with a net capacity of 2,080 MW is connected to the Jojoba Switchyard. All of these generators deliver their output through the Palo Verde transmission system. The Palo Verde transmission system, as illustrated in Figure 8, consists of six 500 kV transmission lines.
Figure 8: Palo Verde Transmission System
Palo Verde
To North Gila
To Devers
To Jojoba
Hassayampa
Redhawk
Westwing I & II T /L
To Rudd
Arlington
Valley
Mesquite
Harquahala

Third Biennial Transmission Assessment 2004-2013 Docket No. E-00000D-03-0047 53
The total generation interconnected to the Palo Verde Hub is shown in Table 6.
Table 6: Net Generation Interconnected to the Hub for Studies
Plant Name Installed Capacity (MW) In -Service Date
Palo Verde 3,953
Redhawk #1, #2 1,060 6/1/2002
Arlington Valley 1 580 8/1/2002
Mesquite 1,250 2003
Harguahala 1,040 2003
Panda Gila River 2,080 2003
Total 9,863
The sequential changes in generation and transmission capability connected to the Palo Verde Hub are shown in Table 7.
Table 7: Palo Verde transmission and gross generation capability
Generation capability (MW)
Transmission capability (MW)
Year Actual or Expected Limit West path East path Reason for change
2000 3,810 3810 2800 3810 No changes - historical values
2001 3,810 3810 2800 4750 Technical study work by APS/SRP
2002 5600 5461 2800 4750 Change in WECC reliability criteria
Spring 2003 7971 7301 2800 5120 Technical study work by APS/SRP
Summer 2003 9939 9595 2800 6620 New PV to Rudd line
Fall 2003 10240 10018 2800 6970 Gila River 230kV interconnection
2006 10240 > 10018 2800 > 6970 New PV-Pinal West line
2007 10240 > 10018 2800 > 6970 New PW – Santa Rosa and PV-TS5 lines
2009 10240 > 10018 > 2800 > 6970 New PV – Devers II line
2010 10240 > 10018 > 2800 > 6970 New TS5 – Raceway line
2011 10240 > 10018 > 2800 > 6970 New Santa Rosa – Browning line
Source: Robert E. Kondziolka, P.E. Manager, Transmission Planning, Salt River Project
Staff has been concerned that the Palo Verde transmission system was inadequate to reliably deliver the full power output of all generators interconnected at the Palo Verde Hub. Table 7 demonstrates this concern in two ways: 1) by comparing the actual or expected generation capacity with the generation

Adequacy of Existing System 54 November 2004
simultaneous capacity limit and 2) by comparing the aggregate simultaneous transmission capacity with the actual or expected interconnected generation capacity. Beginning in 2002 and continuing through the present, if all interconnected generators tried to reach their maximum output simultaneously , with all lines in service, the Hub simultaneous generation capacity limit would be exceeded. This would require that a generation curtailment be implemented at the Hub in preparation for a single contingency outage (N-1).55 With the addition of the Palo Verde to Rudd 500 kV line and the Gila River 230 kV interconnection in 2003 this concern has been materially resolved.
Table 7 also reveals that the actual or expected interconnected generation capacity exceeds the aggregate simultaneous Palo Verde east and west transmission capacity beginning in 2003. This phenomenon continues until construction of the Palo Verde to Pinal West 500 kV line in 2006. Since interconnection of merchant plants commenced at the Palo Verde Hub, the Palo Verde east transmission system capability has increased from 3810 MW to 6970 MW as a result of several transmission upgrades. The near term wholesale markets in Arizona and to the east of Palo Verde are not sufficiently robust to assure merchant transactions that approach the 6970 MW Palo Verde east transmission capacity. 56 In addition, two new 500 kV transmission line projects within Arizona are proposed as additional reinforcements in 2007 through 2011. The Palo Verde to TS5 to Raceway and Palo Verde to Browning projects will significantly increase the outlet capability of the Palo Verde Hub to Arizona. Arizona transmission providers are doing an effective job of assuring that Arizona has an adequate and reliable access to merchant plants at Palo Verde.
Transmission exports from Palo Verde to California existed prior to the interconnection of new merchant plants at the Palo Verde Hub. Furthermore, no transmission improvements have been made to the Palo Verde west transmission system capability to delivery power from new Hub interconnected plants to California. Therefore, only some portion of the pre-existing 2800 MW Palo Verde west transmission capacity is available for transactions from the new merchant plants. Under conditions when the Arizona market or markets east of Palo Verde are not sufficiently robust, some portion of the 10,240 MW capacity of Palo Verde Hub merchant generation may be stranded at the Hub due to transmission limitations into California when the market would otherwise desire access. Three 500 kV transmission projects are being studied to remedy such market limitation between Arizona, California and Nevada. The second Palo Verde to Devers 500 kV line is one of the projects and is shown with a 2009 in-service date in Table 7.
4.3.2 Palo Verde Risk Assessment
Operation of the Palo Verde Hub and interconnected generation has been the object of continuous Staff concern. In the Second BTA, staff reported that the Palo Verde generation interconnection studies indicated that the Palo Verde system was essential for the reliable operation of the whole Western
55 2004 BTA Workshop #2 Transcript, lines 1-15, page 24 and lines 15 -23, page 32. 56 Results of the APS and TEP Track B required 2003 Competitive Solicitations.

Third Biennial Transmission Assessment 2004-2013 Docket No. E-00000D-03-0047 55
Interconnection. This was demonstrated by voltage stability of the Pacific Northwest being a limiting factor in the outage consideration of some Palo Verde system elements. This phenomenon persists even with the construction of the Palo Verde to Rudd 500 kV line in 2003. On this basis, Staff considered the transmission plans for Palo Verde to be inadequate for the interconnection of all new proposed power plants as they were being sited. As the new plants were constructed they were required to file a study report with the Commission prior to commercial operation that demonstrates the plant can deliver at full output to a market without causing curtailment of the existing generation at the Palo Verde Hub. Any plant that fails to do so has not fulfilled one of the conditions of its CEC.
The foundation for Staff's concerns regarding the Palo Verde Hub can be summarized as:
§ Proposed Hub interconnected generation capacity was comparable to entire WECC operating reserve requirement;
§ Plants (except Redhawk) were interconnecting to the Hub via a single line;
§ A common interstate pipeline was used the for gas fired plants;
§ Transmission deliverability for the full output of all proposed plants had not been demonstrated;
§ NERC category D studies were not being performed; and
§ Generator-only control areas were emerging at Palo Verde Hub.
In response to Staff concerns, in siting the Palo Verde to Rudd transmission line, the applicants, APS and SRP, agreed to facilitate an industry review and work to achieve consensus with Staff on the reliability and system security measures appropriate for a large commercial hub such as Palo Verde.57 Such measures were to be recommended to WECC for consideration and adoption. If and when consensus was achieved between applicants and Staff, then the applicants were to work with Staff to initiate action to implement those measures on a statewide basis independent of the WECC action.
57 Palo Verde to Rudd Transmission Line Siting Case, Arizona Corporation Commission Case No. 115 Certificate of Environmental Compatibility: “Condition No. 23 – Applicants agree to facilitate an industry review and work to achieve consensus with Staff on the reliability and system security measures appropriate for a large commercial hub such as the Palo Verde Hub. Such measures shall be recommended to WECC for consideration and adoption. If and when consensus is achieved between Applicants and Staff, Applicants shall work with Staff to initiate action to implement such measures on a statewide basis independent of WECC action.” Condition and study work does not include nor address contractual, regulatory, commercial, business or operational issues.

Adequacy of Existing System 56 November 2004
For the Palo Verde risk assessment, APS, SRP and Staff, considered the potential causes of extreme events, and those were viewed to fall into one of four categories:58
1. Intentional acts;
2. Weather related;
3. Nature initiated; and
4. Equipment failure or human error. To analyze system response under these extreme events, the study team analyzed the following set of NERC/WECC category D extreme outage contingencies:
§ Palo Verde switchyard;
§ Hassayampa switchyard;
§ Palo Verde Hub ties;
§ Common gas pipeline; and
§ Railroad event.
Although these are low probability events, if they were to occur, three to four thousand megawatts of generation at the Hub would be lost, as well as the Hub associated transmission lines. The study results show that the system would become unstable. It was determined that several thousand megawatts of load would have to be shed in order to maintain system stability. Consequently, in order to avoid increased risk at the Hub, the study report recommends that:
§ Future generation or transmission projects seeking interconnection with the Palo Verde system should consider risk mitigation for extreme events.
§ For overall diversity, performance and risk mitigation, future transmission lines should consider terminating at generating stations interconnected at the Hub rather than at the Palo Verde or Hassayampa Switchyards.
§ Future generators desiring to interconnect at the Palo Verde Hub should also be interconnected to at least one other location in the transmission network.
58 Palo Verde Hub Risk Assessment Study, Phase I Results, 5/06/03, Confidential Results were not presented

Third Biennial Transmission Assessment 2004-2013 Docket No. E-00000D-03-0047 57
In addition to the above recommendations, presented to the Commission and the industry, the report also recommends that APS, SRP and Staff submit for WECC consideration a planning guide applicable to all generation hub stations that includes:
§§ NERC Category B, C 59 and D type evaluations should be performed on all large generation hub substations and risks and consequences documented. All types of initiating events applicable to a particular generation hub station should be considered in order to determine how to model the associated disturbances, likely duration of the common substation outage and the cumulative risk and consequences of such an outage. System consequences of hub substation outages may be severe and warrant mitigation measures. Evaluations of future generation or new transmission interconnections to such generation hub substations shall consider the effect of the proposed interconnection on the cumulative risk and consequences of a common event outage of the generation hub substation. Alternatives to be considered should include the following:
o Terminating the new line at different power plant substations currently connected to the generation hub.
oo Interconnecting new generation at more than one substation. Mitigation measures include load-shedding schemes.
For the above reasons, Staff joined APS and SRP in sponsoring a new WECC planning guideline for consideration of extreme contingencies at large generation hubs. The guideline has gone through the WECC comment period and is not being pursued further due to lack of industry support. Nevertheless, Staff, APS and SRP have committed to implementing such guidelines in Arizona irrespective of WECC inaction. Staff has developed the following generic model of a generation hub to be used for discussion of alternative generation hub concepts (See Figure 9).
59 “N-1-1” and “N-1-2” refers to the criteria where a bulk facility is out of service before a single or double contingency occurs.

Adequacy of Existing System 58 November 2004
Figure 9: Generic Model of Hub Concept
Trans. TariffFree Zone
Trans. TariffFree Zone
4 - 1000 MW Plants4 – 500 kV Lines
Regional reserve req. = 3000 MW
vs ~
~
~
~ ~~~
~~~
~~~
~~~
Hub A Hub B
~
~
~
~ ~~
~~
~~
~~
Trans. Owner ATrans. Owner BTrans. Owner ATrans. Owner B
Figure 9 shows Hub A which has four power plants, each of 1,000 MW capacity, interconnected at a common switchyard. The switchyard has four 500 kV transmission lines interconnected. Two lines are owned by Transmission Provider A (shown in blue), and the other two are owned by Transmission Provider B (shown in red).
What will happen if that common switchyard is lost, assuming that the regional reserve requirement is 3,000 megawatts? The 4,000 megawatts of generation, which is in excess of the reserve criteria for the region, is lost with the loss of the switchyard. This jeopardizes security of the operation of the whole network. Consequently, Staff concluded that this type of hub configuration, as more generation is added, becomes flawed from a reliability perspective.
As an alternative, Staff proposes that the industry consider the Hub B concept for large generation hubs. The transmission lines are still interconnected to a common switchyard, the hub, but the generators have the transmission lines looped through the generator power plant switchyards. Now when the common switchyard is lost, each of the power plants is still interconnected to the line that is looped through it. However, in solving reliability concerns with this type of hub configuration, a commercial issue is created.

Third Biennial Transmission Assessment 2004-2013 Docket No. E-00000D-03-0047 59
In Hub A, all of the generators were able to deliver to the hub without any transmission tariff implications, and it was a “come and get it” market concept. With the Hub B concept, the party that is buying from a power plant connected to one of the blue lines will have to pay the blue transmission provider's transmission tariff to get power to the hub. And if the party that is buying the power is taking service on the red line they will also have to pay the red line tariff, resulting in a pancaking of the transmission rate.
The solution to this commercial issue is to redefine the transmission tariff by creating a transmission tariff free zone from the hub all the way out to the interconnection of the power plants. Staff has had some conversation with FERC Staff regarding these concepts and, in preliminary discussions, collectively concluded that there is a need for public policy and regulations that balance reliability needs and market interests at these types of large hubs. Staff and FERC Staff have also agreed that generator-only control areas are acceptable only if reliability obligations and purposes are also being maintained.
Finally, Staff suggests that the exempt wholesale generator owned substations and embedded lines that are not currently involved in the transmission network, should have the same obligation to requested interconnections as a transmission provider has. For example, regarding information60 that the new Palo Verde to Devers #2 500 kV line intends to interconnect at the Harquahala power plant switchyard, Staff proposes that regulations be developed so that Harquahala would not have the right to refuse an interconnection, but should have the right to require that reliability and commercial integrity be maintained with the proposed interconnection.
Similarly, Staff suggests that exempt wholesale generator owned substations and embedded lines that have transmission network function, should be reclassified as network facilities61, and placed under a transmission provider’s control, because they operate as part of the transmission network. In addition, Staff proposes that tariffs should be developed to avoid pancaking of transmission rates as new interconnections are made at those substations.
Finally, because of the above reliability concerns, Staff believes that the Commission should require all future interconnections proposed at the Palo Verde Hub, either new generation or new transmission lines, to perform a risk assessment of the Hub to ascertain to what degree the proposed project mitigates the pre-existing risks to extreme outage events. The recommendations of the Palo Verde Risk Assessment report should be followed if a proposed project would otherwise exacerbate the existing risk at the Hub.
60 Workshop I Transcript, Page 119, Line 1-23 61 FERC Orders 2003 and 2003A.


Third Biennial Transmission Assessment 2004-2013 Docket No. E-00000D-03-0047 61
5. Adequacy of the Future System
Every organization considering construction of a transmission line in Arizona during the next ten-years must file a ten-year plan with the ACC.62 The plan must be filed on or before January 31 of each year and must provide:
1. The size and proposed route of any new transmission lines.
2. The purpose to be served by each new transmission line, and
3. The estimated date by which each transmission line will be in operation.
A compilation of planned transmission line additions filed in January 2004 that comprises the Ten-Year Plans for 2004-2013 is provided later in Table 8 and Table 10. Changes in Transmission plans since the 2002 BTA are provided in the Appendix D.
State statutes require that Staff determine the adequacy of these planned facilities to meet the energy delivery needs of Arizona in a reliable manner. This section of the report documents a review of the ten-year plans filed by the Arizona utilities, and Staff’s assessment of how those plans differ from plans addressed in the second BTA.
While Ten-Year Plans were filed by individual utilities, the underlying studies were performed in a collaborative process by geographic region as discussed in section 3.1.4. Since the studies for this BTA were performed by geographic region, the reviews are reported here by region in a way that parallels the collaborative studies.
5.1 Phoenix-Tucson EHV System Assessment
The existing Arizona EHV transmission system and planned additions are shown in Figure 10. The existing system is shown in black and the planned additions are shown in red. As can be seen in the figure the planned additions strengthen the connections between the Palo Verde area and western and southeastern Phoenix area, northern Pinal County and northwestern Tucson. The figure also shows many facilities in brown. These are alternatives that were evaluated by the utilities as part of CATS Phase III studies. Most of these alternatives have been included in the 2004 ten-year plans but mention that they are currently being reviewed as part of CATS.
It is clear that the utilities do not intend to commit to all of these additions in the 2004-2013 time period. For instance, consider the two alternative circuits proposed for Pinal West. The Pinal West- Saguaro transmission line is a proposed alternative participation project for 2010. TEP offers the Pinal West-Tortolita transmission lines for 2012. Only one of these two will likely be built in this ten-year period,
62 A.R.S. §40-360.02

Adequacy of Future System 62 November 2004
not both. The CATS alternative is a proposed participation project that APS has not yet committed to and has not yet identified a need.
Some of the alternatives shown on Figure 10 are not listed in the ten-year plans but have been identified as being considered by the utilities in SWAT. These are mostly circuits between Phoenix and Four Corners. It is possible that as conditions change, some of these options may be included in future plans as a result of the SWAT process. The study alternatives, in total, strengthen the system east and northeast of Phoenix and north of Tucson. They also would complete EHV loops around both Phoenix and Tucson.
The individual additions and reasons they are required are listed in Table 8.
Figure 10: Arizona EHV Transmission Area System and Plans
Palo Verde
San Juan
Springerville
Mead
McKinley
Greenlee
Silver King
Eldorado
Glen Canyon
North Gila
Vail
South
Tortolita
Saguaro
Kyrene
Pinal West
Jojoba
Coronado
Pinnacle Peak
Navajo
Devers
Four Corners
WestwingTS5
Cholla
Raceway
PS/SEV
RuddLiberty
PlannedStudy Alternatives
Ocotillo
Moenkopi
Crystal
McCullough
Mohave
Shiprock
Tucson
Browning
Phoenix
Santa Rosa
Hassayampa
EHV Study area
Winchester
Gateway

Third Biennial Transmission Assessment 2004-2013 Docket No. E-00000D-03-0047 63
Table 8: Arizona Planned EHV Transmission Additions Status Project Justification CEC
2006 completion Planned 345/69-kV
interconnection at WAPA’s Flagstaff 345 kV bus.
This substation will serve projected need for electric energy in the APS’ northern service area. The project will improve reliability and continuity of service for the growing communities in northern Arizona.
Not Needed
Planned Hassayampa – Pinal West 500-kV line.
This project is a result of the CATS study. When combined with the rest of the Southeast Valley project the line will increase import capability to the Phoenix Metropolitan area as well as increase the export capability from the Palo Verde/Hassayampa area. It is anticipated the line will be a joint participation project with SRP as the project manager.
CEC Case No. 124 Approved 2004 Decision #67012
Planned Interconnection Westwing-South 345 kV with future Palo Verde-Pinal West 500 kV via new Pinal West 500/345 kV Substation
To reinforce TEP’s EHV system and to provide a higher capacity link for the flow of power from the Palo Verde area into TEP’s service territory
2004
2007 completion Planned Palo Verde-TS5
500 kV line. This line will serve projected need for electric energy in the area immediately north and west of the Phoenix Metropolitan area. It will increase the import capability to the Phoenix Metropolitan area as well as increase the export capability from the Palo Verde/Hassayampa area.
Needed
2008 completion Planned Hassayampa –
Devers #2 500 kV line.
This line is proposed by Southern California Edison to increase transmission delivery from the Palo Verde Hub to southern California.
Needed
2009 completion Planned Second Knoll
loop-in of Coronado-Silver King 500-kV line.
This line will be needed to serve projected need for electric energy in Show Low and the surrounding communities.
Not Needed
2010 completion Planned Raceway loop-in
of Navajo-Westwing 500-kV line.
The loop-in of Raceway 500-kV line will be needed to provide contingency support to Raceway, increase system reliability, and increase the import capability to the Phoenix Metropolitan area.
Needed
Planned TS5 – Raceway 500 kV line.
Needed to serve projected load in the area immediately north and west of the Phoenix Metropolitan area. It will increase Phoenix Metropolitan area import capability as well as the export capability from the PV Hub.
Needed

Adequacy of Future System 64 November 2004
Status Project Justification CEC Alternative Palo Verde -
Pinal West - Saguaro 500 kV line.
This line is the result of the joint participation CATS study. The line will be needed to increase the adequacy of the existing EHV transmission system and permit increased power delivery throughout the state. It is anticipated the line will be a joint participation project.
2011 completion Planned Pinal West –
Santa Rosa – Browning 500-kV line.
This project is a result of the CATS study. The line will increase import capability to the Phoenix Metropolitan area as well as increase the export capability from the Palo Verde/Hassayampa area. It is anticipated the line will be a joint participation project with SRP as the project manager.
CEC is required with application anticipated in Oct. 2004
2012 completion Alternative Pinal West –
Tortolita 500 kV To reinforce TEP’s EHV system and to provide a higher capacity link for power flowing from the Palo Verde area into TEP’s northern area.
Needed
Undetermined during 2005-2013 period Alternative Tortolita –
Winchester 500 kV
To reinforce TEP’s EHV system and to provide a higher capacity link for the flow of power from the Palo Verde area into TEP’s northern area.
Needed
Winchester –Vail 345 kV 2nd circuit
To reinforce TEP’s EHV system and to provide additional transmission capacity into Tucson
Needed
Vail – South 345 kV 2nd circuit
To reinforce TEP’s EHV system and to provide additional transmission capacity between Vail and South.
Not Needed
Springerville – Greenlee 345 kV
To deliver power and energy from major TEP interconnections in the Four Corners area.
Not Needed
Tortolita – South 345 kV
To reinforce TEP’s EHV system and to provide a high capacity link into southern Arizona.
Siting Case 50
Westwing – South 345 kV
To deliver power from major TEP interconnections in the northwest Phoenix area.
Case 15
Planned South – Gateway 345 kV
To provide alternative transmission path into Nogales pursuant to an ACC Order.
Case 111
Planned Gateway – CFE 345 kV (2 circuits)
To provide a second path to serve Santa Cruz County and to interconnect with CFE in Sonora, Mexico.
Case 111
Greenlee – Hidalgo (NM) 345 kV (2 circuits)
To increase transfer capability into southern New Mexico.
Planned Mazatzal loop-in of Cholla-Pinnacle Peak 345 kV line.
This substation will serve projected need for electric energy in the area of Payson and the surrounding communities. Additionally, improved reliability and continuity of service will result for the growing communities in the Payson area.
Not Needed
Status: Planned — indicates the facility is planned to be added in the 2004-2013 period Alternative — indicates the facility is being considered as an alternative that was analyzed in the
CATS Phase II process. Only some of these alternatives will be planned and built in the 2004-2013 period.

Third Biennial Transmission Assessment 2004-2013 Docket No. E-00000D-03-0047 65
5.2 Arizona-California EHV System Assessment
The transmission facilities between Arizona and southern California have been an important part of the western electric power grid for several decades. This importance has grown in recent years as considerable independent generation has been built in Arizona, Utah and Nevada to serve California load. Of particular importance has been the transmission facilities that cross the Colorado River between Arizona and California—known as Path 49. This Path continues to be an important factor limiting power transfers in the West. This Path was an important part of the analysis made by STEP, as discussed in the previous chapter.
The area studied by STEP and the general options they identified are shown on Figure 11. The map reflects the three basic options identified by the STEP study team:
1. Short-term upgrades – Series capacitor upgrades, second Devers 500/230 kV transformer, and voltage support;
2. Palo Verde-Devers #2 500 kV Line; and
3. New 500 kV line into San Diego.
Figure 11: Arizona-California Area Transmission System
Source: Cambridge Energy Research Associates, Platts POWERmap®.
Gates Peaker
Devers
Miguel
Lugo
Vincent
Midway
N. Gila
Moenkopi
Navajo (SRP)
Crystal River
Imperial Valley
El Dorado
Palo VerdeVoltage support needed
Voltage improvement projects
Possible new projects

Adequacy of Future System 66 November 2004
The STEP team identified a number of actions that could be taken to increase the transfer capability of the transmission in short-term. They have advanced these projects as first steps to increase transmission capability. The short-term upgrades are shown in green on Figure 11. They include:
1) Southwest Power Link (SWPL) upgrades a) Series capacitors at North Gila and Imperial Valley b) Resolve clearance issues on Hassayampa-North Gila line
2) Palo Verde-Devers series capacitor upgrade 3) Devers 2nd 500/230kV transformer 4) Devers SVC or other voltage support device 5) Devers 230kV small upgrade 6) Imperial Valley phase shifter
A more detailed picture of these short-term improvements is shown in red in Figure 12.
Figure 12: Arizona-California Short-Term Transmission Improvements
Palo Verde
Hassayampa4020 MW
Jojoba
2080 MW
Kyrene
Tijuana La Rosita
ImperialValley
NorthGila
Miguel
Valley DeversSerrano
Westwing
590MW
1070MW
Rudd
Series Capacitor Upgrade
Small West of DeversUpgrade
Second 500/230kV transformer
Devers
Series CapacitorUpgrade
Additional ReactiveSupport
Add phase shifter

Third Biennial Transmission Assessment 2004-2013 Docket No. E-00000D-03-0047 67
For the long-term, new transmission will have to be built to provide additional transmission capability across this Path. The transmission lines shown in red on Figure 11 are the most-likely additions. The first new addition is a second Palo Verde – Devers 500 kV transmission line into the Los Angeles area. The other new project would add a 500 kV transmission line from Imperial Valley to Lugo through the edge of San Diego.
5.3 Arizona-New Mexico EHV System Adequacy
Arizona has limited interconnections with New Mexico as can be seen on Figure 13. The major generation in New Mexico is at San Juan/Four Corners and the output of the plants is shared by both Arizona and New Mexico utilities.
Figure 13: Major Arizona-New Mexico EHV Transmission
Albuquerque
El Paso
San Juan/Four Corners
Springerville
Greenlee
To Phoenix
To Tucson
To PhoenixandLas Vegas
NewMexico
Arizona
Texas
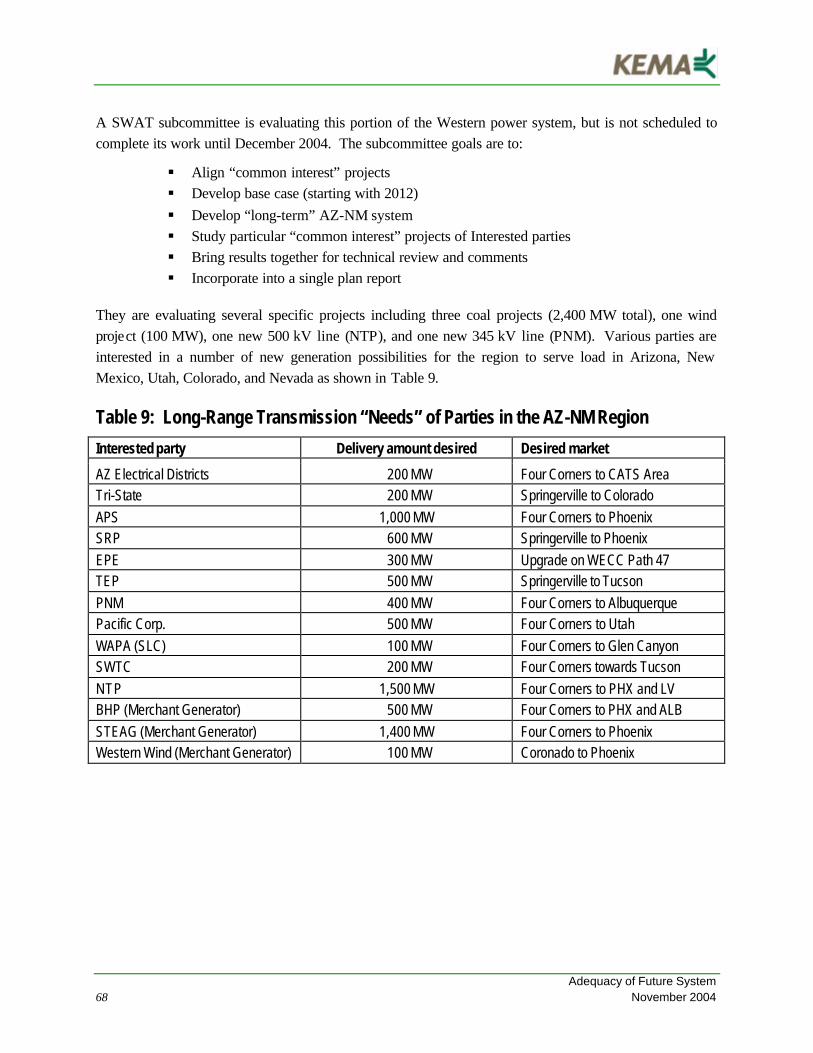
Adequacy of Future System 68 November 2004
A SWAT subcommittee is evaluating this portion of the Western power system, but is not scheduled to complete its work until December 2004. The subcommittee goals are to:
§ Align “common interest” projects § Develop base case (starting with 2012) § Develop “long-term” AZ-NM system § Study particular “common interest” projects of Interested parties § Bring results together for technical review and comments § Incorporate into a single plan report
They are evaluating several specific projects including three coal projects (2,400 MW total), one wind project (100 MW), one new 500 kV line (NTP), and one new 345 kV line (PNM). Various parties are interested in a number of new generation possibilities for the region to serve load in Arizona, New Mexico, Utah, Colorado, and Nevada as shown in Table 9.
Table 9: Long-Range Transmission “Needs” of Parties in the AZ-NM Region
Interested party Delivery amount desired Desired market
AZ Electrical Districts 200 MW Four Corners to CATS Area Tri-State 200 MW Springerville to Colorado APS 1,000 MW Four Corners to Phoenix SRP 600 MW Springerville to Phoenix EPE 300 MW Upgrade on WECC Path 47 TEP 500 MW Springerville to Tucson PNM 400 MW Four Corners to Albuquerque Pacific Corp. 500 MW Four Corners to Utah WAPA (SLC) 100 MW Four Corners to Glen Canyon SWTC 200 MW Four Corners towards Tucson NTP 1,500 MW Four Corners to PHX and LV BHP (Merchant Generator) 500 MW Four Corners to PHX and ALB STEAG (Merchant Generator) 1,400 MW Four Corners to Phoenix Western Wind (Merchant Generator) 100 MW Coronado to Phoenix

Third Biennial Transmission Assessment 2004-2013 Docket No. E-00000D-03-0047 69
5.4 Navajo Transmission Project
The Navajo Transmission Project is a 460- mile, 500 kV line with an expected capacity of 1,200 to 1,800 MW. It will interconnect the Shiprock, Moenkopi and Market Place substations, and traverse three states as shown in red on Figure 14. The Diné Power Authority is developing the project.63 The Navajo Nation has the right-of-way, which is 60% of the line from Shiprock to Moenkopi substation.
Figure 14: Navajo Transmission Project Concept
Palo Verde
San Juan
Springerville
Mead
McKinley
Greenlee
Eldorado
North Gila
Vail
South
Tortolita
Saguaro
KyreneJojoba
Coronado
Pinnacle Peak
Navajo
Devers
Four Corners
Westwing
Cholla
Rudd
Liberty
Moenkopi
Crystal
McCullough
Mohave
Shiprock
Tucson
Browning
Phoenix
Hassayampa
Winchester
Glen Canyon
Red Mesa
63 Diné Power Authority (DPA) is an enterprise of the Navajo Nation. It was created in 1985 by the Navajo Tribal Council for the purpose of developing electric transmission and generation projects within the Navajo Nation. RockPort Capital Partners (RockPort) is a venture capital firm that is assisting DPA in the Project Development Activities. Steven Begay is the DPA General Manager and Alexander (Hap) Ellis III is a Partner in RockPort.

Adequacy of Future System 70 November 2004
Many specifics of the project have not been settled. The idea is to build the project in three segments: 1. A 500 kV circuit from Shiprock (or a new station nearby) to Red Mesa (or a new
substation nearby); 2. A 500 kV circuit from Red Mesa to Moenkopi; and 3. A 500 kV circuit from Moenkopi to an existing substation in the Las Vegas area.
Diné’s current plan is to construct Segment 1 first including the eastern terminal near the Four Corners Power Plant and to construct the Red Mesa Substation for interconnection to the central Arizona 500 kV grid. The Red Mesa Substation will intercept and loop-in only the Navajo – Moenkopi 500 kV line to achieve the interconnection. It is expected that system studies will indicate a project rating of 1,200-1,500 MW. The plans should become more fully formed and project specifics determined by the middle of 2005.

Third Biennial Transmission Assessment 2004-2013 Docket No. E-00000D-03-0047 71
5.5 Phoenix-Tucson HV system adequacy
The existing Arizona HV (230, 138 and 115 kV) transmission system is shown in Figure 15. The 230 kV system is shown in blue and the 138 and 115 kV systems are shown in green. As can be seen in the figure the system is fairly complex and concentrated in both the Phoenix and Tucson areas. While there are a number of HV circuits that connect the two cities, their primary role is to serve load in the areas between the cities rather than interconnect them. The two areas are interconnected by existing and planned 345 kV and 500 kV EHV circuits. For the convenience of the reader, due to the density of the transmission system, future additions will be discussed for the Phoenix and Tucson areas separately. All the Phoenix-Tucson area planned and alternative HV transmission facilities are listed in Table 10.
Figure 15: Phoenix-Tucson Area HV Transmission System
Phoenix
Tucson 115 & 138 kV 230 kV
Existing

Adequacy of Future System 72 November 2004
The existing and future HV transmission system for the Phoenix area is shown on Figure 16. The facilities in this region are operated by APS, SRP and WAPA. The majority of HV transmission additions—shown as dashed lines—in the northern half of the area. Most of these additions are to serve growing load in the northern and eastern portions of metropolitan Phoenix.
Figure 16: Phoenix Area HV Transmission System
The existing and future HV transmission system for the Tucson area is shown on Figure 17. The facilities in this region are operated by TEP, Southwest Transmission Cooperative (“SWTC”) and WAPA. There are fewer new facilities in the Tucson area than in the Phoenix area. They are also more evenly distributed around the Tucson area to serve load in Tucson and to the northeast.
Westwing Pinnacle Peak
Rudd
Surprise
El Sol
Liberty
White Tanks
Deer Valley
Cactus
Reach
Lone Peak
Sunnyslope Alexander
Agua Fria
W Phoenix
Ocotillo Orme
Kyrene Knox
Santan Browning
Schrader
TS3
TS1 TS5
TS2
Anderson
Raceway Avery
TS6
RS17
RS19
Brandow Rogers Goldfield
RS23
Corbell
115 & 138 kV 230 kV
Existing Future

Third Biennial Transmission Assessment 2004-2013 Docket No. E-00000D-03-0047 73
Figure 17: Tucson Area HV Transmission System
Sandario
Marana
3-Points
Saguaro
Tortolita
Oracle San Manuel
North Loop
South Loop
Bicknell
RobertsWest Ina
East Loop
Spanish Trail
VailMidvale
Tucson
Demoss Petrie
Irvington
Saddlebrooke
Rillito
Tucson
Del Bac
La Canada
Rancho Vistoso
Robert Bills
Sierrita Green Valley
Desert Hills
U A Tech
Pantano
Sweetwater
Spencer
San Joaquin Santa Cruz
Catalina
Table 10 includes a few facilities not shown in Figure 16 or Figure 17. These facilities are in the area between Phoenix and Tucson or are in the mining areas lying along the eastern edge of the area. These facilities are marked with a double asterisk (**). There are also a number of “reconductoring” projects planned by TEP that are not listed in Table 10 since these projects use existing towers and substation facilities—they do not require new right-of-way for transmission.
115 & 138 kV 230 kV
Existing Future
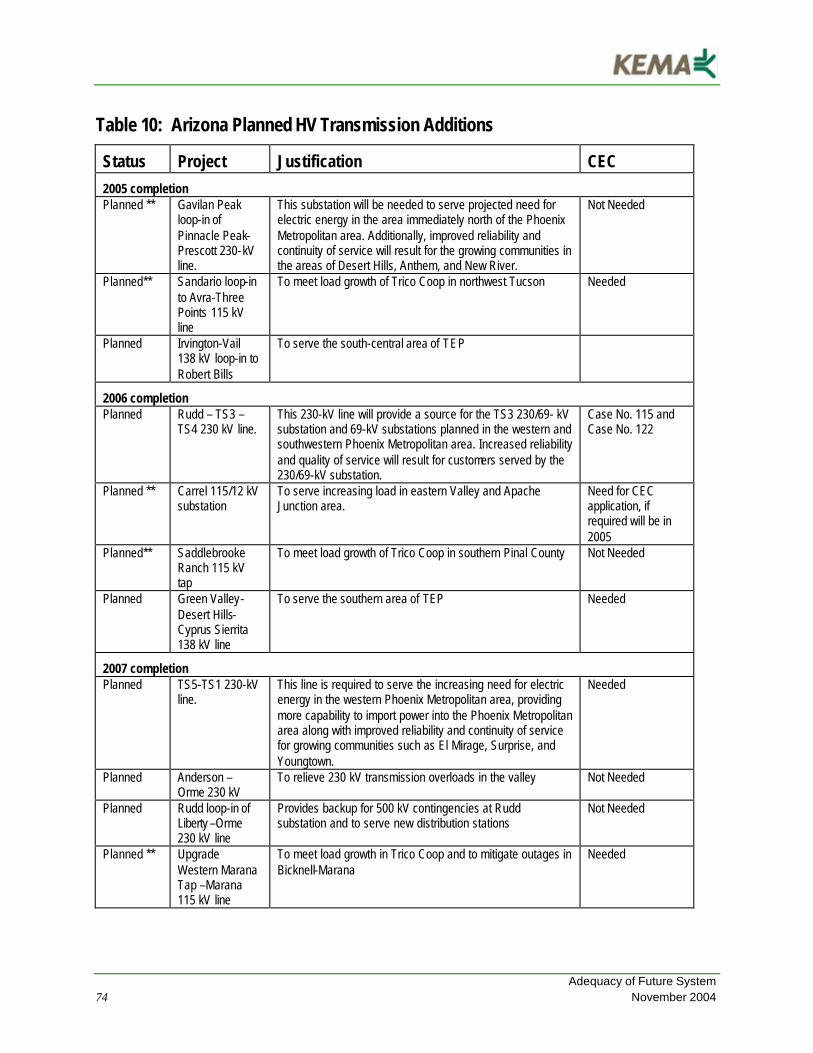
Adequacy of Future System 74 November 2004
Table 10: Arizona Planned HV Transmission Additions
Status Project Justification CEC
2005 completion Planned ** Gavilan Peak
loop-in of Pinnacle Peak-Prescott 230-kV line.
This substation will be needed to serve projected need for electric energy in the area immediately north of the Phoenix Metropolitan area. Additionally, improved reliability and continuity of service will result for the growing communities in the areas of Desert Hills, Anthem, and New River.
Not Needed
Planned** Sandario loop-in to Avra-Three Points 115 kV line
To meet load growth of Trico Coop in northwest Tucson Needed
Planned Irvington-Vail 138 kV loop-in to Robert Bills
To serve the south-central area of TEP
2006 completion Planned Rudd – TS3 –
TS4 230 kV line. This 230-kV line will provide a source for the TS3 230/69- kV substation and 69-kV substations planned in the western and southwestern Phoenix Metropolitan area. Increased reliability and quality of service will result for customers served by the 230/69-kV substation.
Case No. 115 and Case No. 122
Planned ** Carrel 115/12 kV substation
To serve increasing load in eastern Valley and Apache Junction area.
Need for CEC application, if required will be in 2005
Planned** Saddlebrooke Ranch 115 kV tap
To meet load growth of Trico Coop in southern Pinal County Not Needed
Planned Green Valley-Desert Hills-Cyprus Sierrita 138 kV line
To serve the southern area of TEP Needed
2007 completion Planned TS5-TS1 230-kV
line. This line is required to serve the increasing need for electric energy in the western Phoenix Metropolitan area, providing more capability to import power into the Phoenix Metropolitan area along with improved reliability and continuity of service for growing communities such as El Mirage, Surprise, and Youngtown.
Needed
Planned Anderson – Orme 230 kV
To relieve 230 kV transmission overloads in the valley Not Needed
Planned Rudd loop-in of Liberty –Orme 230 kV line
Provides backup for 500 kV contingencies at Rudd substation and to serve new distribution stations
Not Needed
Planned ** Upgrade Western Marana Tap –Marana 115 kV line
To meet load growth in Trico Coop and to mitigate outages in Bicknell-Marana
Needed

Third Biennial Transmission Assessment 2004-2013 Docket No. E-00000D-03-0047 75
Status Project Justification CEC Planned ** Red Rock-
Saguaro 230 kV line
To meet load growth of Trico Coop in northern Pima and southern Pinal counties
Needed
2008 completion Planned TS3-TS2-TS1
230-kV line. This line is required to serve the increasing need for electric energy in the western Phoenix Metropolitan area, providing more capability to import power into the Phoenix Metropolitan area along with improved reliability and continuity of service for growing communities such as El Mirage, Surprise, and Youngtown.
CEC Case No. 122 for TS3-TS2. CEC needed for TS2-TS1
Planned Raceway-Avery 230-kV double circuit line.
This line will serve projected need for electric energy in the area immediately north of the Phoenix Metropolitan area. Additionally, improved reliability and continuity of service will result for the area’s growing communities such as Anthem, Desert Hills and New River.
Case No. 120
Planned ** Apache-Hayden 115 kV tap to San Manual
To meet load growth of Trico Coop in southern Pinal county Needed
Planned ** Rancho Vistoso-Catalina 138 kV line
To serve the northern area of TEP
2009 completion Planned Pinnacle Peak-
TS6-Avery 230-kV double-circuit lines.
These lines will serve projected need for electric energy in the area immediately north of the Phoenix Metropolitan area. Additionally, improved reliability and continuity of service will result for the growing communities in the areas of Anthem, Desert Hills, and New River.
Case No. 120
Planned ** Valencia-Bopp Road 115 kV line
To meet load growth of Trico Coop in southern Pinal county Needed
2010 completion Planned 230 kV double
circuit line to connect Raceway 500/230 kV transformers to Raceway 230 kV substation.
Approximately 1 mile of double-circuit 230-kV lines from the 500/230 kV transformers at Raceway 500 kV to the Raceway 230-kV substation. (See 500 kV project description in Table 8, above.)
Needed
Planned Westwing – Raceway 230kV double-circuit Line.
The 230-kV line will serve increasing loads in the far north and northwest parts of the Phoenix Metropolitan area and provide contingency support for multiple Westwing 500/230- kV transformer outages.
Case No. 120
Planned ** Upgrade Marana-Avra Valley 115 kV line
To meet load growth in Trico Coop and to mitigate outages in Bicknell-Marana
Needed

Adequacy of Future System 76 November 2004
Status Project Justification CEC Planned Irving-Vail
138 kV loop-in to U of Arizona Tech Park
To serve the U of A Tech and southern area of TEP
2011 completion Planned Vail-East Loop
138 kV loop-in to Pantano
To serve the eastern area of TEP
2012 completion Planned** Gila Bend-TS8
230 kV line As a new transmission path to Yuma area, this 230 kV line will provide transmission capacity required to supplement limited transmission and generation resources in the Yuma area. This 230 kV line will also provide another source for the Gila Bend area.
Needed
Alternative **
Fountain Hills substation (115, 230, or 345 kV)
To supply load in the Northeast Scottsdale/Fountain Hills/Rio Verde area
CEC required w/ application anticipated in 2008
2013 completion Planned Westwing-El Sol
230-kV line. This line will increase system capacity to serve growing demand for electric energy in the Phoenix Metropolitan area, while maintaining system reliability and integrity for delivery of bulk power from Westwing south into the APS Phoenix Metropolitan area 230-kV transmission system.
Case No. 9
Undetermined during 2005-2013 period Alternative RS17 loop-in
230 kV To serve customer load in the Gilbert/Queen Creek area Not Needed
Alternative RS19 to RS23 230 kV
To meet load growth In the eastern distribution area. CEC required w/ application anticipated 2 yrs before in-service date
Alternative Rogers-Browning 230 kV
To deliver reliable delivery to the eastern valley area. CEC required w/ application anticipated 2 yrs before in-service date
Alternative **
Silver King-Browning 230 kV
To deliver Coronado or other power to eastern Arizona CEC exists for 6/38 miles, Case No. 20; application for remainder 2 yrs before in-service date
Alternative **
Silver King-Browning Superior 230 kV tie
To deliver reliable delivery to the eastern Arizona area. CEC required w/ application anticipated 2 yrs before in-service date

Third Biennial Transmission Assessment 2004-2013 Docket No. E-00000D-03-0047 77
Status Project Justification CEC Alternative Westwing-
Pinnacle Peak 230 kV line
To provide additional transfer capability from northwest Phoenix to northeast Phoenix
CEC acquired by APS in 2003
Alternative Pinnacle Peak- Brandow 230 kV line
To meet customer load. CEC acquired 1/85, Case No. 69, Decision #54345
Alternative Rogers-Corbell 230 kV line
To meet customer load. Not Needed
Alternative **
Silver King-New Hayden 230 kV line
To meet customer mining load. CEC required w/ application anticipated 2 yrs before in-service date
Alternative **
Kearny/Hayden-New Hayden double circuit loop
To meet customer mining load. CEC required w/ application anticipated 2 yrs before in-service date
Alternative Irvington-East Loop 138 kV line
To serve the central area of TEP
Alternative Snyder-Northeast 138 kV line
To serve the northeastern area of TEP
Alternative North Loop-DeMoss Petrie 138 kV loop-in to Sweetwater
To serve the western area of TEP
Alternative Midvale-Spencer-San Joaquin 138 kV line
To serve the far western area of TEP
Alternative South DeMoss Petrie 138 kV line
To reinforce TEP’s 138 KV SYSTEM
Alternative South-Cypress Sierrita 138 kV line
To serve the southern area of TEP
Status: Planned — indicates the facility is planned to be added in the 2004-2013 period Alternative — indicates the facility is being considered as an alternative that was analyzed in the CATS Phase II process. Only some of these alternatives will be planned and built in the 2004-2013 period. ** Indicates that these facilities are not shown on Figure 16 or Figure 17 because they are in the area between Phoenix and Tucson or are in the mining areas lying along the eastern edge of the area.

Adequacy of Future System 78 November 2004
5.6 Western Arizona HV System Assessment
This assessment is discussed later in section 6.2.4, below.
5.7 Conclusions on Adequacy of EHV and HV Arizona Transmission System
The Arizona EHV and HV transmission system is adequate in the future as planned. Planned facilities are identified in the planning process that is in compliance with good utility practice. There are sufficient identified alternative projects that should meet future needs for reliable supply of the Arizona load.

Third Biennial Transmission Assessment 2004-2013 Docket No. E-00000D-03-0047 79
6. Local-Area Transmission System
6.1 Arizona Reliability Must-Run (“RMR”) Generation Requirements
The 2002 BTA defined local load pockets as geographic locations in an electric system where the load cannot be served using a normal economic merit-order generation dispatch due to transmission limitations. During some portions of the year, generation units within the load pocket must be operated out of merit order to serve a portion of the local load. Such a resource requirement is often referred to as Reliability Must-Run generation. The power generated from local generation may be more expensive than the power from outside resources; and may be environmentally less desirable. During RMR conditions, transmission providers must dispatch RMR generation to relieve the congestion on transmission lines.
The Commission’s generic electric restructuring docket established that existing Arizona transmission constraints will limit APS’ and TEP’s ability to deliver competitively procured power to less than the required 50% of Standard Offer Service’s load.64 Therefore, the Commission, pending its Track B proceedings determination of the proper competitive procurement levels, has stayed this requirement. The UDCs are still obligated to assure that adequate transmission import capability is available to meet the load requirements of all distribution customers within its service area.65 Known transmission constraints result in APS and TEP being dependent upon local RMR generation to serve their peak load during certain hours of the year.
In order to provide the Arizona load pockets access to less costly power, the ACC Track A Decision No. 65154 ordered the Arizona utilities to work with Staff to develop a plan to resolve RMR concerns, and include the results of such a plan in the 2004 BTA. The same Decision ordered APS and TEP to file annual RMR study reports with the Commission in concert with their January 31 ten-year plan, for review prior to implementing any new RMR generation strategies, until the 2004 BTA is issued.
The utilities readily responded with 2003 and 2004 RMR studie s. The 2002 BTA Decision No. 65476 approved a collaborative RMR study plan agreed to by all Arizona Transmission Providers. The 2003 RMR study forum included only the transmission providers. The 2004 RMR process, in contrast, was open to all interested parties through the CATS study forum. The results of the 2003 RMR study enabled Staff to update the Contestable Load Exhibit B, as requested by Track B, Decision No. 65743. The RMR Study Framework is shown on Figure 18 below.
64 Direct Testimony of Jerry D. Smith and rebuttal testimony of Cary Deise, Docket No. E-00000A-02-0051. 65 A.A.C. R14-2-1609.B

Local Area Transmission System 80 November 2004
Figure 18: 2003 and 2004 RMR Study Framework
6.1.1 RMR Conditions and Study Methodology
In the 2002 BTA, Staff proposed that any UDC currently relying on local generation, or foreseeing a future time period when utilization of local generation may be required to assure reliable service for a local area, should perform and report the findings of an RMR study as a feature of their Ten-Year Plan filing with the Commission in January, 2003 and 2004. The 2002 BTA defined a Generic RMR Study Plan that required utilities to determine at least six RMR components to:
1. Define annual simultaneous import limits (“SIL”) for each transmission import limited area.
2. Provide a listing of all local generation and associated operational attributes.
3. Define RMR conditions for each year of the Ten-Year Plan.
4. Provide a local generation sensitivity analysis.
5. Identify and study alternative solutions.
6. Perform comparative analysis and present worth analysis of alternative solutions.
RMR conditions, required from RMR studies, are defined in the 2002 BTA and graphically presented in Figure 19.66
66 2002 BTA, Page 74-76
Per Track A Decision No. 65154:
File: 1/31/2003 1/31/2004
2003-2005 Study 2004-2013 Study
2004 Biennial
Transmission Assessment
Per Track A Decision No. 65154:
File: 1/31/2003 1/31/2004
2003-2005 Study 2004-2013 Study
2004 Biennial
Transmission Assessment
2003-2005 Study 2004-2013 Study
2004 Biennial
Transmission Assessment
2004 Biennial
Transmission Assessment
Per Track BDecision No. 65743:
Update: By Pre-Solicitation Review
Exhibit B Contestable
Load
Per Track BDecision No. 65743:
Update: By Pre-Solicitation Review
Exhibit B Contestable
Load
Exhibit B Contestable
Load

Third Biennial Transmission Assessment 2004-2013 Docket No. E-00000D-03-0047 81
Figure 19: RMR Conditions
Essential indicators that the Commission intended to receive as a result from the RMR studies are:
§ RMR hours - The number of hours during which the local load is above the SIL,
§ RMR energy - The amount of energy served from RMR generation,
§ RMR peak demand - The maximum RMR amount of capacity that the RMR generators would be required to produce,
§ RMR costs – The costs of out-of-merit-order dispatch for RMR purposes.
The 2002 BTA established specific RMR procedures. The transmission system’s SIL for each local constrained area is established for single contingencies (N-1) with no local generation in operation. An RMR condition exists during those times when the local load served by a UDC, or group of UDCs, exceeds that SIL. If no local generation exists for an RMR condition then the UDC(s) would have to utilize a load-shedding scheme for those contingencies that establish the SIL. This would imply a violation of WECC planning criteria since reliability practices are founded on the principle of continuity of service rather than restoration of service for single contingency outages.
SIL = Simultaneous Import Limit (w/o local generation)MLSC = Maximum Load Serving Capability (w/ local generation and associated reserves)
Jan MarFeb Apr May Jun Jul Aug Sep Oct Nov Dec
Loc
al L
oad
(MW
)
RMR HrsSIL
RMR Energy
MLSC
RMR Peak Demand
Local Peak Load
Hourly Load
SIL = Simultaneous Import Limit (w/o local generation)MLSC = Maximum Load Serving Capability (w/ local generation and associated reserves)
Jan MarFeb Apr May Jun Jul Aug Sep Oct Nov DecJan MarFeb Apr May Jun Jul Aug Sep Oct Nov Dec
Loc
al L
oad
(MW
)
RMR HrsSIL
RMR Energy
MLSC
RMR Peak Demand
Local Peak Load
Hourly Load

Local Area Transmission System 82 November 2004
When local generating units within the local load pocket are owned or under the operational control of the UDC(s), they are viewed as RMR units for the duration of the RMR condition. A local generating unit that is neither owned nor under operational control of the UDC(s) may be considered a non-RMR unit. In some instances, a non-RMR unit may have a “must-offer” requirement to assure that system reliability is maintained. A local non-RMR unit that is operational during the hours an RMR condition exists will have the automatic effect of mitigating the constraint to the extent it serves local load or its capacity and energy is scheduled out of the local load pocket.
Local generation, irrespective of its composition of RMR and non-RMR units, may offer an acceptable planning solution to RMR conditions. The local RMR condition is essentially mitigated when local generation capacity and its associated voltage regulation ability is equal to or greater than that required to reliably serve the local RMR peak load. The question that needs to be answered is whether such dependence on local generation is prudent and in the consumers’ best interest.
The maximum load serving capability (“MLSC”) of the local system is established by operating all local units at capacity, less local reserve requirements. The local MLSC equals to the SIL when there is no local generation. When local generation exists, the local MLSC is greater than the SIL but may fail to exceed the RMR peak load requirement. Such an RMR condition would require new transmission improvements or new local generation to assure reliable service to local consumers. When the MLSC is greater than the local peak demand, then the RMR condition is mitigated and there is less risk that local load would be interrupted for local transmission or generation outages.
Utilization of reactive devices such as high voltage shunt capacitors, static or dynamic Volt-Ampere Reactive (“VAR”) compensators, or Flexible AC Transmission System (“FACTS”) control devices should be considered for voltage and VAR margin constrained SIL conditions. Similarly, maintaining a unity power factor at the sub-transmission bus of distribution substations and seasonal tap changes for transformers lacking automatic tap changer under load capability should be considered as a means of resolving voltage or VAR margin deficiencies. Advancing planned transmission lines or construction of previously unplanned lines should be among the alternatives studied for thermal and stability constrained SIL conditions.
A comparative analysis of all alternative solutions, including using local generation that mitigates the local RMR condition is to be documented. The following factors should be considered when documenting the merits of the various alternatives: impact on SIL, system reliability implications, system losses, operational flexibility, environmental effects, implementation requirements and lead time, and opportunity for consumer benefits from competitive wholesale market. The following should also be identified in the comparative analysis of alternatives:
§ The total expected cost, fixed and variable, for the local generation dispatch that results in the lowest local generation dispatch to mitigate annual RMR conditions.

Third Biennial Transmission Assessment 2004-2013 Docket No. E-00000D-03-0047 83
§ Total emission pollutants produced by the lowest local generation dispatch mitigating the annual RMR condition.
A present worth analysis of all alternative solutions is also to be performed. The cost analysis is to include an assessment of the total expected cost of operating local units versus remote units in combination with some transmission solution. Local and remote generation cost assumptions must be documented.
The accuracy of RMR conditions depend upon technical studies, engineering assumptions and validity of data needed to determine:
1. Hourly load forecast for the future years.
2. SIL by ensuring that:
o Aggregate local area load is the total substation load actually impacted by the transmission constraint;
o RMR generation within the local area is accurate;
o With RMR generation modeled out-of-service, the transmission system meets required normal (N-0) reliability criteria, showing no thermal and/or voltage limit violations;
o With RMR generation modeled out-of-service, the transmission system meets required reliability all single contingency outages (N-1) criteria showing no thermal and/or voltage criteria violations; and
o With RMR generation modeled out-of-service, the transmission system remains stable and shows no voltage instability.
3. RMR production costs by ensuring that:
o Analysis is done using industry recognized production-cost model.
o Production-cost model database contains projected generation additions as accurate as possible, knowing in advance that future generation additions and unit commitments are dependent on many factors and are subject to change.
o Hydro generation modeling reflects actual operating conditions as accurately as possible.
o Thermal generation modeling reflects the current projection of variable operating and maintenance costs.
4. Comparison of the present worth of RMR production costs and present worth of transmission alternative costs.

Local Area Transmission System 84 November 2004
In concluding the 2002 BTA RMR Study and RMR Report requirements, Staff expressed the expectation that UDCs describe the course of action to be pursued and the rationa le for the solutions chosen. Of particular interest to the Commission was the degree to which the UDC’s planned action was in the best interest of consumers and the public. Consequently, this BTA will focus on answering the following questions:
1. Did the RMR studies performed by the UDCs meet the ACC’s technical study requirements?
2. Do the planned solutions to local area SIL constraints maintain the level of reliable service expected by consumers at a reasonable price?
3. Does the comparative analysis of alternative solutions support the solutions chosen to resolve transmission reliability constraints?
6.1.2 Summary of the 2003 and 2004 RMR Studies Process
The RMR study process implemented in 2003 had the following characteristics:
§ Stakeholders were concerned that the study process was closed to everyone but transmission providers.
§ Stakeholders’ opportunity to review and critique RMR results was limited to the ACC workshop.
§ Confusion and disagreement existed over the modeling of load and generation included in the Phoenix area.
§ The relative operational impact of various Phoenix area generation was not defined.
§ Confusion existed regarding the implications of the Mohave County RMR Study conclusions.
The 2004 RMR study process addressed these concerns by making the following improvements:
§ Study Process was open to all stakeholders – facilitated review and comments at each stage of the process.
§ Modeling and definition of load and generation included in the Phoenix area was improved.
§ Transmission improvements were planned to mitigate RMR concerns for Yuma, Phoenix and Tucson.
§ Santa Cruz County service reliability requires construction of planned transmission lines.

Third Biennial Transmission Assessment 2004-2013 Docket No. E-00000D-03-0047 85
Results of the 2003 and 2004 RMR studies for the three years: 2005, 2008, and 2012 are summarized for each RMR area (see Table 11).
There are still two unresolved issues with the 2004 RMR studies:
1. Staff remains concerned with local generation reserves for the Phoenix area post 2008.
2. Confusion remains regarding implications of Mohave County RMR Study results.
Table 11: Summary 2004 RMR Studies Results
Year SIL
(MW) MLSC (MW)
Peak demand
(MW)
RMR peak
demand (MW)
RMR hours
RMR energy (GWh)
RMR cost
($k/yr) Emission reduction
Phoenix 2004 8,,632 10,176 1,544 436 246 400 0.001-0.049% of total 2005 8,,617 11,182 11,141 2,524 678 550 0 0.007% of total 2008 10,511 13,295 12,425 1,914 338 222 0 2012 11,103 13,887 14,406 3,303 758 805 84
Yuma 2004 164 312 148 3,512 162 1,400 1.8tons/yr PM10 2005 265 394 344 79 714 20 500 0.001% PM 10 2008 292 421 380 88 676 21 0 2012 410 539 425 15 12 0 0
Tucson 2004 1,750 2,525 1,996 163 31.1 Not applicable 2005 1,609 2,551 2,000 178 34.8 68.0 Not applicable 2008 1,544 2,555 2,121 286 82.6 307.2 Not applicable 2012 1,886 2,872 2,286 119 38.5 301.9 Not applicable
Santa Cruz County 2004 2005 5 75 63.6 13.6 2008 50 75 70.1 20.1 2012 80 95 79.2 0
Mohave 2004 1,335 1,698 Note 1 Note 2 Note 2 Note 2 Note 2 Not applicable 2005 647 1,265 Note 1 Note 2 Note 2 Note 2 Note 2 Not applicable 2008 647 1,265 Note 1 Note 2 Note 2 Note 2 Note 2 Not applicable 2012 647 1,265 586.2 Note 2 Note 2 Note 2 Note 2 Not applicable Note 1: Years 2004, 2005, and 2008 were not studied as they had actual/project peak loads lower than 2012
while transmission and generation remained the same. Note 2: RMR conditions do not exist for the system because it can reliably support its projected peak load
without dispatching any of its generation.

Local Area Transmission System 86 November 2004
Based on the 2003 and 2004 RMR study results Staff recommends that:
§ Arizona utilities should continue performing RMR studies for all transmission import constrained local areas: o Utilizing a collaborative study forum, i.e., 2004;
o Improving economic analysis of RMR mitigation;
o Clarifying prevailing system conditions in Mohave County and appropriate mitigation;
o Making a more careful review of Phoenix-area reserves after 2008.
o RMR 10 year study results are to be filed with ten-year transmission plans by January 31, of even number years, to coincide with the associated ACC obligation to perform a Biennial Transmission Assessment and that:
1. Future RMR studies provide more transparent information on input data and economic dispatch assumptions, and
2. Utilities collaborate with Staff to develop and effectively implement more stringent criteria as appropriate for RMR areas in the 2006 BTA.

Third Biennial Transmission Assessment 2004-2013 Docket No. E-00000D-03-0047 87
6.2 Transmission Import Constraint Areas
The 2000 BTA identified three load pockets: Phoenix, Tucson, and Yuma. The 2002 BTA identifies two additional import constrained areas: Santa Cruz County and Mohave County. The issues and concerns in each of these five load pockets remain the subject of this BTA. Load pocket areas are shown on Figure 20.
Figure 20: 2004 BTA Arizona Load Pocket Areas
San Juan
NavajoGlenCanyon
North Gila
PaloVerde
SilverKingKyreneLiberty
South
Saguaro
Vail
Greenlee
ChollaMohave
MeadFour Corners
Springerville
McKinley
Tortolita
Phoenix
Tucson
Yuma
Westwing Coronado
PinnaclePeak
Transmission ImportConstrained Areas
Approved New EHV Lines
EHV345 & 500 kV
San Juan
NavajoGlenCanyon
North Gila
PaloVerde
SilverKingKyreneLiberty
South
Saguaro
Vail
Greenlee
ChollaMohave
MeadFour Corners
Springerville
McKinley
Tortolita
Phoenix
Tucson
Yuma
Westwing Coronado
PinnaclePeak
Transmission ImportConstrained AreasTransmission ImportConstrained Areas
Approved New EHV LinesApproved New EHV Lines
EHV345 & 500 kV
6.2.1 Phoenix Area RMR Conditions and Imports Assessment
6.2.1.1 Phoenix Existing and Future Transmission System
The interconnected transmission system serving the metropolitan Phoenix area is owned and operated by APS, SRP and WAPA. A majority of the Phoenix Valley load is served by transmission imports. Load growth occurring in the North and West Valley is served primarily by APS and the load growth in the East and South Valley is served primarily by SRP.

Local Area Transmission System 88 November 2004
• In its 2004 RMR Study, APS reported that the load flow and voltage stability analyses were done in order to determine Phoenix area critical outages as required by transmission planning criteria. APS conducts their analyses assuming that enough operating reserve will be available within the Phoenix area to respond during single contingencies.67 By maintaining an operating reserve within the load pocket, APS performs contingency analysis under more critical conditions than just (N-1) category. These criteria require transmission planning to accommodate main tenance outages while still being able to meet the N-1 criteria during a subsequent forced outage. The nature of the Phoenix area load is such that during the eight month period of October-May, any line or local area generator can be taken out of service for maintenance with adequate import capability and local area generation remaining to meet the N-1 criteria. Maintenance outages of 12-14 hours can also be taken during the summer at night. This capability will be documented in future 10-year plan filings.
The voltage stability study was performed using Q-V analysis on the most reactive deficient buses in the Phoenix area. These buses were the Kyrene 500-kV, Kyrene 230-kV, Browning 230-kV, Westwing 230 kV, and the Pinnacle Peak 230-kV buses. A Q-V analysis is performed by adding reactive load at the critical bus until the voltage reaches a minimum value, which indicates potential voltage instability. The voltage stability import limit is determined as the lesser of 95% of the import with zero reactive margin, or 100% of the import with a 5% voltage drop following the worst single -contingency per WECC planning criteria.
During summer 2005, the Phoenix area will be served from the following major EHV substations: Westwing, Pinnacle Peak, Kyrene, Rudd, Browning, and Silverking. These EHV stations form the “cornerstones” of an extensive internal network of 230-kV transmission lines that constitute the high voltage system within the Phoenix load area. Three new EHV substations will be added to the existing major EHV substations serving the Phoenix area in later years of the utilities’ plans. They are: the TS5 substation in 2007 and the South East Valley (SEV) substation. Finally, the Raceway substation will be added in 2012. Figure 21 illustrates these facility additions as they were modeled in the RMR studies. The timing of some of the planned new EHV facilities has since been modified.
67APS 2004 RMR Study, Page 8

Third Biennial Transmission Assessment 2004-2013 Docket No. E-00000D-03-0047 89
Figure 21: New Projects Strengthening the Phoenix-Area Transmission System
W e s t w i n g5 0 0 K V
2 3 0 K V
S u r p r i s e
L o n e P e a k C a c t u s Ocot i l lo
2 3 0 K V
3 4 5 K V
P i n n a c l e P e a k
5 0 0 K V
R u d d K y r e n e5 0 0 K V
P a l oV e r d e /
H a s s a y a m p a
GilaRiver
R e a c h
5 0 0 K V
2 3 0 K V
D e e r V a l l e y
B randow (2 )P a p a g o B u t t e
R o g e r s ( 2 )
6 9 K v ( 3 )
69Kv
G a v i l a n P e a k
( 3 )
A g u a F r i a
D e e rV a l l e y
6 9 K v ( 2 )
R a c e w a y
(3)
( 2 )
2 3 0 K V
O r m e
B u c k e y e
TS4
L i b e r t y
2 3 0 K V
6 9 K v
K n o x
5 0 0 K V
(2)2 3 0 K V
B r o w n i n g
5 0 0 K V
2 3 0 K VSilverK i n g
J o j o b a
(2)
( 2 )
A p a c h e
B o n n e y B r o o kTap
A s a r c oTap
H a y d e n
1 1 5 K V
1 1 5 K V
S p o o kHill
C o o l i d g e
2 3 0 K V
P h o e n i xA r e a L o a d
P h o e n i x A r e aL o a d ( 2 0 0 5 )
C r i t i c a l O u t a g e C r i t i c a l E l e m e n t
- S I L J o j o b a - K y r e n e V o l t a g e c o l l a p s e i nS o u t h e a s t p a r t o f V a l l e y
- M L S C J o j o b a - K y r e n e O r m e - R u d d
Orme
C r i t i c a lE l e m e n t
C r i t i c a l O u t a g e
Westwing500KV
230KV
Surprise
Lone Peak Cactus Ocotillo
230KV
345KV
Pinnacle Peak
500KV
Rudd
Kyrene
500KV
PaloVerde/
Hassayampa
GilaRiver
Reach
500KV
230KV
Deer Valley
Brandow (2)Papago Butte
Rogers (2)
69Kv (3)
69Kv
Gavilan Peak
(3)
Agua Fria
DeerValley
69Kv (2)
Raceway
(4)
(2)
230KV
Buckeye
TS4
Liberty
230KV69Kv
Knox
500KV(2)
230KV
Browning
500KV
230KV SilverKing
Jojoba
(2)
(2)
Apache
BonneyBrookTap
AsarcoTap
Hayden
115KV
115KV
SpookHill
Coolidge
230KV
PhoenixArea Load
Phoenix AreaLoad (2008)
500KV 230KV
TS5
500KV(2)
230KV
South EastValley
Critical Outage Critical Element
- SIL Jojoba-Kyrene Voltage collapse inSoutheast part of Valley
- MLSC Glendale-Agua Fria West Phoenix-Lincoln St.
WestPhoenix
LincolnSt.
Agua Fria
Glendale
Critical Outage
Critical Outage
CriticalElement

Local Area Transmission System 90 November 2004
In performing the Phoenix area RMR studies several planned projects were added to reflect transmission system upgrades for the next ten years. The complete list of related project additions assumed for studies is listed in Table 12 below:
Westwing500KV
230KV
Surprise
Lone Peak Cactus Ocotillo
230KV
345KV
Pinnacle Peak
500KV
Rudd
Kyrene
500KV
PaloVerde/
Hassayampa
GilaRiver
Reach
500KV
230KV
Deer Valley
Brandow (2)Papago Butte
Rogers (2)
69Kv (3)
69Kv
Gavilan Peak
(3)
Agua Fria
DeerValley
69Kv (2)
Raceway
(4)
(2)
230KV
Buckeye
TS4
Liberty
230KV69Kv
Knox
500KV(2)
230KV
Browning
500KV
230KV SilverKing
Jojoba
(2)
(2)
Apache
BonneyBrookTap
AsarcoTap
Hayden
115KV
115KV
SpookHill
Coolidge
230KV
PhoenixArea Load
Phoenix AreaLoad (2012)
500KV 230KV
TS5
500KV(2)
230KV
South EastValley
TS6
69KvAvery
Critical Outage Critical Element
- SIL Palo Verde-Rudd Westwing-Surprise
- MLSC Palo Verde-Rudd Westwing-Surprise
Critical Outage
CriticalElement

Third Biennial Transmission Assessment 2004-2013 Docket No. E-00000D-03-0047 91
Table 12: Phoenix Area Facilities Additions
6.2.1.2 Phoenix Area – SIL and RMR Conditions for 2005, 2008, and 2012
The Phoenix area is a tight network of APS and SRP load, resources, and transmission facilities. Because the Phoenix system is highly integrated, it was imperative that the import limits be determined for the combined area. The SIL analysis in the 2004 RMR study was coordinated between APS and SRP
2005 2008 2012
• Gavilan Peak substation connected to Pinnacle Peak-Prescott 230-kV line
• Silver King substation connected to Cholla-Saguaro 500-kV line
• A new Raceway 500-kV substation connected to Navajo-Westwing 500-kV line and a 500-kV line to TS5 substation
• Reach 2nd 230/69-kV transformer addition • South East Valley project• A new TS2 230-kV substation with a 230/69-kV transformer and connected to TS1-TS3 230-kV line
• Browning 230/69-kV, 280 MVA transformer addition
• A new Avery 230/69-kV substation with a 230/69-kV transformer and a 230-kV line from Raceway substation
• A new TS6 230/69-kV substation with a 230/69-kV transformer and connected to a new Avery-Pinnacle Peak 230-kV line
• Cactus 3rd 230/69-kV transformer addition• A new TS5 500/230-kV substation with two 500/230-kV transformers, a 500-kV line to Palo Verde area
• Meadowbrook 2nd 230/69-kV transformer addition
• North Gila 2nd 500/69-kV transformer addition
• A new TS1 230/69-kV substation with a 230/69-kV transformer, a 230-kV line to TS5 Palo Verde area
• Alexander 2nd 230/69-kV transformer addition
• Surprise 2nd 230/69-kV transformer addition
• A new TS3 230/69-kV substation with a 230/69-kV transformer, a 230-kV line to TS1substation, and connected to Rudd-TS4 230-kV line
• West Phoenix 3rd 230/69-kV transformer addition
• Lincoln Street 2nd 230/69-kV transformer addition
• Thunderstone 2 new 230/69-kV, 280 MVA transformer additions • Rudd 4th 500/230-kV transformer addition
• Alexander 69-kV 46mvar capacitors addition
• A new Jojoba 230/69-kV substation with a 230/69-kV transformer and connected to Gila River-Liberty 230-kV line
• Santan CC5 550 MW generation addition • Santan CC6 275 MW generation addition

Local Area Transmission System 92 November 2004
personnel, who had significant involvement in the study. WAPA also coordinated with APS and SRP in the study because their transmission facilities interface with the Phoenix network.
The SIL and the RMR conditions for the Phoenix area were performed for 2005, 2008, and 2012. The year 2005 was selected to provide a benchmark for comparison with the 2003 RMR study. The years 2008 and 2012 were selected as representative years during the ten-year window and because databases for these years were being used to perform studies in other study forums.
Base case and contingency power flow, stability, and voltage stability analyses were performed to determine import limitations. The initial starting cases were based on WECC heavy summer full loop base cases for the corresponding year. Those base cases model the entire Western Interconnection’s transmission system and were reviewed and then updated to represent expected loads and system configuration for 2005, 2008 and 2012. All cases were coordinated between APS, SRP, TEP, SWTC, and WAPA to capture the most accurate expected operating conditions for the Arizona transmission system. Also, the 2012 case is consistent with the 2012 case used in the CATS Phase III study.
SIL and RMR conditions of the Phoenix area transmission network resulted in area import limits based on the analysis discussed above. The study process, representative years, and base cases were properly selected.
The limiting contingencies and nature of constraint, reported in the APS 2004 RMR Study are summarized in the Table 13.
Table 13: Phoenix Area Critical Outages
Critical Outage Nature of Constraint
less than 1400 MWloss of the Jojoba-to-Kyrene 500 kV line
system is constrained by voltage instability
at least 1400 MW loss of the Jojoba-to-Kyrene 500 kV line
thermal overload of the Rudd-to-Orme 230-kV
less than 1600 MWloss of the Jojoba-to-Kyrene 500 kV line
system is constrained by voltage instability
at least 1600 MW loss of the Agua Fria-to-Glendale 230-kV line
overload of the West Phoenix-to-Lincoln Street 230-kV line
all levels loss of the Palo Verde-to-Rudd 500-kV line
thermal overload on the Westwing-to-Surprise 230-kV line
2008
2005
2012
Local Generation Dispatch
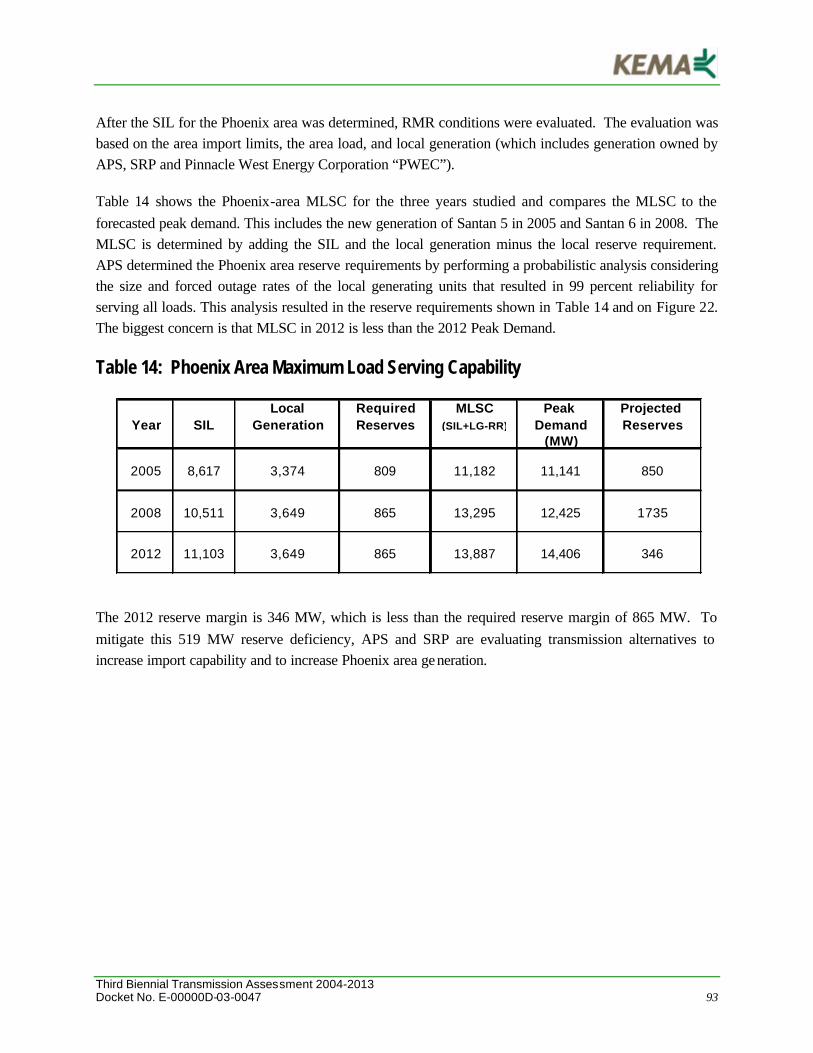
Third Biennial Transmission Assessment 2004-2013 Docket No. E-00000D-03-0047 93
After the SIL for the Phoenix area was determined, RMR conditions were evaluated. The evaluation was based on the area import limits, the area load, and local generation (which includes generation owned by APS, SRP and Pinnacle West Energy Corporation “PWEC”).
Table 14 shows the Phoenix-area MLSC for the three years studied and compares the MLSC to the forecasted peak demand. This includes the new generation of Santan 5 in 2005 and Santan 6 in 2008. The MLSC is determined by adding the SIL and the local generation minus the local reserve requirement. APS determined the Phoenix area reserve requirements by performing a probabilistic analysis considering the size and forced outage rates of the local generating units that resulted in 99 percent reliability for serving all loads. This analysis resulted in the reserve requirements shown in Table 14 and on Figure 22. The biggest concern is that MLSC in 2012 is less than the 2012 Peak Demand.
Table 14: Phoenix Area Maximum Load Serving Capability
Local Required MLSC Peak Projected Year SIL Generation Reserves (SIL+LG-RR) Demand Reserves
(MW)
2005 8,617 3,374 809 11,182 11,141 850
2008 10,511 3,649 865 13,295 12,425 1735
2012 11,103 3,649 865 13,887 14,406 346
The 2012 reserve margin is 346 MW, which is less than the required reserve margin of 865 MW. To mitigate this 519 MW reserve deficiency, APS and SRP are evaluating transmission alternatives to increase import capability and to increase Phoenix area generation.

Local Area Transmission System 94 November 2004
Figure 22: Phoenix Area Reserves
2000
1800
1600
1400
1200
1000
800
600
400
200
02005 2008 2012
Reserves(MW) 850
1735
346
809865 865
99% Reliability Reserve Requirement
To determine the RMR costs for the Phoenix area, an economic analysis was performed using a regional production cost model. The production cost was determined for two scenarios:
§ Phoenix load supplied by local area generation with the existing transmission system import limit; and
§ Phoenix load supplied by local area generation without the existing transmission import system limit.
The difference between the production costs from these two cases shows the RMR cost of the transmission constraint.
These two cases were simulated with a detailed regional production-costing model that includes the generation and transmission system of the entire WECC. The model dispatches all generators on an economic basis to meet the overall WECC system load within constraints for control area reserve requirements and transmission limitations. The model also determines sales of economic generation to, and economic purchases from, other utilities in the region subject to regional transmission constraints.

Third Biennial Transmission Assessment 2004-2013 Docket No. E-00000D-03-0047 95
The accuracy of the RMR costs depends upon accuracy of the forecasts for load, generation heat rates and forced outage rates, fuel costs, and other costs. Because these costs are not easy to predict Staff recommends that for the 2006 RMR Study, production cost analysis be conducted assuming low and high fuel cost scenarios, as well as a variation of the other cost components.
§ The general data used in the production cost model is shown in Table 15.68
Since this data is not specific, Staff recommends that APS (and others required to perform the 2006 RMR Studies) make available to the Staff the list of the actual generation unit data used in the model and generation units energy production calculated by the model.
Table 15: Generating Unit Operational Characteristics (Average Values – AZ-NM-S. NV)
Fuel Type Technology Size Install Heat Rate VOM EFOR%MW Date Btu/kWh $/MWH
Gas/Oil Steam 12,000 2.0 6%Gas SC <100 Pre 2000 14,000 4.1 10%Gas SC >100 Post 2000 10,500 4.1 5%Gas CC <100 Pre 2000 8,700 2.0 5%Gas CC 500 Post 2000 7,000 3.0 5%Coal Steam <500 11,200 1.4 7%Coal Steam >500 10,000 1.4 9%
RMR cost analysis as well as Phoenix area Air Emission Reductions analysis show that removal of the transmission constraints could provide only negligible impact. Consequently, there are no alternatives proposed for reinforcing the Phoenix area transmission system to increase the transmission import limit other than the projects already planed.
6.2.1.3 Phoenix 2003 and 2004 RMR Study Findings
The Phoenix area 2003 and 2004 RMR study findings are:
§ APS load is expected to exceed import capability for 678 hours in 2005, 338 hours in 2008, and 758 hours in 2012. 69 RMR energy represents approximately 1% of the total energy.
§ Estimated cost to run local generation outside of economic dispatch is less than $100,000 in each year. Such small annual RMR costs do not justify construction costs to relieve RMR.
§ The projected reserves in 2012 are 346 MW compared to a 99% reliability reserve requirement of 865 MW. Although the reserve margin deficiency is not itself related to RMR, it is a load-
68 ADS 2004 RMR Study, Appendix A, Page 1 69 Details provided in Table 11.

Local Area Transmission System 96 November 2004
serving issue that should be addressed. To mitigate this deficiency APS and SRP are presently evaluating both transmission and generation alternatives to increase import capability and alternatives to increase Phoenix area generation.
§ Removing the transmission constraint would reduce emissions in the Phoenix Area by only 0.007% or less.
6.2.1.4 Staff Observation
In this section, Staff provides its observations of the SIL and RMR components for the Phoenix Area. Upon review of Table 14 and the graph provided in Figure 23, it was obvious that the 2012 Phoenix peak demand is higher than the MLSC. This concerns the Staff and Staff firmly supports the APS and SRP efforts to develop the alternatives to mitigate this deficiency. The Arizona utilities have stated their intent to fully address the reserve margin in their planning processes.
Figure 23: Phoenix Area Load Serving Capability
6,000
8,000
10,000
12,000
14,000
16,000
2005 2006 2007 2008 2009 2010 2011 2012
Years
MW
MLSC
SIL
Peak
A second observation from Table 14 is that the SIL and MLSC increases are attributable to the planned transmission improvements. The implication is that the Phoenix load is remaining dependent upon capacity and energy supplied by local generation. As long as this local generation is price-competitive with the outside generation the RMR cost will be small.
Another observation is that the SIL reflects (N-1) transmission outages and does not clearly reflect overlapping contingency (N-1-1) as the WECC and NERC transmission-planning criteria require. While this additional capacity requirement may be reflected in probability calculations of the local reserve, Staff supports an effort from utilities to clearly explain their compliance with these criteria in the 2006 BTA.

Third Biennial Transmission Assessment 2004-2013 Docket No. E-00000D-03-0047 97
With respect to the results of the production cost analysis, Staff is somewhat concerned with how the value of the RMR for 2012 is determined. As mentioned above, the 2012-year shows a shortage in required reserve in the Phoenix area. That means that the probability of load curtailment increases. The APS 2004 RMR Study does not make it clear whether or not this increased probability of load curtailment was factored into the cost analysis. Staff recommends that the 2006 RMR Studies provide more transparency regarding the components of the production costs.
6.2.2 Yuma Area RMR Conditions and Import Assessment
6.2.2.1 Yuma Existing and Future Transmission System
The Yuma area is served from three transmission sources:
§ The first is the APS’ North Gila 500/69 kV substation, which is located east of Yuma. Two 69 kV lines extend west and southwest from this substation into Yuma to serve the Yuma area load. A third 69 kV line interconnects into WAPA’s Gila substation.
§ The second is WAPA’s Gila 161/69 kV station, which is also located east of Yuma. From this station, APS has one 69 kV line into the Yuma load area and one 69 kV tie to APS’ North Gila substation.
§ The third is APS’ Yucca 161/69 kV station, which is located on the west side of Yuma near the Colorado River. APS’ local generation is located at this station, along with three 69 kV lines into the load area and an interconnection to Imperial Irrigation District’s (“IID”), 161 kV system through two 161/69 kV transformers. The IID 75 MW steam-generating unit is also located at this substation.
In its 2004 RMR Study, APS reported that load flow and voltage stability analysis were done to determine Yuma-area critical outages as required by transmission planning criteria. APS conducts contingency analysis based on single contingency (N-1) criteria.
Future additions in the Yuma area include:
§ A second North Gila 500/69-kV transformer is planned for 2005 as a result of the 2003 RMR study.
§ The Welton-Mohawk interconnection facilities and generators, which are planned for 2006, were modeled in the 2008 case. The interconnection facilities will consist of a 161-kV line and a third 161/69-kV transformer to WAPA’s Gila substation, along with a 161-kV line and 161/69-kV to APS’ North Gila 69-kV substation.

Local Area Transmission System 98 November 2004
§ The addition of the 230-kV line from Gila Bend to the Yuma area in 2012. The specific Yuma termination for this line has not yet been determined and for the 2012 analysis. It was assumed to be interconnected to the 32nd Street substation. Figure 24 illustrates these additions.
Figure 24: New Projects Strengthening the Yuma Area Transmission System APS Yuma Area in 2005
Hassayampa/Palo Verde
N.Gila 500/69 kV
WAPAGila 161/69 kV
Imperial Valley/San Diego
Pilot Knob
Yucca 161/69 kV
APS Yuma AreaNetwork
YCA
IID CT#21IID-Steam #1APS-CT 1-4

Third Biennial Transmission Assessment 2004-2013 Docket No. E-00000D-03-0047 99
APS 2008 Yuma Area
Hassayampa/PaloVerde
N.Gila 500/69 kV
WAPAGila 161/69 kV
Imperial Valley/San Diego
Pilot Knob
Yucca 161/69 kV
APS Yuma AreaNetwork
YCA
I ID CT#21IID-Steam #1APS-CT 1-4
BLK1/8/04
CriticalOutage
LimitingElement
LagunaTap
APS 2012 Yuma Area
In performing the Yuma area studies several planned projects were added to reflect transmission system upgrades for the next ten years. They are listed in Table 16 below:
Hassayampa/Palo Verde
N.Gila 500/69 kV
WAPAGila 161/
69 kV
Imperial Valley/San Diego
Pilot Knob
Yucca 161/69 kV
APS Yuma AreaNetwork
YCA
IID CT#21IID-Steam #1APS-CT 1-4
BLK1/8/04
GilaBend
TS8CriticalOutage
Mittry
LimitingElement
LagunaTap
Quechan

Local Area Transmission System 100 November 2004
Table 16: Yuma Area Facility Additions
6.2.2.2 Yuma Area – SIL and RMR Conditions for 2005, 2008, and 2012
With planned system additions for the Yuma area, along with some accelerated projects the SIL for the Yuma area will increase each study period. For 2005, 2008, and 2012 the SIL will be 265 MW, 292 MW and 410 MW, respectively. In performing this analysis, all previously planned projects were included in the model as well as some additional projects that were added to the sub-transmission plans. Also, several previously planned shunt capacitor banks were accelerated and several new banks were added to maximize the capability of the transmission system by ensuring that the area was not severely voltage limited. These projects are listed in Table 16, above.
Several critical contingencies exist affecting the determination of the system import limit for the Yuma area. For the 2004-2011 period, these include the Hassayampa-North Gila 500-kV line, the Yucca-Laguna tap 69-kV line, and the North Gila-Gila 69-kV line. In 2012 and beyond, the loss of the new TS8-Gila Bend 230-kV line also becomes a critical contingency. The limiting contingencies and nature of the constraint reported in the APS 2004 RMR Study are summarized in Table 17.
Study Case
System Projects Added
2005 base case Existing Foothills 69-kV, 32Mvar cap banks Gila cap bank
Laguna cap bank2nd N. Gila 500/69kV transformer
2008 base case 2005 base case 32nd Street-10 th Street 69kV reconductor N. Gila-Mittry 69kV reconductor
32nd Street-Ivalon 69 kV reconductor
2012 base case 2008 base case Gila Bend-TS8 230 kV line TS8 cap banks
Case Description

Third Biennial Transmission Assessment 2004-2013 Docket No. E-00000D-03-0047 101
Table 17: Yuma Area Critical Outages
After the SIL for the Yuma area was determined, RMR conditions were evaluated for the area based on the area import limits, the area load, and local-area generation, which include generation owned by APS.
Table 18 shows the Yuma area MLSC for the three years studied and compares the MLSC to the forecasted peak demand. This includes the new transmission projects proposed by 2012. The MLSC is determined by adding the SIL and the local generation minus the local reserve requirement. APS determined the Yuma area reserve requirements by performing a probabilistic analysis that considered the size and forced outage rates of the local generating units and resulted in 99 percent reliability of serving all load. This analysis resulted in reserve requirements of 138 MW for the Yuma area for the years 2005, 2008, and 2012. In each year projected reserve is much higher than required.
Table 18: Yuma Area Maximum Load Serving Capability
Year SIL Local
Generation Required Reserves
MLSC (SIL+LG-RR)
Peak Demand
(MW Projected Reserves
2005 265 267 138 394 344 188
2008 292 267 138 421 380 179
2012 410 267 138 539 425 252 To determine the RMR costs for the Yuma area, an economic analysis was performed using a regional production–cost model, just as for Phoenix. The comments Staff provided in Section 6.2.1.2 are applicable to Yuma RMR cost calculation.
Critical Outage Nature of Constraint
Hassayampa-N.Gila 500-kV line
thermal overloads of the Yucca 161/69-kV transformers
N.Gila-Gila 69-kV
overloading the N.Gila-Mittry 69-kV line or the Mittry-Quechan 69-kV line.
Yucca-Laguna tap 69-kV lineoverload on the Riverside-10th Street 69-kV line.
Gila Bend-TS8 230-kV line
thermal overload on the Mittry-Quechan 69-kV line and Yucca-Laguna tap 69-kV line
2004-2011
2012

Local Area Transmission System 102 November 2004
Unlike the Phoenix area, the Yuma imports do approach their limits at various times throughout the year 2005. The analysis indicated that the Yuma import limit would be constraining for 336 hours in 2005, 2 hours in 2008, and zero hours in 2012. The energy associated with these hours amounts to 8 GWh. The cost of this constraint in 2005 is approximately $500,000.70 APS found that it would be more economical to import cheaper power either from APS units outside the Yuma area or from the wholesale market.
The Yuma RMR cost analysis as well as the Yuma area Air Emission Reductions analysis shows that advancement of the transmission projects are not justified. Consequently, there are no alternatives proposed for reinforcement of the Yuma area transmission system in order to increase the transmission import limit other than projects already planed.
6.2.2.3 Yuma 2003 and 2004 RMR Study Findings
The Yuma area 2003 and 2004 RMR study findings are:
§ APS load is expected to exceed imports in 2004 by 3,512 hours.71
§ Estimated cost to run local generation “out of the money” is approximately $1.4 million per year.
§ Construction cost to relieve RMR is approximately $3.5 million. APS will pursue the installation of the second North Gila 500/69kV transformer.
§ APS load is expected to exceed import capability for 714 hours in 2005, 676 hours in 2008, and 12 hours in 2012.
§ Estimated cost to run local generation outside of economic dispatch is approximately $1.0 million in 2005 and $0 in 2008 and 2012.
§ The second North Gila transformer in 2005 and new 230kV line in 2012 effectively manage RMR conditions.
§ Removing the transmission constraint in 2005 would reduce PM10 annual emissions by 1 ton.
6.2.2.4 Staff Observation
In this section, Staff provides its observations of the SIL and RMR components for the Yuma area. Addition of the second North Gila transformer in 2005 and the new 230kV line in 2012 appear to effectively manage RMR conditions in Yuma area. Removing the transmission constraint in 2005 would reduce PM10 annual emissions by 1 ton. With the planned additions, especially the 230 kV Gila Bend-TS8
70 APS 2004 RMR Study, Table 17, Page 49. 71 Details provided in Table 11.

Third Biennial Transmission Assessment 2004-2013 Docket No. E-00000D-03-0047 103
line in 2012, the SIL (410 MW) is almost equal to the Yuma area peak demand (425 MW). Consequently, the future Yuma area load should have full access to the outside market.
Figure 25: Yuma Area Load Serving Capability
100150200250300350400450500550600
2005 2006 2007 2008 2009 2010 2011 2012
Years
MW
MLSC
SIL
Peak
6.2.3 Tucson Area RMR Conditions and Import Assessment
The Tucson area is located in a large valley surrounded by mountains and, until 1969, was served only by local generation. Now, imported power is transmitted from the Westwing substation in the northwest Phoenix metropolitan area to the South substation in Tucson, and the Four Corners area and eastern Arizona power stations to both the Tortolita and the Vail substation in Tucson.
For single contingencies, the most economical combination of local generation and reactive devices is utilized to ensure that contingencies meet WECC / NERC reliability criteria. TEP also uses its own internal voltage criterion: 0.98 per unit post-outage 138 kV voltage. The TEP control area has historically been voltage-stability constrained. Local Var-responsive steam units and combustion turbines can be committed in the Tucson area to supply reactive support and to lower imports as necessary.
TEP plans and operates its system to meet the WECC / NERC Reliability Criteria for both level B (N-1) and Level C (N-2; N-1-1) contingencies, as well as the WECC Voltage Stability Criteria. TEP planned facilities are shown in Figure 26.
All base cases used were co-developed by APS, SRP, TEP, WAPA, and SWT. Planned system configuration changes for all these utilities were used to develop the various cases. Table 19 gives a description of the planned TEP projects.
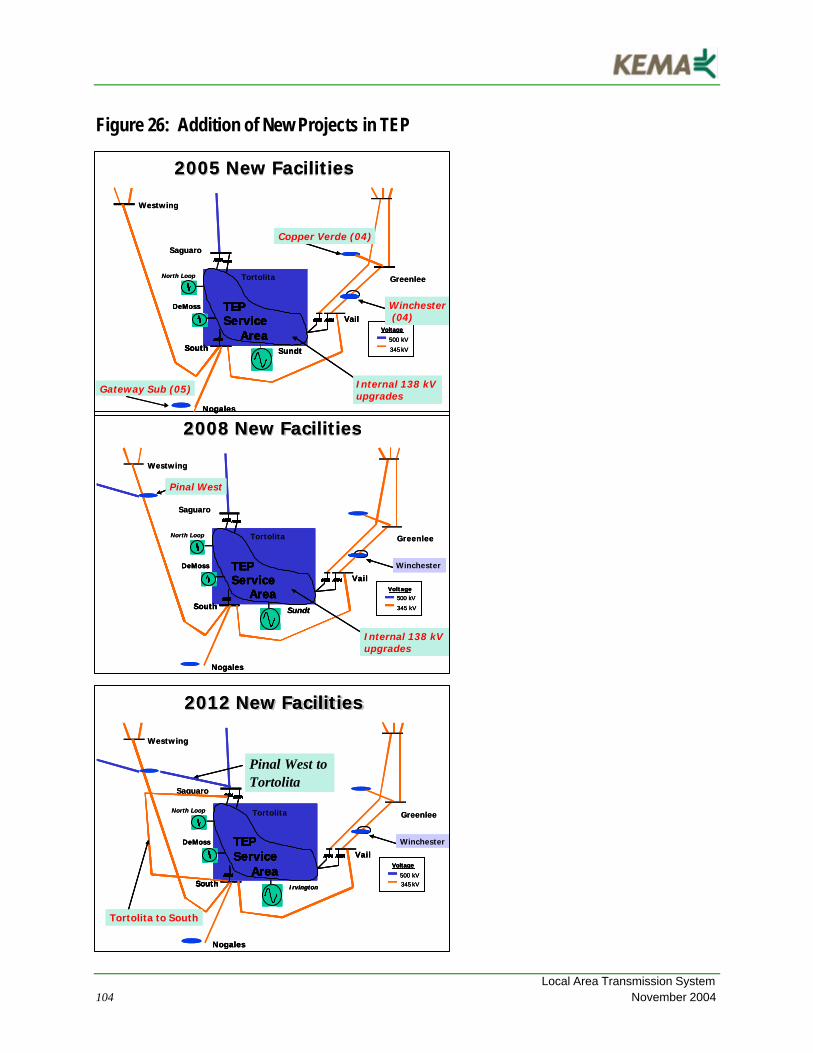
Local Area Transmission System 104 November 2004
Figure 26: Addition of New Projects in TEP
Winchester
Greenlee
Westwing
North Loop
South
TEP Service
AreaVail
500 kV
345 kVSundt
Voltage
2008 New Facilities2008 New Facilities
Nogales
Tortolita
Saguaro
Pinal West
Internal 138 kV upgrades
DeMoss WinchesterWinchester
Greenlee
Westwing
North Loop
South
TEP Service
AreaSouth
TEP Service
AreaSouth
TEP Service
Area
TEP Service
Area
TEP Service
AreaVail
500 kV
345 kVSundt
Voltage
Vail
500 kV
345 kVSundt
Voltage
2008 New Facilities2008 New Facilities
NogalesNogales
Tortolita
Saguaro
Pinal WestPinal West
Internal 138 kV upgradesInternal 138 kV upgrades
DeMossDeMoss
Greenlee
Westwing
North Loop
South
TEP Service
AreaVail
500 kV
345 kVSundt
Voltage
2005 New Facilities2005 New Facilities
Nogales
Tortolita
Saguaro
Winchester(04)
Copper Verde (04)
Gateway Sub (05) Internal 138 kV upgrades
DeMoss
Greenlee
Westwing
North Loop
South
TEP Service
AreaSouth
TEP Service
AreaSouth
TEP Service
Area
TEP Service
Area
TEP Service
AreaVail
500 kV
345 kVSundt
Voltage
Vail
500 kV
345 kVSundt
Voltage
2005 New Facilities2005 New Facilities
NogalesNogales
Tortolita
Saguaro
Winchester(04)
Winchester(04)
Copper Verde (04)Copper Verde (04)
Gateway Sub (05) Internal 138 kV upgradesInternal 138 kV upgrades
DeMossDeMoss
Greenlee
Westwing
North Loop
South
TEP Service
AreaVail
500 kV345 kVIrvington
Voltage
2012 New Facilities2012 New Facilities
Nogales
Tortolita
Saguaro
Pinal West to Tortolita
Tortolita to South
DeMoss Winchester
Greenlee
Westwing
North Loop
South
TEP Service
AreaSouth
TEP Service
AreaSouth
TEP Service
Area
TEP Service
Area
TEP Service
AreaVail
500 kV345 kVIrvington
Voltage
Vail
500 kV345 kVIrvington
Voltage
2012 New Facilities2012 New Facilities
NogalesNogales
Tortolita
Saguaro
Pinal West to TortolitaPinal West to Tortolita
Tortolita to SouthTortolita to South
DeMossDeMoss WinchesterWinchester

Third Biennial Transmission Assessment 2004-2013 Docket No. E-00000D-03-0047 105
Table 19: TEP Area Facility Additions 2004 2005 2006 2008 2009 2012
Winchester 345kV Substation
Gateway 345kV substation connecting to Citizens/Unisource 115 kV system at Valencia via a 345/115 kV transformer
Pinal-West 345 kV substation § and interconnection to Westwing-South 345 kV line §
Rillito / LaCanada 138kV line upgraded from 340 MVA to 356 MVA §
Irvington / South 138kV line upgraded from 309 MVA to 394 MVA §
Tortolita – South 345 kV transmission line and associated 500/345 kV transformer at Tortolita (TBD)
Greenlee-Copper Verde 345 kV line §
Two 345 kV transmission lines between TEP’s South and Gateway substations
North Loop / Rillito 138kV line upgraded from 287 MVA to 339 MVA §
Irvington / Vail #1 138kV line upgraded from 287 MVA to 356 MVA
Pinal West – Tortolita 500 kV line (TBD)
Twenty -second / East Loop 138kV line upgraded from 225 MVA to 391 MVA
Twenty -second / Irvington 138kV line upgraded from 331 MVA to 444 MVA (2005)
Irvington / Vail #2 138kV line upgraded from 287 MVA to 356 MVA
6.2.3.1 Tucson Area – SIL and RMR Conditions for 2005, 2008, and 2012
All base cases used were co-developed by APS, SRP, TEP, WAPA, and SWTC. Planned system configuration changes for all these utilities were used to develop the various cases. RMR conditions are founded on the principle of continuity of service for single contingency transmission outages (N-1). Tucson-area critical outages are shown in Table 20, below.
Table 20: TEP Area Critical Outages
Year
2005
Cholla – Saguaro 500 kV Line
WECC Voltage Stability Criteria
2008
South T2 345 / 138 kV Xfmr
Irvington / Vail 138kV line loading limit
2012
Springerville – Vail 345 kV Line
Internal Voltage Criterion
Critical Outage Nature of Constraint
TEP reported in its 2004 RMR Study that many 138 kV transmission lines were de-rated by TEP’s Engineering department based on new, more conservative, assumptions of temperature and wind

Local Area Transmission System 106 November 2004
speed/direction.72 Because of this, for 2005 and 2008, generation to relieve thermal overloads becomes as important as MVar availability for RMR conditions. This made TEP load more dependent on local generation than before. Staff suggests that rather than de-rating of the lines, TEP investigate whether use of real-time monitors and dynamic rating would increase the existing transmission capacity into the area.
By the year 2012, all the de-rated 138kV lines needing upgrades will have been upgraded, relieving the thermal constraints on the 138 kV system as long as the less expensive Sundt Units are on line. By 2012 the EHV system will have sufficient new facilities that at peak, it is not voltage stability limited.
The de-rating of the 138kV lines has brought thermal overloads more to the forefront. Depending on which units are on line, the constraint is either voltage stability or thermal overload, without a large differential in required generation
The addition of the Pinal West interconnection increases flows on the Western side of the TEP system, decreasing flows from the North and East. Consequently, outage of the Cholla -Saguaro 500kV line decreases in severity, no longer showing up as a constraint in the RMR condition at peak. The constraint is loading on the Irvington-Vail line following an outage of the South T2.
Generating the RMR MW at local generating units: DMP and North Loop, only moves the thermal constraint from Tortolita (the generation is now on the North end of the system) back to Irvington-Vail. Also, the lack of the MVar support from the Sundt units does not support the post-outage voltage as well for the Springerville -Vail outage, causing it to not meet the internal .98 voltage criterion. As with the peak load, the de-rating of the 138kV lines had a significant impact on the ability to import power through the year 2008. Moving the upgrade of the Irvington-Vail lines to 2005 would raise the MLSC for 2005 and 2008.
However, in 2012, the 138kV system does not limit the load serving capacity of the Tucson Control area unless no Sundt steam units are on line. The MLSC is determined by outage of one of the Tortolita 500/138 kV transformers, which loads the remaining transformer. Voltage stability, tested via the WECC Voltage Stability Criteria, is not the limiting factor.
As more IPPs continue to go in service, it is theoretically possible that TEP could import all power at peak and generate none locally, if sufficient 138kV transmission line upgrades and sufficient MVar availability could be made available either through SVC or synchronous condenser mode. TEP transmission import limit depends on local generation primarily because of the need for reactive power support. TEP has not done long-term cost-benefit analysis for upgrades and MVar support.
The RMR costs, shown in Table 21, are calculated using projected gas prices.
72 TEP 2004 RMR Study, Page 46.

Third Biennial Transmission Assessment 2004-2013 Docket No. E-00000D-03-0047 107
Table 21: SIL, MLSC, and Annual Costs for Dispatch to Mitigate RMR Conditions
6.2.3.2 TEP Area Conclusions
§ TEP transmission import limits depend on local generation, primarily because of the need for reactive power support.
§ It is theoretically possible that TEP could import all power at peak and generate none locally, if sufficient 138kV transmission line upgrades and sufficient MVar availability could be made available
§ TEP has not done long-term cost-benefit analysis for upgrades and MVar support.
§ With TEP’s recent derating of 138 kV lines, the needed Irvington-Vail 138 kV transmission line upgrade advanced to 2005 from 2009.
§ The analysis of air emission reductions was based on estimated RMR output as defined by the ACC data request, and not the incremental difference between the possible market alternatives.
6.2.3.3 Staff Observation
With TEP’s recent derating of 138 kV lines, the need for the Irvington-Vail 138 kV transmission line upgrades advanced to 2005 from 2009. Because of this, for 2005 and 2008, generation to relieve thermal overloads becomes as important as MVar availability for RMR conditions. This made TEP load more dependent on local generation than before. Staff suggests that rather than de-rating of the lines, TEP investigate whether use of real-time monitors and dynamic rating would increase the existing transmission capacity into the area.
However, in 2012, the 138kV system does not limit the load serving capacity of the Tucson Control area unless no Sundt steam units are on line. The MLSC is determined by outage of one of the Tortolita 500/138 kV transformers, which loads the remaining transformer. Voltage stability, tested via the WECC Voltage Stability Criteria, is not the limiting factor.
TEP assumed that as more IPPs continue to go in service, it is theoretically possible that TEP could import all power at peak and generate none locally, if sufficient 138 kV transmission line upgrades and
SIL MLSC Peak Load RMR Peak RMR Energy RMR costs(MW) (MW) (MW) (MW) (GWh)
2005 1609 2551 2000 178 348 $68,061 2008 1544 2555 2121 286 826 $307,179 2012 1886 2872 2287 119 385 $301,885

Local Area Transmission System 108 November 2004
sufficient MVar availability could be made available either through SVC or synchronous condenser mode. Because of the uncertainty of IPP’s development, Staff supports TEP’s effort to investigate an addition of facilities that provide reactive power support, and conduct a cost – benefit analysis for that addition.
It appears that the future Tucson area load should have mostly unlimited access to the outside market.
6.2.4 Mohave Area RMR Conditions and Import Assessment
6.2.4.1 Mohave Existing and Future Transmission System
The transmission system depicted in Figure 27, serves the cities of Kingman, Havasu, Bullhead, Mohave Indian Reservation, the City of Needles, California and the City of Parker and surrounding regions. WAPA’s transmission serves the Mohave County area with inward transmission, and distribution is provided by Mohave Cooperative, UniSource Energy Services, Aha MACV Power Service, City of Needles, and Arizona Public Service Company. WAPA’s transmission systems provide import from Mead Substation in southern Nevada, Western’s 345 kV transmission line from Liberty Substation to Peacock Substation, Western’s Pinnacle Peak Substation to Peacock Substation to Davis Dam Substation, and two 230 kV lines from Liberty Substation to Parker Dam Substation.
While there would seem to be significant transmission into the area, the lines are also used to conduct energy through the area and beyond to south of Phoenix (Central and Southeastern Arizona) and to Yuma. The 2002 BTA reported that the paths into the area and beyond are contracted to their limits such that there is no additional transmission that can be contracted into the load pocket.

Third Biennial Transmission Assessment 2004-2013 Docket No. E-00000D-03-0047 109
Figure 27: Study System for Mohave County
6.2.4.2 Mohave Area – SIL and RMR Conditions for 2005, 2008, and 2012
In response to a request from Staff, the Desert Southwest Region (“DSW”) of WAPA conducted a RMR Study of the transmission system in Mohave County for projected years 2005, 2008 and 2012.
The Study System includes the portion of the DSW transmission network within Mohave County, Arizona. DSW owns and operates all the facilities of the transmission network within this Study System. Figure 1 shows the Study System for the RMR study. Because the years 2005, 2008, and 2012 each have the same transmission and generation units in its Study System base cases, only the year 2012 was evaluated. This is because it had the largest projected peak load for this Study System.
Distribution systems embedded on the DSW transmission network within the Study System include the following:
§ Aha Macav (“AMPS”) § Arizona Public Service (“APS”) § Central Arizona Water Conservation District (“CAWCD”) § Mohave Electric Cooperative (“MEC”) § Unisource Energy Services (“UES”)

Local Area Transmission System 110 November 2004
The results of the 2004 RMR study are shown in Table 22.
Table 22: SIL, MLSC, and Annual Costs for Dispatch to Mitigate RMR Conditions
RMR
Year
SIL (MW) MLSC (MW)
Peak Demand
(MW)
Peak Demand
(MW) HoursEnergy (GWh)
Cost ($k/year)
EmissionReduction
2004 1335 1698 - - - - - -
2005, 08, 12 647 1265 588.2 - - - - -
The SIL is limited by a WECC 5% post-transient voltage deviation at the Black Mesa 230kV station. The MLSC is limited by a WECC 5% post-transient voltage deviation at the Black Mesa 230kV station for the single contingency outage of the Parker-Black Mesa 230kV line.
6.2.4.3 Staff Observation
According to the 2004 RMR study, Mohave should not be considered a transmission import constrained area. Other than contractual issues, there is no technical limitation to importing outside generation.
6.2.5 Santa Cruz County RMR Conditions and Import Assessment
6.2.5.1 Santa Cruz County Existing and Future Transmission System
At the present time the load in the Santa Cruz County area, Nogales in particular, is served by single 115 kV line operated by UNS Electric. UNS Electric has generation located in the Nogales area that it runs on an emergency basis. When the single 115 kV line is out of service the local generation is used to pickup the load. During storm seasons, the local generation is started, but not brought on line until after a power outage occurs. The County is susceptible to transmission outages of a prolonged nature, and the Commission ordered73 the construction of a second transmission line, known as the Gateway Project. The UNS Electric long-term plan to improve reliability for the Santa Cruz service territory is to construct that redundant transmission line from the new Gateway 345/115 kV substation (located about 3 miles from the Valencia substation near Nogales) to the Valencia substation.
The second transmission line has been sited and approved by the state Siting Committee and the Commission. It is, at the present, going through the final stages of its environmental impact statement with the federal approval process. The Staff‘s estimate is that the project, when approved, will likely need three years to be placed in service. In the meantime, the Commission has concerns of how to deal
73 ACC Decision No. 62011, November 2, 1999

Third Biennial Transmission Assessment 2004-2013 Docket No. E-00000D-03-0047 111
with the customer service quality issues if transmission outages occur. There are active proceedings before the Commission dealing with this issue.74
6.2.5.2 Santa Cruz County – SIL and RMR conditions
TEP completed the RMR study work for UNS Electric relative to the Santa Cruz County area. The Study is filed as Exhibit 5, in Docket No. E-01032A-99-0401. The results of the 2004 RMR study are shown in Table 23.
Table 23: SIL, MLSC, and Annual Costs for Dispatch to Mitigate RMR Conditions
The local peak load for Santa Cruz County grows from 63.6 megawatts in 2005 to 79.2 megawatts in 2012. The system import limit is 50 megawatts until 2012, at which time TEP’s studies assumed there were two lines supplying the area.
6.2.5.3 Santa Cruz County 2004 RMR Study Findings
The RMR peak load demands are 13 MW and 20 MW in the first two study years, and there are no RMR requirements in 2012. This is based on the assumption that the additional transmission line has been built by that time period.
6.2.5.4 Staff Observation
With the second transmission line in service, a RMR condition is expected to exist in Santa Cruz County by the summer of 2008. Specifically, the RMR operation of the Valencia units will become required by the summer of 2008. Furthermore, the RMR operation of the Valencia units will become inadequate when the Santa Cruz County load reaches approximately 75 MW. The 75 MW load level is projected by the summer of 2010.
Until the second 115 kV line is constructed, UNS Electric and TEP will implement the approved “Outage Response Plan”75. Staff believes that the Outage Response Plan is sufficient to improve the restoration of
74 ACC Decision No. 66615
SIL MLSC Peak Load RMR Peak RMR Energy RMR costs(MW) (MW) (MW) (MW) (GWh)
2005 50 75 63.6 13.6 N/A N/A2008 50 75 70.1 20.1 N/A N/A2012 80 95 79.2 0 N/A N/A

Local Area Transmission System 112 November 2004
service following a transmission line outage for Santa Cruz County customers of UNS Electric, but cannot assure continuity of service for outage of a transmission line.
75 ACC Docket No. E-01032A-99-0401, TEP an UES “ Supplemental Response to Commission Questions and Updated Outage Response Plan for Santa Cruz County”, April 30, 2004

Third Biennial Transmission Assessment 2004-2013 Docket No. E-00000D-03-0047 113
7. Generation Update
7.1 Merchant Plant Ten-Year Plans Reported for the Second BTA
A.R.S. 40-360.02 states that every organization contemplating construction of any transmission line within the state during any ten-year period shall file a ten-year plan with the Commission on or before January 31 of each year. This requirement applies to merchant plants as well as those that are planning interconnections with the Arizona transmission grid. The merchant plants shall demonstrate the impact of transmission interconnections on the transmission grid through power flow and stability analysis results.
Bowie Project
Southwestern Power Group II (“SWPG”) was the only developer that filed its ten-year plan on January 2003 and 2004 as required for the Third BTA. The SWPG filed its ten-year plan for the proposed 1,000 MW natural gas-fired combined cycle plant and double circuit 345 kV line associated with the Bowie Project. The 345 kV line will interconnect Bowie power station with TEP’S 345 kV line Greenlee-Vail and with SWTC 230 kV line Red Tail-Dos Condados.
Toltec Project
In 2004, SWPG filed a notice that SWPG is considering a power plant and related transmission line facilities that would represent a modification of the previously proposed Toltec Power Station. The project alternatives under consideration include changes in size, design, location, and source(s) of water supply. Consequently, SWPG did not have sufficient detailed information to prepare the type of 10-year plan contemplated by A.R.S. §§ 40-360 et seq.

Generation Update 114 November 2004
7.2 Status of the Merchant Plant Ten-Year Plans Reported in the Second BTA
Table 24 shows the generation projects proposed for interconnection in Arizona, reported in the Second BTA report.
Table 24: Generation Projects Proposed for Interconnection in Arizona
Capacity
(MW) Interconnection
Point In-Service per
BTA 2002 Transmission Addition Max output Status on July 2004
500 kV line from Gila Bend PP to APS Watermelon
Not Active CEC Term
6/12/06 Gila Bend 845 Watermelon 2003 230 kV line from Gila Bend PP to APS GB
845 Not Active
Jojoba 2x500 kV lines from GR to Jojoba
In Service Gila River 2,080
Panda 2003
230 kV line from GR to Panda
2,080 In Service
Sundance II 90 Sundance 2006 To Be Determined 90 Not Active CEC Term
7/9/06
Ambos Nogales 500 Nogales Vicinity 2006
115 kV tie with UES 500
No CEC Application
Allegheny 1080 La Paz 2004 2x500 kV interties from La Paz to Palo Verde – Devers
1080 Not Active CEC Term
4/1607

Third Biennial Transmission Assessment 2004-2013 Docket No. E-00000D-03-0047 115
7.3 Status of Plants Scheduled for Future Years Operation Reported in the Second BTA
The Second BTA reported the status of the generation plants scheduled for future years. This is summarized in Table 25.
Table 25: Status of Generation Plants Scheduled for Future Years
Capacity
(MW) Interconnection
Point In-Service per
BTA 2002 Transmission
Addition Max
output Status on July
2004
Mesquite (Sempra) 2x625 Hassayampa 2003 500 kV Tie to Hassayampa
1250 In Service
Santan (SRP) 825 Santan 2005 None 825 Under
Construction
Harquahala (PG&E) 1092 Harquahala 2003 Harquahala to
Hassayampa 500 kV 1092
Constructed, Not Commercial
Arlington Valley Facility II (Duke Energy) 600 Hassayampa
New 500 kV Switchyard 600
Not Active CEC Term
4/12/07
Bowie Power Station (SPG II) 2x500 2004/2005
2x345 kV line From Bowie to Willow 1000
Not Active CEC Term 3/7/2007
Desert Energy 585 Saguaro 585 No CEC
Application West Phoenix 5 (Pinnacle West Energy)
500 West Phoenix 2003 Upgrades of the
switchyard 500 In Service
Redhawk 3&4 2x530 Redhawk 2006-2007 1060 Not Active CEC Term
2/23/07
Welton-Mohawk 310 Yuma 2005 Upgrade of the 161 kV
Western line Not Active CEC Term
8/18/08
Springerville 3 & 4 2x380 Dec 2006 TBD 760
Unit 3 under construction CEC Term


Third Biennial Transmission Assessment 2004-2013 Docket No. E-00000D-03-0047 117
8. Future Generation
8.1.1 2003 and 2004 Generation Interconnection Requests
The new FERC generation interconnection rule requests that each transmission provider post the generation interconnection queue on its OASIS website.76 Accordingly, the Arizona utilities are posting generation interconnection requests at their OASIS websites.77
The following is the APS Generation interconnection Queue, available at the APS Oasis.
8.1.1.1 Large-Scale Wind Power Impacts on Transmission Network
In Europe, substantial wind penetration exists today and will only increase over time. The impacts on the transmission network are viewed not as an obstacle to develo pment, but rather as speed bumps that must be addressed. Intermittent wind power on a large scale (typical larger than 20% of generation meeting load) affects the network in the following ways and has to be studied in detail:
1. Power flow - ensure that the interconnecting transmission or distribution lines will not be over-loaded. This type of analysis is needed to ensure that the introduction of additiona l generation will not overload the lines and other electrical equipment. Both active and reactive power requirements should be investigated. Reactive power should be generated
76 3.4 OASIS Posting: The Transmission Provider will maintain on its OASIS a list of all Interconnection Requests. The list will identify, for each Interconnection Request: (i) the maximum summer and winter megawatt electrical output; (ii) the location by county and state; (iii) the station or transmission line or lines where the interconnection will be made; (iv) the projected In- Service Date; (v) the status of the Interconnection Request, including Queue Position; (vi) the type of Interconnection Service being requested; and (vii) the availability of any studies related to the Interconnection Request; (viii) the date of the Interconnection Request; (ix) the type of Generating Facility to be constructed (combined cycle, base load or combustion turbine and fuel type); and (x) for Interconnection Requests that have not resulted in a completed interconnection, an explanation as to why it was not completed. (FERC Standard Large Generator Interconnection Procedures, 104 FERC 61,103, page 18) 77 Workshop I, Transcript Page 167, Line 8-12

Future Generation 118 November 2004
not only at the interconnection point (PCC), but throughout the network, and should be compensated locally.
2. Short circuit - determine the impact of additional generation sources to the short circuit current ratings of existing electrical equipment on the network.
3. Transient stability - dynamic behavior of the system during contingenc ies, sudden load changes and disturbances. Voltage and angular stability during these system disturbances are important. In most cases fast acting reactive power compensation equipment, including Static VAR Compensators (“SVCs”) and STATCOMs have to be inc luded for improving the transient stability of the network.
4. Electromagnetic transients – these fast operational switching transients should have a detailed representation of the wind turbines, their controls and protections, the converters and DC links.
5. Protection – unintentional islanding and reverse power flow may have a large impact on existing protection schemes, philosophy and settings.
6. Power leveling and energy balancing - Due to the fluctuating and uncontrollable nature of wind power as well as the uncorrelated generation from wind and load, wind power generation has to be balanced with other fast controllable generation sources. These include gas, hydro, or renewable power generating sources, as well as short and long-term energy storage, to smooth out fluctuating power from wind generators and increase the overall reliability and efficiency of the system. The costs associated with capital, operations, maintenance and generator stop-start cycles have to be taken into account as well.
7. Power Quality - Fluctuations in the wind power and the associated power transport, AC or DC, have direct consequences to the power quality. As a result large voltage fluctuations may result in voltage variations outside the regulation limits, as well as violations on flicker and other power quality standards.
It is well known from the existing “Near-Shore”, and large-scale onshore wind power installations in the Scandinavian countries, that utilization of large-scale wind power can result in network instability if the installed wind power capacity is higher than 20% of the instantaneous loading conditions 78,79. In cases where the total wind power is higher than this percentage, innovative dynamic compensation solutions are
78 Proceedings of 4th International Workshop on Large-Scale Integration of Wind Power and Transmission Networks for Offshore Wind Farms, Billund, Denmark, 20-21 Oct. 2003. 79 .H. Søbrink; R Belhomme; D Woodford; H Abildgaard; E Joncquel: “The challenge of integrating large-scale offshore wind farms into power systems”, Paper 14-204, CIGRé-2002, Paris, 2002.

Third Biennial Transmission Assessment 2004-2013 Docket No. E-00000D-03-0047 119
required to operate the network, including Flexible AC Transmission Systems (FACTS) and energy storage.


Third Biennial Transmission Assessment 2004-2013 Docket No. E-00000D-03-0047 121
9. Conclusions
Staff offers the following conclusions for Commission consideration:
1. The electric industry in Arizona has been very responsive to concerns raised in the Commission’s Second BTA.
2. Extensive regional studies addressing the interstate transmission needs have been conducted in a collaborative process.
3. Transmission providers have performed RMR studies for each local transmission import constrained area they serve and have addressed the Second BTA RMR requirements.
4. Numerous new transmission and generation projects have been constructed, announced, and filed with the Commission since its First and Second BTAs.
5. In general, the existing and proposed Arizona transmission system meets the load serving requirements of the state in a reliable manner:
a. Many planned Extra High Voltage and High Voltage projects will increase transmission system capability to support increased interstate power transfers, and to provide reliable transfers within the state of Arizona.
b. The EHV system appears to be adequate throughout the study period. As is often the case, plans for the later years of the period are less well defined than those in the early years. Future reports should include more discussion of alternate additions considered for the final five years of the study period. This will allow the Commission and public to be better informed regarding future possibilities.
c. The RMR studies show that the RMR areas will have load-serving capacity sufficient to provide reliable supply during the next ten-year period. Problems are identified in the Yuma area in 2004 and Santa Cruz Country area in 2004-2008, but are addressed in the RMR study. The Phoenix area is determined as deficient in local operating reserves in 2013. Arizona Public Service Company and the Salt River Project are currently investigating solutions to mitigate this Phoenix area deficiency.
d. The RMR studies have not justified a need for additional transmission projects as an alternative to dispatch of local area generation. However, Staff is concerned with the data and energy production modeling assumptions used in economic studies. Major disturbances in the Phoenix area in the summer of 2004 also beg the question of how much dependence should be placed on local generation as

Conclusions 122 November 2004
the sole solution for reliable service during transmission outages beyond loss of a single transmission element.
e. The planned Arizona transmission system meets the WECC and NERC single contingency criteria (N-1).
f. Since interconnection of merchant plants commenced at the Palo Verde Hub, the Palo Verde east transmission system capability has increased from 3810 MW to 6970 MW as a result of several transmission upgrades. Two new 500 kV transmission line projects within Arizona are proposed as additional reinforcements in 2007 through 2011. The Palo Verde to TS5 and Palo Verde to Browning projects will significantly increase the outlet capability of the Palo Verde Hub to Arizona.
6. No transmission improvements have been made to the pre-existing 2800 MW Palo Verde west transmission system capability to delivery power to California. Therefore, transmission from Palo Verde to California is inadequate to allow new Palo Verde Hub generation full access to the California market. Three 500 kV transmission projects are being studied to remedy such market limitation between Arizona, California and Nevada.
7. There is very little additional long-term firm transmission capacity available to export or import energy over Arizona’s transmission system. Studies investigating transmission additions required between Arizona and California and between New Mexico and Arizona continue to explore the scope, participation and timing of alternative projects.
8. Some new power plants have interconnected to Arizona’s bulk transmission system via a single transmission line or tie rather than continuing Arizona’s best engineering practices of multiple lines emanating from power plants. As interconnection of new transmission lines are considered for the Palo Verde Hub, they should be encouraged to terminate at these new power plant switchyards in order to mitigate this regional reliability concern.

Third Biennial Transmission Assessment 2004-2013 Docket No. E-00000D-03-0047 123
10. Recommendations
Concerns outlined by Staff in the above conclusions are not easily or quickly resolved. The public’s best interest warrants effective and decisive remedies. Therefore, Staff offers the following recommendations for Commission consideration and action:
Ø Continue to support use of:
a. “Guiding Principles for ACC Staff Determination of Electric System Adequacy and Reliability” to aid Staff in its determination of adequacy and reliability of power plant and transmission line projects,
b. NERC and WECC criteria and FERC policies regarding the transmission system reliability, and
c. Collaborative study activities between transmission providers and merchant plant developers for the purpose of:
1. Ensuring consumer benefits of generation additions and cost–effective transmission enhancements and interconnections.
Ø Endorse Staff’s recommendation that:
a. RMR studies continue to be performed and filed with ten year plans in even numbered years for inclusion in future BTA reports and that:
1. Future RMR studies provide more transparent information on input data and economic dispatch assumptions, and
2. Arizona utilities collaborate with Staff to develop and effectively implement more stringent criteria as appropriate for RMR areas in the 2006 BTA.
b. All future interconnections proposed at the Palo Verde Hub, either new generation or new transmission lines, must perform a risk assessment of the Hub to ascertain to what degree the proposed project mitigates the pre-existing risks to extreme outage events. This assessment must precede a project’s application for a CEC with the Commission. The recommendations of the Palo Verde Risk Assessment report should be followed if a proposed project would otherwise exacerbate the existing risk at the Hub.

Recommendations 124 November 2004
c. The Fourth BTA address and document:
1. Compliance with single contingency criteria overlapped with the bulk power system facilities maintenance (N-1-1) (for the first year of the BTA analysis period) as required by WECC and NERC.
2. Extreme contingency outages studied for Arizona’s major generation hubs and major transmission stations and associated risks and consequences documented if mitigating infrastructure improvements are not planned.

Third Biennial Transmission Assessment 2004-2013 Docket No. E-00000D-03-0047 125
APPENDICES


Third Biennial Transmission Assessment 2004-2013 Docket No. E-00000D-03-0047 127
Appendix A: Guiding Principles for ACC Staff Determination of Electric System Adequacy and Reliability
This document serves the dual purpose of providing the guiding principles for ACC Staff determination of electric system adequacy and reliability in the two areas of transmission and generation.
Transmission
A.R.S §40-360.02E obligates the Arizona Corporation Commission (ACC) to biennially make a determination of the adequacy and reliability of existing and planned transmission facilities in the state of Arizona. Current state statutes and ACC rules do not establish the basis upon which such a determination is to be made. Therefore, ACC Staff will use the following guiding principles to make the required adequacy and reliability determination until otherwise directed by state statutes or ACC rules.
1. Transmission facilities will be evaluated using Western Systems Coordinating Council (WECC), or its successor’s, Reliability Criteria for System Planning and Minimum Operating Reliability Criteria.
2. Transmission planning and operating practices traditionally utilized by Arizona electric utilities will
apply when more restrictive than WECC criteria. 3. Compliance with A.C.C. R14-2-1609.B80
will be established by analysis of power flow and transient stability simulation of single contingency outages (N-1) of generating units, EHV and local transmission lines of greater than 100 kV nominal system voltage, and associated transformers. Reliance on remedial action such as generator unit tripping or load shedding for single contingency outages will not be considered an acceptable means of compliance with this rule.
Generation Pursuant to A.R.S. §40-360.07, the ACC must balance, in the broad public interest, the need for adequate, economical, and reliable supply of electric power with the desire to minimize the effect on the environment and ecology of the state when considering the siting of a power plant or transmission line. The laws of physics dictate that generation and transmission facilities are inextricably linked when considering the reliability of service to consumers. Therefore, it is appropriate that both components must be considered when siting a power plant. ACC Staff will use the following guiding principles to make the required adequacy and reliability determination for siting generation until otherwise directed by state statutes or ACC rules.
The best utility practices historically exhibited in the evolution of Arizona’s generation and transmission facilities should be continued in order to promote development of a robust energy market. Non-
80 R14-2-1609.B refers to the obligation of Utility Distribution Companies to assure that adequate transmission import capability and distribution system capacity are available to meet the load requirements of all distribution customers within their service area.

Appendix A 128 November 2004
discriminatory access to transmission and fair and equitable business practices must also be maintained and the service reliability to which the state is accustomed must not be compromised. Therefore, Staff support of power plant Certificate of Environmental Compatibility applications will be conditioned as set forth below.
ACC Staff support of power plant Certificate of Environmental Compatibility applications will be contingent upon the applicant providing, either in the application or at the hearing, evidence of items 1-3 below: 1. Two or more transmission lines must emanate from each power plant switchyard and interconnect
with the existing transmission system. This plant interconnection must satisfy the single contingency outage criteria (N-1) without reliance on remedial action such as generator unit tripping or load shedding.
2. A power plant applicant must provide technical study evidence that sufficient transmission capacity exists to accommodate the plant and that it will not compromise the reliable operation of the interconnected transmission system.
3. All plants located inside a transmission import limited zone “must offer” all Electric Service Providers and Affected Utilities serving load in the constrained load zone, or their designated Scheduling Coordinators, sufficient energy to meet load requirements in excess of the transmission import limit.
ACC Staff support of power plant Certificate of Environmental Compatibility applications will further be contingent upon the Certificate of Environmental Compatibility being conditioned as provided in items 4-6 below:
4. The Certificate of Environmental Compatibility is conditioned upon the plant applicant submitting to the ACC an interconnection agreement with the transmission provider with whom they are interconnecting.
5. The Certificate of Environmental Compatibility is conditioned upon the plant applicant becoming a member of WECC, or its successor, and filing a copy of its WECC Reliability Criteria Agreement or Reliability Management System (“RMS”) Generator Agreement with the ACC.
6. The Certificate of Environmental Compatibility is conditioned upon the plant applicant becoming a member of the Southwest Reserve Sharing Group, or its successor, thereby making its units available for reserve sharing purposes.
Approved by:
(Original Signed by Deborah R. Scott)
Deborah R. Scott Director Utilities Division
This date: (2/8/00)
RS/jds:ESAR.doc

Third Biennial Transmission Assessment 2004-2013 Docket No. E-00000D-03-0047 129
Appendix B: 2004 BTA Workshop I and II List Attendees
Workshop I – June 30, 2004
Name Representing Phone Number E-Mail Address 1 Jerry Smith ACC (602) 542-7271 [email protected] 2 Charlie Reinhold Westconnect (208) 253-6916 [email protected] 3 Mark Etherton SWAT/CATS (602) 809-0707 [email protected] 4 Jim Charters Retired (623) 572-7972 [email protected] 5 Bruce Evans SWTC (520) 586-5336 [email protected] 6 Bob Smith APS (602) 250-1144 [email protected] 7 Gary Romero SRP (602) 236-0974 [email protected] 8 Andy Rawling Black & Venteh (303) 671-4286 [email protected] 9 Michael Raezer TEP (520) 745-7167 [email protected] 10 Bill Darmitzel TEP (520) 745-3325 [email protected] 11 Bob Linssen AZ Power Authority (602) 542-4263 [email protected] 12 Barrie Kokanos APS (602) 250-1370 [email protected] 13 Cindy Phillips SRP (602) 236-5895 [email protected] 14 Jeff Miller CA-ISO (916) 351-4464 [email protected] 15 Cary Deise APS (602) 250-1232 [email protected] 16 Rom Moulton Western (602) 352-2668 [email protected] 17 Doug Johnson 3M (651) 737-1897 [email protected] 18 Milt Percival Western (602) 352-2794 [email protected] 19 Ron Grossarth ANM (505) 855-6306 [email protected] 20 Ken Bagley CAP/Beck (480) 367-4282 [email protected] 21 Gary Ijams CAWCD (623) 869-2362 [email protected] 22 Robert Kondzoilka SRP (602) 236-0971 [email protected] 23 Steve Michel NMIEC (505) 989-8731 [email protected] 24 Judith Barleycorn PWEC (602) 250-3718 [email protected] 25 Richard L SWCN (602) 250-2761 richard.la 26 Laurel Whister SRP (602) 236-3854 [email protected] 27 Sara Mei SRP (602) 369-3941 28 Jana Brandt SRP (602) 236-5028 [email protected] 29 Ernest Nedd RUCO (602) 364-4837 [email protected] 30 Ray Williamson AZ.Corp.Comm. (602) 542-0828 [email protected] 31 Steven Mavis SCE (626) 302-8175 [email protected] 32 Perry Cole Trans -Elect (406) 782-1907 pcole@trans -elect.com 33 Nick Saber WAPA (602) 352-2796 [email protected] 34 Mike Crause SRP (602) 236-4512 [email protected] 35 Paul Li ITDA (602) 254-5908 [email protected] 36 Michael Curtis Mohava (602) 248-0392 [email protected] 37 Prem Bahl ACC (602) 542-7269 [email protected] 38 Bill Meek AZ Utility Investors (602) 257-9200 [email protected] 39 Steve Mendoza Western Wind Energy (480) 296-2040 [email protected]

Appendix B 130 November 2004
40 Jeff Guldner APS (602) 302-6271 [email protected] 41 Jana VanNess APS (602) 250-2310 [email protected] 42 Larry Luna NPC (702) 367-5465 [email protected] 43 Jeff Schlegel SWEEP (520) 797-4392 [email protected] 44 Paul Rasmussen AREQ (602) 771-2216 45 Marshall Magruder Santa (520) 398-8587 [email protected] 46 Steven Cobb SRP (602) 236-3965 [email protected] 47 Ed Beck TEP (520) 745-3276 [email protected] 48 Jeff Palermo KEMA Consulting (703) 631-6912 49 Sedina Eric KEMA Consulting (703) 631-6912 [email protected]
Workshop II – September 24, 2004
Name Representing Phone Number E-Mail Address 1 Jerry Smith ACC (602) 542-7271 [email protected] 2 Jim Charters Retired (623) 572-7972 [email protected] 3 Bruce Evans SWTC (520) 586-5336 [email protected] 4 Bob Smith APS (602) 250-1144 [email protected] 5 Gary Romero SRP (602) 236-0974 [email protected] 6 Bob Linssen AZ Power Authority (602) 542-4263 [email protected] 7 Ron Moulton Western (602) 352-2668 [email protected] 8 Doug Johnson 3M (651) 737-1897 [email protected] 9 Ken Bagley CAP/Beck (480) 367-4282 [email protected] 10 Robert Kondzoilka SRP (602) 236-0971 [email protected] 11 Ray Williamson AZ.Corp.Comm. (602) 542-0828 [email protected] 12 Mike Crause SRP (602) 236-4512 [email protected] 13 Michael Curtis Mohava (602) 248-0392 [email protected] 14 Prem Bahl ACC (602) 542-7269 [email protected] 15 Steve Mendoza Western Wind Energy (480) 296-2040 [email protected] 16 Jeff Palermo KEMA Consulting (703) 631-6912 17 Sedina Eric KEMA Consulting (703) 631-6912 [email protected] 18 Charles Russel SRP (602) 236-0975 [email protected] 19 Brian Keel SRP (602) 236-0970 [email protected] 20 James Hsu SRP (602) 236-0909 [email protected] 21 Jacob Hawkins Aspen Environmental Group (520) 219-0349 [email protected] 22 Ed Beck TEP (520) 745-3276 [email protected] 23 LeeAnn Torkelson KRSA (480) 610-8741 [email protected] 24 Jason Spitzkoff APS (602) 250-1651 [email protected] 25 Peter Krzykos APS (602) 250-1649 [email protected] 26 A. K. Krainik APS (602) 250-2611 [email protected] 27 Nick Saber WAPA (602) 352-2796 [email protected] 28 Ian Calkins Copper State (602) 229-1010 [email protected]
Third Biennial Transmission Assessment 2004-2013 Docket No. E-00000D-03-0047 131
29 Gary Hays Acc (602) 542-3622 30 Jana Brandt SRP (602) 236-5028 [email protected] 31 Pat Van Midde CTC (480) 326-6355 [email protected] 32 Justin Thompson PWEC (602) 250-2060 [email protected] 33 Leonard York WAPA (602) 352-2797 [email protected] 34 Mike Krause SRP (602) 236-4517 [email protected] 35 Greg Patterson AzCPA [email protected]


Third Biennial Transmission Assessment 2004-2013 Docket No. E-00000D-03-0047 133
Appendix C: Information Resources
Transmission Planning Studies and related documents, used to develop this Third BTA report, were assembled from the following reports, presentations, and dockets:
Utilities’ 2004 Ten-Year Transmission Plans 1. Arizona Public Service Company (“APS”)
2. Salt River Project (“SRP”)
3. Southwest Transmission Cooperative (“SWTC”)
4. Southwestern Power Group II (“SWPG”)
a. Toltec
b. Bowie
5. Southern California Edison (“SCE”)
6. Texas – New Mexico Power Company (“TNMP”)
7. Tucson Electric Power Company (“TEP”)
8. UniSource Electric (“UNS”)
Generation Interconnection Studies and Related FERC Interconnection Standards and Compliance Documents
9. FERC Order 2003 and 2003-A, Standard Interconnection Agreements & Procedures for Large Generators
10. Arizona Utilities Compliance Documents regarding the FERC Order 2003 and 2003-A
Arizona Corporate Commission Documents 11. ACC Docket No. E-0000A-02-0051, Decision 65743, Track B
Reliability Must Run Workshop 12. ACC 2004 RMR Workshop Presentations and Reports
13. FERC Related orders (PL04-2 policy related to bid based market)
Transmission Projects Reports

Appendix C 134 November 2004
14. Central Arizona Transmission System (“CATS”) Phase 3 Report81
15. Southwest Transmission Expansion Plan (“STEP”) 2003 Final Report82
Regional Committees and Working Groups Materials 16. Southwest Area Transmission (“SWAT”) subcommittee organization and study plans 83
17. Seam Steering Group – Western Interconnection (“SSG-WI”) Planning Work Group 2003 Transmission Report84
North America Electric Reliability Council ("NERC") Assessments Studies and Reliability Standards Related Materials
18. NERC Reliability Standards85
19. 2004 SUMMER ASSESSMENT Reliability of the Bulk Electricity Supply in North America86
20. Reliability Readiness Audit Reports for the relevant Control Areas
Western Systems Coordinating Council ("WSCC") Standards and Studies
Arizona Transmission Providers Reliability Standards
First and Second BTA Reports
81 http://www.azpower.org/cats/ 82 http://www.caiso.com/docs/2004/03/08/2004030814004810105.doc 83 http://www.azpower.org/swat/ 84 http://www.ssgwi.com/documents/316-FERC_Filing___103103___FINAL_TransmissionReport.pdf 85 http://www.nerc.com/standards/ 86 ftp://www.nerc.com/pub/sys/all_updl/docs/pubs/summer2004.pdf

Third Biennial Transmission Assessment 2004-2013 Docket No. E-00000D-03-0047 135
Appendix D: List of new projects and project changes

Appendix D 136 November 2004
In service Description Company Voltage Status
2004 22nd Street – East Loop Reconductoring TEP 138 kV New
2005 East Loop – Northeast Phase 2 TEP 138 kV Interim line in service; final completion date dependent upon public improvements
2005 Sandario Substation loop-in of Avra – Three Points line SWTransco 115 kV NEW
2005 Willow substation SWPG 345 kV NEW 2005 Bowie – Willow SWPG 345 kV NEW
2005 Irvington – 22nd Street Reconductoring TEP 138 kV New
2005 Gavilan Peak loop-in of Pinnacle Peak-Prescott line APS 230 kV New – construction start 2003
2005 Loop existing Irvington Station to Vail Substation #1 line through Robert Bills – Wilmot
TEP 138 kV Planned
2006 Saddlebrooke Ranch Tap SWTransco 115 kV NEW
2006 Palo Verde – Devers capacitor upgrade SCE 500 kV NEW
2006 Moenkopi –Eldorado capacitor upgrade SCE 500 kV NEW
2006 Tortolita – Rancho Vistoso and Rancho Vistoso – La Canada TEP 138 kV New
2006 Rudd-TS3-TS4 line APS 230 kV New – construction start 2002
2006 345/69-kV interconnection at WAPA’s Flagstaff 345-kV bus APS 345 kV New – construction start 2004
2006 Palo Verde – Pinal West line SRP 500 kV Planned – construction start 2005
2006 Carrel 115/12 kV Distribution substation SRP 115 kV New – construction start 2005
2006
South – Cyprus Sierrita Extension Switchyard through future Desert Hills Substation and Green Valley Substation (phase 2 – line from Green Valley through future Desert Hills to future Cyprus-Sierrita substation
TEP 138 kV Planned
Advanced from 2008 to 2007 TS5 – TS1 line APS 230 kV New/Advanced
2007 Upgrade Western Marana Tap and Marana Tap – Marana line SWTransco 115 kV NEW
2007 Red Rock – Saguaro line SWTransco 230 kV NEW 2007 North Loop – Rillito TEP 138 kV New

Third Biennial Transmission Assessment 2004-2013 Docket No. E-00000D-03-0047 137
In service Description Company Voltage Status
2007 Vail – Wilmot – Irvington Reconductoring TEP 138 kV New
2007 Vail – Irvington #2 Reconductoring TEP 138 kV New
2007 Palo Verde – TS5 line APS 500 kV New – construction start 2006
2007 Anderson – Orme line SRP 230 kV NEW - Construction start 2006
2007 Rudd loop-in of Liberty – Orme line SRP 230 kV NEW - Construction start 2006
2007 Pinal West – Santa Rosa line SRP 500 kV Planned – construction start 2005
2008 Browning – RS19 line SRP 230 kV New 2008 TS3 – TS2 – TS1 line APS 230 kV New
2008 Tap of Apache – Hayden line to APS San Manual Substation SWTransco 115 kV NEW
2008 Devers – Palo Verde SCE 500 kV NEW
2008
Interconnection of Westwing – South 345 kV with planned Palo Verde – Pinal West 500 kV line via a new Pinal West 500/345 kV Substation and transformer.
TEP 345/500 kV NEW
2008 La Canada – Rillito TEP 138 kV New 2009 Valencia – Bopp Road line SWTransco 115 kV New
2009 Irvington – South and Irvington Drexel TEP 138 kV New
2009 Second Knoll loop-in of Coronado-Silver King line APS 500 kV New – construction start 2008
2010 Upgrade of Marana to Avra Valley line SWTransco 115 kV NEW
2010 Loop in Irvington Station to Vail Substation TEP 138 kV New
2010 TS5 – Raceway line APS 500 kV New – construction start 2008
2010 Raceway loop-in of Navajo – Westwing line APS 500 kV New – construction start 2009
2011 Rillito – Northeast TEP 138 kV New
2011 Vail – Los Reales TEP 138 kV Planned
2012 Pinal West – Tortolita TEP 500 kV New 2012 Gila Bend – TS8 line APS 230 kV New – construction start 2010
2011 Santa Rosa – Browning SRP 500 kV Planned – construction start 2005
Advanced from 2008 to 2007 TS5-TS1 portion of West Valley North APS 230 kV Advanced
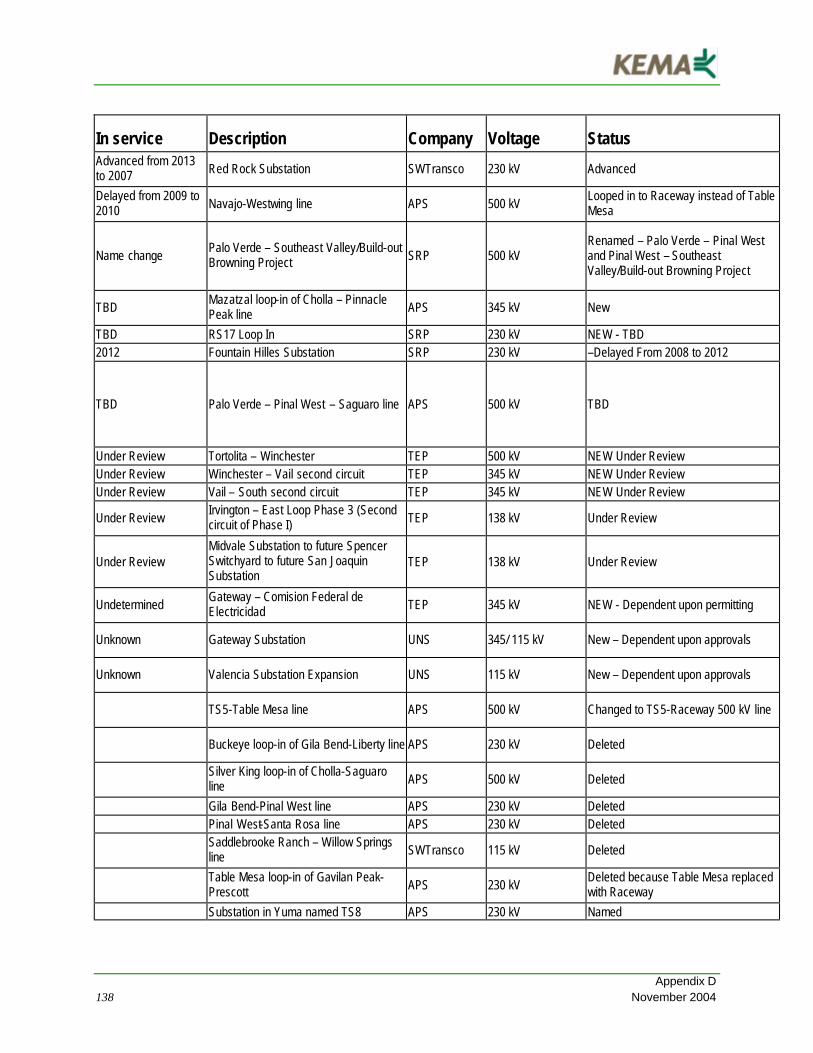
Appendix D 138 November 2004
In service Description Company Voltage Status Advanced from 2013 to 2007 Red Rock Substation SWTransco 230 kV Advanced
Delayed from 2009 to 2010 Navajo-Westwing line APS 500 kV
Looped in to Raceway instead of Table Mesa
Name change Palo Verde – Southeast Valley/Build-out Browning Project SRP 500 kV
Renamed – Palo Verde – Pinal West and Pinal West – Southeast Valley/Build-out Browning Project
TBD Mazatzal loop-in of Cholla – Pinnacle Peak line APS 345 kV New
TBD RS17 Loop In SRP 230 kV NEW - TBD 2012 Fountain Hilles Substation SRP 230 kV –Delayed From 2008 to 2012
TBD Palo Verde – Pinal West – Saguaro line APS 500 kV TBD
Under Review Tortolita – Winchester TEP 500 kV NEW Under Review Under Review Winchester – Vail second circuit TEP 345 kV NEW Under Review Under Review Vail – South second circuit TEP 345 kV NEW Under Review
Under Review Irvington – East Loop Phase 3 (Second circuit of Phase I) TEP 138 kV Under Review
Under Review Midvale Substation to future Spencer Switchyard to future San Joaquin Substation
TEP 138 kV Under Review
Undetermined Gateway – Comision Federal de Electricidad TEP 345 kV NEW - Dependent upon permitting
Unknown Gateway Substation UNS 345/ 115 kV New – Dependent upon approvals
Unknown Valencia Substation Expansion UNS 115 kV New – Dependent upon approvals
TS5-Table Mesa line APS 500 kV Changed to TS5-Raceway 500 kV line
Buckeye loop-in of Gila Bend-Liberty line APS 230 kV Deleted
Silver King loop-in of Cholla-Saguaro line APS 500 kV Deleted
Gila Bend-Pinal West line APS 230 kV Deleted Pinal West-Santa Rosa line APS 230 kV Deleted
Saddlebrooke Ranch – Willow Springs line SWTransco 115 kV Deleted
Table Mesa loop-in of Gavilan Peak-Prescott APS 230 kV
Deleted because Table Mesa replaced with Raceway
Substation in Yuma named TS8 APS 230 kV Named

Third Biennial Transmission Assessment 2004-2013 Docket No. E-00000D-03-0047 139
In service Description Company Voltage Status Trilby Wash renamed TS1 APS 230 kV Renamed
Misty Willow substation renamed to TS6 APS 230 kV Renamed
Table Mesa Substation APS 500 kV Replaced by 500 kV substation @ Raceway with 500/230 kV transformer
Flagstaff loop-in of Cholla-Coconino APS 230 kV Replaced with 345-69-kV interconnection at the WAPA Flagstaff substation
Cholla-Second Knoll line APS 230 kV
Replaced with 500/69- kV interconnection of SRP’s Coronado-Silver King 500 kV line into Second Knoll
West Valley South Project APS 230 kV Will terminate at the TS4 substation instead of Liberty Substation.
2009 Bopp Substation SWTransco 115 kV New TBD: To Be Determined