ARIZONA CONSTITUTION: SPECIFIED DUTIES OF STATE … · ARIZONA CONSTITUTION: SPECIFIED DUTIES OF...
97
ARIZONA CONSTITUTION: SPECIFIED DUTIES OF STATE GOVERNMENT A Report from the Office of the University Economist November 2010 Dennis Hoffman, Ph.D. Professor, Department of Economics; Director, L. William Seidman Research Institute; and Director, Office of the University Economist Tom Rex, M.B.A. Associate Director, Center for Competitiveness and Prosperity Research; and Manager of Research Initiatives, Office of the University Economist Center for Competitiveness and Prosperity Research L. William Seidman Research Institute W. P. Carey School of Business Arizona State University Box 874011 Tempe, Arizona 85287-4011 (480) 965-5362 FAX: (480) 965-5458 EMAIL: [email protected] or [email protected] wpcarey.asu.edu/research/competitiveness-prosperity-research economist.asu.edu
Transcript of ARIZONA CONSTITUTION: SPECIFIED DUTIES OF STATE … · ARIZONA CONSTITUTION: SPECIFIED DUTIES OF...

ARIZONA CONSTITUTION: SPECIFIED DUTIES OF STATE GOVERNMENT
A Report from the Office of the University Economist
November 2010
Dennis Hoffman, Ph.D. Professor, Department of Economics; Director, L. William Seidman Research Institute;
and Director, Office of the University Economist
Tom Rex, M.B.A. Associate Director, Center for Competitiveness and Prosperity Research; and Manager of Research Initiatives, Office of the University Economist
Center for Competitiveness and Prosperity Research L. William Seidman Research Institute
W. P. Carey School of Business Arizona State University
Box 874011 Tempe, Arizona 85287-4011
(480) 965-5362
FAX: (480) 965-5458 EMAIL: [email protected] or [email protected]
wpcarey.asu.edu/research/competitiveness-prosperity-research economist.asu.edu

TABLE OF CONTENTS Summary 1 Introduction 11 State Government Functions Delineated in the Arizona Constitution 12 Interpretation of Constitutional Duties 18 Description of Expenditure Data 19 Methodology for Assessing Government Expenditures 25 History of Government Expenditures 29 Societal Changes and the Effect on Public Expenditures 68 Educational Achievement and Attainment 74 Reasonable Levels of Investment in Education 86
LIST OF TABLES 1. Arizona State Government Operating Budget by Function, Fiscal Year 2011 17 2. Funding Sources for Selected Programs in Arizona in Fiscal Year 2011 21 3. Noncapital Expenditures in Fiscal Year 2008 in Arizona 24 4. Change in Total Expenditures Per $1,000 of Personal Income in Arizona 29 5. Change in K-12 Education Expenditures in Arizona 33 6. Revenue for K-12 Education in Arizona 38 7. K-12 Education Expenditures in Arizona 40 8. Change in Higher Education Expenditures in Arizona 42 9. Change in Correctional Expenditures in Arizona 48 10. Change in Other Expenditures Per $1,000 of Personal Income in Arizona 52 11. Percentage Change in Appropriations, Arizona State Government 65 12. Educational Attainment of Residents by Age: Difference in Percentage, Arizona Less the
United States 81
13. Educational Attainment of Residents Age 25 or Older by Place of Birth: Difference in Percentage, Arizona Less the United States
83
14. Educational Attainment of Residents Age 25 or Older by Residence One Year Earlier, Difference in Percentage, Arizona Less the United States
84
15. Peer Institutions for Arizona Universities 88
i
LIST OF CHARTS 1. Total Noncapital Expenditures Per Capita and Per $1,000 of Personal Income as a
Percentage of The National Average, Arizona State and Local Governments 26
2. Total Noncapital Expenditures Per $1,000 of Personal Income, Arizona 30 3. Total Noncapital Expenditures Per $1,000 of Personal Income Since Fiscal Year 1991,
Arizona 31
4. Public K-12 Education Fall Enrollment in Arizona 33 5. Noncapital K-12 Education Expenditures Per Student Per $1,000 of Per Capita Personal
Income, Arizona 35
6. Noncapital K-12 Education Expenditures Per Student Per $1,000 of Per Capita Personal Income Since Fiscal Year 1991, Arizona
36
7. Total K-12 Education Expenditures Per Student Per $1,000 of Per Capita Personal Income, Arizona
37
8. Average Teacher Salary, Arizona as a Percentage of the National Average 41 9. Public Higher Education Fall Enrollment in Arizona 41 10. Noncapital Higher Education Expenditures Per Student Per $1,000 of Per Capita Personal
Income, Arizona 43
11. Noncapital Higher Education Expenditures Per Full-Time-Equivalent Student Per $1,000 of Per Capita Personal Income, Arizona
44
12. Number of Inmates Held Under State Government Authority Per 1,000 Residents 46 13. Noncapital Correctional Expenditures Per Inmate Per $1,000 of Per Capita Personal
Income, Arizona 47
14. Noncapital Correctional Expenditures Per $1,000 of Personal Income, Arizona 49 15. Other Noncapital Expenditures Per $1,000 of Personal Income, Arizona 50 16. Other Noncapital Expenditures Per $1,000 of Personal Income Since Fiscal Year 1991,
Arizona 51
17. Expenditures Per $1,000 of Personal Income for Major Health and Welfare Agencies in Arizona
53
18. Number of Recipients in Various Health and Welfare Programs in Arizona 55 19. Health and Welfare Expenditures Per $1,000 of Personal Income, State Government 57 20. Health and Welfare Expenditures Per $1,000 of Personal Income, Arizona 58 21. Noncapital Expenditures Per $1,000 of Personal Income, Arizona State and Local
Governments 60
22. Expenditures Per Student/Inmate Per $1,000 of Per Capita Personal Income, Arizona State and Local Governments
61
23. Appropriations, Arizona State Government 63 24. Appropriations Per Student Per $1,000 of Per Capita Personal Income, Arizona State
Government 66
25. Appropriations Per Correctional Inmate Per $1,000 of Per Capita Personal Income, Arizona State Government
66
26. Educational Attainment of Residents Age 25 or Older, Arizona and the United States as a Proportion of the Total
78
27. Maximum Educational Attainment of Residents Age 25 or Older: Difference in Percentage, Arizona Less the United States
79
28. Median Earnings by Maximum Educational Attainment, Age 25 or Older 80 29. Educational Attainment of Arizona Residents by Age 80 30. Educational Attainment of Arizona Residents by Place of Birth, Age 25 or Older 82 31. Educational Attainment of Arizona Residents by Residence in Prior Year, Age 25 or Older 84 32. Percentage Difference in Funding Between Arizona Universities and Peer Institutions 89
ii

SUMMARY Other than the general organization of state government into the three branches (executive, legislative, and judicial), the delineation in the Arizona Constitution of specific duties of state government is the exception rather than the norm. Only a few functions are expressly addressed:
• Article XI discusses the public school system. • Article XV establishes the Corporation Commission. • Article XIX establishes the office of the Mine Inspector. • Article XXIX discusses public retirement systems. • Otherwise, Article XXII, Section 15, provides that “Correctional and penal institutions, and institutions for the benefit of persons who have mental or physical disabilities and such other institutions as the public good may require, shall be established and supported by the State in such manner as may be prescribed by law.”
Thus, most of the current state agencies and state government functions are not mentioned in the Arizona Constitution, being created in statute by the Arizona Legislature—as allowed by Article XXII, Section 15. Generally, the Arizona Constitution provides limited detail on the specific duties to be performed or on the means of funding state government functions. The exception is Article XI—the public school system. The Arizona Constitution is much more explicit regarding the provision of public education, and the funding for education, than it is for any other state government duty. This also was the case in the original version of the Constitution that was written in 1910. Section 10 of Article XI is unique in the Arizona Constitution in terms of addressing funding sources and specifying funding levels:
“The revenue for the maintenance of the respective state educational institutions shall be derived from the investment of the proceeds of the sale, and from the rental of such lands as have been set aside by the enabling act approved June 20, 1910, or other legislative enactment of the United States, for the use and benefit of the respective state educational institutions. In addition to such income the legislature shall make such appropriations, to be met by taxation, as shall insure the proper maintenance of all state educational institutions, and shall make such special appropriations as shall provide for their development and improvement.”
The first sentence refers to the sale and lease of state trust land. Focusing on the second sentence, the constitutional requirement that the Arizona Legislature shall provide funding for public education from tax revenue is clear. No distinction is made between elementary, secondary, and higher education. (Section 1 of Article XI specifies that the public school system consists of everything from kindergarten through universities.) Substituting dictionary definitions for “proper maintenance” and “development and improvement,” this section of the Constitution specifies that the Legislature has the responsibility to provide for the upkeep or support of public schools that is appropriate to the purpose. However, the writers of the Constitution went further, specifying that the Legislature shall bring
1

all state educational institutions to a more advanced or effective state and shall bring them into a more desirable or excellent condition. In order to fund education and other programs, the Arizona Constitution provides broad taxing authority in Article 9, Section 12:
“The law-making power shall have authority to provide for the levy and collection of license, franchise, gross revenue, excise, income, collateral and direct inheritance, legacy, and succession taxes, also graduated income taxes, graduated collateral and direct inheritance taxes, graduated legacy and succession taxes, stamp, registration, production, or other specific taxes.”
Some lawmakers argue that they are unable to adequately fund public services simply because “there is no revenue.” However, “there is no revenue” because of systematic reductions in tax rates, outright elimination of taxes, and the passage of new tax credits and tax exemptions since the early 1990s that have cumulated to nearly $3 billion. when compared with the Arizona economy today. These tax cuts are largely responsible for general fund revenues as a share of total state income currently being at much lower levels than prior to the early 1990s; that is, the state government tax burden is far less than what it was historically. Since the Constitution clearly empowers the Legislature with the authority to set tax rates, the claim that “there is no revenue” is not a convincing rationale for not meeting constitutional obligations.
Funding for Constitutional Obligations In most studies of public expenditures, comparisons over time and across states are made using all funding from all sources. In addition to legislative appropriations, federal funds, local government revenues, and other funding sources may constitute significant shares of the total funding for a program. Meaningful comparisons of Arizona to other states and the national average can only be made using total funding. Yet, in many cases, the nonappropriated funds must be used for very specific purposes and therefore cannot be considered to be a substitute for appropriations. For example, federal research grants received by the universities must be spent on research, not for undergraduate instruction or other purposes, and therefore cannot compensate for reductions in general fund appropriations. The amount of state government appropriations—the sum from the general fund and from the numerous other state government funds—reflects the willingness of the Arizona Legislature to commit funds raised by the state, largely through taxation, for the various programs. Thus, in this paper, the amount of appropriations—not total funding—is the primary focus in evaluating whether constitutional obligations are being met, with the historical record of appropriations being examined. However, total funding for government programs also is reported throughout this paper, with time series comparisons to the national average presented. Appropriations data are available through the current fiscal year (2011: from July 1, 2010 through June 30, 2011), but the latest fiscal year (FY) data for total funding are from 2008. In order to compare funding over time, the dollar figures need to be adjusted for inflation and changes in the size of the state. The preferred measure is funding per $1,000 of personal income,
2

which not only adjusts for inflation and growth, but provides a consistent basis for evaluating the ability of the state’s taxpayers to provide the revenues that fund the various programs. For programs that are designed to serve only a portion of the population, for example correctional inmates or students, funding per participant per $1,000 of per capita personal income (PCPI) may be a better measure. Comparisons based on this measure over time reveal whether funding is increasing or decreasing in comparison with average income. Sometimes, funding per participant is reported without reference to income, but this measure has limitations when comparing figures across states or over time (even after adjusting for inflation). Corrections The Arizona Constitution provides no guidance regarding the funding of the correctional system. In the current fiscal year, the state’s general fund accounts for 86 percent, and all appropriations for 95 percent, of total funding for corrections. Thus, it makes little difference to the analysis whether only appropriations or total funding is used. Very substantial increases in correctional funding occurred during the 1970s and 1980s in Arizona relative to the growth of the state’s economy. Only a modest upward trend in funding has occurred since FY 1990. This relative stability over the last two decades is the result of two divergent trends. The number of inmates continues to rise rapidly as a percentage of the state’s population, continuing the trend that has been present since the late 1970s. In contrast, spending per inmate relative to the size of the economy in Arizona fell very considerably through the 1980s and 1990s before finally stabilizing in FY 2005. Total government funding for corrections in Arizona relative to the size of the economy soared during the late 1970s and 1980s as a percentage of the national average. Though the percentage of the U.S. average has dropped back since the early 1990s, correctional spending in Arizona still was nearly 30 percent above the national average in FY 2008. The increases in correctional spending are the result of the mandatory sentencing law that was adopted in Arizona in 1979. Subsequent laws, such as the requirement passed in 1993 that all inmates serve at least 85 percent of their sentenced time, also contributed. The rise in correctional funding that resulted from the large increase in the number of prisoners was not accompanied by any increase in revenues. Rather, tax reductions were passed during the late 1970s-early 1980s as mandatory sentencing first took effect and again since the early 1990s. Thus, the increase in correctional spending has been taken from other programs. Disabilities The Arizona Constitution provides no guidance regarding the funding of programs for people with disabilities. With the administration of these programs scattered across state agencies, it is not possible to construct a time series of expenditures for these programs. Currently, programs for the disabled account for roughly one-fourth of all health and welfare spending by the state. Health and welfare programs other than for the disabled are not obligated by the Arizona Constitution.
3

The state’s general fund accounts for less than one-fourth, and total appropriations for less than one-third, of total health and welfare funding; the federal government is the primary source of funding. Health and welfare expenditures by the state began to rise substantially in the late 1960s. As Arizona’s version of the federal Medicaid program (Arizona Health Care Cost Containment System: AHCCCS) was phased in during the 1980s, it became a significant recipient of state government monies, though general fund revenues were not enhanced to fund this new obligation. Appropriations for health and welfare have continued to increase significantly since then, in part because of service expansions that rarely have been associated with an increase in revenue. Total government expenditures for health and welfare in Arizona relative to the size of the economy remain less than the U.S. average. However, based on the state’s lower incomes and higher poverty rates, the need for public health and welfare programs in Arizona exceeds the national average. Spending on social programs is far greater today than when the Arizona Constitution was drafted due to a significant shift in sentiment regarding government’s role in the provision of these social services. Without expansion of the revenue base, this trend toward greater spending on social programs has pressured the ability of the Arizona Legislature to meet the obligations set forth in the Arizona Constitution. Programs Other Than Corrections, Health and Welfare, and Education Funding for the other state government functions identified in the Arizona Constitution is very small in magnitude to that for education, corrections, and disabilities. Total appropriations in FY 2011 for the executive, legislative, and judicial branches, and for the Corporation Commission, the office of the Mine Inspector, and public retirement systems combined account for only 3 percent of the total. Appropriations in the current fiscal year for all state government functions other than education, corrections, and health and welfare account for only 6 percent of the general fund and 15 percent of total appropriations. Relative to the size of the economy, these appropriations have been steady over time. Based on total government expenditures, the relationship to the national average also has not demonstrated a trend. Not included in these figures, however, are the contributions to the state’s retirement systems that are paid by all agencies. These contributions are paid out of total appropriations and are not identified separately in the appropriations reports. However, the retirement contributions make up a large and growing expense for state (and local) government. Education Unlike any other state government function, the Arizona Constitution provides guidance regarding the funding for public education. Significantly, the Constitution not only requires that the educational institutions receive “proper maintenance,” but that they be “developed and improved.”
4

Elementary and Secondary Education. In the current fiscal year, the state’s general fund accounts for 69 percent, and all appropriations for 70 percent, of total funding for elementary and secondary (K-12) education. As a share of total appropriations, funding for K-12 education fluctuated between 32 and 35 percent between FYs 1989 and 2009, but dropped below that range in FYs 2010 and 2011. The decrease in the last two years might have been larger had the conditions of accepting the federal stimulus program monies not required that education funding not fall below a particular level. This condition expires at the end of the current fiscal year. Total K-12 appropriations per $1,000 of personal income were between $18.9 and $19.8 from FYs 1989 through 1997, but fell as low as $17.7 during the economic difficulties of the early 2000s. Though some of the funding was restored during the economic boom of the mid-2000s, the figure peaked at $18.8. Since then, it has fallen to $14.6 in FY 2010 and $15.5 in FY 2011. The current FY figure is 20 percent less than the midpoint of the FY 1989 through 1997 range. Per student per $1,000 of per capita personal income, total K-12 appropriations gradually decreased from $121 in FY 1989 to $100 in FY 2005. The figure recovered to $111 in FY 2007 but has since dropped below $100. The FY 2010 figure was 22 percent less than the midpoint of the FY 1989 through 1997 figures. Total government funding for K-12 education also has dropped significantly since the early 1990s, as measured per student per $1,000 of PCPI. Arizona’s figure was marginally higher than the national average, and ranked between 18th and 24th among the states, during the early and mid-1990s. In FY 2008, Arizona’s figure was 14 percent less than the U.S. average and ranked 46th among the states. Over a period of just more than a decade, this represents a substantial deterioration in support for K-12 education relative to the rest of the nation—and funding cuts in Arizona since FY 2008 are likely to have made these national comparisons even less favorable. While accusations of high administrative costs have frequently been levied, Arizona’s public K-12 school system actually has among the lowest administrative costs in the nation. Administrative spending per student per $1,000 of PCPI fell very substantially between FYs 1992 and 2008, particularly for general administration (e.g. school district operations). For Arizona’s funding per K-12 student per $1,000 of PCPI to have been at the median of all states in FY 2008, an additional $1.6 billion in funding would have been needed. Relative to the national median on a per student basis, the necessary increase in funding would have been $2.7 billion. However, Arizona’s “need” to spend on education is greater than the norm. Disproportionate, and increasing, shares of its children are disadvantaged, with many living in poverty or speaking English as a second language. Higher Education. In the current fiscal year, the community colleges receive 90 percent of their funding (excluding the amount raised directly by the community college districts) from the state’s general fund; they receive no monies from other state funds. In contrast, the state’s general fund accounts for only 23 percent, and all appropriations for 41 percent, of total funding
5
for the university system. Almost all of the higher education appropriations from funds other than the general fund originated as student tuitions and fees. University tuitions have increased significantly in recent years despite the constitutional requirement that tuition be kept as low as possible. Section 6 of Article XI of the Arizona Constitution states “The university and all other state educational institutions shall be open to students of both sexes, and the instruction furnished shall be as nearly free as possible.” Especially in light of this constitutional injunction, it is not reasonable to include the appropriations of tuition dollars in an assessment of the state’s support for higher education. Thus, general fund appropriations are the focus, whereas the basis for the analysis of appropriations for other state government functions is total appropriations from all funds. For community colleges, general fund appropriations as a share of the total general fund dropped from 3.7 percent in FY 1979 to 2.5 percent in FY 1991 to 1.6 percent in FY 2011. For the university system, the shares fell from 19.1 percent in FY 1979 to 16.1 percent in FY 1991 to 10.5 percent in FY 2011. Relative to the size of the Arizona economy, the general fund appropriations for higher education have dropped significantly over time. For the community colleges, appropriations per $1,000 of personal income went from $1.74 in FY 1979 to $1.27 in FY 1991 to $0.59 in FY 2011. For the universities, the drop was from $8.87 in FY 1979 to $8.19 in FY 1991 to $3.88 in FY 2011. No other major expenditure category has incurred this much erosion of funding. Substantial decreases also have occurred in higher education general fund appropriations per full-time-equivalent student per $1,000 of per capita personal income. Between FYs 1991 and 2009 (the latest year of complete enrollment data), the decrease was from $64 to $41 (36 percent) for community colleges and from $389 to $225 (42 percent) for universities. Thus, general fund appropriations per FTE student per $1,000 of PCPI have fallen further, and for a longer period of time, for higher education than have per student appropriations for K-12 education. General fund appropriations have fallen to be less than one-fourth of the total funds received by the Arizona universities. With general fund appropriations falling so much, the universities have had to turn increasingly to other sources of financial support, including research grants and significantly higher tuition. Thus, it is no surprise that the historical pattern, and comparison to the national average, of total funding for higher education looks very different from that of the general fund. Total funding for higher education in Arizona has not fallen per FTE student nor has the percentage of the national average dropped. Per FTE student per $1,000 of PCPI, total funding in FY 2008 was slightly above the national average, though funding was among the lowest in the country per FTE student. However, since much of the nonappropriated funding received by the universities can be used only for specific purposes and therefore cannot serve as a replacement for the loss of appropriations, total funding from all sources for higher education does not provide a basis for evaluating the state’s support for higher education.
6
Had Arizona’s higher education spending per FTE student been at the median of all states in FY 2008, the state would have spent $550 million more than it did. However, spending was close to the national median on a per FTE student per $1,000 of PCPI basis.
Educational Achievement and Attainment If Arizona’s educational system were performing well, the low and declining funding for K-12 education would be of lesser significance. This would provide contravening evidence to the contention that the Arizona Legislature is not meeting its constitutional requirement in funding public education, particularly in terms of “development and improvement.” While funding is not the only input into the educational system and therefore not the only factor affecting the performance of Arizona’s educational system, funding is of obvious significance. To expect Arizona’s elementary and secondary schools (and institutions of higher education) to perform well despite the very low funding levels, the quality of the other inputs would need to be very high. However, there is no evidence that funding deficiencies in Arizona are offset by inherently more intelligent or harder-working students, by better-quality teachers, by significantly more efficient use of limited resources by schools and school districts, etc., relative to the national average. In fact, Arizona’s teachers have less experience than their counterparts nationally and Arizona has a disproportionate share of disadvantaged students—a circumstance requiring above-average rather than below-average funding to overcome. Educational achievement of Arizona students, as gauged by various tests and other measures, is among the lowest in the nation. The educational achievement data that can be compared over time do not suggest that Arizona’s deficiencies are gradually being overcome. Rather, most achievement measures are flat, and a few are declining. With funding levels declining, some might interpret the lack of significant worsening of achievement measures to be a sign that the state can live with lower educational funding. Before that conclusion is drawn, the long lag in any relationship between funding and K-12 student achievement must be considered. Most children attend public K-12 schools for 13 years. A funding reduction is unlikely to have a significant effect on the achievement of children older than those in the first few grades. Most of the decrease in K-12 appropriations has occurred only since FY 2000, with the most significant decreases after FY 2007. So, one should not expect to see much decrease in achievement—yet. Total K-12 funding from all sources fell primarily between FYs 1997 and 2004 in Arizona. Federal stimulus monies and increases in local government property tax collections due to the huge increases in real estate values during the mid-2000s have kept total K-12 funding up in recent years despite the reduced appropriations. However, property tax collections are now down due to the recent crash in real estate values and the federal stimulus money disappears after the current fiscal year. The state government general fund continues to run a deficit. So, the K-12 funding outlook is bleak going forward. Thus, the potential negative impacts of funding reductions are a real concern for those children who began school within the last couple of years and for those who will be entering school soon.
7

In contrast to the relative stability in student achievement, educational attainment relative to the national average has been declining in Arizona for more than two decades. General fund appropriations for higher education also have been falling over this extended period. While a cause-and-effect conclusion cannot be drawn between funding reductions and declining educational attainment relative to the U.S. average, concern for educational attainment in the state going forward is justified. Any effect between funding reductions and educational attainment will take even longer to manifest than impacts on K-12 student achievement.
Benefits from Education Significant societal and economic benefits stem from public investments in education. Given the unique attention and detail given to public education in the original Constitution, it is reasonable to conclude that the authors in 1910 also recognized these benefits. Hence, adherence to the Arizona Constitution is not only the legal obligation of today’s Legislature, it can yield economic benefits that reap returns to the economy of Arizona. Additional years of education yield economic benefits to the individual in the form of a higher salary. Broader economic and noneconomic benefits also are realized. As early as Adam Smith’s Wealth of Nations in 1776, economists have noted the spillover benefits that accrue to investments in education and the subsequent wealth and rising standards of living that educated societies enjoy. Increasing investments in human capital produce improvements in productivity, which allow wages and living standards to rise. The increases in wages are not limited to the individuals with greater educational attainment who stimulate the productivity gains. Instead, all workers benefit. It has been estimated that raising the labor force share of college graduates in Arizona by one full percentage point would raise productivity to the extent that an overall increase in aggregate incomes of about $2.1 billion in the state would occur. Social benefits include less crime, more civic participation, and improved performance over a range of socioeconomic indicators, such as the poverty rate. Less demand on public welfare programs results. The intergenerational social benefits may be very large as increased educational attainment today translates into higher probabilities of strong educational attainment in future generations. Academic ability is shaped by family and environmental factors. The values and goals of an individual, influenced strongly by the educational attainment of the parents, is an important determinant of educational attainment.
Conclusion For decades after statehood, the state was a strong supporter of the public education system in Arizona. Total government education expenditures relative to the size of the economy were well above the national average, which contributed to total expenditures of all programs combined also being above average. K-12 spending per student also was above average. During this period, the educational attainment of Arizona’s residents exceeded the national average. The state became the home of two high-paying, high-technology industries (electronics
8

and aerospace). The economic well-being of the Arizona populace reached a high point in the early 1970s, as per capita personal income was only 5 percent less than the national average. The support for education and the willingness to continue to raise revenues adequate to support above-average total expenditures began to wane during the 1960s. In the mid-1960s, the tax burden in Arizona was slightly above average and nontax sources of revenue also were above average. By the early 1970s, both were below average. As a result of the revenue reductions, total expenditures relative to the size of the economy dropped substantially relative to the national average in the late 1960s and early 1970s. At the same time, health and welfare expenditures began to increase considerably. Another reduction in the tax burden took place in the late 1970s-early 1980s, at the same time that correctional expenditures began to rise rapidly due to the mandatory sentencing law. Shortly thereafter, the state’s alternative to Medicaid began to phase in, keeping health and welfare expenditures rising rapidly. Then in the early 1990s, a concerted effort to reduce taxes began. The cumulative effect of numerous tax reductions since then has been to greatly reduce state government revenues. Despite this, a new spending obligation—the funding for K-12 school construction—was added to the general fund without an associated revenue stream. Thus, the history over the last 40 years has been one of repeated spending obligations being added to the general fund without a revenue stream being identified to fund the new or expanded programs. This alone has forced funding for existing programs to be reduced and has diminished in the public’s mind the necessity of linking revenues and expenditures. However, the situation has been made much worse in Arizona by the repeated tax reductions that have been made during the same period that additional spending obligations have been undertaken. As a result of the very substantial reductions to revenues and continued increases in expenditures for programs that are not mandated by the Arizona Constitution, per student appropriations for education have fallen substantially relative to the ability of the state’s taxpayers to support such efforts. The decrease has been greater for higher education than for K-12 education. Total government funding per K-12 student has dropped far below the national average; the state ranks near the bottom of the states. Funding per higher education student also is below average. Relative to the national average, the educational attainment of Arizonans began to drop in the 1970s and has fallen significantly since 1980. The state’s residents also have lost ground relative to the national average in terms of economic well being. Even before the onset of the recent recession, per capita personal income in Arizona was 13 percent below average. High-technology industries have been declining as a proportion of the Arizona economy. Education Based on (1) the reductions in funding that have occurred, primarily in the last decade, on all measures and at all levels of aggregation (e.g. from the general fund up to total funding from all sources), (2) the state’s ranking on all spending measures falling over time to now be among the bottom 10 states, and (3) the state’s poor comparison on the bulk of educational achievement and
9
attainment measures, a strong case can be made that the K-12 school system is not being maintained as required by the Arizona Constitution, much less developed and improved. A strong case also can be made that the funding for higher education does not meet the constitutional requirement. The case is even stronger than that of K-12 education based on general fund appropriations, which have fallen more and for a longer period than K-12 appropriations. The sources of funding for higher education other than general fund appropriations come with limitations. First, the universities cannot freely spend some of the funding received from the federal government and from other sources—most importantly, the monies cannot always be used in general support of university operations as can the general fund monies. Second, university tuitions provide a large share of the total funding (in the case of Arizona State University, tuition dollars exceed general fund appropriations) and are increasing substantially to offset the decreases in general fund appropriations. These tuition increases seem to violate the section of the Arizona Constitution that reads “the instruction furnished shall be as nearly free as possible” (at all state educational institutions). Thus, the fact that total higher education funding is remaining relatively constant and is near the national norms does not invalidate the argument that the proper maintenance of higher education institutions that is required by the Arizona Constitution is not occurring. The apparent failure to meet the requirements of the Arizona Constitution in regards to education funding creates more than a legal liability. As the U.S. economy has transitioned from an industrial to information base, the importance of technology and innovation in the American economy is widely believed to have never been greater. Thus, the role of human capital in sustaining economic growth and development is the greatest in the history of the nation. Despite these trends, Arizona continues to reduce its support for education, with the reduction especially large relative to the average of the states. Thus, the state’s existing downward trends in educational attainment and economic well-being relative to the national average are likely to continue. The state will find itself increasingly uncompetitive in the 21st-century economy and is in real danger of reducing itself to second-class status within the United States. The longer the state takes to rectify the educational funding deficiencies, the longer it will take to turn around the state’s economy. Considerable ground has already been lost. Given the length of time it takes for changes in funding to have an impact on student achievement and educational attainment, even an immediate reversal of funding trends will not realize observable benefits for more than a decade. Positive impacts on economic performance will take even longer.
10

INTRODUCTION The Arizona Constitution was written during a constitutional convention held in 1910. It was approved by the President of the United States when Arizona became a state in February 1912. The original constitution was relatively short. It generally did not go into much detail, leaving that to be done by the Arizona Legislature through statute. Many modifications and expansions to the Arizona Constitution have been made since 1912. In some cases, the additions are quite detailed, written more like statutory law than constitutional law. Unlike the U.S. Constitution, where changes are specified as amendments, it is not possible by simply examining the current Arizona Constitution to determine how the language of the Constitution has changed since 1912. Therefore, the language of the current version of the Arizona Constitution was compared to the version written during the 1910 constitutional convention. Broadly, the Arizona Constitution specifies that state government shall be divided into three branches. The complete language of Article III follows:
“The powers of the government of the state of Arizona shall be divided into three separate departments, the legislative, the executive, and the judicial; and, except as provided in this constitution, such departments shall be separate and distinct, and no one of such departments shall exercise the powers properly belonging to either of the others.”
Article IV covers the legislative department, specifying that it shall consist of two chambers. Article V addresses the executive department, specifying that it consists of the Governor, Secretary of State, State Treasurer, Attorney General, and Superintendent of Public Instruction. The composition of the judicial department is discussed in Article VI, specifying that it shall consist of a Supreme Court, appellate courts, a Superior Court, courts inferior to the Superior Court, and justice courts. The latter two categories are functions of local, not state, government. Other than the general organization into the three branches, the delineation of specific duties of state government in the Arizona Constitution is the exception rather than the norm. Only a few functions are expressly addressed:
• Article XI discusses the public school system. • Article XV establishes the Corporation Commission. • Article XIX establishes the office of the Mine Inspector. • Article XXIX discusses public retirement systems. • Otherwise, Article XXII, Section 15, provides that “Correctional and penal institutions, and institutions for the benefit of persons who have mental or physical disabilities and such other institutions as the public good may require, shall be established and supported by the State in such manner as may be prescribed by law.”
Thus, most of the current state agencies and state government functions are not mentioned in the Arizona Constitution, being created in statute by the Arizona Legislature—as allowed by Article XXII, Section 15.
11

STATE GOVERNMENT FUNCTIONS DELINEATED IN THE ARIZONA CONSTITUTION
Generally, the Arizona Constitution provides limited detail on the specific duties to be performed or on the means of funding state government functions.
Legislative Branch Various aspects of the operation of the Legislature are specified in Article IV of the Arizona Constitution. The current language reflects a number of modifications to the 1910 language. No mention is made of funding. The fiscal year (FY) 2011 general fund appropriation for the legislative branch (including the Auditor General, Joint Legislative Budget Committee, Legislative Council, and the two houses of the Legislature) is $44.6 million, just 0.5 percent of the total state general fund operating budget of $8.476 billion. The legislative branch receives no appropriations from other state funds and accounts for only 0.4 percent of total operating budget appropriations of $11.196 billion. It receives only minimal nonappropriated monies (such as federal funds) so that its total funding accounts for less than 0.2 percent of the $28.249 billion total spending authority operating budget.
Executive Branch In Article V of the Arizona Constitution, various aspects of the operation of the executive branch are specified. The number and magnitude of changes to the 1910 language are not substantial. No mention is made of funding. The FY 2011 general fund appropriation for the Governor, Secretary of State, Attorney General, and Treasurer is $41.1 million, just 0.5 percent of the state’s total general fund operating budget. An additional $49.9 million is received from other state funds, with most of that going to the Attorney General. Total appropriations of $91 million account for 0.8 percent of the appropriated operating budget. Another $56.5 million is received from nonappropriated sources. The total funding of $147.5 million represents just 0.5 percent of the total operating budget. The budget for the Superintendent of Public Instruction is included in the Department of Education. Administrative costs within the Department of Education are $32 million in FY 2011, with three-fourths coming from the general fund.
Judicial Branch Various aspects of the operation of the judiciary are specified in Article VI of the Arizona Constitution. The current constitutional language is much more detailed than that written in 1910. No mention is made of funding. The fiscal year 2011 state general fund appropriation for the courts is $113.9 million, just 1.3 percent of the total general fund operating budget. An additional $46.7 million is received from other state funds. Total state appropriations are $160.6 million, or 1.4 percent of the total appropriated operating budget. With $27.9 million received from nonappropriated sources, total funding for the courts is $188.5 million, only 0.7 percent of the total operating budget.
12

Corporation Commission The duties of the Arizona Corporation Commission are specified in some detail in Article XV of the Arizona Constitution. Limited changes have been made to the original 1910 language. No mention is made of funding. The FY 2011 state general fund appropriation for the Commission is only $622,200, but the Commission receives $24.1 million from other appropriated state funds. The total appropriation represents just 0.2 percent of the total appropriated operating budget. The Commission receives limited funding from nonappropriated sources, such that its total funding of $25.6 million accounts for less than 0.1 percent of the state’s total operating budget.
Office of the Mine Inspector Article XIX of the Arizona Constitution briefly states the purpose of the office:
“The office of mine inspector is hereby established. The legislature shall enact laws so regulating the operation and equipment of all mines in the state as to provide for the health and safety of workers therein and in connection therewith, and fixing the duties of said office.”
The current language is hardly different from that of 1910. Funding is not specified. The FY 2011 state general fund appropriation is only $1.1 million, with total state appropriations of $1.2 million and total funding of $1.6 million, less than 0.1 percent of the total operating budget.
Public Retirement Systems Article XXIX was added to the Arizona Constitution after 1912. The full constitutional language follows:
“Section 1. A. Public retirement systems shall be funded with contributions and investment earnings using actuarial methods and assumptions that are consistent with generally accepted actuarial standards. B. The assets of public retirement systems, including investment earnings and contributions, are separate and independent trust funds and shall be invested, administered and distributed as determined by law solely in the interests of the members and beneficiaries of the public retirement systems. C. Membership in a public retirement system is a contractual relationship that is subject to article II, section 25, and public retirement system benefits shall not be diminished or impaired.”
The Arizona State Retirement System was created in 1953. No monies from the state general fund are allocated to State Retirement, but fiscal year 2011 appropriations from the state retirement system administration fund and from the long-term disability administration fund total $24.7 million, just 0.2 percent of the total appropriated operating budget. Nonappropriated monies are budgeted at $51.8 million. Total funding of $76.5 million is only 0.3 percent of the total operating budget. These figures do not include the matching contributions made by state agencies that have employees who are members of the system.
13
Corrections As noted earlier, Article XXII, Section 15 of the Arizona Constitution provided for the establishment of correctional and penal institutions at statehood. All details were left to be prescribed by law. Appropriations from the state general fund for the Departments of Corrections and Juvenile Corrections total $1 billion (12 percent of the general fund operating budget) in FY 2011. Other appropriations amount to only $47.6 million, so total appropriations for corrections amount to only 9.4 percent of the appropriated operating budget. The correctional departments receive $63.1 million in nonappropriated monies, only a small share of the total funding that is not appropriated. Thus, total correctional funding of $1.1 billion accounts for only 4 percent of the total operating budget.
Disabilities At statehood, Article XXII, Section 15 of the Arizona Constitution provided for the establishment of institutions to serve persons with mental and physical disabilities. All details were left to be prescribed by law. Those individuals with mental or physical disabilities currently are covered by various programs administered by the Departments of Health Services (DHS) and Economic Security (DES). Of the four divisions within DHS, two can be considered to wholly serve those with disabilities: Behavioral Health and the Arizona State Hospital. In addition, the Children’s Rehabilitative Services portion of the Family Health division benefits children with disabilities. Of the six divisions within DES, Developmental Disabilities, the Rehabilitation Services portion of Employment and Rehabilitation Services, and a portion of Aging and Community Services serve the disabled. The state’s appropriations report does not provide full detail for individual programs within a division. Thus, the following FY 2011 totals for programs serving the disabled are estimates. Within the state general fund’s operating budget, approximately $700 million (more than 8 percent of the total) goes to programs for the disabled. These programs receive about $95 million (around 3.5 percent of the total) in other state appropriations. Nonappropriated funding for these disability programs is very substantial, estimated as at least $2 billion. Thus, total funding for disabilities likely is at least $2.8 billion, about 10 percent of the state’s total operating budget.
Public Education Section 1 of Article XI of the Arizona Constitution specifies the components of the public school system:
“The legislature shall enact such laws as shall provide for the establishment and maintenance of a general and uniform public school system, which system shall include:
1. Kindergarten schools. 2. Common schools. 3. High schools. 4. Normal schools. 5. Industrial schools.
14

6. Universities, which shall include an agricultural college, a school of mines, and such other technical schools as may be essential, until such time as it may be deemed advisable to establish separate state institutions of such character.
The legislature shall also enact such laws as shall provide for the education and care of pupils who are hearing and vision impaired.”
Section 6 specifies that public education shall be as nearly free as possible, with free schools available in every common school district:
“The university and all other state educational institutions shall be open to students of both sexes, and the instruction furnished shall be as nearly free as possible. The legislature shall provide for a system of common schools by which a free school shall be established and maintained in every school district for at least six months in each year, which school shall be open to all pupils between the ages of six and twenty-one years.”
Section 8 provides a funding source for common and high schools:
“A permanent state school fund for the use of the common schools shall be derived from the sale of public school lands or other public lands specified in the enabling act approved June 20, 1910; from all estates or distributive shares of estates that may escheat to the state; from all unclaimed shares and dividends of any corporation incorporated under the laws of Arizona; and from all gifts, devises, or bequests made to the state for general educational purposes. The rental derived from school lands, with such other funds as may be provided by law shall be apportioned only for common and high school education in Arizona, and in such manner as may be prescribed by law.”
In Section 10, additional funding for public education from taxation is mandated. Guidance is provided as to the level of funding required, specifying that not only should the public educational institutions be properly maintained, but that special appropriations shall be made to provide for their development and improvement:
“The revenue for the maintenance of the respective state educational institutions shall be derived from the investment of the proceeds of the sale, and from the rental of such lands as have been set aside by the enabling act approved June 20, 1910, or other legislative enactment of the United States, for the use and benefit of the respective state educational institutions. In addition to such income the legislature shall make such appropriations, to be met by taxation, as shall insure the proper maintenance of all state educational institutions, and shall make such special appropriations as shall provide for their development and improvement.”
Among the sections highlighted above, the current constitutional language is identical to that written in 1910 except for the second paragraph in Section 8. Thus, in 1910 as well as today, the Arizona Constitution is much more explicit regarding the provision of public education, and the funding for education, than it is for any other state government duty. The FY 2011 general fund budget for public education (including the Commissions for Postsecondary Education and for the Deaf and Hard of Hearing, and the School Facilities Board) totals $4.6 billion, 54 percent of the state general fund operating budget. Public education
15

receives lesser shares of appropriations from other state funds and of nonappropriated funds. Thus, public education’s share of the operating budget for total appropriations is 48 percent and its share of the state’s total operating budget is 33 percent.
Relative Importance of Specified Duties Three state government duties specified in the Constitution—public education, corrections, and disabilities—combined account for a large share of the state’s FY 2011 operating budget (75 percent of the general fund, 65 percent of all appropriations, and 47 percent of the total operating budget). The other state agencies (not specified in the Arizona Constitution) having the most spending authority in FY 2011 are listed in Table 1. AHCCCS (the Arizona Health Care Cost Containment System) receives more funding than any state government function except public education. It receives nearly $1.5 billion in appropriations (13 percent of the total). Its appropriations are dwarfed by nonappropriated funding of nearly $6.4 billion. The AHCCCS total funding of nearly $7.9 billion makes up almost 28 percent of the total operating budget. No other state agency receives as much appropriations as corrections and disabilities. However, due to substantial nonappropriated monies, the total operating budgets for the balance of DES (those programs not providing benefits to those with disabilities) and for the Department of Administration are larger than the total operating budget of corrections.
16
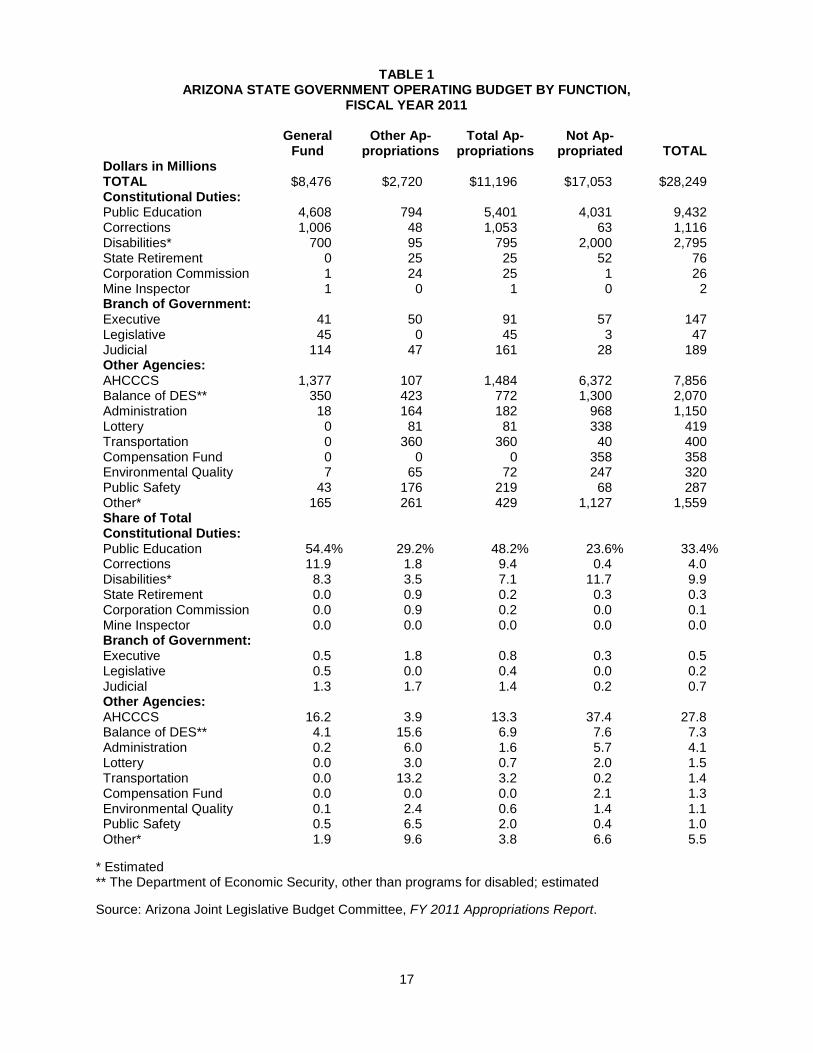
TABLE 1 ARIZONA STATE GOVERNMENT OPERATING BUDGET BY FUNCTION,
FISCAL YEAR 2011 General
Fund Other Ap-
propriations Total Ap-
propriations Not Ap-
propriated
TOTAL Dollars in Millions TOTAL $8,476 $2,720 $11,196 $17,053 $28,249 Constitutional Duties: Public Education 4,608 794 5,401 4,031 9,432 Corrections 1,006 48 1,053 63 1,116 Disabilities* 700 95 795 2,000 2,795 State Retirement 0 25 25 52 76 Corporation Commission 1 24 25 1 26 Mine Inspector 1 0 1 0 2 Branch of Government: Executive 41 50 91 57 147 Legislative 45 0 45 3 47 Judicial 114 47 161 28 189 Other Agencies: AHCCCS 1,377 107 1,484 6,372 7,856 Balance of DES** 350 423 772 1,300 2,070 Administration 18 164 182 968 1,150 Lottery 0 81 81 338 419 Transportation 0 360 360 40 400 Compensation Fund 0 0 0 358 358 Environmental Quality 7 65 72 247 320 Public Safety 43 176 219 68 287 Other* 165 261 429 1,127 1,559 Share of Total Constitutional Duties: Public Education 54.4% 29.2% 48.2% 23.6% 33.4% Corrections 11.9 1.8 9.4 0.4 4.0 Disabilities* 8.3 3.5 7.1 11.7 9.9 State Retirement 0.0 0.9 0.2 0.3 0.3 Corporation Commission 0.0 0.9 0.2 0.0 0.1 Mine Inspector 0.0 0.0 0.0 0.0 0.0 Branch of Government: Executive 0.5 1.8 0.8 0.3 0.5 Legislative 0.5 0.0 0.4 0.0 0.2 Judicial 1.3 1.7 1.4 0.2 0.7 Other Agencies: AHCCCS 16.2 3.9 13.3 37.4 27.8 Balance of DES** 4.1 15.6 6.9 7.6 7.3 Administration 0.2 6.0 1.6 5.7 4.1 Lottery 0.0 3.0 0.7 2.0 1.5 Transportation 0.0 13.2 3.2 0.2 1.4 Compensation Fund 0.0 0.0 0.0 2.1 1.3 Environmental Quality 0.1 2.4 0.6 1.4 1.1 Public Safety 0.5 6.5 2.0 0.4 1.0 Other* 1.9 9.6 3.8 6.6 5.5
* Estimated ** The Department of Economic Security, other than programs for disabled; estimated Source: Arizona Joint Legislative Budget Committee, FY 2011 Appropriations Report.
17

INTERPRETATION OF CONSTITUTIONAL DUTIES Section 10 of Article XI is unique in the Arizona Constitution in terms of addressing funding sources and specifying funding levels:
“The revenue for the maintenance of the respective state educational institutions shall be derived from the investment of the proceeds of the sale, and from the rental of such lands as have been set aside by the enabling act approved June 20, 1910, or other legislative enactment of the United States, for the use and benefit of the respective state educational institutions. In addition to such income the legislature shall make such appropriations, to be met by taxation, as shall insure the proper maintenance of all state educational institutions, and shall make such special appropriations as shall provide for their development and improvement.”
The first sentence refers to the sale and lease of state trust land. Focusing on the second sentence, the constitutional requirement that the Arizona Legislature shall provide funding for public education from tax revenue is clear. No distinction is made between elementary, secondary, and higher education. What is less clear is whether existing funding appropriated by the Legislature is adequate to provide for the “proper maintenance” and the “development and improvement” of the public educational system. To help interpret the constitutional requirement, the following words are defined:
• Proper: appropriate to the purpose; normal or regular • Maintain: to keep in due condition or operation; to provide for the upkeep or support of • Develop: to bring to a more advanced or effective state; strengthen • Improve: to bring into a more desirable or excellent condition; to increase in value
None of these terms are absolute; some degree of subjectivity is present. In the context of state spending, “proper” might be interpreted as being close to the national average or the median state. The “development and improvement” clause indicates that the writers of the Constitution intended that “all state educational institutions” be enhanced — that “proper maintenance” is not enough. In contrast, most of the current state government functions are not addressed in the Arizona Constitution. Of those that are specified, funding for these state government duties is not even mentioned. Thus, funding is determined by the Legislature without constitutional guidance except in the case of public education. The January 2009 report Education Funding in Arizona: Constitutional Requirement and the Empirical Record1 provides insight as to whether existing legislative appropriations for public education meet the constitutional requirements. The rest of this paper expands that analysis by examining the history of state government funding by program.
1 Available at http://economist.asu.edu/public-finance.
18

DESCRIPTION OF EXPENDITURE DATA A substantial analysis of government expenditure data was undertaken in order to better understand how well the state government expenditures specified in Table 1 are meeting the requirements of the Arizona Constitution. In addition to looking at recent data, long time series of government expenditures were collected so that changes in spending patterns over time could be examined. Expansions and contractions of program size that have been made over time must be considered when examining time series data. While the focus of this paper is education—due to the Constitution’s explicit language and to education being the largest use of state government revenues—spending for other programs mentioned in the Constitution also are analyzed. Since detailed data on disability programs generally are not available, especially for very many years, broader health and welfare spending is examined instead. Several sets of government expenditure data are available. All data are for fiscal years that run from July 1 through June 30. As noted earlier, the Arizona Joint Legislative Budget Committee (JLBC) produces multiple sets of expenditure data: for the state government general fund, for other state government funds, and for nonappropriated monies from the federal government and other sources. The JLBC figures cannot be directly compared to state government expenditures in other states since each state has a unique set of programs included in its general fund. In addition to data produced by Arizona state government itself, data are available from three separate Census Bureau programs. The Census Bureau datasets use a consistent accounting system for each state. Thus, Arizona data from the Census Bureau are compared to the national average, and in some cases to other states, in this paper. Selected data also were obtained from other sources. In addition to differences in the types of expenditures included (for example, general fund versus all funds), each dataset is prepared based on a unique accounting system. Some types of expenditures, particularly for elementary and secondary (K-12) education, can rationally be accounted for in more than one way. Thus, the expenditure data reported from one dataset to another differs. Generally, capital outlays—for the construction of buildings and for the purchase of land and equipment—are not included in the JLBC data. Since FY 1999, school construction has been included in the general fund in the form of the School Facilities Board. This has been subtracted from the totals such that noncapital expenditure data are consistently analyzed in this report. This puts the JLBC data on a more consistent basis with the Census Bureau data, which separates capital outlays from other types of spending. A very high percentage of the noncapital spending consists of current operations—sometimes called maintenance and operation—which includes the compensation of employees; the purchase of supplies, materials, and contractual services; and in the case of welfare programs, payments to individuals. The primary expenditure other than capital outlays and current operations is for interest payments on debt. The other reasons for the focus on noncapital expenditures are that capital outlays usually are paid for through long-term debt rather than current revenues and largely do not benefit current recipients of state programs. For example, the increase in the number of children in a growing
19

city in the Phoenix area—many of whom recently migrated to Arizona from other states or nations—that necessitates the construction of a new school in no way benefits the children being educated at a school in Yuma. Because of the state’s rapid population growth, Arizona has spent far more than the typical state on capital outlays.
Arizona Joint Legislative Budget Committee The Arizona Joint Legislative Budget Committee is the primary source of Arizona state government expenditure data. One focus in this paper is the Arizona state government general fund, since this is the fund that provides most of the state government’s monies for education and corrections; in addition, the general fund is under the discretion of the Legislature. A time series of general fund appropriations is available from FYs 1979 through 2011 from the JLBC. The FY 2011 data represent the appropriations initially approved by the Legislature. Due to a current year deficit in the general fund, these appropriations are likely to be reduced. Since the general fund is only one of numerous funds maintained by the state government, total appropriations from all funds also are examined. A JLBC time series of expenditures from funds other than the general fund runs from FY 1989 through FY 2011. Most programs also receive nonappropriated monies from other sources, such as the federal government, so total authorized funding also is reviewed. These data have been compiled from annual appropriations reports from FYs 2002 through 2011 and do not necessarily represent the final expenditure figures. A summary of the revenue sources used in the various educational and correctional programs, as well as for agencies administering health and welfare programs, is provided in Table 2 for the current fiscal year. Significant differences exist by program in the relative share of total funding provided by each source. The general fund provides 90 percent of total funding to the community colleges (not including funding directly raised by the community colleges) and to the Department of Corrections, but accounts for less than 25 percent of the total for the university system and for each of the health and welfare agencies. Nearly all of the substantial monies in “other funds” for the universities come from the “university collections” fund, which consists of tuition and fees paid to the universities by students. In contrast, corrections and each of the health and welfare agencies receive relatively small amounts from multiple funds in addition to the general fund. Federal funds account for more than 40 percent of the funding for each of the health and welfare program expenditures, 21 percent of K-12 funding, and 15 percent of total university funding, but less than 2 percent of the correctional funding. Other nonappropriated monies are the largest source of funding for the universities, accounting for 44 percent overall, but provide 10 percent or less of the funding for K-12 education, the community colleges, corrections, AHCCCS, and the Department of Health Services. The JLBC also prepares a separate report of K-12 funding from all sources using a different accounting system. Most importantly, local funding is included and thus total funding is greater than that shown in Table 2. A long times series is not readily available based on this accounting.
20

TABLE 2 SOURCES OF FUNDING FOR SELECTED PROGRAMS IN ARIZONA, FISCAL YEAR 2011
Appropriations Not Appropriated
General
Fund Other Funds Total
Federal Funds Other Total
Total Funding
Dollars in Millions K-12 $3,491.2 $ 55.8 $3,547.0 $1,070.2 $ 442.0 $1,512.2 $5,059.2 Community Colleges 135.3 0.0 135.3 0.0 15.1 15.1 150.4 University System 890.0 715.4 1,605.4 582.7 1,727.8 2,310.5 3,915.9 ASU Total 395.3 395.5 790.8 196.4 736.9 933.3 1,724.1 ASU Tempe 326.3 334.2 660.5 187.4 685.6 873.0 1,533.5 ASU East 25.1 32.8 57.9 3.6 21.8 25.4 83.3 ASU West 43.9 28.5 72.4 5.4 29.5 34.9 107.3 NAU 133.1 78.3 211.4 53.6 179.7 233.3 444.7 UA Total 344.5 241.6 586.1 331.4 803.9 1,135.3 1,721.4 UA Main 271.3 219.3 490.6 234.6 676.7 911.3 1,401.9 UA Medical 73.2 22.3 95.5 96.8 127.2 224.0 319.5 Board of Regents 17.1 0.0 17.1 1.3 7.3 8.6 25.7 Corrections Total 1,005.7 104.6 1,110.3 18.0 45.1 63.1 1,173.4 Corrections 948.7 43.7 992.4 15.4 44.7 60.1 1,052.5 Juvenile Corrections 57.0 60.9 117.9 2.6 0.4 3.0 120.9 AHCCCS 1,376.9 106.8 1,483.7 5,872.1 499.8 6,371.9 7,855.6 Economic Security 634.1 471.0 1,105.1 1,411.8 720.3 2,132.1 3,237.2 Health Services 438.9 83.0 521.9 1,358.0 119.1 1,477.1 1,999.0
Share of Total Funding for Each Program K-12 69.0% 1.1% 70.1% 21.2% 8.7% 29.9% Community Colleges 90.0 0.0 90.0 0.0 10.0 10.0 University System 22.7 18.3 41.0 14.9 44.1 59.0 ASU Total 22.9 22.9 45.9 11.4 42.7 54.1 ASU Tempe 21.3 21.8 43.1 12.2 44.7 56.9 ASU East 30.1 39.4 69.5 4.3 26.2 30.5 ASU West 40.9 26.6 67.5 5.0 27.5 32.5 NAU 29.9 17.6 47.5 12.1 40.4 52.5 UA Total 20.0 14.0 34.0 19.3 46.7 66.0 UA Main 19.4 15.6 35.0 16.7 48.3 65.0 UA Medical 22.9 7.0 29.9 30.3 39.8 70.1 Board of Regents 66.5 0.0 66.5 5.1 28.4 33.5 Corrections Total 85.7 8.9 94.6 1.5 3.8 5.4 Corrections 90.1 4.2 94.3 1.5 4.2 5.7 Juvenile Corrections 47.1 50.4 97.5 2.2 0.3 2.5 AHCCCS 17.5 1.4 18.9 74.8 6.4 81.1 Economic Security 19.6 14.5 34.1 43.6 22.3 65.9 Health Services 22.0 4.2 26.1 67.9 6.0 73.9
Source: Arizona Joint Legislative Budget Committee, FY 2011 Appropriations Report.
21

Census Bureau Data from three separate Census Bureau (CB) programs have been collected. One program reports only state government expenditures, but this includes monies received by state governments from the federal government and from nongovernmental sources. The second program includes all expenditures made by state and local governments, including funds that originated from the federal government and nongovernmental sources. This program also reports state government expenditures separately, but because of a different accounting system, the state government figures from these two programs are substantially different. The third program looks in detail at the finances of public elementary and secondary education, including revenues raised from all sources. The latest data from all of the Census Bureau programs are for FY 2008. State Government Finances Data from the State Government Finances series are available back to FY 1939, though various accounting changes in the early years leave those figures not fully consistent with the later years. Until FY 1951, when higher education was specifically identified, all of education spending was reported together. It was not until FY 1982 that K-12 was separately identified—from FYs 1951 through 1981, K-12 expenditures were combined with relatively small amounts of “other” education spending, which according to the Census Bureau consists of state educational administration and services, tuition grants, fellowships, aid to private schools, and special programs. The main value of the State Government Finances series is to go further back in time than is possible from the other Census Bureau programs or from the JLBC. However, comparisons to the national average that are presented based on these data need to be interpreted cautiously. The level of government levying taxes and fees and having responsibility for funding programs varies from state to state. Over time, within any state, the responsibility for some revenues and expenditures may shift between state and local governments. (Local governments consist of counties, cities and towns, school districts, and special districts—such as those created for fire prevention.) Thus, to make accurate state-by-state comparisons, state government finance data must be combined with local government finance data. State and Local Government Finances The primary source of data on public-sector finances across the United States is the State and Local Government Finances series. Data are available for FYs 1961 through 2008, though data for FYs 2001 and 2003 are limited to national totals. (In the charts presented in this paper, missing data are estimated as the midpoint between the values of the preceding year and the following year.) Every five years (in years ending in ‘2’ and ‘7’), the data come from a census of all governments. In the other years, the Census Bureau collects data from each state government and from a sample of local governments in each state in order to produce estimates of the government finance figures. State government expenditures are separately reported in the State and Local Government Finances series, though noncapital expenditures are not available for FYs 1978 through 1984. Due to different accounting, the state government figures from the two Census Bureau programs are very different.
22

Public Elementary-Secondary Education Finances The Census Bureau provides considerable detail on K-12 education finances in this annual series. Data are available electronically from FYs 1992 through 2008 and were collected for all states. Earlier data also exist. Expenditures for K-12 education are nearly identical to those reported in the State and Local Government Finances series. Compared to the figures in a special JLBC report on K-12 funding that includes local government monies, the figures from the Public Elementary-Secondary Education Finances program are roughly 10 percent higher per year.
Other Expenditure Data Data on K-12 per pupil spending and average teacher salaries were collected from the Statistical Abstract of the United States for Arizona and the U.S. average. Data on spending per pupil are available for most years back to 1920, but the data for the 1920s appears to be inconsistent with later data. Teacher salaries were collected only for years ending in ‘0’ going back to 1900 and for the most recent three years. In recent decades, the source of both types of data has been the National Education Association (NEA).
Comparison of Government Expenditures Across Datasets The noncapital expenditure figures from the Census Bureau’s State Government Finances and State and Local Government Finances programs are compared to those from the JLBC for FY 2008—the latest data from the Census Bureau—in Table 3. The Census Bureau’s State Government Finances program produces expenditure figures that are roughly equal to those of the JLBC’s total spending authority. In FY 2008, the Census Bureau’s noncapital total was 1 percent higher than the JLBC total. Relative to the JLBC, the Census Bureau figures were lower for education (particularly higher education), corrections, and health and welfare but were much higher for all other programs combined. In order to make the JLBC’s “health and welfare” category more comparable to the Census Bureau’s “social services and income maintenance” category, the Department of Environmental Quality and the Arizona Biomedical Research Commission were removed, but definitional differences likely remain in the “health and welfare” and “other” categories. The state government expenditures from State and Local Government Finances are substantially lower than the state government figures reported in the State Government Finances program. Much of the differential is in the K-12 category—all K-12 funding is allocated to local governments in the State and Local Government Finances series—but state government spending amounts are lower in the other categories except health and welfare. The inclusion of local governments produces expenditure figures much higher than those of state government alone, as reported by the JLBC and State Government Finances. For K-12 education, two other funding figures are available. The JLBC’s total including local government was $6,703 million, 12 percent less than the Census Bureau’s state and local government total. At $7,574, the Census Bureau’s total from the Public Elementary-Secondary Education Finances program was slightly less than State and Local Government Finances total.
23

TABLE 3 NONCAPITAL EXPENDITURES IN FISCAL YEAR 2008 IN ARIZONA
Joint Legislative Budget Committee Census Bureau
Dollars in Millions
General Fund
Appro-priations
Total
Appro-priations
Total
Authorized Spending
State
Govern-ment*
State
Govern-ment**
State & Local
Govern-ment
TOTAL $ 9,429 $11,906 $25,655 $25,911 $15,669 $36,060 K-12 Education 3,946 4,000 5,635 5,318 0 7,614 Higher Education
1,264 1,731 3,623 3,009 2,649 3,680
Corrections 964 1,018 1,108 1,013 963 1,608 Health & Welfare 2,564 3,323 10,210 8,387 8,650 10,312 Other 674 1,834 5,079 8,184 3,407 12,846
* State government from State Government Finances ** State government from State and Local Government Finances Sources: Arizona Joint Legislative Budget Committee and U.S. Department of Commerce, Census Bureau.
24

METHODOLOGY FOR ASSESSING GOVERNMENT EXPENDITURES In order to compare the expenditure data discussed in the prior section over time, the figures need to be adjusted for inflation and for changes in the size of the area’s economy or population. To compare Arizona to other states or to the national average, geographical size differences must be considered. One method commonly used to adjust expenditure figures over time or across states is to simply divide the figures by population. Population estimates are available annually as of July 1 from the U.S. Department of Commerce, Census Bureau. When looking over time, these per capita figures also need to be adjusted for inflation. The inflation adjustment typically uses the gross domestic product implicit price deflator (GDP deflator), reported by the U.S. Department of Commerce, Bureau of Economic Analysis (BEA), but some use the Consumer Price Index (CPI) instead. For this analysis, per capita figures were calculated. Since the expenditure data are for the July 1 through June 30 fiscal year, the population estimates at the beginning and end of each fiscal year were averaged. Similarly, the average of the four quarters of the GDP deflator corresponding to the fiscal year was used. A serious shortcoming of the per capita measure is that it does not reflect the growth in a state’s economy and the related increase in the ability of taxpayers to pay for public services. Inflation-adjusted per capita measures of the economy rise over time due to productivity gains. In an increasingly affluent society, inflation-adjusted per capita government tax collections can increase at the pace of real per capita economic growth without the tax burden increasing. Moreover, a growing and changing economy creates additional costs and additional demand for public services, requiring the growth of public revenues and expenditures to exceed the sum of population growth and inflation. For example, schools have expended substantial monies to acquire computer hardware and software to keep pace with technological changes. Such investments would have been impossible if spending increases were limited to inflation and student growth. Another drawback to comparing per capita measures across states (or Arizona to the national average, which is the focus in this paper) is that the cost of living varies by state. Research has shown that a meld of unadjusted and cost-of-living-adjusted data provides the best comparison across states. However, a state-level index of living costs is not regularly produced.
Expenditures Relative to Personal Income The limitations of per capita measures due to not reflecting the geographic variation in living costs or real per capita economic growth can be overcome by adjusting expenditure figures by a measure of the size of the overall economy. Personal income—which is used in various Arizona statutes and constitutional clauses for purposes such as the calculation of the appropriation limitation and the operation of the budget stabilization fund—is most commonly used. Expenditures usually are expressed per $1,000 of personal income. (A figure of $50 per $1,000 of personal income is equivalent to saying that expenditures are 5 percent of personal income.)
25

Personal income by state is produced quarterly and annually by the BEA. The annual average of personal income for the four quarters that align with the state government fiscal year was calculated. However, the quarterly data by state only go back to 1969. Thus, fiscal year expenditure data that span a time series from before 1970 to the current are by necessity compared to calendar year personal income. Arizona expenditures per $1,000 of personal income are presented in two forms in this paper: as a dollar figure and as the dollar figure as a percentage of the national average. The time series pattern of the per capita measure is similar to that of the personal income measure as a percentage of the U.S. average, but the level differs, as seen in Chart 1 for total state and local government expenditures. Therefore, to simplify the analysis in this paper, per capita spending is not addressed in the rest of this paper.
Caseload Measures Changes in personal income over time reflect overall population growth, inflation, and real per capita income growth resulting from productivity gains. However, some government programs serve only a portion of a state’s population, and the caseload of any program varies over time and across states relative to the overall population. Thus, a more meaningful measure of expenditures for such programs can be created by substituting the program’s caseload for the overall population. Operationally, spending is divided by the caseload population (for example, number of students or number of inmates) and by per capita personal income (PCPI).
CHART 1 TOTAL NONCAPITAL EXPENDITURES PER CAPITA AND PER $1,000 OF PERSONAL INCOME AS A PERCENTAGE OF THE NATIONAL AVERAGE, ARIZONA STATE AND LOCAL GOVERNMENTS
Sources: U.S. Department of Commerce, Census Bureau, for population and expenditures (from State and Local Government Finances). U.S. Department of Commerce, Bureau of Economic Analysis for personal income. Calendar year personal income was used for all years.
26

Education The caseload measure for education is the number of students. Relative to the national average, education spending per student is noticeably different than per capita since children and young adults typically have made up a disproportionately large share of Arizona’s population, placing a larger burden on the education system than suggested by the overall population figure. The demand for public education in Arizona also is above average due to the state’s relatively few private schools. Several measures of the number of students are available. For both K-12 and higher education, the measure used in this paper is fall enrollment. Since some students at community colleges and universities go to school part time, full-time-equivalent (FTE) enrollment is a better measure of the higher education caseload. Enrollment counts were collected primarily from the U.S. Department of Education, National Center for Education Statistics (NCES). Fall enrollment by state by year is available for public elementary and secondary education back to 1960. The latest data available are for fall 2007, which is used for FY 2008, the latest year of Census Bureau expenditure data. The NCES figures for Arizona were supplemented by more recent K-12 enrollment figures reported by the Arizona Department of Education in order to provide more up-to-date per pupil spending figures based on JLBC data. Some of the year-to-year volatility in the per pupil spending figures may result from inaccurate enrollment figures rather than spending variations. Public higher education enrollment data are available annually from the NCES from fall 1965 through fall 2007. Unlike the K-12 data, the higher education enrollment data appear to be accurate. The first time that higher education enrollment was split into community college and university categories by the NCES was fall 1982. The time series of full-time-equivalent enrollment at community colleges and at universities begins in fall 1984. The NCES data for Arizona were supplemented with more current enrollment data from the IPEDS system operated by the NCES. The per pupil figures that have been reported by the NEA are based on average daily attendance (ADA) instead of fall enrollment. The JLBC’s report on K-12 funding uses average daily membership (ADM). Generally, ADM is an average of daily enrollment over a number of days, while ADA is based on the actual number of days attended by each student over some period. However, states use varying formulas to calculate ADA and ADM; for example, the time period may be the entire school year or may be a shorter period, such as the first 100 days. Thus, the NEA now states that “fall enrollment has replaced average daily attendance and average daily membership as the preferred measure of student participation” when making interstate comparisons. Corrections and Other Programs The caseload measure for the correctional system is the number of inmates. Calendar-year-end data from the Arizona Department of Corrections back to 1979 (FY 1980) were combined with mid-year counts from the Department of Juvenile Corrections since 1990 (prior to 1990, the two departments were combined). National data on the number of inmates held under the jurisdiction
27

of state governments were obtained from the U.S. Department of Justice, Bureau of Justice Statistics. Caseloads (number of recipients) also were collected for various welfare programs administered by the Arizona Department of Economic Security. Consisting of monthly data, the starting period varies by program, with January 1988 the earliest data available.
28

HISTORY OF GOVERNMENT EXPENDITURES In this section, government expenditures first are examined by category, such as K-12 education, for all of the measures available. At the end of the section, expenditures are compared across categories based on selected measures. Annual data are portrayed in this section, but some additional emphasis is given to the period since FY 1991. That was a recessionary year, similar to FYs 2009 through 2011, and expenditure patterns in some of the time series changed beginning in the early 1990s. Unfortunately, with FY 2008 data the latest from the Census Bureau, the substantial decrease in spending that has occurred since FY 2008 cannot be compared to the national average. Each of three Census Bureau data series is included in this section: state government from State Government Finances, state government from State and Local Government Finances, and combined state and local government expenditures.
Total Expenditures Per $1,000 of personal income, each of three Census Bureau data series indicate that total state/state and local government expenditures climbed from the 1940s into the early 1990s in Arizona, as seen in the top graph of Chart 2. Substantial cyclicality is seen within the upward trend. A closer look at recent years is provided in Chart 3. Calendar year personal income is used in Chart 2, while Chart 3 is based on fiscal year personal income. Between FYs 1991 and 2008, state government expenditures per $1,000 of fiscal year personal income continued to rise, by an average of 0.8 percent per year in both of the Census Bureau series. In contrast, combined state and local government expenditures declined marginally over this period (see Table 4).
TABLE 4 CHANGE IN TOTAL EXPENDITURES PER $1,000 OF PERSONAL INCOME IN ARIZONA
Arizona Joint Legislative
Budget Committee
Census Bureau Fiscal Years
General Fund
All Appropriations
State Government*
State Government**
State and Local Governments
Annual Average Percent Change 1991-2008
-1.09% -0.26% 0.79% 0.81% -0.10%
1991-2011
-1.64 -0.70
Change in the Percentage of the National Average 1991-2008
3.4 0.1 -8.1
* State government from State Government Finances ** State government from State and Local Government Finances Sources: U.S. Department of Commerce, Census Bureau and Arizona Joint Legislative Budget Committee for expenditures. U.S. Department of Commerce, Bureau of Economic Analysis for personal income. Fiscal year personal income was used for all years.
29

CHART 2 TOTAL NONCAPITAL EXPENDITURES PER $1,000 OF PERSONAL INCOME, ARIZONA
AS A PERCENTAGE OF THE NATIONAL AVERAGE
* State government from State Government Finances ** State government from State and Local Government Finances Sources: U.S. Department of Commerce, Census Bureau and Arizona Joint Legislative Budget Committee for expenditures. U.S. Department of Commerce, Bureau of Economic Analysis for personal income. Calendar year personal income was used for all years.
30

CHART 3 TOTAL NONCAPITAL EXPENDITURES PER $1,000 OF PERSONAL INCOME
SINCE FISCAL YEAR 1991, ARIZONA
AS A PERCENTAGE OF THE NATIONAL AVERAGE
* State government from State Government Finances ** State government from State and Local Government Finances Sources: U.S. Department of Commerce, Census Bureau and Arizona Joint Legislative Budget Committee for expenditures. U.S. Department of Commerce, Bureau of Economic Analysis for personal income. Fiscal year personal income was used for all years.
31

For the limited number of years of its availability, the JLBC’s total authorized spending figure (which includes all appropriations and other authorized funding from the federal government and other sources) generally corresponds to the State Government Finances series, showing an increase in spending relative to personal income. In contrast, the JLBC’s appropriations data—for the general fund and for all appropriations (the sum of all funds)—reveal a decline since FY 1991 relative to personal income. The annual average decrease in general fund expenditures per $1,000 of fiscal year personal income between FYs 1991 and 2011—both years of weak economic conditions—has been a substantial 1.6 percent. The decrease in total appropriations has not been as great at 0.7 percent per year. As a percentage of the national average, a very different picture is seen (in the bottom graphs of Charts 2 and 3). Total expenditures per $1,000 of personal income had been far higher in Arizona than the national average during World War II, but fell sharply during the late 1940s. Another significant drop in the percentage of the national average occurred during the late 1960s and early 1970s, putting Arizona’s spending roughly equal to the U.S. average based both on state spending from State Government Finances and state and local spending from State and Local Government Finances. This parity lasted through the early 1990s, when a third period of decline in the percentage ensued, dropping Arizona to below average. However, the percentage rose cyclically from FY 2005 through 2008 back to near 100 percent of the national average. Between FY 1991 and FY 2008, the state government percentage of the national average rose slightly while the state and local government percentage dropped. All of the percentages since FY 2008 likely have dropped.
Elementary and Secondary Education Expenditures Enrollment at public K-12 schools in Arizona has increased substantially in the last several decades, as seen in Chart 4. In addition to being the result of the rapid population growth that has prevailed over nearly all of this period in Arizona, enrollment rose during the 1960s into the early 1970s because of the large number of children born during the baby boom. The flattening in enrollment through the rest of the 1970s into the 1980s resulted from the large decline in the number of births nationally following the baby boom (the baby-bust era). Rapid enrollment growth resumed and lasted until the last few years, when a combination of a long and deep recession that slowed in-migration and lowered birth rates, and legal actions to encourage undocumented immigrants to leave Arizona, produced another flattening. The main emphasis of this subsection is per student spending per $1,000 of per capita personal income, but expenditures per $1,000 of personal income also are shown in Table 5. Between FYs 1991 and 2008, K-12 spending decreased on this basis in all data series except the Census Bureau’s State Government Finances. Relative to the national average, Arizona’s spending dropped between FYs 1991 and 2008, by more based on the state and local government data than the state data only. Extending the appropriations data through FY 2011 makes the annual average percentage decrease more significant. Per student per $1,000 of per capita personal income, the annual average changes shown in Table 5 are similar to those of the per $1,000 of personal income measure. The decrease was much larger based on the NEA data than on the other data.
32

CHART 4 PUBLIC K-12 EDUCATION FALL ENROLLMENT IN ARIZONA
Source: U.S. Department of Education, National Center for Education Statistics (1960-2007) and Arizona Department of Education (2008-09).
TABLE 5 CHANGE IN K-12 EDUCATION EXPENDITURES IN ARIZONA
Arizona Joint Legislative
Budget Committee
Census Bureau
National
Fiscal Years
General
Fund
All Appropriations
State Government*
State and Local Governments
Education Association
Annual Average Percent Change Per $1,000 of Personal Income 1991-2008 -0.39% -0.31% 0.30% -0.69% 1991-2011 -1.09 -1.01 Per Student Per $1,000 of Per Capita Personal Income 1991-2008 -0.32 -0.24 0.37 -0.62 -1.89 1991-2010 -1.23 -1.14 Change in the Percentage of the National Average Per $1,000 of Personal Income 1991-2008 -4.8 -11.5 Per Student Per $1,000 of Per Capita Personal Income 1991-2008 -4.2 -10.6 -24.2
* State government from State Government Finances Sources: U.S. Department of Commerce, Census Bureau and Arizona Joint Legislative Budget Committee for expenditures. U.S. Department of Commerce, Bureau of Economic Analysis for personal income. Fiscal year personal income was used for all years. U.S. Department of Education, National Center for Education Statistics (1960-2007) and Arizona Department of Education (2008-09) for enrollment.
33
Chart 5 displays the annual data from each of the datasets. A closer look at recent years is provided in Chart 6. Calendar year personal income is used in Chart 5, while Chart 6 is based on fiscal year personal income. Based on the rather erratic NEA data, per student spending per $1,000 of per capita personal income in Arizona dropped during World War II, then rose through the 1960s. The Census Bureau’s state and local government data present a similar and less erratic pattern since 1961, though the decrease since the early 1990s is not as large. The JLBC’s “all sources” series, which includes local government contributions to K-12 funding, shows a similar pattern, but with spending lower than reported by the Census Bureau. Spending rose in FY 2010 on this basis, but fell based on the JLBC’s “total authorized spending” (which excludes local government, but includes federal and other nonappropriated funding received by state government). In contrast to the declining pattern since the early 1990s, the Census Bureau’s State Government Finances series demonstrates generally flat spending since the late 1970s, with a bump up in FY 2007. JLBC’s state government appropriations, however, also reveal a decline since the early 1990s. (Total appropriations are barely different from those of the general fund.) Following an increase in FY 2007, appropriations have fallen significantly. As a percentage of the national average (the bottom graphs of Charts 5 and 6), Arizona spending per pupil per $1,000 of per capita personal income has dropped very substantially over the decades. Using the NEA data, from a figure far above the national average in the early 1930s, the percentage dropped to generally the 110-to-120 range from the 1940s through the 1960s. Drops in the late 1960s-early 1970s and in the late 1970s put Arizona’s figure generally a little below the U.S. average. The percentage has fallen very substantially since the early 1990s, to less than 70 percent of the U.S. average. The Census Bureau’s state and local government data as a percentage of the national average are similar, though the decline has not been as great since the mid-1970s, with the percentage around 80 in recent years. Its state government only percentage is higher at near 90. Thus, the evidence is overwhelming that Arizona’s K-12 education spending has dropped since the early 1990s (per $1,000 of personal income and per student per $1,000 of PCPI) and has fallen significantly relative to the national average. This decrease in spending perpetuates the downtrend in the percentage of the national average that began in the 1930s. JLBC Report on K-12 Spending In FY 2010, the K-12 system received $7.0 billion in noncapital funding from all sources, according to the JLBC. The state general fund accounted for half. The Proposition 301 fund contributed a little more than 5 percent, while the permanent fund—revenues from state lands—provided less than 1 percent. Local funding made up more than 31 percent of the total, with federal funding accounting for the other 12 percent. Funding per student in the JLBC report is calculated using average daily membership. General fund spending per student per $1,000 of per capita personal income fluctuated from FYs 2000 through 2009, hitting its peak in FY 2008, at the beginning of the recession. A significant drop in
34

CHART 5 NONCAPITAL K-12 EDUCATION EXPENDITURES PER STUDENT
PER $1,000 OF PER CAPITA PERSONAL INCOME, ARIZONA
AS A PERCENTAGE OF THE NATIONAL AVERAGE
Note: The “JLBC Total Authorized Spending” consists of all appropriations and nonappropriated monies, but excludes local government. The “JLBC All Sources” includes local government funding. * State government from State Government Finances, combining K-12 and “other” education ** State government from State Government Finances, for K-12 only
Sources: U.S. Department of Commerce, Census Bureau and Arizona Joint Legislative Budget Committee for expenditures. U.S. Department of Commerce, Bureau of Economic Analysis for personal income. Calendar year personal income was used for all years. U.S. Department of Education, National Center for Education Statistics (1960-2007) and Arizona Department of Education (2008-09) for enrollment.
35

CHART 6 NONCAPITAL K-12 EDUCATION EXPENDITURES PER STUDENT
PER $1,000 OF PER CAPITA PERSONAL INCOME SINCE FISCAL YEAR 1991, ARIZONA
AS A PERCENTAGE OF THE NATIONAL AVERAGE
Note: The “JLBC Total Authorized Spending” consists of all appropriations and nonappropriated monies, but excludes local government. The “JLBC All Sources” includes local government funding. ** State government from State Government Finances, for K-12 only Sources: U.S. Department of Commerce, Census Bureau and Arizona Joint Legislative Budget Committee for expenditures. U.S. Department of Commerce, Bureau of Economic Analysis for personal income. Fiscal year personal income was used for all years. U.S. Department of Education, National Center for Education Statistics (1960-2007) and Arizona Department of Education (2008-09) for enrollment.
36

37

FY 2010 placed the amount lower than in any of the preceding 10 years (see Chart 7). Total state appropriations per student relative to PCPI increased in FY 2002 due to the passage of Proposition 301, but in FY 2010 were back down to the level preceding FY 2002. In contrast, after being nearly steady from FYs 2002 through 2009, total K-12 funding per student relative to PCPI increased in FY 2010. This largely was due to a temporary increase in federal government support, though local funding also rose. Most of the local funding comes from the property tax; there is a built-in lag between a change in property values and the corresponding change in the amount of tax due. Thus, local government K-12 funding rose considerably in FYs 2009 and 2010 due to the sharp increase in property values a few years earlier. The amount of funding from local governments will fall in coming years due to the big drop in property values that occurred in 2008 and 2009 in Arizona. Federal funding will decline as the stimulus program ends. Thus, added pressure to fund K-12 education will be applied to the general fund at a time when the general fund continues to run a deficit. Census Bureau Public Elementary-Secondary Education Finances Based on the data from the Public Elementary-Secondary Education Finances program, state government in Arizona accounted for nearly half of the total K-12 education revenue in FY 2008. Local government contributed 41 percent, mostly from the property tax, and the federal government accounted for the remaining 11 percent.
CHART 7 TOTAL K-12 EDUCATION EXPENDITURES PER STUDENT
PER $1,000 OF PER CAPITA PERSONAL INCOME, ARIZONA
Source: Arizona Joint Legislative Budget Committee (expenditures), U.S. Department of Commerce, Bureau of Economic Analysis (per capita personal income), and the U.S. Department of Education, National Center for Education Statistics (enrollment).
$50
$75
$100
$125
$150
$175
$200
2000 2001 2002 2003 2004 2005 2006 2007 2008 2009 2010Fiscal Year
General Fund Total Appropriations Local and Federal Total
38

Federal government revenue for K-12 education in Arizona was near the national average in FY 2008: a little below average per student but above average per student per $1,000 of PCPI (see Table 6). Federal funding to Arizona rose slightly per student per $1,000 of PCPI between FYs 1992 and 2008, but it declined relative to other states. State government revenue for K-12 education was considerably below the U.S. average in FY 2008 in Arizona, by 16 percent per student per $1,000 of PCPI. Though state funding rose marginally per student per $1,000 of PCPI between FYs 1992 and 2008, it declined relative to other states. Thus, state government funding for K-12 education already was below the U.S. average in FY 1992, but fell further after that. Local government revenue for K-12 education also was considerably below average in FY 2008 in Arizona, by 22 percent per student per $1,000 of PCPI. Funding fell substantially per student per $1,000 of PCPI between FYs 1992 and 2008, and dropped considerably relative to other states. The expenditure data that matches up to the revenue data just discussed is for total expenditures, including capital outlays and interest charges on long-term borrowing to build schools. Per $1,000 of personal income, each was above the national average in FY 2008 in Arizona because the state’s rapid population growth creates a need for new schools. Capital outlays and interest charges had been much further above average in FY 1992.
TABLE 6 REVENUE FOR K-12 EDUCATION IN ARIZONA
Fiscal Year 2008 Change Between Fiscal Years
1992 and 2008 $ Rank Ratio $ Rank Ratio
Per Student TOTAL $8,445 48 72% 24% -13 -16 Federal 909 27 95 45 -18 -30 State 4,099 45 72 42 -3 -6 Local 3,437 36 67 4 -8 -25 Property Tax 2,800 26 85 8 -6 -23 Per Student Per $1,000 of Per Capita Personal Income TOTAL 243.81 46 83 -12 -25 -18 Federal 26.26 20 111 4 -8 -34 State 118.33 38 84 1 -3 -7 Local 99.23 35 78 -26 -11 -29 Property Tax 80.84 24 99 -23 -7 -27
Notes: The rank is among the 50 states and the District of Columbia, with a rank of 1 indicating the highest revenue. A negative change in rank indicates that the rank was higher (closer to 1) in 1992 than in 2008. The ratio is the percentage of the national average. Source: U. S. Department of Commerce, Census Bureau, Public Elementary-Secondary Education Finance, 1992 through 2008. Enrollment from the U.S. Department of Education, National Center for Education Statistics.
39
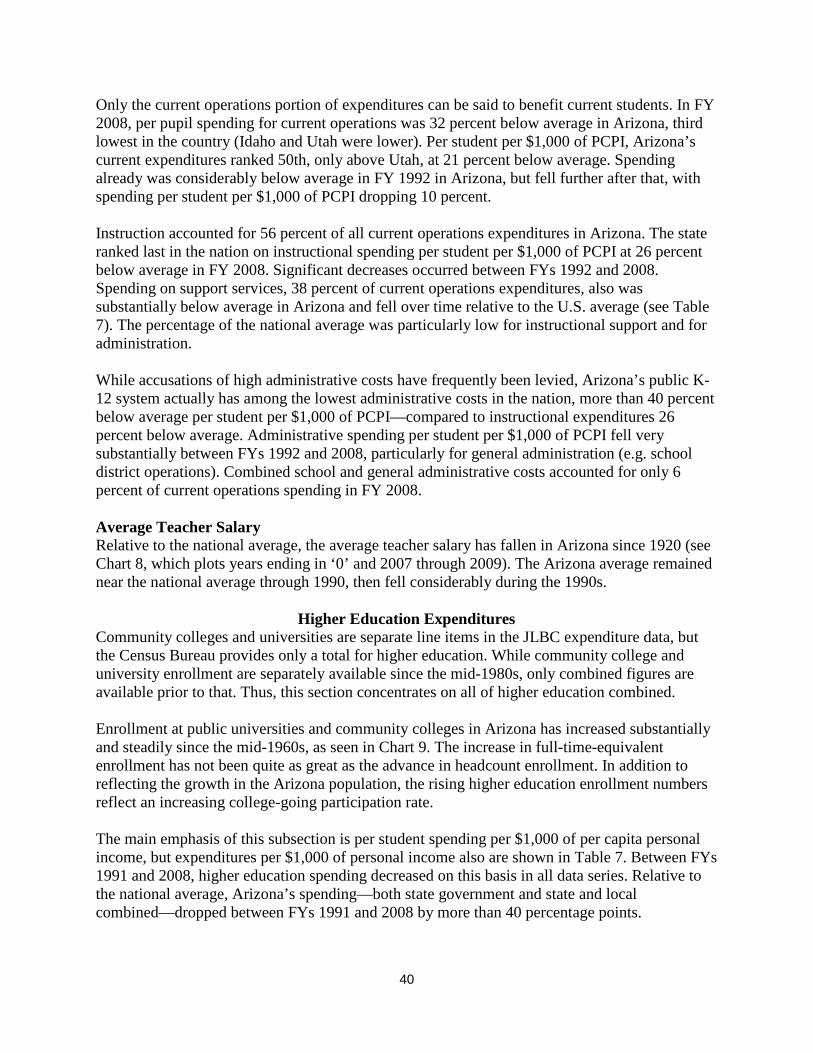
Only the current operations portion of expenditures can be said to benefit current students. In FY 2008, per pupil spending for current operations was 32 percent below average in Arizona, third lowest in the country (Idaho and Utah were lower). Per student per $1,000 of PCPI, Arizona’s current expenditures ranked 50th, only above Utah, at 21 percent below average. Spending already was considerably below average in FY 1992 in Arizona, but fell further after that, with spending per student per $1,000 of PCPI dropping 10 percent. Instruction accounted for 56 percent of all current operations expenditures in Arizona. The state ranked last in the nation on instructional spending per student per $1,000 of PCPI at 26 percent below average in FY 2008. Significant decreases occurred between FYs 1992 and 2008. Spending on support services, 38 percent of current operations expenditures, also was substantially below average in Arizona and fell over time relative to the U.S. average (see Table 7). The percentage of the national average was particularly low for instructional support and for administration. While accusations of high administrative costs have frequently been levied, Arizona’s public K-12 system actually has among the lowest administrative costs in the nation, more than 40 percent below average per student per $1,000 of PCPI—compared to instructional expenditures 26 percent below average. Administrative spending per student per $1,000 of PCPI fell very substantially between FYs 1992 and 2008, particularly for general administration (e.g. school district operations). Combined school and general administrative costs accounted for only 6 percent of current operations spending in FY 2008. Average Teacher Salary Relative to the national average, the average teacher salary has fallen in Arizona since 1920 (see Chart 8, which plots years ending in ‘0’ and 2007 through 2009). The Arizona average remained near the national average through 1990, then fell considerably during the 1990s.
Higher Education Expenditures Community colleges and universities are separate line items in the JLBC expenditure data, but the Census Bureau provides only a total for higher education. While community college and university enrollment are separately available since the mid-1980s, only combined figures are available prior to that. Thus, this section concentrates on all of higher education combined. Enrollment at public universities and community colleges in Arizona has increased substantially and steadily since the mid-1960s, as seen in Chart 9. The increase in full-time-equivalent enrollment has not been quite as great as the advance in headcount enrollment. In addition to reflecting the growth in the Arizona population, the rising higher education enrollment numbers reflect an increasing college-going participation rate. The main emphasis of this subsection is per student spending per $1,000 of per capita personal income, but expenditures per $1,000 of personal income also are shown in Table 7. Between FYs 1991 and 2008, higher education spending decreased on this basis in all data series. Relative to the national average, Arizona’s spending—both state government and state and local combined—dropped between FYs 1991 and 2008 by more than 40 percentage points.
40

TABLE 7 K-12 EDUCATION EXPENDITURES IN ARIZONA
Fiscal Year 2008 Change Between Fiscal Years
1992 and 2008 $ Rank Ratio $ Rank Ratio
Per Student TOTAL $8,808 47 73% 23% -14 -17 CAPITAL OUTLAYS 1,445 18 104 13 -15 -84 INTEREST ON DEBT 400 10 111 12 -7 -112 CURRENT OPERATIONS 6,963 49 68 26 -6 -10 Instruction 3,909 50 63 21 -6 -13 Support Services 2,647 47 74 34 -11 -9 Pupil Support 484 28 89 115 8 15 Instructional Staff Support 220 49 44 14 -12 -26 General Administration 95 47 51 -57 -31 -69 School Administration 343 50 62 13 -10 -18 Operations & Maintenance 830 39 84 30 -9 -6 Other 408 45 77 31 -5 5 Per Student Per $1,000 of Per Capita Personal Income TOTAL 254.28 45 85 -12 -28 -20 CAPITAL OUTLAYS 41.71 12 121 -20 -10 -97 INTEREST ON DEBT 11.55 8 129 -20 -6 -130 CURRENT OPERATIONS 201.01 50 79 -10 -9 -12 Instruction 112.84 51 74 -13 -8 -15 Support Services 76.40 41 86 -5 -12 -10 Pupil Support 13.96 23 103 54 8 18 Instructional Staff Support 6.35 49 51 -18 -13 -30 General Administration 2.75 44 59 -69 -34 -80 School Administration 9.91 50 72 -20 -12 -21 Operations & Maintenance 23.96 30 98 -8 -11 -7 Other 11.77 34 90 -7 2 6
Notes: The rank is among the 50 states and the District of Columbia, with a rank of 1 indicating the highest expenditure. A negative change in rank indicates that the rank was higher (closer to 1) in 1992 than in 2008. The ratio is the percentage of the national average. Source: U. S. Department of Commerce, Census Bureau, Public Elementary-Secondary Education Finance, 1992 through 2008. Enrollment from the U.S. Department of Education, National Center for Education Statistics.
41
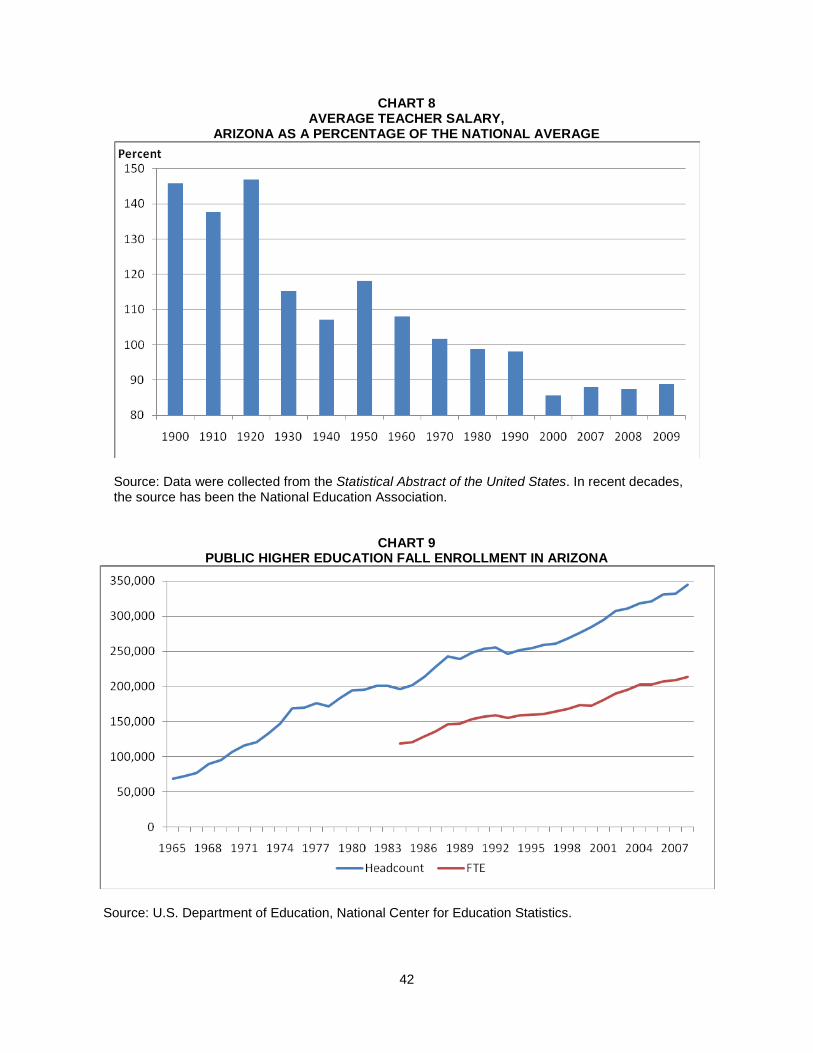
CHART 8 AVERAGE TEACHER SALARY,
ARIZONA AS A PERCENTAGE OF THE NATIONAL AVERAGE
Source: Data were collected from the Statistical Abstract of the United States. In recent decades, the source has been the National Education Association.
CHART 9 PUBLIC HIGHER EDUCATION FALL ENROLLMENT IN ARIZONA
Source: U.S. Department of Education, National Center for Education Statistics.
42

Per student per $1,000 of per capita personal income, the annual average changes shown in Table 8 are not nearly as negative as based on the per $1,000 of personal income measure. However, the decrease in general fund appropriations is quite large and each of the Census Bureau series declined as a percentage of the national average. Chart 10 displays the annual data from each of the datasets on a per student per $1,000 of per capita personal income basis back to FY 1966. The equivalent data for full-time-equivalent students back to FY 1985 are provided in Chart 11. Calendar year personal income is used in Chart 10, while Chart 11 is based on fiscal year personal income. Per student spending per $1,000 of per capita personal income in Arizona dropped substantially during the late 1960s and early 1970s for both state government and state and local government combined. Since then, a slight downward trend in the Census Bureau’s data was temporarily offset by a cyclical increase in FYs 2007 and 2008. In contrast, state appropriations reported by the JLBC have gradually decreased since at least FY 1979. Based on each of the Census Bureau series, higher education expenditures per student per $1,000 of per capita personal income have been less than the national average since at least FY 1966.
TABLE 8 CHANGE IN HIGHER EDUCATION EXPENDITURES IN ARIZONA
Arizona Joint Legislative
Budget Committee
Census Bureau
Fiscal Years
General
Fund
All Appropriations
State Government*
State Government**
State and Local Governments
Annual Average Percent Change Per $1,000 of Personal Income 1991-2008 -2.97% -1.15% -1.51% -1.77% -1.47% 1991-2011 -2.89 -0.52 Per Student Per $1,000 of Per Capita Personal Income 1991-2008 -1.52 0.32 -0.04 -0.30 0.00 1991-2009 -3.68 -1.10 Per Full-Time-Equivalent Student Per $1,000 of Per Capita Personal Income 1991-2008 -1.63 0.21 -0.15 -0.41 -0.12 1991-2009 -2.90 -0.53 Change in the Percentage of the National Average Per $1,000 of Personal Income 1991-2008 -61.1 -45.0 -43.3 Per Student Per $1,000 of Per Capita Personal Income 1991-2008 -21.9 -10.4 -6.3 Per Full-Time-Equivalent Student Per $1,000 of Per Capita Personal Income 1991-2008 -25.3 -13.6 -9.8
* State government from State Government Finances ** State government from State and Local Government Finances Sources: U.S. Department of Commerce, Census Bureau and Arizona Joint Legislative Budget Committee for expenditures. U.S. Department of Commerce, Bureau of Economic Analysis for personal income. Fiscal year personal income was used for all years.
43

CHART 10 NONCAPITAL HIGHER EDUCATION EXPENDITURES PER STUDENT
PER $1,000 OF PER CAPITA PERSONAL INCOME, ARIZONA
AS A PERCENTAGE OF THE NATIONAL AVERAGE
* State government from State Government Finances ** State government from State and Local Government Finances Sources: U.S. Department of Commerce, Census Bureau and Arizona Joint Legislative Budget Committee for expenditures. U.S. Department of Commerce, Bureau of Economic Analysis for personal income. Calendar year personal income was used for all years. U.S. Department of Education, National Center for Education Statistics for enrollment.
65
70
75
80
85
90
95
100
105
1966 1969 1972 1975 1978 1981 1984 1987 1990 1993 1996 1999 2002 2005 2008Fiscal Year
Percent
CB State Government* CB State Government** CB State & Local
44

CHART 11 NONCAPITAL HIGHER EDUCATION EXPENDITURES PER FULL-TIME-EQUIVALENT STUDENT
PER $1,000 OF PER CAPITA PERSONAL INCOME, ARIZONA
AS A PERCENTAGE OF THE NATIONAL AVERAGE
* State government from State Government Finances ** State government from State and Local Government Finances Sources: U.S. Department of Commerce, Census Bureau and Arizona Joint Legislative Budget Committee for expenditures. U.S. Department of Commerce, Bureau of Economic Analysis for personal income. Calendar year personal income was used for all years. U.S. Department of Education, National Center for Education Statistics for enrollment.
$100$150$200$250$300$350$400$450$500$550$600
1985 1987 1989 1991 1993 1995 1997 1999 2001 2003 2005 2007 2009Fiscal Year
JLBC General Fund JLBC Total AppropriationsJLBC Total Authorized Spending CB State Government*CB State Government** CB State & Local
70
75
80
85
90
95
100
105
110
115
1985 1987 1989 1991 1993 1995 1997 1999 2001 2003 2005 2007Fiscal Year
Percent
CB State Government* CB State Government** CB State & Local
45
The state government percentage of the national average has fallen substantially since FY 1990, while the drop has not been as great on a state and local government basis. In FY 2008, Arizona’s figure ranged from 10 percent below the national average for state and local government to approximately 25 percent below average for state government. The historical pattern is similar based on FTE enrollment, with each data series showing a downward trend, interrupted especially in the Census Bureau data by the cyclical increase in FYs 2007 and 2008. The cyclical increase in appropriations was offset in FY 2009, with further decreases likely in succeeding years. As a percentage of the national average, the spending figure per FTE enrollment is not as low as per headcount enrollment, but the FTE figure experienced more decline during the late 1980s and early 1990s. Based on general fund appropriations, Arizona’s support for higher education has been falling relative to enrollment growth and economic gains for more than two decades. In contrast, total state and local funding has been steady over the past 20 years. Despite this, state and local government funding per FTE student per $1,000 of PCPI in Arizona has declined and has been below average since the late 1990s, except in FY 2008.
Corrections The number of inmates housed by the Arizona Departments of Corrections and Juvenile Corrections has increased substantially over the last three decades. The percentage increase is far greater than the increase in Arizona’s population. The number of inmates per 1,000 state residents has risen in nearly every year since 1980, climbing from 1.3 to 6.2. The much greater increase in the correctional population than in the general population results in large part from Arizona’s mandatory sentencing law that was adopted in 1979 and from a subsequent law passed in 1993 that required all inmates to serve at least 85 percent of their sentenced time. Mandatory sentencing also was popular in other states, driving the national number of inmates held under state government authority per 1,000 residents up considerably as well. However, starting from the same level in the early 1980s, the Arizona increase has exceeded that of the nation (see Chart 12). At the same time that the number of inmates was rapidly increasing, state government’s noncapital expenditures per inmate per $1,000 of per capita personal income were dropping substantially (see the top graph of Chart 13). Only since FY 2005 have the expenditures leveled off. However, the state and local government expenditure figure has not dropped since FY 1996. Nationally, expenditures per inmate per $1,000 of per capita personal income also have dropped, but the decrease has not been as substantial as in Arizona. Thus, Arizona’s figure has gone from well above average in the early 1980s to considerably below average (see the bottom graph of Chart 13). As a result of the divergent trends in the number of inmates and in spending per inmate, state government correctional spending per $1,000 of personal income in Arizona has fluctuated but
46

CHART 12 NUMBER OF INMATES HELD UNDER STATE GOVERNMENT AUTHORITY PER 1,000 RESIDENTS
Source: Arizona Departments of Corrections and Juvenile Corrections and U.S. Department of Justice, Bureau of Justice Statistics.
not experienced a trend since the early 1990s. As seen in Table 9, the annual average percent change since FY 1991 have been small. However, this relative stability followed very substantial increases during the 1970s and 1980s as seen in the top graph of Chart 14. The Census Bureau’s state and local government series did not list corrections separately until FY 1979 and did not separate capital outlays from other correctional expenditures until FY 1993. Since then, the state and local government spending figure has trended up. As a percentage of the national average, correctional spending per $1,000 of personal income in Arizona through the early 1970s fluctuated widely from above to below average. During the late 1970s and 1980s, spending in Arizona soared relative to the national average, but has dropped back since the early 1990s, as seen in the bottom graph of Chart 14. Still, state and local government spending in FY 2008 was nearly 30 percent above the national average.
Other Expenditures Excluding education and corrections, state government expenditures per $1,000 of personal income was steady from the 1950s into the 1980s, but has increased since then, as seen in the top graph of Chart 15. A closer look at recent years is provided in Chart 16. Calendar year personal income is used in Chart 15, while Chart 16 is based on fiscal year personal income.
47
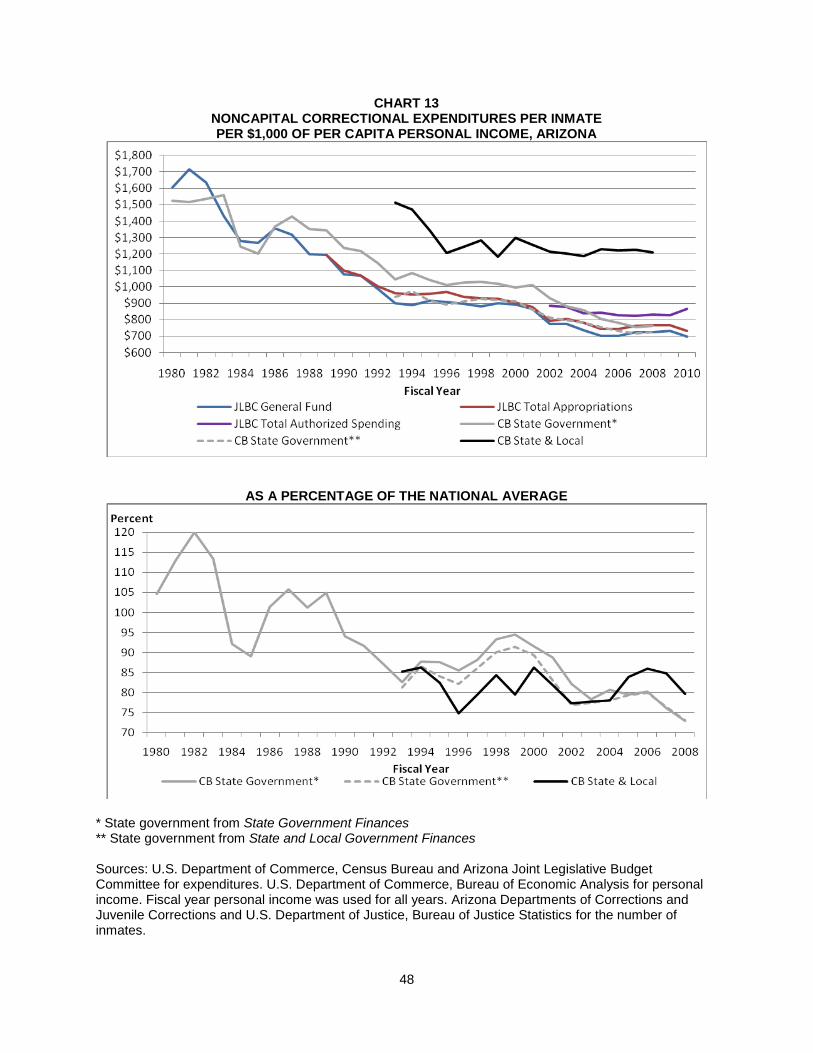
CHART 13 NONCAPITAL CORRECTIONAL EXPENDITURES PER INMATE PER $1,000 OF PER CAPITA PERSONAL INCOME, ARIZONA
AS A PERCENTAGE OF THE NATIONAL AVERAGE
* State government from State Government Finances ** State government from State and Local Government Finances Sources: U.S. Department of Commerce, Census Bureau and Arizona Joint Legislative Budget Committee for expenditures. U.S. Department of Commerce, Bureau of Economic Analysis for personal income. Fiscal year personal income was used for all years. Arizona Departments of Corrections and Juvenile Corrections and U.S. Department of Justice, Bureau of Justice Statistics for the number of inmates.
48

TABLE 9 CHANGE IN CORRECTIONAL EXPENDITURES IN ARIZONA
Arizona Joint Legislative
Budget Committee
Census Bureau
Fiscal Years
General Fund
All Appropriations
State Government*
State Government**
State and Local Governments
Annual Average Percent Change Per $1,000 of Personal Income 1991-2008 0.05% 0.38% -0.44% 1991-2011 0.11 0.34 1993-2008 0.74 0.65 0.06 0.47 0.70 Per Inmate Per $1,000 of Per Capita Personal Income 1991-2008 -2.25 -1.94 -2.73 1991-2010 -2.22 -1.97 1993-2008 -1.44 -1.52 -2.10 -1.71 -1.48 Change in the Percentage of the National Average Per $1,000 of Personal Income 1991-2008 -29.6 1993-2008 -13.4 -10.9 -6.7
* State government from State Government Finances ** State government from State and Local Government Finances Sources: U.S. Department of Commerce, Census Bureau and Arizona Joint Legislative Budget Committee for expenditures. U.S. Department of Commerce, Bureau of Economic Analysis for personal income. Fiscal year personal income was used for all years. Arizona Departments of Corrections and Juvenile Corrections for the number of inmates. Though total state government spending as reported by the Census Bureau for these other functions increased per $1,000 of personal income in Arizona between FYs 1991 and 2008, there was no change in total appropriations and a decrease in general fund appropriations reported by the JLBC (see Table 10). Including the reductions in spending since FY 2008, an even larger annual average decrease has occurred in general fund appropriations while annual average total appropriations also have fallen. As a percentage of the national average, state government expenditures reported by the Census Bureau per $1,000 of personal income for programs other than education and corrections fell sharply during the late 1960s from well above to below average. The percentage climbed during the 1980s to near the national average, going above the national average during the cyclical peak in FYs 2007 and 2008. Total state and local government spending per $1,000 of personal income has averaged about 10 percent below the U.S. average since the early 1990s.
Health and Welfare Programs Services for disabled people are provided through various programs administered by several state agencies. More generally, three agencies provide most of the state’s health and welfare services: AHCCCS, the Department of Economic Security (DES), and the Department of Health Services (DHS). The disability programs received roughly 29 percent of the general fund
49

CHART 14 NONCAPITAL CORRECTIONAL EXPENDITURES PER $1,000 OF PERSONAL INCOME, ARIZONA
AS A PERCENTAGE OF THE NATIONAL AVERAGE
* State government from State Government Finances ** State government from State and Local Government Finances Sources: U.S. Department of Commerce, Census Bureau and Arizona Joint Legislative Budget Committee for expenditures. U.S. Department of Commerce, Bureau of Economic Analysis for personal income. Calendar year personal income was used for all years.
50

CHART 15 OTHER NONCAPITAL EXPENDITURES PER $1,000 OF PERSONAL INCOME, ARIZONA
AS A PERCENTAGE OF THE NATIONAL AVERAGE
* State government from State Government Finances ** State government from State and Local Government Finances Sources: U.S. Department of Commerce, Census Bureau and Arizona Joint Legislative Budget Committee for expenditures. U.S. Department of Commerce, Bureau of Economic Analysis for personal income. Calendar year personal income was used for all years.
51

CHART 16 OTHER NONCAPITAL EXPENDITURES PER $1,000 OF PERSONAL INCOME
SINCE FISCAL YEAR 1991, ARIZONA
AS A PERCENTAGE OF THE NATIONAL AVERAGE
* State government from State Government Finances ** State government from State and Local Government Finances Sources: U.S. Department of Commerce, Census Bureau and Arizona Joint Legislative Budget Committee for expenditures. U.S. Department of Commerce, Bureau of Economic Analysis for personal income. Fiscal year personal income was used for all years.
52

53

TABLE 10 CHANGE IN OTHER EXPENDITURES PER $1,000 OF PERSONAL INCOME IN ARIZONA
Arizona Joint Legislative
Budget Committee
Census Bureau Fiscal Years
General Fund
All Appropriations
State Government*
State Government**
State and Local Governments
Annual Average Percent Change 1991-2008
-1.32% 0.00% 1.59%
1991-2011
-1.86 -0.51
1993-2008
-1.78 -0.50 0.21 0.35 -0.04
Change in the Percentage of the National Average 1991-2008
17.1
1993-2008
3.0 0.7 -2.5
* State government from State Government Finances ** State government from State and Local Government Finances Sources: U.S. Department of Commerce, Census Bureau and Arizona Joint Legislative Budget Committee for expenditures. U.S. Department of Commerce, Bureau of Economic Analysis for personal income. Fiscal year personal income was used for all years. appropriations for these three agencies in FY 2011. The shares of other funding sources were lower, such that disability programs received approximately 21 percent of the total authorized spending of the three agencies. Each of the three agencies receive the bulk of their funding from sources other than state government appropriations, with most of the nonappropriated funds coming from the federal government. The funding history per $1,000 of personal income is shown in the three graphs of Chart 17. AHCCCS is the largest of the three agencies, though it does not receive substantially more in state appropriations than DES. AHCCCS began in FY 1983 and gradually ramped up through the 1980s. State appropriations per $1,000 of personal income since FY 1991 have varied, but shown no trend. In contrast, total authorized funding has increased significantly over the last several years. Total appropriations for DES fluctuated between $4 and $6 per $1,000 of personal income between FYs 1979 and 1996, but general fund appropriations have dropped since then to about $3. Total appropriations have remained in the historical range, while total authorized funding has increased in the last few years. Appropriations per $1,000 of personal income for DHS have fluctuated without a trend, though they have fallen since FY 2008. In contrast, total authorized funding has increased substantially during the last several years.
54

CHART 17 EXPENDITURES PER $1,000 OF PERSONAL INCOME
FOR MAJOR HEALTH AND WELFARE AGENCIES IN ARIZONA
ARIZONA HEALTH CARE COST CONTAINMENT SYSTEM (AHCCCS)
DEPARTMENT OF ECONOMIC SECURITY
55
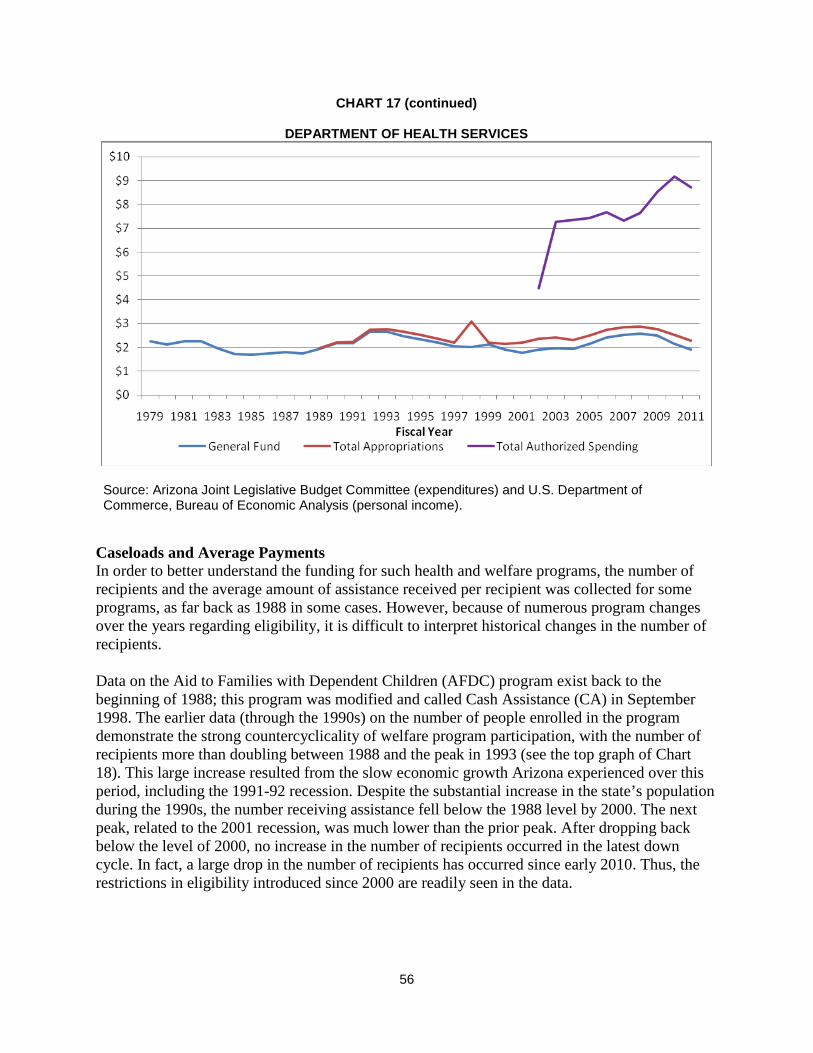
CHART 17 (continued)
DEPARTMENT OF HEALTH SERVICES
Source: Arizona Joint Legislative Budget Committee (expenditures) and U.S. Department of Commerce, Bureau of Economic Analysis (personal income).
Caseloads and Average Payments In order to better understand the funding for such health and welfare programs, the number of recipients and the average amount of assistance received per recipient was collected for some programs, as far back as 1988 in some cases. However, because of numerous program changes over the years regarding eligibility, it is difficult to interpret historical changes in the number of recipients. Data on the Aid to Families with Dependent Children (AFDC) program exist back to the beginning of 1988; this program was modified and called Cash Assistance (CA) in September 1998. The earlier data (through the 1990s) on the number of people enrolled in the program demonstrate the strong countercyclicality of welfare program participation, with the number of recipients more than doubling between 1988 and the peak in 1993 (see the top graph of Chart 18). This large increase resulted from the slow economic growth Arizona experienced over this period, including the 1991-92 recession. Despite the substantial increase in the state’s population during the 1990s, the number receiving assistance fell below the 1988 level by 2000. The next peak, related to the 2001 recession, was much lower than the prior peak. After dropping back below the level of 2000, no increase in the number of recipients occurred in the latest down cycle. In fact, a large drop in the number of recipients has occurred since early 2010. Thus, the restrictions in eligibility introduced since 2000 are readily seen in the data.
56
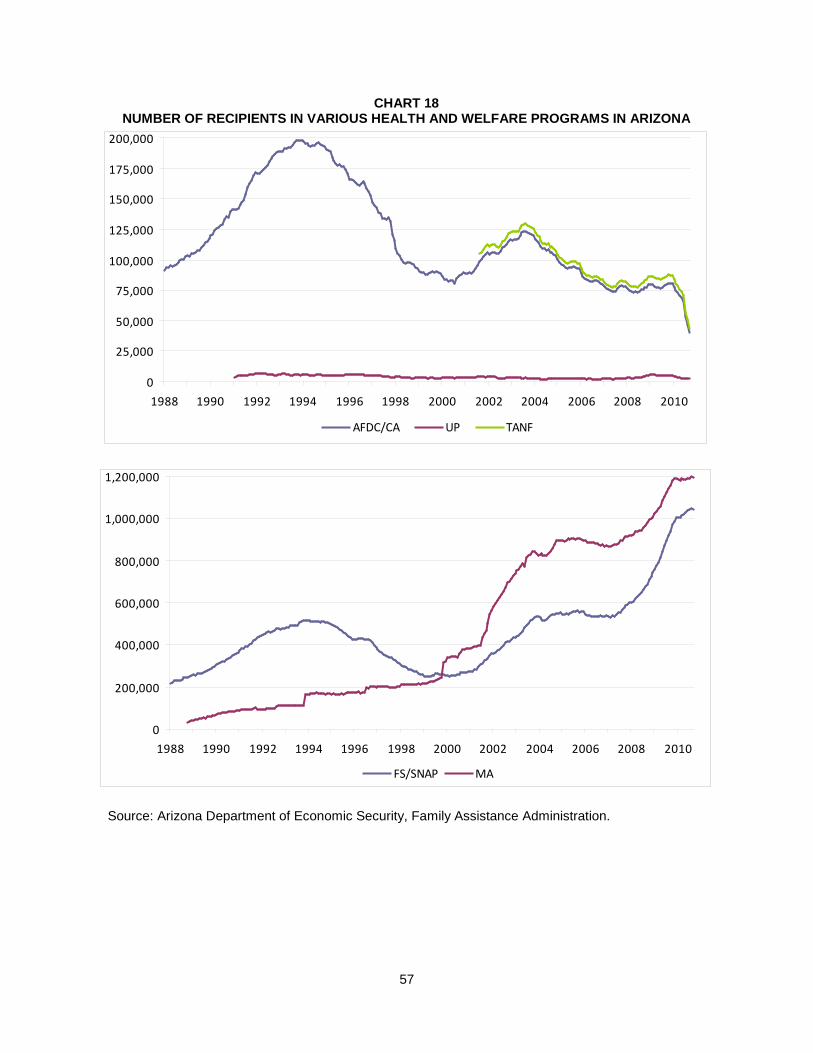
CHART 18 NUMBER OF RECIPIENTS IN VARIOUS HEALTH AND WELFARE PROGRAMS IN ARIZONA
Source: Arizona Department of Economic Security, Family Assistance Administration.
0
25,000
50,000
75,000
100,000
125,000
150,000
175,000
200,000
1988 1990 1992 1994 1996 1998 2000 2002 2004 2006 2008 2010
AFDC/CA UP TANF
0
200,000
400,000
600,000
800,000
1,000,000
1,200,000
1988 1990 1992 1994 1996 1998 2000 2002 2004 2006 2008 2010
FS/SNAP MA
57

The average AFDC/CA payment adjusted for inflation gradually declined from 1988 through 2008, except for a jump in 1991 and a smaller rise in 2003. However, a sharp decrease occurred in March 2009. Data for the unemployed parent (UP) program associated with AFDC/CA begins in 1991. The number of UP recipients is much lower than the number in the other programs. The UP pattern—for both the number of recipients and the average payment—has been very much like that of AFDC/CA with one major exception. The number of UP recipients rose sharply in 2008 in response to the onset of the latest recession, but has dropped equally sharply in 2010, again reflecting changes in program eligibility. The temporary assistance to needy families (TANF) data begin in 2001. Its number of recipients is a little more than in the CA program; its pattern has been nearly identical to that of the cash assistance program, with the number enrolled dropping sharply since December 2009. Similarly, a big decrease in the average payment occurred in March 2009. The food stamp (FS) program (now the Supplemental Nutrition Assistance Program—SNAP) also displayed the typical countercyclicality through the early 2000s. However, no drop off in the number of recipients occurred when the economy improved in the mid-2000s. Once the last recession began, the number of recipients soared. Average real payments remained nearly constant throughout the 1988-to-early 2009 period, then a sizable increase occurred in April 2009. The number enrolled in the Medical Assistance (MA) program goes back to 1988, but no data are available on the average value of services received. Instead of the typical countercyclical pattern, the number of recipients gradually rose from 1988 into 1999, then rose much more substantially for the next several years. After a pause in the increase in number during the mid-2000s, the number again increased from 2007 until late 2009. The number enrolled has been steady since then. Total Health and Welfare The JLBC sums the three major health and welfare agencies together, along with several much smaller agencies such as the Department of Veterans Services, to create an overall health and welfare category. The Census Bureau has a similar category called social services and income maintenance. Based on state government data, health and welfare expenditures per $1,000 of personal income did not change much during the 1950s, but began to rise in the 1960s, with large increases occurring since the late 1960s, both nationally and in Arizona (see Chart 19). Until FY 2007, Arizona’s expenditure figure was less than the U.S. average. Looking at the period since FY 1979 over several datasets, health and welfare appropriations have not trended up since the early 1990s, but total state spending and state and local government spending combined continue to rise per $1,000 of personal income (see Chart 20). Arizona’s expenditures as a percentage of the national average began to rise in FY 1983 with the
58

CHART 19 HEALTH AND WELFARE EXPENDITURES PER $1,000 OF PERSONAL INCOME,
STATE GOVERNMENT
Sources: U.S. Department of Commerce, Census Bureau, State Government Finances, and U.S. Department of Commerce, Bureau of Economic Analysis for personal income. Calendar year personal income was used for all years.
start of AHCCCS. Though state government spending per $1,000 of personal income has passed the national average, the combined state and local government figure remains below average. The comparison to the national average is affected by two key factors. First, program eligibility and benefits differ in Arizona than in other states. Second, demand for public health and welfare services is closely related to socioeconomic status. Since household incomes in Arizona are considerably below the national average and higher poverty rates prevail in Arizona, demand for these public services is higher than average in Arizona.
Comparisons of Spending by Program Generally speaking, the most telling measure of funding for particular programs is to include all funding from all sources. The JLBC provides one such measure, but only a limited time series is available. The Census Bureau provides a more comprehensive measure back to FY 1961, but data for FY 2008 are the latest. The substantial decreases in appropriations that have resulted from the state’s fiscal deficit have occurred since FY 2008. The amount of state government appropriations is the other measure of funding that is of interest. Appropriations reflect the willingness of the Legislature to commit funds raised by the state, largely through taxation, for the various programs.
59
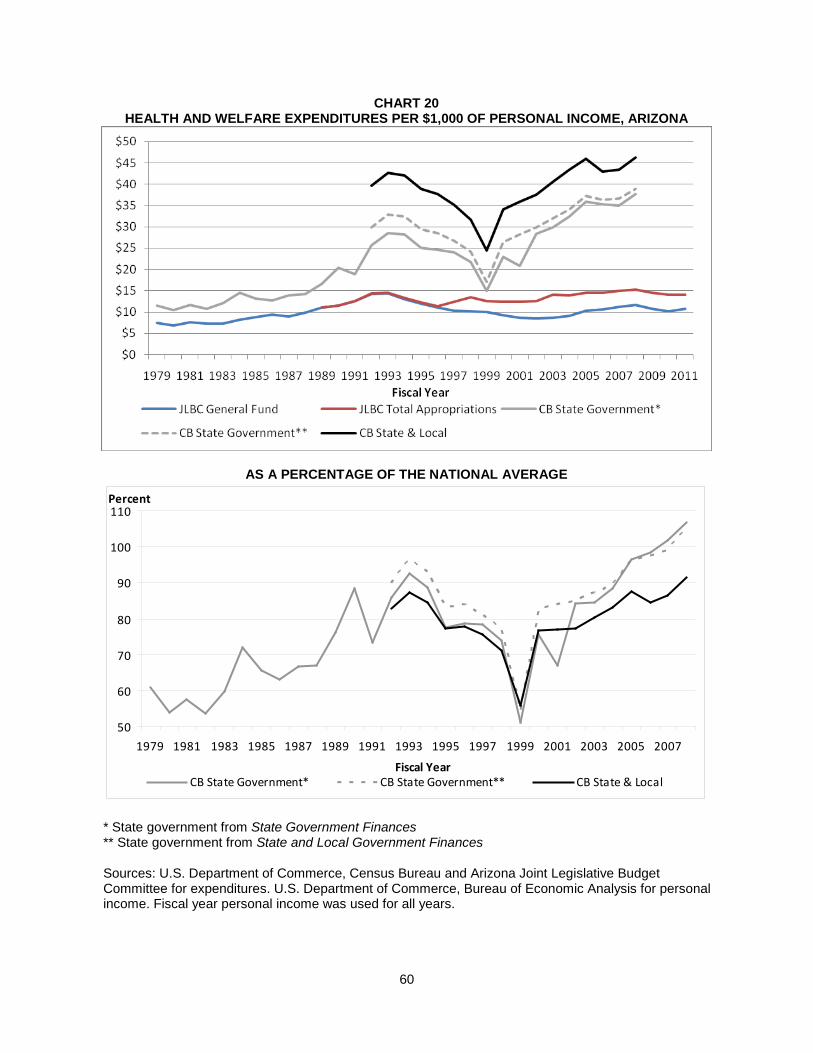
CHART 20 HEALTH AND WELFARE EXPENDITURES PER $1,000 OF PERSONAL INCOME, ARIZONA
AS A PERCENTAGE OF THE NATIONAL AVERAGE
* State government from State Government Finances ** State government from State and Local Government Finances Sources: U.S. Department of Commerce, Census Bureau and Arizona Joint Legislative Budget Committee for expenditures. U.S. Department of Commerce, Bureau of Economic Analysis for personal income. Fiscal year personal income was used for all years.
50
60
70
80
90
100
110
1979 1981 1983 1985 1987 1989 1991 1993 1995 1997 1999 2001 2003 2005 2007
Fiscal Year
Percent
CB State Government* CB State Government** CB State & Local
60

State and Local Government Noncapital Expenditures Per $1,000 of personal income, total state and local government noncapital expenditures rose during the 1960s, 1970s and 1980s, but have fallen since the early 1990s, after adjusting for the economic cycle. Total education spending also rose during the 1960s, but has fallen since the mid-1970s (see the top graph of Chart 21). Noncapital correctional expenditures were not separately reported by the Census Bureau until FY 1993. Per $1,000 of personal income between FYs 1993 and 2008, noncapital correctional spending per $1,000 of personal income rose 15 percent and health and welfare spending increased 12 percent. However, education spending fell 6 percent and other expenditures dropped 4 percent, leaving total expenditures unchanged over this period. Overall noncapital expenditures per $1,000 of personal income as a percentage of the national average (the bottom graph of Chart 21) fell substantially in Arizona in the late 1960s and early 1970s to around the national average, and declined further during the 1990s to be only about 90 percent of average. The education percentage has dropped more considerably, from well above average in the 1960s to somewhat above average during the 1970s and 1980s to about 10 percent below average since the early 1990s. In contrast, the percentages for corrections, health and welfare, and other functions have fluctuated without any trend since the early 1990s. Noncapital education and corrections expenditures also can be expressed per student or inmate Correctional expenditures per inmate per $1,000 of per capita personal income are far higher than higher education expenditures per FTE student, which in turn are much higher than K-12 expenditures per student (see Chart 22). K-12 spending per student per $1,000 of PCPI has fluctuated but not shown any trend over the last half century. The higher education figure per student fell during the late 1960s and 1970s but has been steady since then. In contrast, total (capital and noncapital combined) correctional spending per inmate rose during the 1980s but has been little changed since the early 1990s. As a percentage of the U.S. average, K-12 expenditures per student per $1,000 of PCPI have fallen considerably over the last half century, from more than 20 percent above average to 20 percent below average (see the bottom graph of Chart 22). Though the higher education per student percentage was little changed, the per FTE student percentage has declined since the mid-1980s. The percentage for correctional spending per inmate fell considerably during the 1980s but has been without trend since then. Appropriations Arizona’s original constitution mentioned a correctional system and programs for the disabled, but did not go into any detail regarding the amount or sources of funding. In contrast, funding for the K-12 educational system is specified to come from the proceeds of the disposal of state lands (a fund separate from the general fund) and from tax revenues, which are placed into both the general fund and a separate fund for the Proposition 301 monies. Thus, in order to evaluate the extent to which the state is meeting its constitutional obligations, total appropriations from all funds is the most relevant measure for K-12 education.
61

CHART 21 NONCAPITAL EXPENDITURES PER $1,000 OF PERSONAL INCOME,
ARIZONA STATE AND LOCAL GOVERNMENTS
AS A PERCENTAGE OF THE U.S. AVERAGE
Source: U.S. Department of Commerce: Census Bureau, State and Local Government Finances, and Bureau of Economic Analysis (personal income).
62
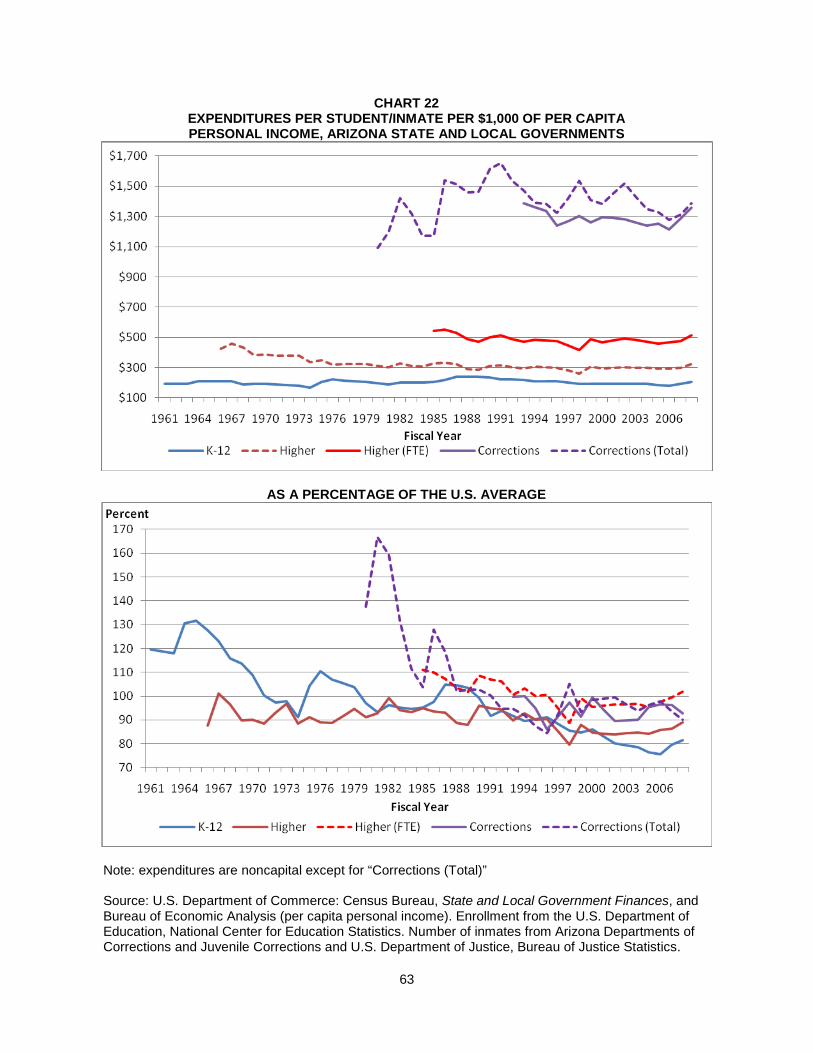
CHART 22 EXPENDITURES PER STUDENT/INMATE PER $1,000 OF PER CAPITA PERSONAL INCOME, ARIZONA STATE AND LOCAL GOVERNMENTS
AS A PERCENTAGE OF THE U.S. AVERAGE
Note: expenditures are noncapital except for “Corrections (Total)” Source: U.S. Department of Commerce: Census Bureau, State and Local Government Finances, and Bureau of Economic Analysis (per capita personal income). Enrollment from the U.S. Department of Education, National Center for Education Statistics. Number of inmates from Arizona Departments of Corrections and Juvenile Corrections and U.S. Department of Justice, Bureau of Justice Statistics.
63

The Constitution specifies that higher education also is to receive funding from tax revenues and specifically states that tuition should be “as nearly free as possible.” Tax revenues for higher education come entirely from the general fund; nearly all of the other appropriations consist of university tuitions and fees. Thus, for higher education, other funds than the general fund are not reasonable to include when evaluating how well the obligations of the Constitution are being met. Since the JLBC data on general fund and total appropriations cannot be compared to those of other states, the evaluation needs to take place strictly on the funding provided over time. For total appropriations, the earliest data are for FY 1989. For the general fund, the data go back to FY 1979. In comparing historical figures to the current level of appropriations for FY 2011, it is important to consider that FY 2011 appropriations may be reduced as part of resolving the current year’s deficit in the general fund. Of the total general fund appropriations for FY 2011, just more than 41 percent were for K-12 education. Higher education received 12 percent of the funds, roughly equal to the amount received by corrections. Health and welfare received 29 percent, leaving just 6 percent for all other programs combined. Relative to the shares of the general fund, the share of all appropriated funds in FY 2011 is smaller for K-12 education (32 percent) and corrections (9 percent), but larger for higher education (16 percent). The health and welfare shares are nearly identical, while the share (15 percent) for all other programs combined is considerably higher on an all-funds basis. Changes in spending per $1,000 of personal income are shown in the three graphs of Chart 23. Demand for health and welfare programs is countercyclical, rising during recessions as the number of people enrolled in increases substantially. This countercyclicality extends to total appropriations, as demonstrated by the somewhat higher spending relative to personal income during the recessions of the early 1980s and early 1990s. Since then, however, spending relative to personal income has fallen quite substantially during and immediately after recessions. The development of a structural deficit since the early 1990s and an unwillingness to raise revenues, even temporarily, during a recession has led to this significant change in spending behavior. A reduction in total appropriations per $1,000 of personal income is apparent after averaging out the economic cycle, the result of a conservative Legislature that has aimed to reduce the size of government since the early 1990s. The decline in total spending per $1,000 of personal income between FYs 1991 and 2011 has not been as great on an all-funds basis (-13 percent) as in the general fund (-28 percent). However, a similar cyclical pattern is portrayed. Even before the early 1990s, general fund appropriations per $1,000 of personal income for both K-12 and higher education had fallen while spending increased for corrections and for health and welfare programs. Between FYs 1991 and 2011, general fund appropriations per $1,000 of personal income have dropped very significantly for higher education (-53 percent) and for functions other than education, corrections, and health and welfare (-61 percent). The decrease has not been as substantial for K-12 education (-20 percent) and for health and welfare programs (-15 percent); correctional spending rose slightly.
64

CHART 23 APPROPRIATIONS, ARIZONA STATE GOVERNMENT
TOTAL PER $1,000 OF PERSONAL INCOME
GENERAL FUND BY CATEGORY PER $1,000 OF PERSONAL INCOME
$0
$5
$10
$15
$20
$25
1979 1981 1983 1985 1987 1989 1991 1993 1995 1997 1999 2001 2003 2005 2007 2009 2011Fiscal Year
K-12 Education Higher Education Corrections Health & Welfare Other
65

CHART 23 (continued) TOTAL APPROPRIATIONS BY CATEGORY PER $1,000 OF PERSONAL INCOME
Source: Arizona Joint Legislative Budget Committee (expenditures) and U.S. Department of Commerce, Bureau of Economic Analysis (personal income).
Total appropriations from all funds per $1,000 of personal income also have dropped. Since the general fund accounts for a very high share of total appropriations for K-12 education (98 percent in FY 2011), the rate of decline between FYs 1991 and 2011 in the general fund and all-funds figures is nearly the same. In contrast, the university collections fund (tuition and fees) makes up a large share (45 percent in 2011) of total university appropriations. Large increases in tuition have offset some of the sharp decrease in general fund appropriations, but total higher education appropriations still dropped 20 percent between FYs 1991 and 2011. Appropriations from other funds also constitute a relatively large share of the total for health and welfare and for functions other than education, corrections, and health and welfare, such that a noticeable difference in the rate of change is seen in Table 11 between the general fund and all funds. Education funding per student per $1,000 of per capita personal income is shown in Chart 24. Education expenditures have dropped significantly on this basis as well; note the much larger decline through FY 2010 versus FY 2009 in Table 10. The general fund decline has been much larger for higher education (based on FTE enrollment) than for K-12. Once university tuition increases are factored in, the K-12 and higher education decreases are comparable. Similarly, appropriations per correctional inmate per $1,000 of per capita personal income have fallen substantially (see Chart 25). This big decline is in contrast to the rise in expenditures per $1,000 of personal income shown in Chart 23, which reflects the large increase in the number of inmates.
66

TABLE 11 PERCENTAGE CHANGE IN APPROPRIATIONS, ARIZONA STATE GOVERNMENT
PER $1,000 OF PERSONAL INCOME BETWEEN FISCAL YEARS 1991 AND 2011
General Fund All Funds TOTAL -28% -13% K-12 Education -20 -18 Higher Education -53 -20 Corrections 2 7 Health and Welfare -15 11 All Else -61 -32
PER STUDENT/INMATE PER $1,000 OF PER CAPITA PERSONAL INCOME
BETWEEN FISCAL YEARS 1991 AND 2010 General Fund All Funds K-12 Education -21% -20% Higher Education (FTE) Corrections -35 -32
PER STUDENT/INMATE PER $1,000 OF PER CAPITA PERSONAL INCOME
BETWEEN FISCAL YEARS 1991 AND 2009 General Fund All Funds K-12 Education -10% -8% Higher Education (FTE) -41 -9 Corrections -32 -28
Source: Arizona Joint Legislative Budget Committee (expenditures). U.S. Department of Commerce, Bureau of Economic Analysis (personal income). U.S. Department of Education, National Center for Education Statistics (1960-2007) and Arizona Department of Education (2008-09) (enrollment). Arizona Departments of Corrections and Juvenile Corrections (number of inmates). To summarize legislative funding for the K-12 system, the basis is total appropriations from all funds. As a share of total appropriations, K-12 education fluctuated between 32 and 35 percent between FYs 1989 and 2009, but dropped below that range in FYs 2010 and 2011. Per $1,000 of personal income, total K-12 appropriations were between $18.9 and $19.8 from FYs 1989 through 1997, but fell as low as $17.7 during the economic difficulties of the early 2000s. Though some of the funding was restored during the economic boom of the mid-2000s, the figure peaked at $18.8. Since then, it has fallen to $14.6 in FY 2010 and $15.5 in FY 2011. Per student per $1,000 of per capita personal income, total K-12 appropriations gradually decreased from $121 in FY 1989 to $100 in FY 2005. The figure recovered to $111 in FY 2007 but has since dropped below $100. For higher education, the basis is the general fund. Appropriations for community colleges as a share of total general fund appropriations dropped from 3.7 percent in FY 1979 to 2.5 percent in FY 1991 to 1.6 percent in FY 2011. For the university system, the shares fell from 19.1 percent in FY 1979 to 16.1 percent in FY 1991 to 10.5 percent in FY 2011.
67
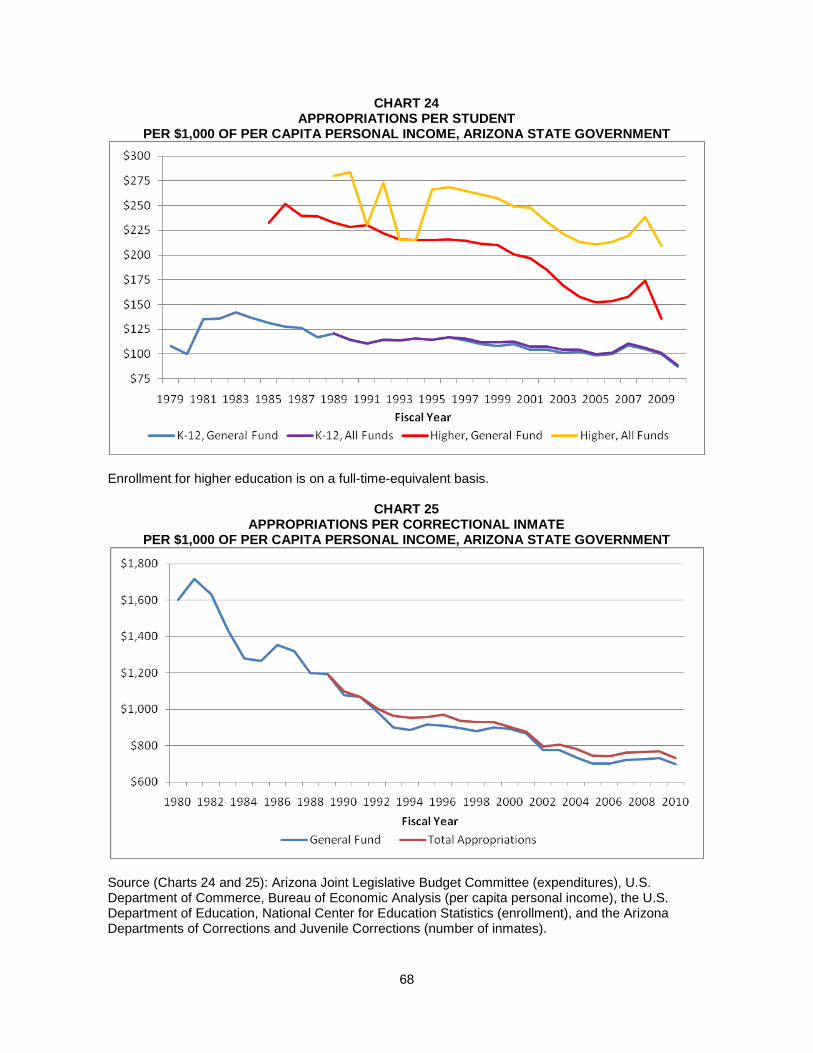
CHART 24 APPROPRIATIONS PER STUDENT
PER $1,000 OF PER CAPITA PERSONAL INCOME, ARIZONA STATE GOVERNMENT
Enrollment for higher education is on a full-time-equivalent basis.
CHART 25 APPROPRIATIONS PER CORRECTIONAL INMATE
PER $1,000 OF PER CAPITA PERSONAL INCOME, ARIZONA STATE GOVERNMENT
Source (Charts 24 and 25): Arizona Joint Legislative Budget Committee (expenditures), U.S. Department of Commerce, Bureau of Economic Analysis (per capita personal income), the U.S. Department of Education, National Center for Education Statistics (enrollment), and the Arizona Departments of Corrections and Juvenile Corrections (number of inmates).
68

Per $1,000 of personal income, the general fund decreases have been significant over time. For the community colleges, the figure went from $1.74 in FY 1979 to $1.27 in FY 1991 to $0.59 in FY 2011. For the universities, the drop was from $8.87 in FY 1979 to $8.19 in FY 1991 to $3.88 in FY 2011. Substantial decreases also have occurred in higher education general fund appropriations per full-time-equivalent student per $1,000 of per capita personal income. Between FYs 1991 and 2011, the decrease was from $64 to $41 for community colleges and from $389 to $225 for universities.
69

SOCIETAL CHANGES AND THE EFFECT ON PUBLIC EXPENDITURES Since the Arizona Constitution was originally written in 1910, numerous changes have occurred throughout American society. Many of these changes have had an impact on the services provided by the public sector by either raising the costs of providing a public service or by increasing the demand for a public service. In particular, increased demand for certain public services has caused an expansion of the public sector and has created a need today to weigh public expenditures for programs mentioned in the Constitution against many other demands for public services. A discussion of societal changes that have affected the primary state government programs follows.
Education The role of education in today’s economy is considerably different than in the early 20th century. When the Arizona Constitution was written, few graduated from high school and even fewer attended college. Now, most jobs require a high school diploma. For many, a college degree is essential. In 1940, the earliest data, about 5 percent of adults had received a bachelor’s degree and about one-fourth had earned a high school diploma. Today, more than one-fourth have earned a bachelor’s degree and nearly 85 percent are high school graduates. School attendance in Arizona has increased considerably since 1910. At that time, only 46 percent of those 5-through-9 years old attended school; according to the American Community Survey for 2006 through 2008, the percentage is 93. For those 10-to-14 years old, the 1910 percentage was 78, currently it is 98. The largest difference is among those 15-to-19 years old: 31 percent in 1910 and 83 percent today. Based on the 2006-08 American Community Survey for Arizona, of those attending K-12 schools, nearly 94 percent are enrolled in public schools. The percentage enrolled in public institutions is somewhat lower at colleges and universities, but still is 85 percent at the undergraduate level. Of those 18-to-24 years old, 29 percent are enrolled in a public college or university. The state’s rapid population growth—Arizona’s population is 32 times larger today than in 1910—has exacerbated the increase in the number of residents seeking a public education. A dramatic increase in both the physical infrastructure and operating budgets has been required to accommodate this increase in demand for public education. In FY 2011, total appropriations for public education were $5.4 billion (48 percent of total appropriations). A fairly recent example of a change in education funding that impacted the state government general fund was the Arizona Legislature’s response to an Arizona Supreme Court decision that the state’s then-existing mechanism for financing capital improvements for public schools was unconstitutional. Funding for capital improvements was largely determined by the property tax base, which varies widely by school district. The Legislature passed “Students FIRST” in 1998, which created the School Facilities Board (first funded in FY 1999) to establish minimum adequacy standards for school facilities. The provisions of this law had the result of shifting funding away from local jurisdictions where capital improvements were financed by long-term debt to funding out of the general fund—without providing for any additional general fund revenue. Thus, by addressing constitutional obligations to provide equal educational opportunities, the legislative action made it more difficult to provide funding to satisfy the Arizona Constitution’s requirement to maintain and improve public schools.
70

Public Health and Welfare While public health and welfare are not generally mentioned in the Arizona Constitution, two clauses provide for public services to those with disabilities. One is specific to the educational system: that the state “shall provide for the education and care of pupils who are hearing and vision impaired.” A separate school for the deaf and blind was established and continues to receive an appropriation separate from that of the rest of the public education system, though some students with these impairments attend public schools. The other clause more generally applies to the disabled population: “institutions for the benefit of persons who have mental or physical disabilities … shall be established and supported by the state.” These programs are primarily administered by the Departments of Economic Security and Health Services. These two agencies, along with AHCCCS, provide most of the public health and welfare services. However, public education also is impacted, primarily through special education programs for disabled youths. AHCCCS Arizona’s version of the federal Medicaid program, AHCCCS, received its first state appropriations in FY 1983. As it was phased in during the 1980s, it became a significant recipient of state government monies, though general fund revenues were not enhanced to fund this new obligation. Its appropriations have continued to increase significantly since then, in part because of service expansions. Rarely has an expansion in services been associated with an increase in revenue (the exception was Proposition 204’s dedication of tobacco settlement money). As a result, the state’s general fund is the main state government source of funding for AHCCCS, which now is second only to K-12 education in the amount of money it receives from the general fund: nearly $1.4 billion (16 percent of the total) in FY 2011. Total appropriations in FY 2011 totaled $1.5 billion (13 percent of the total). AHCCCS receives more from the general fund than both corrections and higher education, two state government functions explicitly mentioned in the state Constitution. As funding for AHCCCS has increased, general fund appropriations for higher education have fallen as a percentage of the total and per FTE student per $1,000 of PCPI. The state’s investment in AHCCCS is dwarfed by the amount of nonappropriated funds received, primarily from the federal government. Depending on the program, a dollar spent by the state is matched with a substantially greater amount of federal funds. Social Programs Spending on social programs is far greater today than when the Constitution was drafted due to a significant shift in sentiment regarding government’s role in the provision of these social services. Lipford and Slice2 examine the issue by comparing historical state and local government spending on those functions designated by Adam Smith in the Wealth of Nations (published in 1776)—public safety, administration, highways, and public education—with spending on social programs: welfare, health, hospitals, and insurance trust funds. They find that in 1902 state and local governments across the country allocated about 60 percent of their
2 Jody W. Lipford and Jerry Slice, “Roles for Government and Contemporary U.S. Government Roles,” The Independent Review, Spring 2007.
71
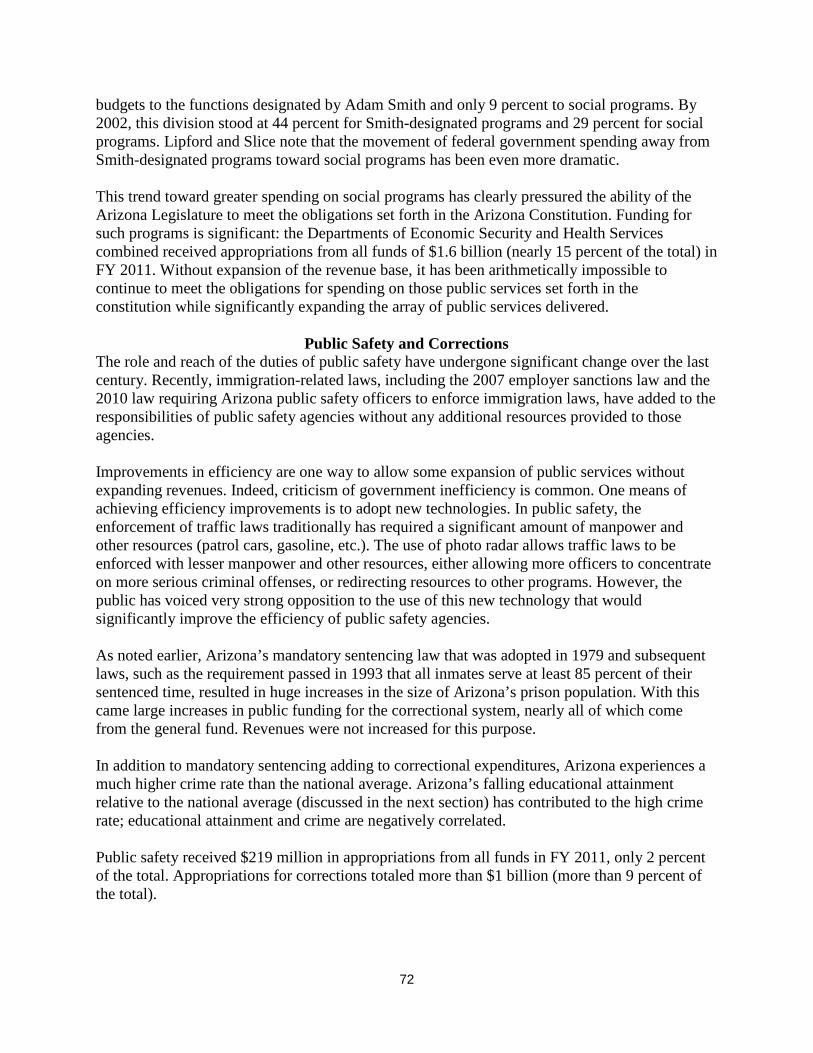
budgets to the functions designated by Adam Smith and only 9 percent to social programs. By 2002, this division stood at 44 percent for Smith-designated programs and 29 percent for social programs. Lipford and Slice note that the movement of federal government spending away from Smith-designated programs toward social programs has been even more dramatic. This trend toward greater spending on social programs has clearly pressured the ability of the Arizona Legislature to meet the obligations set forth in the Arizona Constitution. Funding for such programs is significant: the Departments of Economic Security and Health Services combined received appropriations from all funds of $1.6 billion (nearly 15 percent of the total) in FY 2011. Without expansion of the revenue base, it has been arithmetically impossible to continue to meet the obligations for spending on those public services set forth in the constitution while significantly expanding the array of public services delivered.
Public Safety and Corrections The role and reach of the duties of public safety have undergone significant change over the last century. Recently, immigration-related laws, including the 2007 employer sanctions law and the 2010 law requiring Arizona public safety officers to enforce immigration laws, have added to the responsibilities of public safety agencies without any additional resources provided to those agencies. Improvements in efficiency are one way to allow some expansion of public services without expanding revenues. Indeed, criticism of government inefficiency is common. One means of achieving efficiency improvements is to adopt new technologies. In public safety, the enforcement of traffic laws traditionally has required a significant amount of manpower and other resources (patrol cars, gasoline, etc.). The use of photo radar allows traffic laws to be enforced with lesser manpower and other resources, either allowing more officers to concentrate on more serious criminal offenses, or redirecting resources to other programs. However, the public has voiced very strong opposition to the use of this new technology that would significantly improve the efficiency of public safety agencies. As noted earlier, Arizona’s mandatory sentencing law that was adopted in 1979 and subsequent laws, such as the requirement passed in 1993 that all inmates serve at least 85 percent of their sentenced time, resulted in huge increases in the size of Arizona’s prison population. With this came large increases in public funding for the correctional system, nearly all of which come from the general fund. Revenues were not increased for this purpose. In addition to mandatory sentencing adding to correctional expenditures, Arizona experiences a much higher crime rate than the national average. Arizona’s falling educational attainment relative to the national average (discussed in the next section) has contributed to the high crime rate; educational attainment and crime are negatively correlated. Public safety received $219 million in appropriations from all funds in FY 2011, only 2 percent of the total. Appropriations for corrections totaled more than $1 billion (more than 9 percent of the total).
72

Transportation In 1910, the primary means of transportation still were by foot or by horse, or for longer trips, by train or by ship. Automobiles and airplanes still were in their infancy. People did not travel as frequently or as far as they do today. The huge increases in mobility that have occurred over the last century have created much larger demands on the public sector, especially for the provision and maintenance of roads and highways. While almost no transportation programs are included in the general fund, transportation appropriations made out of other state funds totaled $360 million in FY 2011 (3.2 percent of all appropriations).
State Retirement Though not a part of the original Arizona Constitution, state public-employee retirement systems have been specified in the Constitution for decades. In addition to the Arizona State Retirement System that covers most state government employees, several specialized systems serve certain workers, such as public safety officers. Unlike the situation in many other states, the Arizona State Retirement System has adopted measures to maintain a fiscally sound program for retirees. Annual contributions to the fund that are made by the employer (for example, the state of Arizona) are matched by contributions of employees. The contribution rate varies with the reserves of the fund. Moreover, the retirement benefits do not receive an automatic adjustment for inflation. The state’s trust funds are invested in a diversified manner but invariably these investments experience alternating periods of strong and weak returns. Over the past decade, the long-term growth target of investment return has not been met, largely due to the poor performance of the stock market. These low investment return rates have resulted in rising contribution rates for both the worker and the government employer. As these contribution rates rise, public agencies at the state and local level have to devote increasing amounts of their scarce resources to fund their contributions. So, low investment returns invariably pressure state budgets, crowding out the ability to deliver on other public duties specified in the Constitution. Compared to the other state programs discussed above, an examination of agency budgets does not reveal the size of the retirement system obligation. Current appropriations for the state retirement system itself are only $25 million (0.2 percent of all appropriations). However, a portion of the appropriations of every agency are for the employer-matching contributions to one of the state’s retirement systems.
The Trend Toward Limited Government and Low Taxes Arizonans are often outspoken about their preferences for limited government, but the Arizona Constitution provides broad taxing authority in Article 9, Section 12:
“The law-making power shall have authority to provide for the levy and collection of license, franchise, gross revenue, excise, income, collateral and direct inheritance, legacy, and succession taxes, also graduated income taxes, graduated collateral and direct inheritance taxes, graduated legacy and succession taxes, stamp, registration, production, or other specific taxes.”
73

Since the early 1990s, the Arizona Legislature has shifted away from using these taxing powers to fund public services toward a concerted policy of tax reduction. According to the JLBC, net tax reductions starting in FY 1993 have totaled $1.7 billion. Adjusting for the population growth, real per capita economic growth, and inflation that has occurred since each of the tax changes was implemented, general fund revenues have been reduced by $2.9 billion. Today, some lawmakers argue that they are unable to adequately fund public services simply because “there is no revenue.” However, “there is no revenue” because of systematic reductions in tax rates, outright elimination of taxes, and the passage of new tax credits and tax exemptions since the early 1990s. Since the Constitution clearly empowers the Legislature with the authority to set tax rates, the claim that “there is no revenue” is not a convincing rationale for not meeting constitutional obligations. The Link to Economic Development Policy Arguments in support of limited government and low taxes have been linked to economic development policy in Arizona and other states, fueled by the simple statistical correlations that have been made between states that have relatively low tax burdens and states that have experienced rapid growth. Advocates of limited government often point to this correlation as evidence that low tax burdens need to be an integral part of any economic development strategy. However, the observed correlation between low tax burdens and economic growth does not imply any particular causal relationship. Indeed, the evidence in Arizona is that strong economic growth in the early-to-mid-1990s produced (temporarily) revenue surpluses that allowed the Legislature to dramatically reduce tax burdens without reducing public spending nearly as much. That is, the reduction in tax rates came after the acceleration in economic growth. Most states experienced strong growth in the 1990s regardless of their tax policies. This argument for a link between tax reductions and subsequent economic growth is further confounded by the fact that most of Arizona’s tax reductions were aimed at individuals instead of businesses. Further, the public finance literature suggests that public infrastructure (including public education) that is paid for by taxes is as important to economic development as tax rates. The events of the last few years clearly reveal that whatever the role that low taxes actually play in an economic development agenda, Arizona’s low tax policy did not insulate the state from the sharpest cyclical downturn since the Great Depression. The state and local government tax burden on individuals has fallen sharply despite the state’s history of rapid growth during the periods when the tax burden was higher. The Relationship to Constitutional Obligations Ideological pressures to cut taxes and limit government stand in direct contrast to the fiscal obligations that are set forth in the Arizona Constitution. Meeting constitutional obligations requires that the Legislature impose tax rates sufficient to generate revenue to fund public services at an adequate level. Recent legislatures have been dominated by lawmakers who disdain taxes and who will not consider imposing any form of tax hike. This anti-tax sentiment is manifested in “no new tax” pledges that tie the hands of legislators regardless of any unforeseen
74
event. Coupled with the supermajority requirement to raise taxes, these pledges make it highly unlikely that the Legislature will pass a tax increase regardless of circumstance. In an economic environment in which revenue collections are slow and declining, those legislators who sign “no new tax” pledges are taking a position that seems to be directly at odds with the provisions of the Arizona Constitution, since it arithmetically impossible to simultaneously provide for the maintenance, development and improvement of the state’s educational institutions through taxation while letting revenue streams languish or decline. Of course, this assumes that all other constitutionally provided public-sector services are somehow adequately funded. Thus, a “no new tax” oath in practice equates to a pledge to violate the Arizona Constitution.
75

EDUCATIONAL ACHIEVEMENT AND ATTAINMENT Declines in funding per K-12 student in Arizona from levels that already were below the national average have put Arizona’s funding of elementary and secondary education near the bottom of the states. If Arizona’s educational system were performing well, the low and declining funding would be of lesser significance. This would provide contravening evidence to the contention that the Arizona Legislature is not meeting its constitutional requirement in funding public education, particularly in terms of “development and improvement.” While funding is not the only input into the educational system and therefore not the only factor affecting the performance of Arizona’s educational system, funding is of obvious significance. To expect Arizona’s elementary and secondary schools and institutions of higher education to perform well despite the very low funding levels, the quality of the other inputs would need to be very high. However, there is no evidence that funding deficiencies in Arizona are offset by inherently more intelligent or harder-working students, by better-quality teachers, by significantly more efficient use of limited resources by schools and school districts, etc., relative to the national average. In fact, Arizona’s teachers have less experience than their counterparts nationally and Arizona has a disproportionate share of disadvantaged students—a circumstance requiring above-average rather than below-average funding to overcome.
Educational Achievement Educational achievement and quality was discussed in some detail in a prior paper from 2009.3 The many possible measures of educational achievement and quality and the shortcomings of each were noted in the 2009 report. However, the major problem from the perspective of the current report is that few of the measures are consistently available for a long time period. Thus, it is not possible to compare student achievement over the decades of Arizona’s statehood. The latest findings as well as some historical perspective, largely summarized from the 2009 report, are presented in this subsection. K-12 Education On most measures of elementary and secondary student performance, Arizona ranks among the bottom tier of states. The available measures can be grouped into several categories: student achievement (as measured by test scores), high school completion rates, assessments of resources, and academic standards and accountability. The National Assessment of Educational Progress (NAEP), also known as the Nation’s Report Card, is a criterion-referenced test: scores are based on performance relative to certain criteria and are not affected by how well other test-takers do. The test is given to fourth- and eighth-grade students in various subjects on an irregular basis. Since the first tests were given in 1990, Arizona students have consistently scored below the national average in all subjects, frequently ranking among the bottom 10 states. No improvement has occurred over time; the fourth-grade math performance has worsened over time. Cross-tabulations reported by the NCES indicate that
3 See the “Evaluation of Public Education in Arizona” section of the January 2009 report Educational Funding in Arizona: Constitutional Requirement and the Empirical Record, available at http://wpcarey.asu.edu/seidman/reports/UnivEconomist/EdFunding_1-13.pdf.
76

the poor performance by Arizona students cannot be explained by factors such as ethnicity, poverty, or educational attainment of the child’s parents. Norm-referenced tests report scores relative to how other students perform. Over time, the state has used a number of these tests, including the Iowa test, the Stanford 9, and Terra Nova. Arizona students compare more favorably to their national counterparts on such tests than on the NAEP. Other tests include those taken by students enrolled in Advanced Placement (AP) courses and university entrance exams. These tests are taken voluntarily by Arizona students and a low proportion of Arizona students take these tests relative to the national average. Therefore, the results cannot be directly compared to those of other states. For example, AP scores in Arizona have been close to the national average, but the percentage of Arizona students taking the AP tests has been only about half of the U.S. average. Thus, Arizona likely would score well below the national norm if as high a proportion of Arizona students took this test. The same is true of the ACT and SAT university entrance exams. Arizona students score above average, but a much lower proportion of Arizona students take these tests than the national average. Among measures of the K-12 system other than student achievement, high school completion rates—high school graduation rates and dropout rates—are unreliable over time and across states. Classroom size has been found to be related to student success in the early grades, particularly through the third grade. Arizona’s average classroom size is among the largest in the nation. Average teacher salaries are below average in Arizona, as is the average number of years of teaching experience among Arizona teachers. In addition to these individual measures of the K-12 system, some studies have collected many measures of many types for all states. Two of these studies—“Measuring Up 2008” and “Quality Counts 2009”—were reviewed in the 2009 paper. These studies ranked Arizona among the bottom states on a variety of indicators, including student achievement, preparation for college, and teaching quality. Another study, “Educating Arizona,” noted that Arizona’s educational system faces several demographic challenges, such as an above-average child poverty rate and an above-average share of English-language learners. Such factors contribute to the poor educational achievement of Arizona’s students in aggregate. However, the achievement of Arizona’s children without such disadvantages is inferior to the performance of their peers nationally. The Best Educated Index (BEI) posted at StateMaster.com (not referenced in the 2009 report) provides a composite index: This index uses 21 factors that are said to emphasize performance outcomes, such as student achievement and positive outcomes, rather than resource inputs, such as spending. The index scores are more highly correlated with the performance measures than they are with any measure of resources, including students per teacher. The BEI for 2010 ranks Arizona last among the 50 states, noting the state’s subpar performance on such measures as reading and math scores at the 4th and 8th grade levels (from the NAEP). In comparison, Arizona ranked 48th in per K-12 student spending and 45th in per K-12 student
77
spending per $1,000 of per capita personal income in 2008. Each of these ranks has dropped significantly since the early 1990s. Of the top 10 states in the BEI, only Montana has resource allocations in terms of dollars spent per student that rank below the top half of the states. The remaining nine highly ranked states are in the top 20, and four are in the top 10, in terms of spending per student. In contrast, spending per student among the bottom 10 states in the BEI mostly is average or lower. Among the bottom 10 performers, only Hawaii and Alaska maintain spending per student levels that rank in the top 20 states. This suggests that spending per pupil is related to student achievement but is not the only factor. Higher Education The performance of the higher education system in Arizona is difficult to assess. Achievement test scores do not exist in higher education. Participation per capita at public institutions of higher education is quite high in Arizona, despite the state’s very low ranking on the percentage of high school graduates immediately going on to college. The high participation in Arizona is a result of various factors, including the state’s relatively few private higher educational institutions, the high percentage of Arizona high school graduates that go to an in-state school, the many adults taking community college courses, etc. Despite the high participation, the number of degrees awarded per capita is slightly below average, with per capita associate’s degrees, bachelor’s degrees, and advanced degrees all a little below average.
Educational Attainment Given the shortcomings in educational achievement measures, an alternative means of assessing Arizona’s educational system is to compare the educational attainment of adults living in Arizona to their national counterparts. Attainment data go back to 1940 from the decennial census; currently the data are included in the American Community Survey (ACS). However, two factors in particular limit the usefulness of these data:
• Generally, attainment data have been reported only for the entire adult population (age 25 or older). With educational attainment rising so much during the 20th century, attainment has been highly correlated with an individual’s age. In particular, the oldest generation in each census has had the least attainment. Thus, if the age distribution of a state differs from the U.S. average, this alone would account for variations in the overall education attainment.
• The adult population in any state, but especially Arizona, consists of many people who were not educated in the state in which they currently live. The American population, especially those with higher educational attainment, is highly mobile. The availability of suitable jobs is a major factor in most migration decisions. Thus, for example, if a state does not have an adequate number of jobs for the number of graduates from the state’s universities, this would lead to out-migration of the highly educated and a lower educational attainment of the state’s remaining residents.
Published data from the Census Bureau tend not to be very detailed. In the earlier decennial censuses, only summary data on the educational attainment of all residents at least 25 years of age were printed. The 2000 census provided a table by age and the ACS data also are reported by place of birth and by recent migration status.
78

Using the microdata provided by the Census Bureau, it is possible to obtain more detailed information, though the smaller sample size in the microdata is a concern. Even with this more detailed data, it is not possible to definitively determine if an individual was educated in Arizona. Using the microdata from the 2000 census, one method to assess the educational attainment of those educated in Arizona is to compare the educational attainment of Arizona residents in 2000 who were born in Arizona to those Arizona residents born in other U.S. states and to those Arizona residents born in other countries. The vast majority of Arizona residents in 2000 who were born in Arizona likely attended elementary and secondary schools in Arizona, regardless of their age. In each age group, the educational attainment of those born in Arizona and living in the state in 2000 was considerably less than the attainment of those born in another state but living in Arizona in 2000. In contrast, the educational attainment of those born in Arizona was greater than that of the foreign-born population in each age group, though the foreign-born percentage with a bachelor’s degree was nearly as high among those 19-to-34 years old and was higher than Arizona natives among those 35 or older. The educational attainment of each group of Arizona residents was compared to the attainment of their counterparts in the other states. Among those living in the same state in which they were born, the educational attainment of Arizonans was considerably below the attainment in the median state. In contrast to the low level of attainment among Arizona natives relative to natives in other states, the educational attainment of Arizonans who had been born in another state generally ranked at or only a little below the national median of interstate migrants. That is, the educational attainment of those who migrated to Arizona was close to the national average of interstate migrants. Arizona’s differential in attainment between state natives and those migrating from other U.S. states was among the highest in the country. The foreign-born population living in Arizona had among the nation’s lowest educational attainment of immigrants in all age groups. Despite the below-average attainment of Arizona natives, the difference in attainment between the natives and the foreign-born was above average. A second method divided Arizona residents in 2000 into three categories based on their place of residence in 1995: Arizona, other U.S. state, or other nation. This analysis is particularly useful in comparing the educational attainment of those 19-to-24 years old in 2000 between those who likely received at least part of their K-12 education in Arizona (those living in Arizona in both 1995 and 2000) and those who probably did not attend K-12 schools in Arizona (those who moved to Arizona between 1995 and 2000). In the 19-to-24 age group, the educational attainment of those living in Arizona in both 1995 and 2000 was considerably less than the attainment of those who had lived in another state in 1995. While the proportion without a high school diploma among those living in Arizona in both years was much less than the percentage of those who were living in another country in 1995, a higher proportion of those coming to Arizona from another country within the prior five years had earned a bachelor’s degree. The educational attainment of recent interstate migrants to Arizona
79

was higher than that of those living in Arizona in both 1995 and 2000 in all age groups, at least in part because the latter classification includes Arizona natives. The latest educational attainment data—the average of data from 2006 through 2008 from the ACS—are presented in Chart 26 as a share of the total for each of several detailed categories of the maximum educational attainment. Relative to the U.S. average, a lesser share of Arizonans have earned bachelor’s, master’s, and professional (for example, law) and doctorate degrees. A greater proportion of Arizonans have not even attended high school. The biggest difference is that more Arizonans have attended college but not received a degree while nationally a higher proportion has a high school diploma as their highest attainment. The general pattern was the same in 2000, but between 2000 and 2006-08, Arizona’s proportion relative to the national average fell in each of the three highest attainment categories and rose in each of the two lowest categories. The decline in educational attainment in Arizona relative to the national average in recent years is the continuation of a downtrend that began in the last quarter of the 20th century. In Chart 27, the difference in educational attainment between Arizona and the United States since 1940 is presented for four measures. Each is expressed on a cumulative basis, such as the percentage of the population who has earned a bachelor’s or higher degree. All of these measures show that the educational attainment of Arizonans was greater than the national average historically. Since the peak, which varies by measure from 1970 through
CHART 26 EDUCATIONAL ATTAINMENT OF RESIDENTS AGE 25 OR OLDER,
ARIZONA AND THE UNITED STATES AS A PROPORTION OF THE TOTAL
Source: U. S. Department of Commerce, Census Bureau, American Community Survey, three-year average from 2006 through 2008.
0 5 10 15 20 25 30
No High School
High School, No Diploma
High School Graduate
Some College, Less Than 1 Year
Some College, 1 or More Years, No Degree
Associate's Degree
Bachelor's Degree
Master's Degree
Professional or Doctorate Degree
PercentUnited States Arizona
80

CHART 27 MAXIMUM EDUCATIONAL ATTAINMENT OF RESIDENTS AGE 25 OR OLDER:
DIFFERENCE IN PERCENTAGE, ARIZONA LESS THE UNITED STATES
Source: U. S. Department of Commerce, Census Bureau, decennial census 1940 through 2000, American Community Survey, three-year average from 2006 through 2008.
1990, educational attainment in Arizona relative to the national average has fallen considerably. Arizona’s educational attainment is now below the national average on each measure except the percentage who have attended college. Thus, gains in educational attainment in Arizona have not kept pace with the national average. A strong relationship exists between educational attainment and median earnings, as seen in Chart 28. The earnings of Arizonans are nearly identical to their national counterparts among those with lesser educational attainment. However, a differential develops among those with more education; Arizonans with a graduate degree earn 9 percent less than the U.S. average. A look at the educational attainment data by age indicates that a disproportionately large share of retirement-age residents in Arizona have earned a university degree. Thus, at least part of the earnings differential among those with a university degree results from a higher proportion being retired from the workforce in Arizona. Possibly, an inadequate number of high-paying jobs relative to the number of residents with a university degree in Arizona also could contribute. Educational Attainment by Age Educational attainment varies by age, as seen in Chart 29 for Arizona. The strong trend toward higher educational attainment in each succeeding generation that was present through the first three quarters of the 20th century has weakened significantly since then. This trend accounts for educational attainment of those of retirement age being lower than in the 45-to-64 age group. Though many people have ended their schooling by age 25, some continue to earn degrees,
81

CHART 28 MEDIAN EARNINGS BY MAXIMUM EDUCATIONAL ATTAINMENT,
AGE 25 OR OLDER
CHART 29 EDUCATIONAL ATTAINMENT OF ARIZONA RESIDENTS BY AGE
Source (Charts 28 and 29): U. S. Department of Commerce, Census Bureau, American Community Survey, three-year average from 2006 through 2008.
82

accounting for the somewhat greater attainment in the 45-to-64 age group than in the 25-to-44 age groups. Relative to the U.S. average, a significant difference exists in the educational attainment of Arizonans age 65 or older compared to those less than 45 years old, as seen in Table 12. The high educational attainment of the retirement-age population, many of whom moved to the state at retirement age, means that the overall educational attainment of the 25 or older population is a poor measure of the educational attainment of the state’s labor force. Arizona’s retirement-age population is much more highly educated than their counterparts nationally, but the working-age population in Arizona, especially those less than 45 years old, is less well educated than their national counterparts. The educational shortfall in Arizona is even seen among those 18-to-24 years old. Though interstate migration and immigration are relatively common in this age group, a relatively high proportion of residents of this age group likely were educated in Arizona. In each age group, educational attainment in Arizona relative to the national average deteriorated between 2000 and 2006-08. The proportions who had earned at least a bachelor’s degree fell in each age group, while the proportions with less than a high school diploma and/or a high school diploma as the maximum attainment rose in each age group. The Census Bureau has provided detail on the school enrollment/workforce status of those 16-to-19 years old since 1980. The percentage of Arizonans in this age group enrolled in school (high school/community college/university) has consistently been lower than the U.S. average. The lower percentage in Arizona largely has been among full-time students, but Arizona also has been lower among those who also are part of the workforce. The higher proportion not enrolled in school has largely been among those without a high school diploma, but the percentage with a high school diploma also has been higher in Arizona. The proportions have been higher both among those in the labor force and those not working.
TABLE 12 EDUCATIONAL ATTAINMENT OF RESIDENTS BY AGE:
DIFFERENCE IN PERCENTAGE, ARIZONA LESS THE UNITED STATES
Age Group 18-24 25-34 35-44 45-64 65+
No High School 1.6 2.4 2.4 0.9 -2.5 High School, No Diploma 3.7 2.1 1.5 -0.9 -3.6 High School Graduate -0.1 -0.5 -2.9 -5.1 -4.1 Some College, No Degree -2.4 2.0 3.6 5.2 6.2 Associate’s Degree -0.1 0.0 -0.5 0.8 1.2 Bachelor’s Degree -2.4 -3.8 -2.4 -0.5 1.7 Graduate Degree -0.1 -2.1 -1.7 -0.5 1.3
Source: U. S. Department of Commerce, Census Bureau, American Community Survey, three-year average from 2006 through 2008.
83

Recent immigrants and interstate migrants have some impact on this age group, but largely it is reflecting the status of those educated in Arizona. Thus, higher proportions of Arizonans age 16 to 19 have not graduated from high school and lower proportions are attending school. These higher and lower proportions apply both to those who are part of the workforce and to those not in the labor force. Educational Attainment by Place of Birth The educational attainment of Arizona residents varies substantially by place of birth, as seen in Chart 30. Those who moved to Arizona from another U.S. state have substantially higher attainment than those who were born in Arizona. Those who were foreign born have much lesser attainment overall, though the percentage with a graduate degree is higher than that of Arizona natives. Among those Arizonans who were born in the state, the educational attainment is inferior to those born in and living in the same state elsewhere in the country. As seen in Table 13, a higher proportion of Arizona natives have not graduated from high school and a lesser proportion have earned at least a bachelor’s degree. Those who moved to Arizona from another state also have a lesser educational attainment in terms of the percentage earning at least a bachelor’s degree compared to the national average of interstate migrants. A relatively small number of Arizonans are in a third category of being U.S.
CHART 30 EDUCATIONAL ATTAINMENT OF ARIZONA RESIDENTS BY PLACE OF BIRTH, AGE 25 OR OLDER
Source: U. S. Department of Commerce, Census Bureau, American Community Survey, three-year average from 2006 through 2008.
84

TABLE 13 EDUCATIONAL ATTAINMENT OF RESIDENTS AGE 25 OR OLDER BY PLACE OF BIRTH:
DIFFERENCE IN PERCENTAGE, ARIZONA LESS THE UNITED STATES
In State
Other State
Outside U.S.*
Foreign Born
Less Than High School Diploma 2.9 -1.5 -11.4 10.3 High School Graduate -4.2 0.3 -3.4 0.1 Some College/Associate’s Degree 6.3 5.8 10.6 -0.6 Bachelor’s Degree -2.9 -2.0 3.3 -5.9 Graduate Degree -2.0 -2.5 0.9 -3.9
* Born a U.S. citizen; the number in this category is small Source: U. S. Department of Commerce, Census Bureau, American Community Survey, three-year average from 2006 through 2008. citizens at birth but being born outside the 50 states/District of Columbia. This group of Arizonans has a higher educational attainment than the national average of the group. The fourth category is of those foreign born: immigrants to the United States. Foreign-born residents in Arizona have much lesser educational attainment than the foreign born living elsewhere in the United States. Educational Attainment of Recent Migrants Educational attainment of Arizonans based on where they lived in the prior year is shown in Chart 31. The attainment of those who moved locally within the same county and those who moved across counties within Arizona was somewhat less than those who did not move. In contrast, those who moved to Arizona from another state had higher educational attainment. Those moving from abroad include both immigrants and Americans returning to the United States. Relative to the national average, Arizonans in each category of residence one year earlier had lesser educational attainment (see Table 14). Those moving from abroad in particular had much lesser attainment than their national counterparts. Thus, while interstate migrants are more highly educated than nonmigrants, those moving to Arizona are relatively less educated. This provides some evidence that the mix of jobs in the Arizona economy is subpar and contributes to the low educational attainment of the state’s residents. The ACS also provides the educational profile of those who moved from Arizona to another state in the previous year (“out migrants” in Chart 29). It is similar to the attainment of in-migrants from other states—a disproportionate share of the highly educated moved, while relatively few with less than a high school diploma migrated.
Conclusion: Educational Achievement and Attainment The educational achievement data that can be compared over time do not suggest that Arizona’s deficiencies are gradually being overcome. However, a strong downward trend also is not obvious.
85

CHART 31 EDUCATIONAL ATTAINMENT OF ARIZONA RESIDENTS BY RESIDENCE IN PRIOR YEAR,
AGE 25 OR OLDER
0
5
10
15
20
25
30
35
40
Same House
Same County
Same State
Different State
Abroad Out Migrants
Percent
Place of Residence in Prior Year
Less Than High School Graduate
High School Graduate
Some College or Associate's Degree
Bachelor's Degree
Graduate or Professional Degree
TABLE 14 EDUCATIONAL ATTAINMENT OF RESIDENTS AGE 25 OR OLDER BY RESIDENCE ONE YEAR
EARLIER, DIFFERENCE IN PERCENTAGE, ARIZONA LESS THE UNITED STATES
Same House
Same County
Same State
Different State
Abroad
Less Than High School Diploma 0.9 0.2 -2.1 -0.5 10.1 High School Graduate -3.8 -2.5 0.4 2.5 3.0 Some College/Associate’s Degree 4.9 3.6 9.0 4.0 -1.4 Bachelor’s Degree -1.2 -0.7 -5.0 -2.3 -7.0 Graduate Degree -0.7 -0.7 -2.3 -3.7 -5.7
Source (Chart 31 and Table 14): U. S. Department of Commerce, Census Bureau, American Community Survey, three-year average from 2006 through 2008. With funding levels declining, some might interpret the lack of significant worsening of achievement measures to be a sign that the state can live with lower educational funding. Before that conclusion is drawn, the long lag in any relationship between funding and K-12 student achievement must be considered. Most children attend public K-12 schools for 13 years. A funding reduction is unlikely to have much effect on the achievement of children older than those in the first few grades. The decreases in K-12 appropriations have occurred only since FY 2000, with the most significant decreases after FY 2007. Total K-12 funding from all sources fell primarily between FYs 1997 and 2004. So, one should not expect to see much decrease in achievement—yet. Federal stimulus monies and increases in local government property tax collections due to the huge increases in real estate values during the mid-2000s have kept total K-12 funding up in
86

recent years despite the reduced appropriations. However, property tax collections are now down due to the recent crash in real estate values and the federal stimulus money disappears after the current fiscal year. The state government general fund continues to run a deficit. So, the K-12 funding outlook is bleak going forward. Thus, the potential negative impacts of funding reductions are a real concern for those children who began school within the last couple of years and for those who will be entering school soon. In contrast, educational attainment relative to the national average has been declining for more than two decades. General fund appropriations for higher education also have been falling throughout this extended period. While a cause-and-effect conclusion cannot be drawn, a worrisome outlook for educational attainment in the state going forward is justified. Any effect between funding reductions and educational attainment will take even longer to manifest than impacts on K-12 student achievement.
87

REASONABLE LEVELS OF INVESTMENT IN EDUCATION The Arizona Constitution specifies that “appropriations, to be met by taxation” shall insure the “proper maintenance” and “development and improvement” of the state’s public education system. These terms connote some level of adequacy when it comes to funding, presumably designed to achieve a particular level of service delivery in public education services. The Constitution also specifies that the instruction provided at state educational institutions “shall be as nearly free as possible,” reinforcing the specification that the support of educational institutions should primarily fall on the population at large rather than the individual student. While the authors of the Constitution were remarkably specific regarding public support for education relative to other state government functions, the constitutional language is by necessity vague as to just what constitutes “proper maintenance,” “development and improvement” and “as nearly free as possible.” Logically, the adequacy of resources—particularly monetary funding—would seem to be a necessary condition for achieving a particular level of success in public service delivery in education. However, measuring success is a challenge just as is determining whether the constitutional requirements are being met. One means of evaluating whether the constitutional requirements are being fulfilled is to (1) compare student achievement and educational attainment across states, and (2) compare educational funding in Arizona to that in other states. However, this technique assumes that conditions in Arizona are the same as those in other states. In reality, any number of factors may be different, including costs of materials and services required by the educational system and the school readiness of children. Student achievement and educational attainment were discussed in the prior section; Arizona is subpar on most measures, significantly so on some. Further, educational attainment has fallen over time relative to other states and student achievement shows no improvement over the last two decades. The following subsections summarize educational funding in Arizona.
Elementary and Secondary Education Total state and local government expenditures for K-12 education in Arizona ranked among the bottom 10 states in FY 2008 on each of the measures: per capita, per $1,000 of personal income, per student, and per student per $1,000 of per capita personal income. On each of the measures, the state’s ranking fell between 16 and 20 places from FY 1992. (FY 1992 is the base period since earlier data for all states are not readily available.) Spending per student per $1,000 of per capita personal income has been falling in Arizona. It dropped 22 percent from FYs 1992 through 2006. A cyclical upswing in FYs 2007 and 2008 almost certainly was more than offset by subsequent funding cuts. Arizona’s funding in FY 2008 ranged from 11 percent below average (per $1,000 of personal income) to 26 percent below average (per student); it likely is currently even further below average. Each of the percentages of the national average dropped between 16 and 19 percentage points between FYs 1992 and 2008. Had Arizona’s per K-12 student spending been at the median of all states in FY 2008, an additional $2.7 billion would have been spent. To reach the U.S. average, spending would have
88
been $3.3 billion higher than the actual figure. Relative to the national median/mean on a per student per $1,000 of PCPI basis, the increase in spending would have been $1.6 billion. However, as noted earlier, Arizona’s “need” to spend on education is greater than the norm. Disproportionate, and increasing, shares of its children are disadvantaged, such as living in poverty and speaking English as a second language. Focusing only on state government appropriations, K-12 education’s share of total appropriations generally held between 33 and 35 percent from FYs 1989 through 2009, but has been less than 32 percent in the last two years. Total appropriations per student per $1,000 of per capita personal income fluctuated between $111 and $121 from FYs 1989 through 2000. In FY 2010, the figure was only $89—down 23 percent from the mid-point of the 1989-2000 range. The conclusion is inescapable. Funding for K-12 education, whether measured as state appropriations or as the total from all sources, has dropped significantly since the early 1990s, as measured per student or per student per $1,000 of PCPI. On both measures, Arizona’s support was far below the U.S. average, ranking among the bottom five states in FY 2008. Funding cuts since 2008 are likely to have made these national comparisons even less favorable.
Higher Education Total state and local government expenditures for higher education in Arizona in FY 2008 ranked 35th per capita and 30th per $1,000 of personal income. Each of these rankings was 17 to 18 places lower than in FY 1992. These rankings are not of particular relevance since a disproportionately high share of the state’s residents attends public higher education institutions. On the more meaningful per student spending measures, Arizona ranked 44th per FTE student, 11 percent below the national average, and 27th per FTE student per $1,000 of PCPI, 3 percent above average, in FY 2008. The percentage of the national average hardly changed on either per student measure; spending per FTE student per $1,000 of PCPI hardly changed either, except for a cyclical upswing in FYs 2007 and 2008 that almost certainly has since been offset. Had Arizona’s higher education spending per FTE student been at the median of all states in FY 2008, the state would have spent $550 million more than it did. To reach the U.S. average, spending would have been nearly $650 million more. However, spending was close to the national median/mean on a per FTE student per $1,000 of PCPI basis. Focusing only on state government general fund appropriations, higher education’s share of total appropriations have dropped for at least three decades, from 22 percent in FYs 1979 and 1980 to 12 percent or less in the last three years. Total appropriations per student per $1,000 of per capita personal income were at least $230 before FY 1992, but were down to $136 in FY 2009, a drop of 41 percent. In conclusion, general fund appropriations per student and per (FTE) student per $1,000 of PCPI have fallen further, and for a longer period of time, for higher education than have appropriations for K-12 education. In contrast, total state and local government funding for higher education has not fallen per FTE student nor has the percentage of the national average dropped. Per FTE student per $1,000 of PCPI, funding in FY 2008 was slightly above the national average, though per FTE student funding was among the lowest in the country.
89
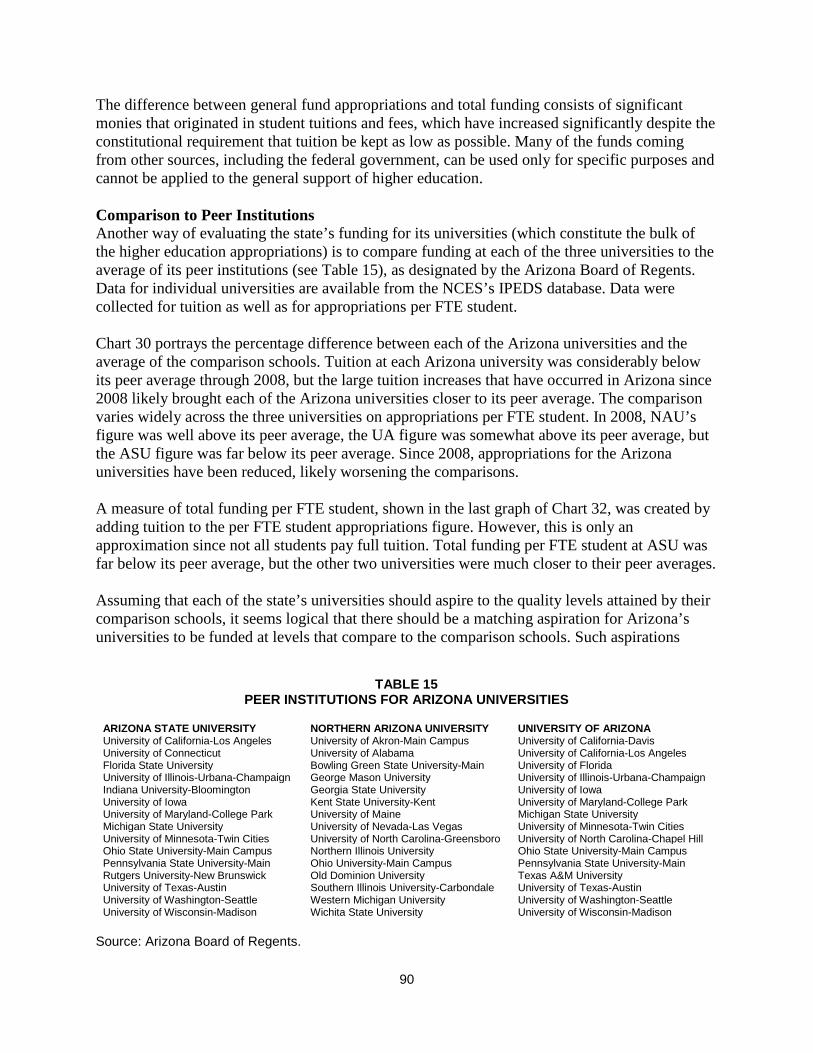
The difference between general fund appropriations and total funding consists of significant monies that originated in student tuitions and fees, which have increased significantly despite the constitutional requirement that tuition be kept as low as possible. Many of the funds coming from other sources, including the federal government, can be used only for specific purposes and cannot be applied to the general support of higher education. Comparison to Peer Institutions Another way of evaluating the state’s funding for its universities (which constitute the bulk of the higher education appropriations) is to compare funding at each of the three universities to the average of its peer institutions (see Table 15), as designated by the Arizona Board of Regents. Data for individual universities are available from the NCES’s IPEDS database. Data were collected for tuition as well as for appropriations per FTE student. Chart 30 portrays the percentage difference between each of the Arizona universities and the average of the comparison schools. Tuition at each Arizona university was considerably below its peer average through 2008, but the large tuition increases that have occurred in Arizona since 2008 likely brought each of the Arizona universities closer to its peer average. The comparison varies widely across the three universities on appropriations per FTE student. In 2008, NAU’s figure was well above its peer average, the UA figure was somewhat above its peer average, but the ASU figure was far below its peer average. Since 2008, appropriations for the Arizona universities have been reduced, likely worsening the comparisons. A measure of total funding per FTE student, shown in the last graph of Chart 32, was created by adding tuition to the per FTE student appropriations figure. However, this is only an approximation since not all students pay full tuition. Total funding per FTE student at ASU was far below its peer average, but the other two universities were much closer to their peer averages. Assuming that each of the state’s universities should aspire to the quality levels attained by their comparison schools, it seems logical that there should be a matching aspiration for Arizona’s universities to be funded at levels that compare to the comparison schools. Such aspirations
TABLE 15 PEER INSTITUTIONS FOR ARIZONA UNIVERSITIES
ARIZONA STATE UNIVERSITY NORTHERN ARIZONA UNIVERSITY UNIVERSITY OF ARIZONA University of California-Los Angeles University of Akron-Main Campus University of California-Davis University of Connecticut University of Alabama University of California-Los Angeles Florida State University Bowling Green State University-Main University of Florida University of Illinois-Urbana-Champaign George Mason University University of Illinois-Urbana-Champaign Indiana University-Bloomington Georgia State University University of Iowa University of Iowa Kent State University-Kent University of Maryland-College Park University of Maryland-College Park University of Maine Michigan State University Michigan State University University of Nevada-Las Vegas University of Minnesota-Twin Cities University of Minnesota-Twin Cities University of North Carolina-Greensboro University of North Carolina-Chapel Hill Ohio State University-Main Campus Northern Illinois University Ohio State University-Main Campus Pennsylvania State University-Main Ohio University-Main Campus Pennsylvania State University-Main Rutgers University-New Brunswick Old Dominion University Texas A&M University University of Texas-Austin Southern Illinois University-Carbondale University of Texas-Austin University of Washington-Seattle Western Michigan University University of Washington-Seattle University of Wisconsin-Madison Wichita State University University of Wisconsin-Madison
Source: Arizona Board of Regents.
90

CHART 32 PERCENTAGE DIFFERENCE IN FUNDING
BETWEEN ARIZONA UNIVERSITIES AND PEER INSTITUTIONS
TUITION
APPROPRIATIONS PER FULL-TIME-EQUIVALENT STUDENT
91

CHART 32 (continued)
APPROXIMATE TOTAL FUNDING PER FULL-TIME-EQUIVALENT STUDENT
Source: U.S. Department of Education, National Center for Education Statistics, IPEDS database.
would also align with the language of the Arizona Constitution, that the Legislature “shall make such special appropriations as shall provide for their development and improvement” (referring to all public educational institutions).
Conclusion The education funding data examined in this paper convey several distinct conclusions. First, total funding on a per student basis—both K-12 and higher education—is considerably below that of other states. Second, total funding per student has declined significantly for K-12 education in comparison to other states over the last two decades. Third, the amounts appropriated by the Arizona Legislature for both K-12 and higher education have dropped more than have the total amounts. Moreover, in the case of higher education, the declines in resources on a per student basis have been the primary catalyst in prompting the Arizona Board of Regents to raise tuition rates in a manner that might contradict the “nearly free” provision of the Arizona Constitution. While legal scholars might argue that it is important for the Legislature to meet its constitutional obligations for legal and ethical reasons, significant societal and economic benefits stem from public investments in education. Given the unique attention and detail given to public education in the original Constitution, it is reasonable to conclude that the authors in 1910 also recognized these benefits. Hence, adherence to the Arizona Constitution is not only the legal obligation of today’s Legislature, it can yield economic benefits that reap returns to the economy of Arizona.
92

One of the most widely agreed upon statistics in economics is that additional years of education yield economic benefits. While much of the benefit accrues to the individual who increases his/her educational attainment in the form of a higher salary, broader economic and noneconomic benefits also are realized. As early as Adam Smith’s Wealth of Nations, economists have noted the spillover benefits that accrue to investments in education and the subsequent wealth and rising standards of living that educated societies enjoy. Smith and more contemporary economists have noted the economic and social benefits that accrue from a more educated society. Mankiw, Romer, and Weil4 note the positive impacts on productivity that emanate from greater human capital investments. The work of Moretti5 provides some of the most precise estimates of the social return to education. Using an extensive set of analyses over hundreds of cities and decades of estimates, he finds discernible wage increments in response to increasing labor force shares of college graduates. The greater wage effects resulting from greater numbers of college-educated workers accrue to all workers owing to the productivity-enhancing effects that spillover as greater numbers of college workers populate the labor force. Using Moretti’s estimates, Hoffman and Rex6 estimated that raising the labor force share of college graduates in Arizona by one full percentage point would result in an overall increase in aggregate incomes of about $2.1 billion in the state. This increase captures both the returns to the college graduates themselves and the productivity-enhancing spillover impacts that these workers have on the Arizona economy. Thus, as the Legislature maintains, and develops and improves, the public schools and universities—while providing instruction as nearly free as possible—discernible monetary benefits accrue to the state. Contrarians might argue that students who receive their education in the state may take their skills elsewhere and that investing in public institutions may not bring about the desired increase in an educated workforce. However, estimates from ASU’s alumni database indicate that most university graduates stay within the state. ASU’s alumni database covers more than 90 percent of recent graduates. A total of 79,120 students received undergraduate degrees from ASU over the past 10 years and 72 percent of these graduates currently reside in the state. In addition, 22,110 students received graduate degrees from ASU in the past 10 years and 65 percent of these graduates still reside in the state today. The alumni database also reveals that ASU students produced in the highly competitive science and engineering fields also largely stay in Arizona. The data reveal that of the 7,068 individuals who graduated from over the last 10 years with an undergraduate degree in a science or engineering field, 72 percent currently reside in the state. Of the 4,116 people who graduated
4 N. Gregory Mankiw, David Romer, and David N. Weil, “A Contribution to the Empirics of Economic Growth,” The Quarterly Journal of Economics, May 1992. 5 Enrico Moretti, “Estimating the Social Return to Higher Education: Evidence from Longitudinal and Repeated Cross-Sectional Data,” Journal of Econometrics, July/August 2004. 6 Societal Benefits of Higher Education, April 2008, http://wpcarey.asu.edu/seidman/Reports/P3/SocietalBenefits_4-08.pdf
93

over this period with an advanced degree in science or engineering, 47 percent now reside in Arizona. So, meeting constitutional obligations is not only an ethical, legal and egalitarian act, adhering to the provisions of the Constitution can add considerable wealth to the Arizona economy and raise standards of living. Social benefits include less crime, more civic participation, and improved performance over a range of socioeconomic indicators, such as the poverty rate. Less demand on public welfare programs results. The intergenerational social benefits may be very large as increased educational attainment today translates into higher probabilities of strong educational attainment in future generations. Academic ability is shaped by family and environmental factors. The values and goals of an individual, influenced strongly by the educational attainment of the parents, is an important determinant of educational attainment.
94