Arizona Childhood Lead Poisoning Targeted Screening Plan...
27
Arizona Childhood Lead Poisoning Targeted Screening Plan 2005 Bureau of Epidemiology and Disease Control Services Office of Environmental Health Children’s Environmental Health Program
Transcript of Arizona Childhood Lead Poisoning Targeted Screening Plan...
Arizona Childhood Lead Poisoning
Targeted Screening Plan 2005
Bureau of Epidemiology and Disease Control Services Office of Environmental Health Children’s Environmental Health Program
Janet Napolitano, Governor
State of Arizona
Susan Gerard, Director Arizona Department of Health Services
ARIZONA DEPARTMENT OF HEALTH SERVICES Bureau of Epidemiology and Disease Control Services
Office of Environmental Health Children’s Environmental Health
150 North 18th Avenue Suite 430
Phoenix, Arizona 85007 1-800-367-6412
This publication can be made available in alternative format. Please contact the numbers listed above. Permission to quote from or reproduce materials from this publication is granted when Due acknowledgment is made. “Equal Opportunity/Reasonable Accommodation Employer”
2
3
Executive Summary In 1991, the Centers for Disease Control and Prevention statement Preventing Lead Poisoning in Young Children1 redefined elevated blood lead levels (EBLLs) as those >10 µg/dL and recommended a new set of guidelines for the treatment of lead levels >15 µg/dL. Universal screening was recommended for children 9 to 72 months of age except in communities with sufficient data to conclude that children would not be at risk of exposure. Because there were few community-based data, the 1991 CDC statement essentially called for universal screening. Since publication of the 1991 CDC statement, epidemiological studies and lead poisoning prevention programs in many states have found that targeted (selective) screening is more appropriate than universal screening.2-7 In consideration of these data; the CDC revised its guidelines in 1997. The revised guidelines provide a basis for the Arizona Department of Health Services to decide on an appropriate screening policy using local lead poisoning data and housing data collected by the US Bureau of the Census. This strategy is intended to increase the screening and follow-up care of children who most need these services, to ensure that high-risk children are screened, to ensure that prevention approaches are appropriate to Arizona, and to reduce unnecessary testing of children unlikely to be exposed to lead.
The 1997 CDC guidelines are a response to poor screening of high-risk children and to concerns about wasting resources by universal screening in low-risk settings.8 The 1997 CDC publication provides comprehensive guidance for developing a screening policy based on local blood lead and housing age data. The goal of the new CDC screening recommendations is to ensure that children at risk of exposure to lead are tested. Lead has adverse effects on nearly all organ systems in the body. It is especially harmful to the developing brains and nervous systems of children under the age of 6 years. At very high blood lead levels, children can have severe brain damage or even die. At blood lead levels as low as 10 micrograms per deciliter (µg/dL), children's intelligence, hearing, and growth are affected. This damage can be stopped if a child's lead exposure is reduced. Studies are being done to determine if the damage can be reversed. The Arizona Department of Health Services maintains the lead exposure registry for Arizona. The program develops lead poisoning prevention strategies, investigates cases with elevated blood lead levels, provides lead poisoning case follow-up and conducts educational outreach activities. Laboratories and health care providers reported 239 children with lead poisoning (>10 ug/dL) in 2004. Lead-based paint in older homes continues to be a remaining source of lead poisoning for children in Arizona. Homes built before 1978 are more likely to contain lead based paint that can be a source of lead poisoning. Older homes built before 1960 are the most likely to be a potential source for lead poisoning. Lead containing folk remedies and lead containing pottery are significant sources of lead exposure in Arizona. Hispanic children are more likely to suffer lead poisoning due to these sources. Other lead sources identified during environmental investigations were lead containing toys, mini-blinds and take home exposure.
4
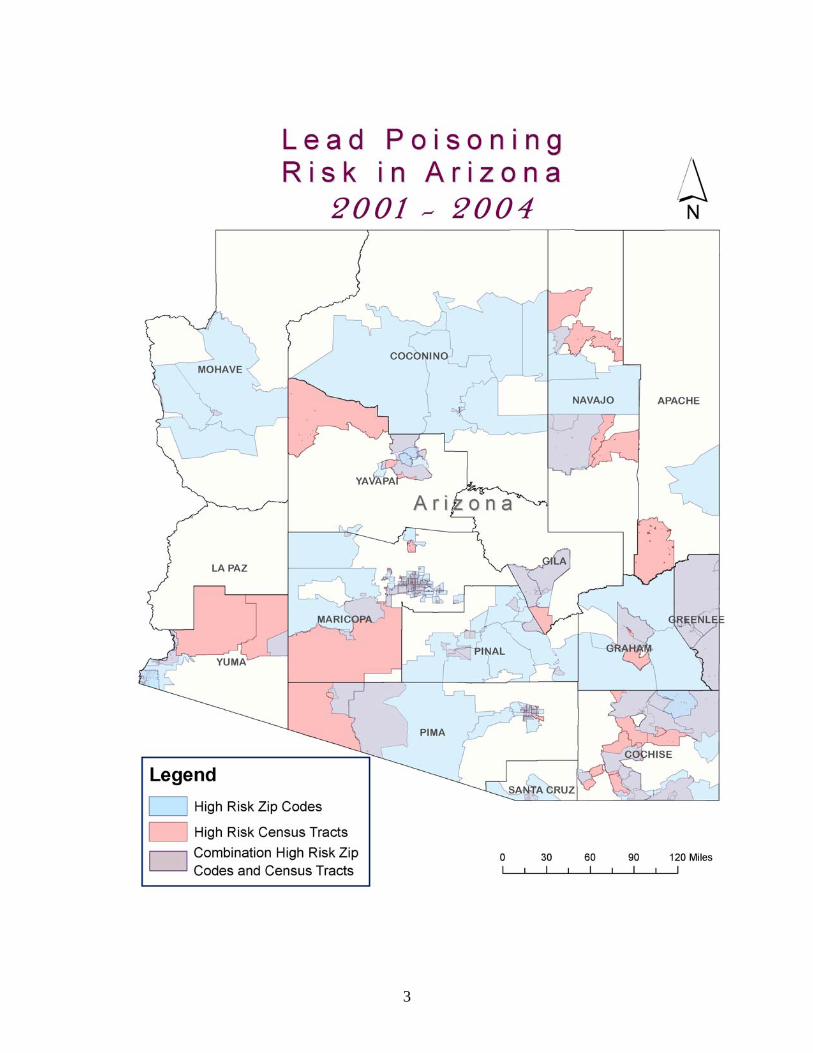
The CDC publication, Screening Young Children for Lead Poisoning: Guidance for State and Local Public Health Officials, lists steps that state public health agencies should follow in the policy development activity of developing and implementing a statewide targeted blood lead testing plan. The Lead Poisoning Screening Coalition was also organized using this CDC publication. The coalition was directed to examine prevalence and the risk factors for lead poisoning in Arizona. The 1997 CDC guidance recommends that blood lead data, housing data, demographic data on children, and data on the presence of other sources of lead be used to assess lead exposure in the state in order to determine whether targeted screening is appropriate. The Arizona Department of Health Services and the Coalition used available lead poisoning prevalence rates and pre-1960 housing data for each ZIP code to develop a Lead Poisoning Risk Index for each ZIP code in Arizona for the 2003 targeted screening plan. The 2005 plan further identifies at the census tract level areas considered to be high risk for lead poisoning. This document updates the 2003 targeted screening plan with the high-risk census tracts for each county in Arizona.
Introduction The principal federal recommendations on screening young children for lead poisoning are issued by the Centers for Disease Control and Prevention (CDC); the current guidance was published in November 1997 in a document called Screening Young Children for Lead Poisoning: Guidance for State and Local Public Health Officials. State health departments and their partners are encouraged to develop formal childhood lead poisoning screening plans that reflect local conditions. The CDC guidance recommends targeted screening in communities or states where less than 12% of children have lead poisoning and where 27% or fewer of houses were built before 1950. This recommendation is based partially on an analysis suggesting that the benefits of universal screening outweigh the costs only when the prevalence of lead poisoning is in the range of 11% to 14% or higher.8 Lead poisoning rates in Arizona meet these criteria for development of a targeted screening plan. The Arizona Department of Health Services and the Childhood Lead Poisoning Screening Coalition selected a policy that recommends a geographic targeted lead screening approach that focuses blood lead testing resources on Arizona children who are at higher risk for lead poisoning. This plan also supports the Arizona Health Care Cost Containment System (AHCCCS) requirement of testing all enrolled children. Federal law specifically requires lead screening “as appropriate for age and risk factors” for all children enrolled in Medicaid. The screening provision is part of the mandatory package Screening, Diagnostic and Treatment Services” (or EPSDT).
The Arizona Plan • All children living in targeted ZIP codes or census tracts should have a blood lead test at 12
and 24 months of age. Children aged 36 to 72 months should be tested if they have not been previously tested.
5
• All children covered by the Arizona Health Care Cost Containment System (AHCCCS) should be tested according to the Centers for Medicare and Medicaid Services (CMS) requirements, as follows: test all children at 12 and 24 months of age; test children at 36 to 72 months of age if they have not been previously tested.
• For children not living in a targeted ZIP code or census tract area, health care providers should conduct an individual risk evaluation in order to determine whether those children are at increased risk of having an elevated blood lead level (BLL).
Effects from Lead Poisoning Lead has adverse effects on nearly all organ systems in the body. It is especially harmful to the developing brains and nervous systems of children under the age of 6 years. At very high blood lead levels, children can suffer severe brain damage or die. At blood lead levels as low as 10 micrograms per deciliter (µg/dL), children's intelligence, hearing, and growth are affected. This damage can be stopped if a child's lead exposure is reduced. Studies are being conducted to determine if this damage can be reversed.
A child is considered to be physiologically lead-poisoned at a blood lead level equal to 10 µg/dL or greater. The Centers for Disease Control and Prevention chose this level because it is the level at which health effects become significant. In addition, at this level, CDC recommends that action be taken to keep the blood lead level from increasing. In 1991, the CDC estimated that the average benefit of preventing a child's blood lead level from rising above 24 µg/dL was $1,300 in medical and public health case management costs, and $3,331 in special education costs. A Health and Human Services advisory group and the National Academy of Sciences are examining research concluding that even tiny amounts of lead hinder children’s intelligence.
A number of studies have estimated that a child's IQ will drop by one to three points for every increase of 10 µg/dL in the child's blood lead level. In a community, the presence of lead-poisoned children can be associated with an increase in the number of children with developmental deficits and learning disorders. As a result, this places an unnecessary and expensive burden on the educational system. According to the CDC publication, Managing Elevated Blood Lead Levels Among Young Children: Recommendations from the Advisory Committee on Childhood Lead Poisoning Prevention, March 2002, the presence of lead-poisoned children also requires substantial community public health resources for medical and environmental case management services.9
Lead Poisoning Cases in Arizona The Arizona Department of Health Services (ADHS) Lead Poisoning Prevention Program maintains the lead exposure registry for Arizona. In addition, the program develops lead poisoning prevention approaches, investigates cases with elevated blood lead levels, and conducts educational outreach activities.
Laboratories and health care providers reported 239 children with lead poisoning (>10 ug/dL) in 2004. Figure 1 displays the number of childhood lead poisoning cases for 2000 to 2004. Eighty-eight percent (88%) of the childhood cases (210 cases) were in the lower
6
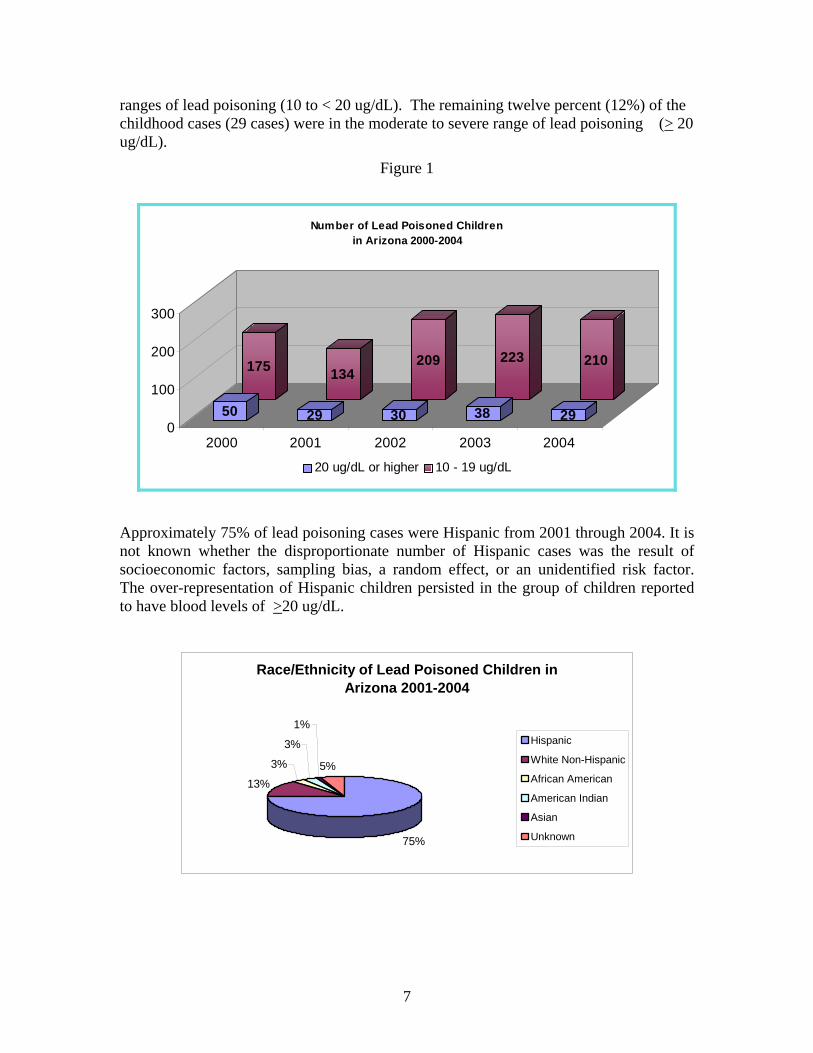
ranges of lead poisoning (10 to < 20 ug/dL). The remaining twelve percent (12%) of the childhood cases (29 cases) were in the moderate to severe range of lead poisoning (> 20 ug/dL).
Figure 1
175 134209 223 210
50 29 30 38 290
100
200
300
2000 2001 2002 2003 2004
Number of Lead Poisoned Childrenin Arizona 2000-2004
20 ug/dL or higher 10 - 19 ug/dL
Approximately 75% of lead poisoning cases were Hispanic from 2001 through 2004. It is not known whether the disproportionate number of Hispanic cases was the result of socioeconomic factors, sampling bias, a random effect, or an unidentified risk factor. The over-representation of Hispanic children persisted in the group of children reported to have blood levels of >20 ug/dL.
Race/Ethnicity of Lead Poisoned Children in Arizona 2001-2004
75%
13%
3%
3%
1%
5%
Hispanic
White Non-Hispanic
African American
American Indian
Asian
Unknown
7
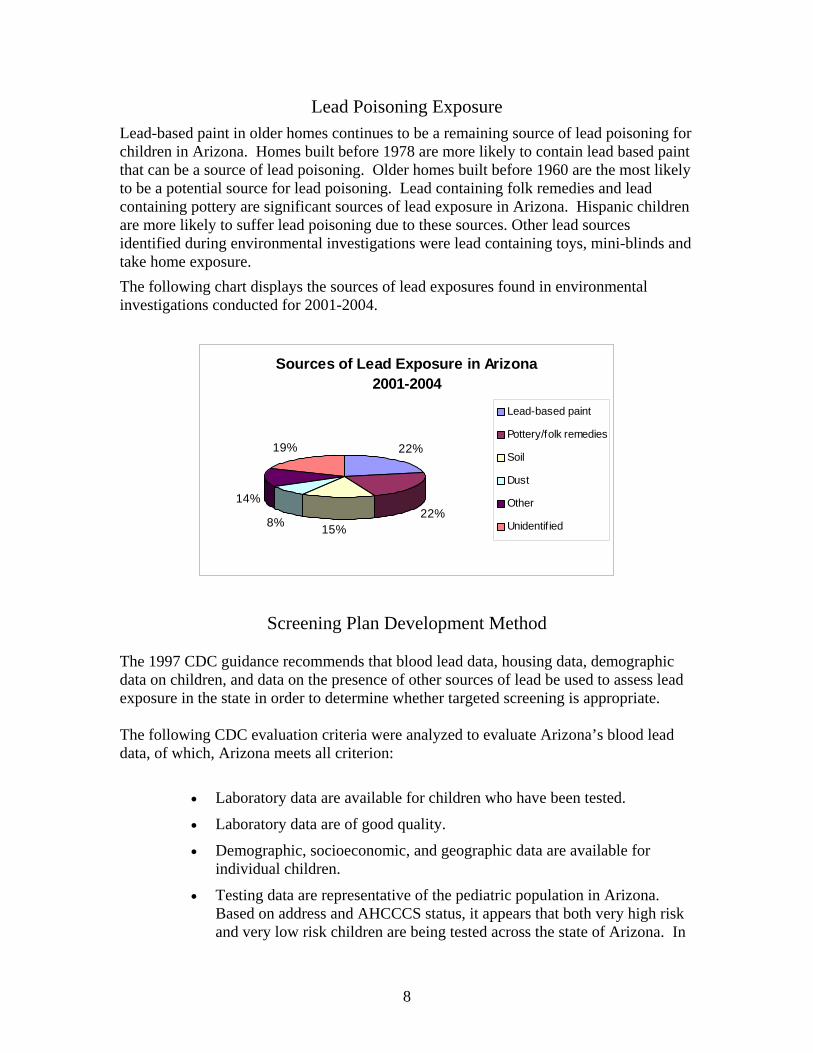
Lead Poisoning Exposure Lead-based paint in older homes continues to be a remaining source of lead poisoning for children in Arizona. Homes built before 1978 are more likely to contain lead based paint that can be a source of lead poisoning. Older homes built before 1960 are the most likely to be a potential source for lead poisoning. Lead containing folk remedies and lead containing pottery are significant sources of lead exposure in Arizona. Hispanic children are more likely to suffer lead poisoning due to these sources. Other lead sources identified during environmental investigations were lead containing toys, mini-blinds and take home exposure. The following chart displays the sources of lead exposures found in environmental investigations conducted for 2001-2004.
Sources of Lead Exposure in Arizona 2001-2004
22%
22%15%8%
14%
19%
Lead-based paint
Pottery/folk remedies
Soil
Dust
Other
Unidentif ied
Screening Plan Development Method The 1997 CDC guidance recommends that blood lead data, housing data, demographic data on children, and data on the presence of other sources of lead be used to assess lead exposure in the state in order to determine whether targeted screening is appropriate. The following CDC evaluation criteria were analyzed to evaluate Arizona’s blood lead data, of which, Arizona meets all criterion:
• Laboratory data are available for children who have been tested.
• Laboratory data are of good quality.
• Demographic, socioeconomic, and geographic data are available for individual children.
• Testing data are representative of the pediatric population in Arizona. Based on address and AHCCCS status, it appears that both very high risk and very low risk children are being tested across the state of Arizona. In
8
ZIP Codes where testing numbers are low, the risk of lead exposure can be estimated by reviewing pre-1960 housing.
• Testing data are available for a sample that is large enough to allow for a valid estimate of prevalence to be made. In ZIP Codes where testing numbers are low, the risk of lead exposure can be estimated by reviewing pre-1960 housing.
• Labs reporting data should be successful participants in an approved proficiency testing program.
• Blood lead level tests should be maintained in a way that allows identification of duplicate and sequential tests on a single child. It must be possible to distinguish between the number of children tested and the number of tests performed.
• The results of all tests, regardless of blood lead levels, should be available, so that calculation of rates of elevated blood lead levels among tested children can take place.
• The data should be representative, i.e., the demographic, socioeconomic, and geographic distribution of children screened should be similar to that of all children in the jurisdiction.
Determining the Targeted Screening Boundaries Using Census Tracts
The Arizona Department of Health Services and the Coalition determined that Arizona’s blood lead data meets the criteria to be useful in assessing the lead exposure of Arizona children and the boundaries of the recommendation area should be set. The 2005 Targeted Screening Plan updates the 2003 Targeted Screening Plan by further defining the boundaries of children at risk of lead poisoning by identifying areas by census tract for each county in Arizona.
Targeted Screening Thresholds
The Arizona Department of Health Services and the Coalition uses available 2000 Census data, lead poisoning prevalence rates and pre-1960 housing data for each of the census tracts in Arizona. The 2005 Arizona Lead Poisoning Risk Index (LPRI) formula for census tracts is:
LPRI = [A + B + C + D + {E/(F x G)}] where: A = % of total population being children age 0-5 years old Source: Percentage of population age 0-5 years old, Census 2000 SF 1, PCT12 Sex by Age (209), 100 percent data – Universe: Total population. B = % of total housing stock built prior to 1960 Source: Percentage of housing built prior to 1960, Census 2000 SF 3, H34 Year Structure Built (10), sample data – Universe: Housing units.
9
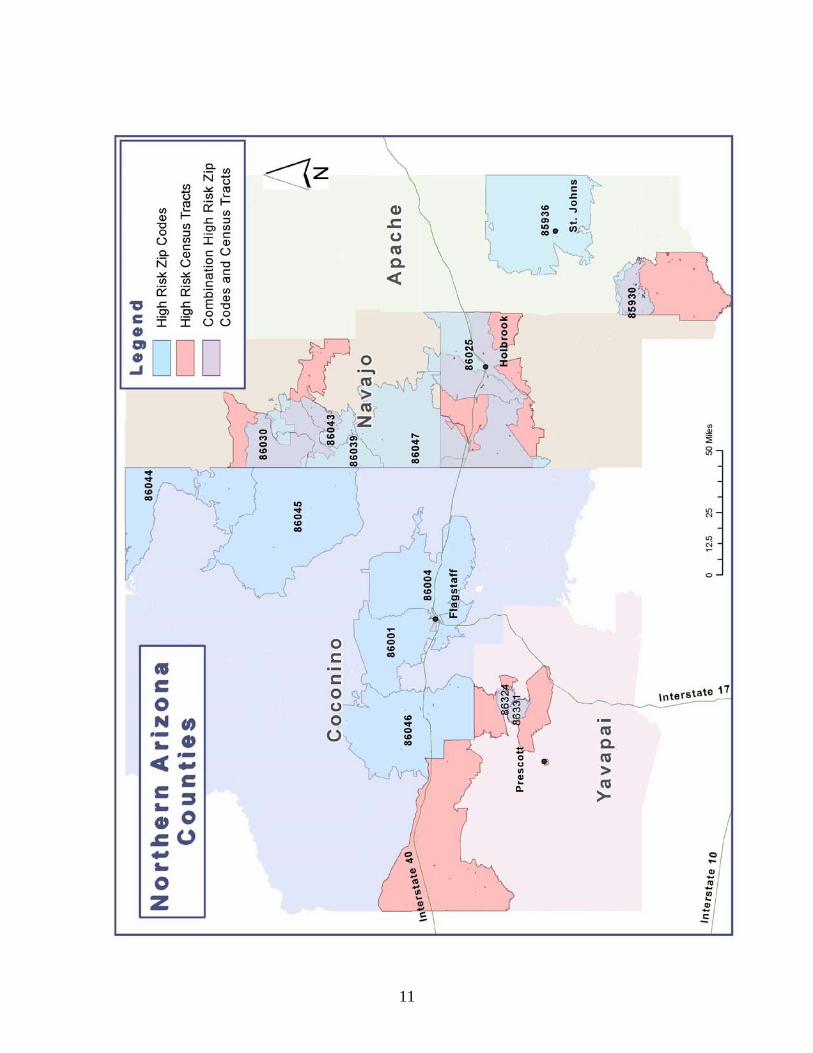
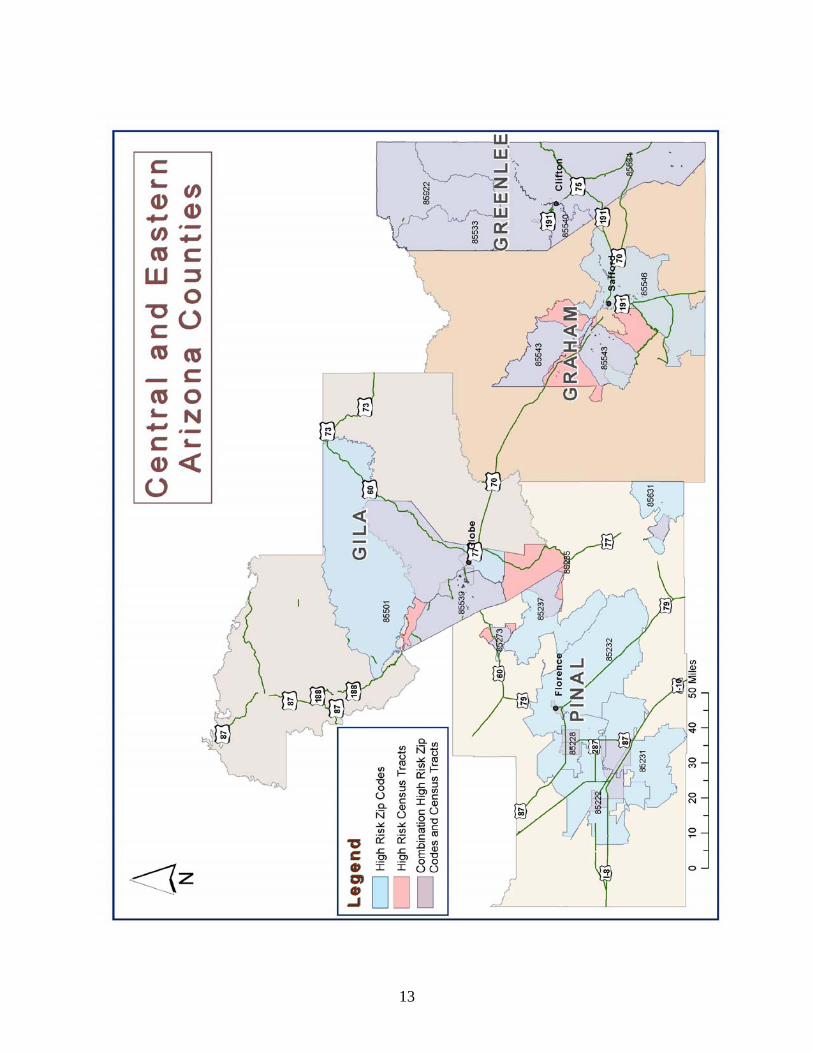
C = % of total households being exclusively Spanish speaking Source: Percentage of households exclusively Spanish speaking, Census 2000 SF 3, P20 Household Language (14), sample data – Universe: Households. D = % of families with children age 0-4 whose 1999 income was below poverty level Source: Percentage of families with children age 0-4 years whose income in 1999 below poverty level, Census 2000 SF3, P90 Poverty Status in 1999 of Families by Family Type by Presence of Related Children Under 18 Years by Age of Related Children (41), sample data – Universe: Families. E = Number of children age 0-5 years with a blood lead level of 10 µg/dL or higher between 2001-2004. Source: AZ CLPPP registry of lead poisoned children. F = Number of children age 0-5 Source: Total number of children age 0-5, Census 2000 SF 1, PCT12 Sex by Age (209), 100 percent data – Universe: Total population. G = Average AHCCCS screening percentage = 0.117 Source: Arizona Health Care Cost Containment System Blood Lead Draw Data 2002-2003. The LPRI equation was applied to every census tract in Arizona (1,059 total). The Statewide average risk index is 0.299. The high-risk tracts are defined as census tracts with a LPRI ≥ 0.359. This results in 322 census tracts identified as high risk in all 15 of Arizona’s counties. The following tables display the results of the lead poisoning risk index calculations for the high-risk census tracts by county. The zip code and city have been added to allow a general idea where the tract is located within the county.
Apache
High Risk Census Tracts Lead Poisoning Risk Index Geography Zip Code Apache CT 9401 0.660 McNary 85930 Apache CT 9703 0.370 St. Johns 85936
Navajo
High Risk Census Tracts Lead Poisoning Risk Index Geography Zip Code Navajo CT 9410 0.424 SE County 86039, 86043 Navajo CT 9602 0.466 Holbrook 86025 Navajo CT 9604 0.732 Winslow 86047 Navajo CT 9605 0.455 NW County 86030, 86503 Navajo CT 9606 0.506 Winslow 86047
10
11
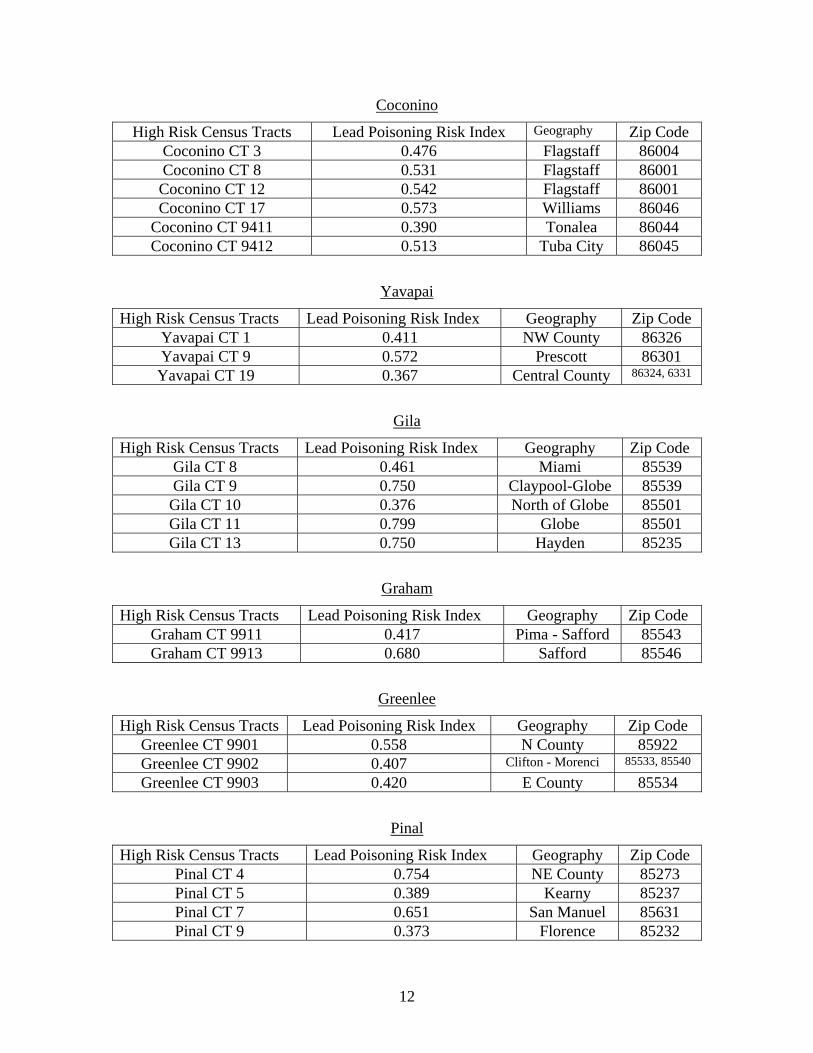
Coconino
High Risk Census Tracts Lead Poisoning Risk Index Geography Zip Code Coconino CT 3 0.476 Flagstaff 86004 Coconino CT 8 0.531 Flagstaff 86001 Coconino CT 12 0.542 Flagstaff 86001 Coconino CT 17 0.573 Williams 86046
Coconino CT 9411 0.390 Tonalea 86044 Coconino CT 9412 0.513 Tuba City 86045
Yavapai
High Risk Census Tracts Lead Poisoning Risk Index Geography Zip Code Yavapai CT 1 0.411 NW County 86326 Yavapai CT 9 0.572 Prescott 86301 Yavapai CT 19 0.367 Central County 86324, 6331
Gila
High Risk Census Tracts Lead Poisoning Risk Index Geography Zip Code Gila CT 8 0.461 Miami 85539 Gila CT 9 0.750 Claypool-Globe 85539 Gila CT 10 0.376 North of Globe 85501 Gila CT 11 0.799 Globe 85501 Gila CT 13 0.750 Hayden 85235
Graham
High Risk Census Tracts Lead Poisoning Risk Index Geography Zip Code Graham CT 9911 0.417 Pima - Safford 85543 Graham CT 9913 0.680 Safford 85546
Greenlee
High Risk Census Tracts Lead Poisoning Risk Index Geography Zip Code Greenlee CT 9901 0.558 N County 85922 Greenlee CT 9902 0.407 Clifton - Morenci 85533, 85540
Greenlee CT 9903 0.420 E County 85534
Pinal
High Risk Census Tracts Lead Poisoning Risk Index Geography Zip Code Pinal CT 4 0.754 NE County 85273 Pinal CT 5 0.389 Kearny 85237 Pinal CT 7 0.651 San Manuel 85631 Pinal CT 9 0.373 Florence 85232
12
13
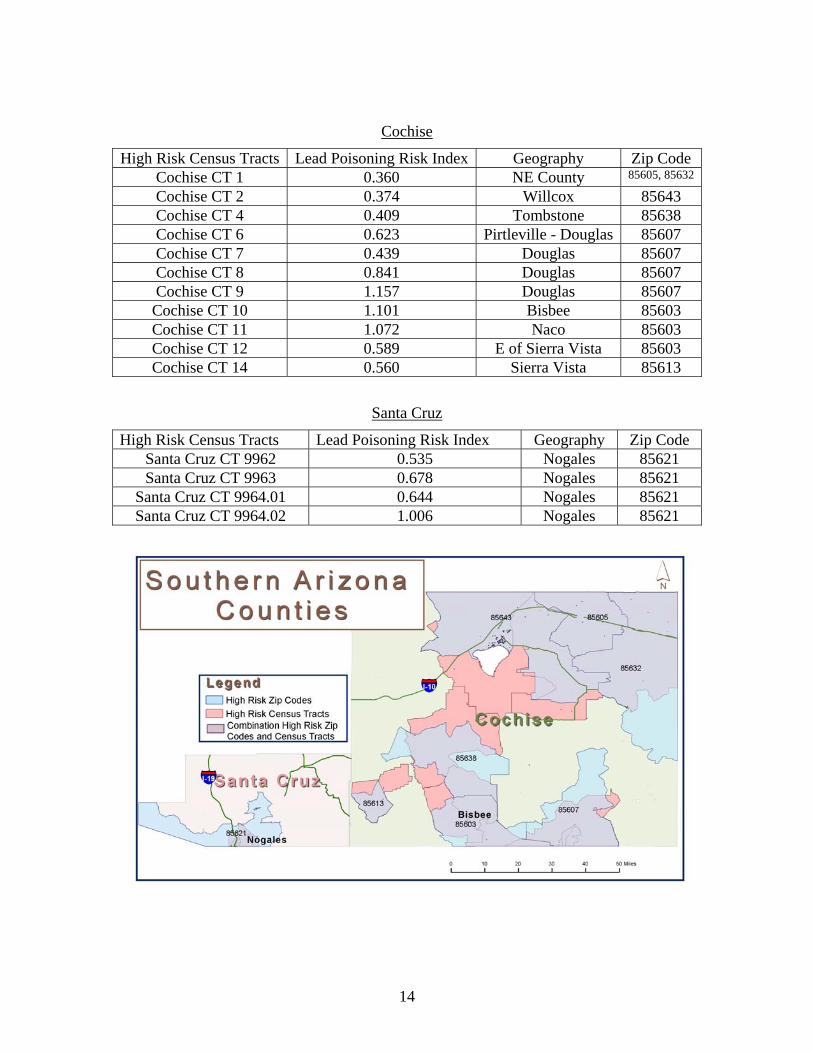
Cochise
High Risk Census Tracts Lead Poisoning Risk Index Geography Zip Code Cochise CT 1 0.360 NE County 85605, 85632
Cochise CT 2 0.374 Willcox 85643 Cochise CT 4 0.409 Tombstone 85638 Cochise CT 6 0.623 Pirtleville - Douglas 85607 Cochise CT 7 0.439 Douglas 85607 Cochise CT 8 0.841 Douglas 85607 Cochise CT 9 1.157 Douglas 85607 Cochise CT 10 1.101 Bisbee 85603 Cochise CT 11 1.072 Naco 85603 Cochise CT 12 0.589 E of Sierra Vista 85603 Cochise CT 14 0.560 Sierra Vista 85613
Santa Cruz
High Risk Census Tracts Lead Poisoning Risk Index Geography Zip Code Santa Cruz CT 9962 0.535 Nogales 85621 Santa Cruz CT 9963 0.678 Nogales 85621
Santa Cruz CT 9964.01 0.644 Nogales 85621 Santa Cruz CT 9964.02 1.006 Nogales 85621
14
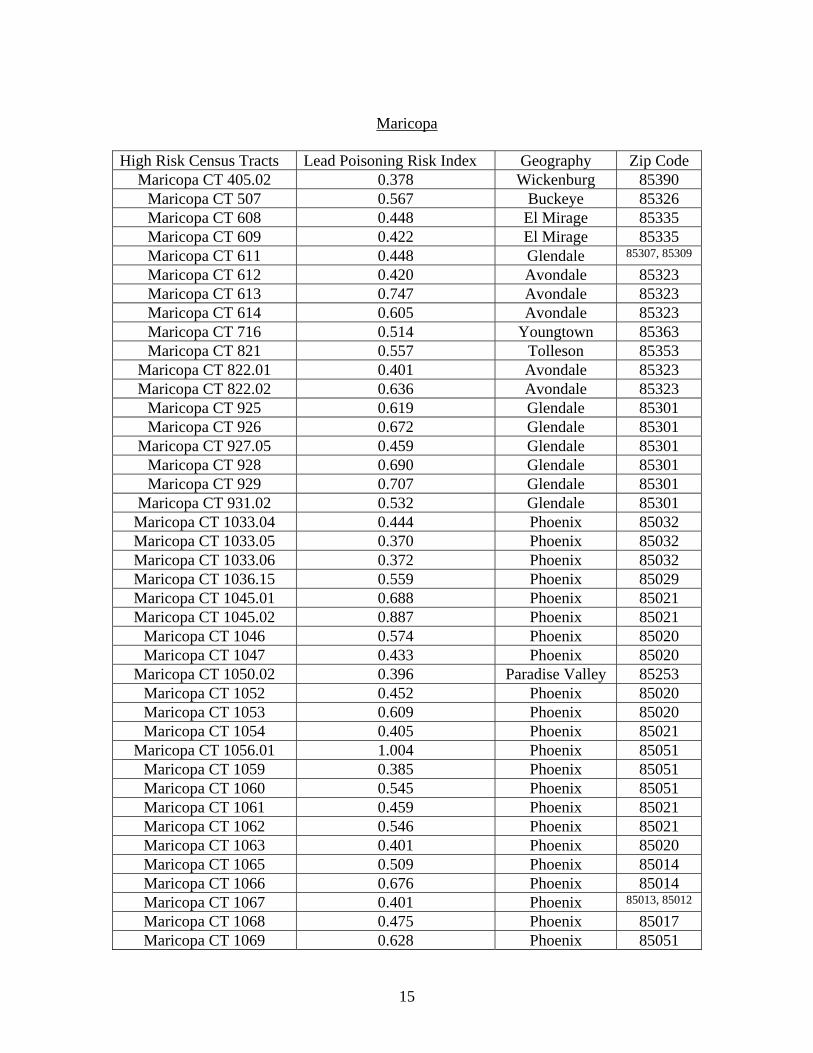
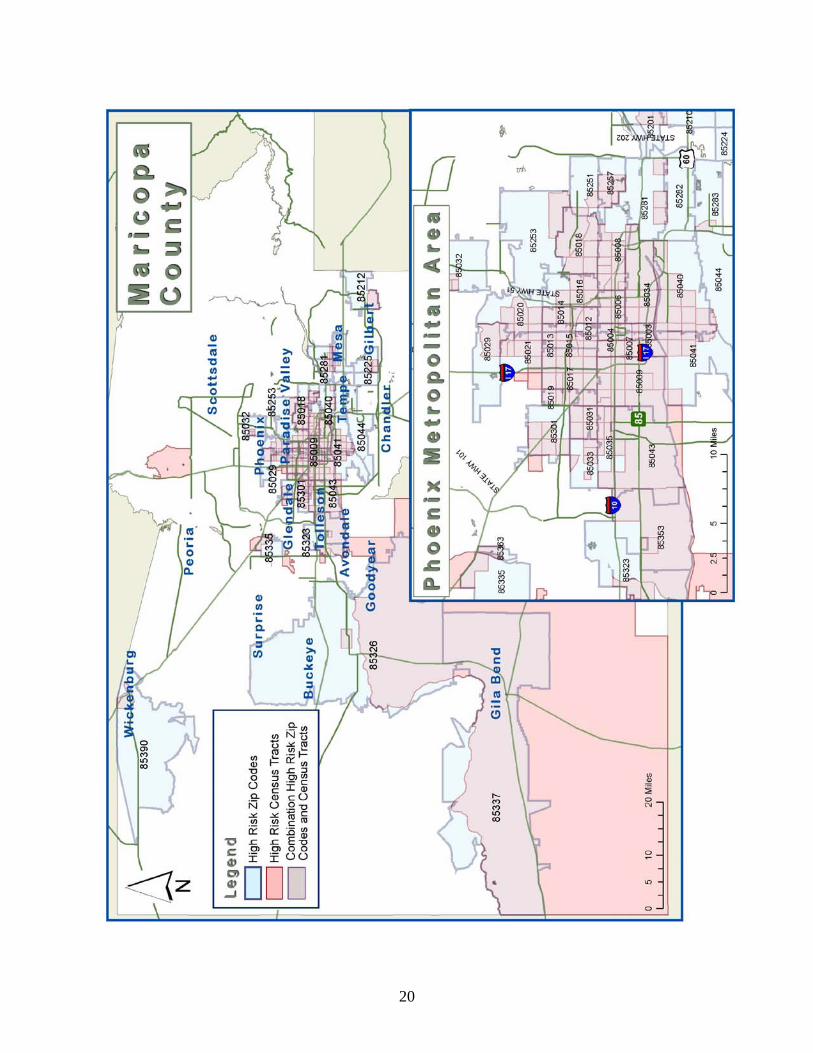
Maricopa
High Risk Census Tracts Lead Poisoning Risk Index Geography Zip Code
Maricopa CT 405.02 0.378 Wickenburg 85390 Maricopa CT 507 0.567 Buckeye 85326 Maricopa CT 608 0.448 El Mirage 85335 Maricopa CT 609 0.422 El Mirage 85335 Maricopa CT 611 0.448 Glendale 85307, 85309
Maricopa CT 612 0.420 Avondale 85323 Maricopa CT 613 0.747 Avondale 85323 Maricopa CT 614 0.605 Avondale 85323 Maricopa CT 716 0.514 Youngtown 85363 Maricopa CT 821 0.557 Tolleson 85353
Maricopa CT 822.01 0.401 Avondale 85323 Maricopa CT 822.02 0.636 Avondale 85323
Maricopa CT 925 0.619 Glendale 85301 Maricopa CT 926 0.672 Glendale 85301
Maricopa CT 927.05 0.459 Glendale 85301 Maricopa CT 928 0.690 Glendale 85301 Maricopa CT 929 0.707 Glendale 85301
Maricopa CT 931.02 0.532 Glendale 85301 Maricopa CT 1033.04 0.444 Phoenix 85032 Maricopa CT 1033.05 0.370 Phoenix 85032 Maricopa CT 1033.06 0.372 Phoenix 85032 Maricopa CT 1036.15 0.559 Phoenix 85029 Maricopa CT 1045.01 0.688 Phoenix 85021 Maricopa CT 1045.02 0.887 Phoenix 85021
Maricopa CT 1046 0.574 Phoenix 85020 Maricopa CT 1047 0.433 Phoenix 85020
Maricopa CT 1050.02 0.396 Paradise Valley 85253 Maricopa CT 1052 0.452 Phoenix 85020 Maricopa CT 1053 0.609 Phoenix 85020 Maricopa CT 1054 0.405 Phoenix 85021
Maricopa CT 1056.01 1.004 Phoenix 85051 Maricopa CT 1059 0.385 Phoenix 85051 Maricopa CT 1060 0.545 Phoenix 85051 Maricopa CT 1061 0.459 Phoenix 85021 Maricopa CT 1062 0.546 Phoenix 85021 Maricopa CT 1063 0.401 Phoenix 85020 Maricopa CT 1065 0.509 Phoenix 85014 Maricopa CT 1066 0.676 Phoenix 85014 Maricopa CT 1067 0.401 Phoenix 85013, 85012
Maricopa CT 1068 0.475 Phoenix 85017 Maricopa CT 1069 0.628 Phoenix 85051
15
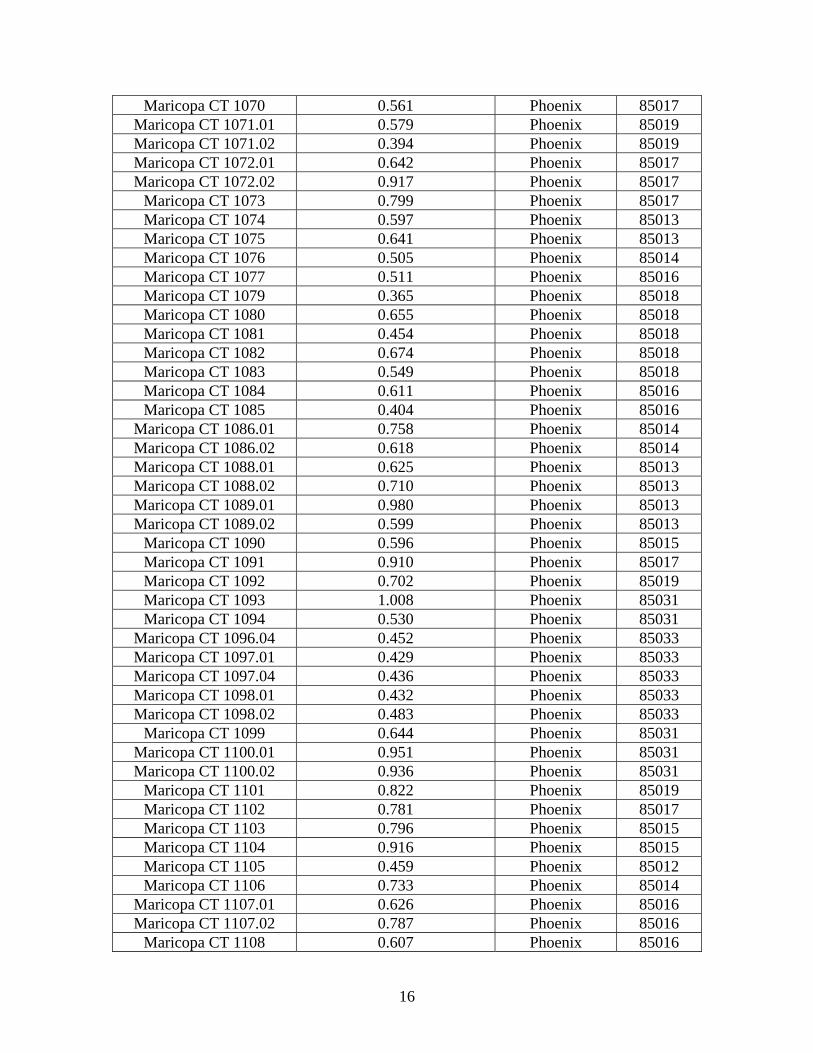
Maricopa CT 1070 0.561 Phoenix 85017 Maricopa CT 1071.01 0.579 Phoenix 85019 Maricopa CT 1071.02 0.394 Phoenix 85019 Maricopa CT 1072.01 0.642 Phoenix 85017 Maricopa CT 1072.02 0.917 Phoenix 85017
Maricopa CT 1073 0.799 Phoenix 85017 Maricopa CT 1074 0.597 Phoenix 85013 Maricopa CT 1075 0.641 Phoenix 85013 Maricopa CT 1076 0.505 Phoenix 85014 Maricopa CT 1077 0.511 Phoenix 85016 Maricopa CT 1079 0.365 Phoenix 85018 Maricopa CT 1080 0.655 Phoenix 85018 Maricopa CT 1081 0.454 Phoenix 85018 Maricopa CT 1082 0.674 Phoenix 85018 Maricopa CT 1083 0.549 Phoenix 85018 Maricopa CT 1084 0.611 Phoenix 85016 Maricopa CT 1085 0.404 Phoenix 85016
Maricopa CT 1086.01 0.758 Phoenix 85014 Maricopa CT 1086.02 0.618 Phoenix 85014 Maricopa CT 1088.01 0.625 Phoenix 85013 Maricopa CT 1088.02 0.710 Phoenix 85013 Maricopa CT 1089.01 0.980 Phoenix 85013 Maricopa CT 1089.02 0.599 Phoenix 85013
Maricopa CT 1090 0.596 Phoenix 85015 Maricopa CT 1091 0.910 Phoenix 85017 Maricopa CT 1092 0.702 Phoenix 85019 Maricopa CT 1093 1.008 Phoenix 85031 Maricopa CT 1094 0.530 Phoenix 85031
Maricopa CT 1096.04 0.452 Phoenix 85033 Maricopa CT 1097.01 0.429 Phoenix 85033 Maricopa CT 1097.04 0.436 Phoenix 85033 Maricopa CT 1098.01 0.432 Phoenix 85033 Maricopa CT 1098.02 0.483 Phoenix 85033
Maricopa CT 1099 0.644 Phoenix 85031 Maricopa CT 1100.01 0.951 Phoenix 85031 Maricopa CT 1100.02 0.936 Phoenix 85031
Maricopa CT 1101 0.822 Phoenix 85019 Maricopa CT 1102 0.781 Phoenix 85017 Maricopa CT 1103 0.796 Phoenix 85015 Maricopa CT 1104 0.916 Phoenix 85015 Maricopa CT 1105 0.459 Phoenix 85012 Maricopa CT 1106 0.733 Phoenix 85014
Maricopa CT 1107.01 0.626 Phoenix 85016 Maricopa CT 1107.02 0.787 Phoenix 85016
Maricopa CT 1108 0.607 Phoenix 85016
16
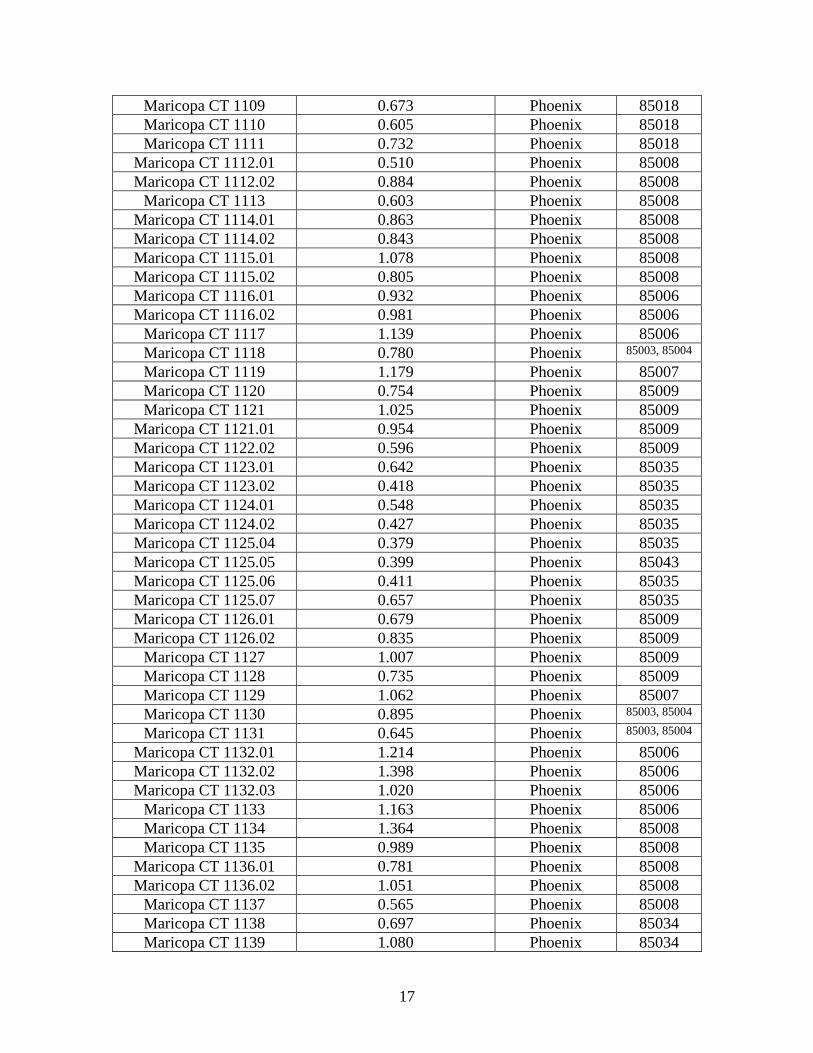
Maricopa CT 1109 0.673 Phoenix 85018 Maricopa CT 1110 0.605 Phoenix 85018 Maricopa CT 1111 0.732 Phoenix 85018
Maricopa CT 1112.01 0.510 Phoenix 85008 Maricopa CT 1112.02 0.884 Phoenix 85008
Maricopa CT 1113 0.603 Phoenix 85008 Maricopa CT 1114.01 0.863 Phoenix 85008 Maricopa CT 1114.02 0.843 Phoenix 85008 Maricopa CT 1115.01 1.078 Phoenix 85008 Maricopa CT 1115.02 0.805 Phoenix 85008 Maricopa CT 1116.01 0.932 Phoenix 85006 Maricopa CT 1116.02 0.981 Phoenix 85006
Maricopa CT 1117 1.139 Phoenix 85006 Maricopa CT 1118 0.780 Phoenix 85003, 85004
Maricopa CT 1119 1.179 Phoenix 85007 Maricopa CT 1120 0.754 Phoenix 85009 Maricopa CT 1121 1.025 Phoenix 85009
Maricopa CT 1121.01 0.954 Phoenix 85009 Maricopa CT 1122.02 0.596 Phoenix 85009 Maricopa CT 1123.01 0.642 Phoenix 85035 Maricopa CT 1123.02 0.418 Phoenix 85035 Maricopa CT 1124.01 0.548 Phoenix 85035 Maricopa CT 1124.02 0.427 Phoenix 85035 Maricopa CT 1125.04 0.379 Phoenix 85035 Maricopa CT 1125.05 0.399 Phoenix 85043 Maricopa CT 1125.06 0.411 Phoenix 85035 Maricopa CT 1125.07 0.657 Phoenix 85035 Maricopa CT 1126.01 0.679 Phoenix 85009 Maricopa CT 1126.02 0.835 Phoenix 85009
Maricopa CT 1127 1.007 Phoenix 85009 Maricopa CT 1128 0.735 Phoenix 85009 Maricopa CT 1129 1.062 Phoenix 85007 Maricopa CT 1130 0.895 Phoenix 85003, 85004
Maricopa CT 1131 0.645 Phoenix 85003, 85004
Maricopa CT 1132.01 1.214 Phoenix 85006 Maricopa CT 1132.02 1.398 Phoenix 85006 Maricopa CT 1132.03 1.020 Phoenix 85006
Maricopa CT 1133 1.163 Phoenix 85006 Maricopa CT 1134 1.364 Phoenix 85008 Maricopa CT 1135 0.989 Phoenix 85008
Maricopa CT 1136.01 0.781 Phoenix 85008 Maricopa CT 1136.02 1.051 Phoenix 85008
Maricopa CT 1137 0.565 Phoenix 85008 Maricopa CT 1138 0.697 Phoenix 85034 Maricopa CT 1139 1.080 Phoenix 85034
17
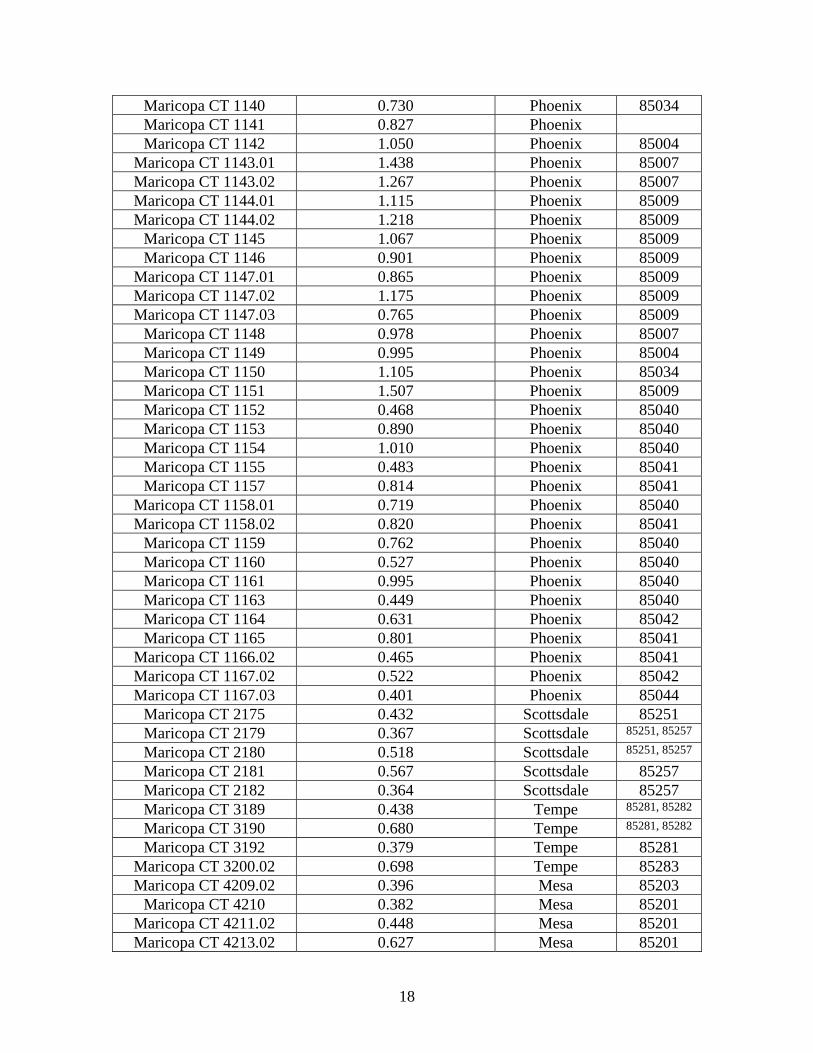
Maricopa CT 1140 0.730 Phoenix 85034 Maricopa CT 1141 0.827 Phoenix Maricopa CT 1142 1.050 Phoenix 85004
Maricopa CT 1143.01 1.438 Phoenix 85007 Maricopa CT 1143.02 1.267 Phoenix 85007 Maricopa CT 1144.01 1.115 Phoenix 85009 Maricopa CT 1144.02 1.218 Phoenix 85009
Maricopa CT 1145 1.067 Phoenix 85009 Maricopa CT 1146 0.901 Phoenix 85009
Maricopa CT 1147.01 0.865 Phoenix 85009 Maricopa CT 1147.02 1.175 Phoenix 85009 Maricopa CT 1147.03 0.765 Phoenix 85009
Maricopa CT 1148 0.978 Phoenix 85007 Maricopa CT 1149 0.995 Phoenix 85004 Maricopa CT 1150 1.105 Phoenix 85034 Maricopa CT 1151 1.507 Phoenix 85009 Maricopa CT 1152 0.468 Phoenix 85040 Maricopa CT 1153 0.890 Phoenix 85040 Maricopa CT 1154 1.010 Phoenix 85040 Maricopa CT 1155 0.483 Phoenix 85041 Maricopa CT 1157 0.814 Phoenix 85041
Maricopa CT 1158.01 0.719 Phoenix 85040 Maricopa CT 1158.02 0.820 Phoenix 85041
Maricopa CT 1159 0.762 Phoenix 85040 Maricopa CT 1160 0.527 Phoenix 85040 Maricopa CT 1161 0.995 Phoenix 85040 Maricopa CT 1163 0.449 Phoenix 85040 Maricopa CT 1164 0.631 Phoenix 85042 Maricopa CT 1165 0.801 Phoenix 85041
Maricopa CT 1166.02 0.465 Phoenix 85041 Maricopa CT 1167.02 0.522 Phoenix 85042 Maricopa CT 1167.03 0.401 Phoenix 85044
Maricopa CT 2175 0.432 Scottsdale 85251 Maricopa CT 2179 0.367 Scottsdale 85251, 85257
Maricopa CT 2180 0.518 Scottsdale 85251, 85257 Maricopa CT 2181 0.567 Scottsdale 85257 Maricopa CT 2182 0.364 Scottsdale 85257 Maricopa CT 3189 0.438 Tempe 85281, 85282
Maricopa CT 3190 0.680 Tempe 85281, 85282 Maricopa CT 3192 0.379 Tempe 85281
Maricopa CT 3200.02 0.698 Tempe 85283 Maricopa CT 4209.02 0.396 Mesa 85203
Maricopa CT 4210 0.382 Mesa 85201 Maricopa CT 4211.02 0.448 Mesa 85201 Maricopa CT 4213.02 0.627 Mesa 85201
18
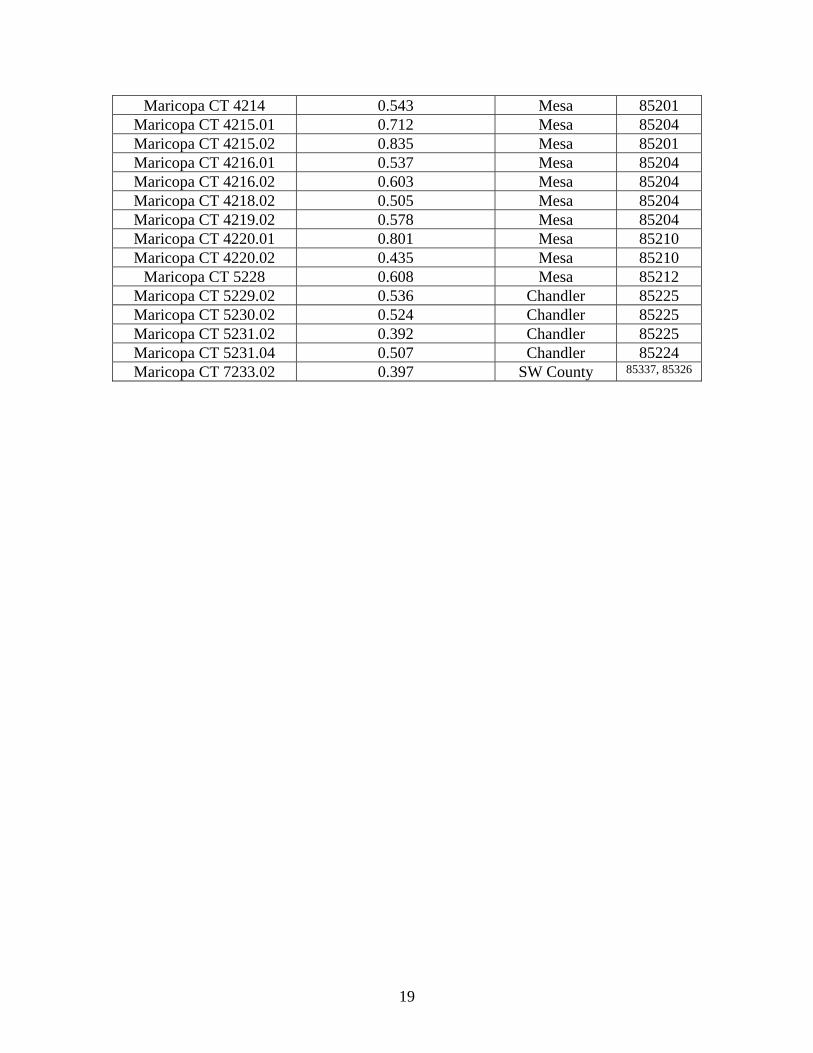
Maricopa CT 4214 0.543 Mesa 85201 Maricopa CT 4215.01 0.712 Mesa 85204 Maricopa CT 4215.02 0.835 Mesa 85201 Maricopa CT 4216.01 0.537 Mesa 85204 Maricopa CT 4216.02 0.603 Mesa 85204 Maricopa CT 4218.02 0.505 Mesa 85204 Maricopa CT 4219.02 0.578 Mesa 85204 Maricopa CT 4220.01 0.801 Mesa 85210 Maricopa CT 4220.02 0.435 Mesa 85210
Maricopa CT 5228 0.608 Mesa 85212 Maricopa CT 5229.02 0.536 Chandler 85225 Maricopa CT 5230.02 0.524 Chandler 85225 Maricopa CT 5231.02 0.392 Chandler 85225 Maricopa CT 5231.04 0.507 Chandler 85224 Maricopa CT 7233.02 0.397 SW County 85337, 85326
19
20
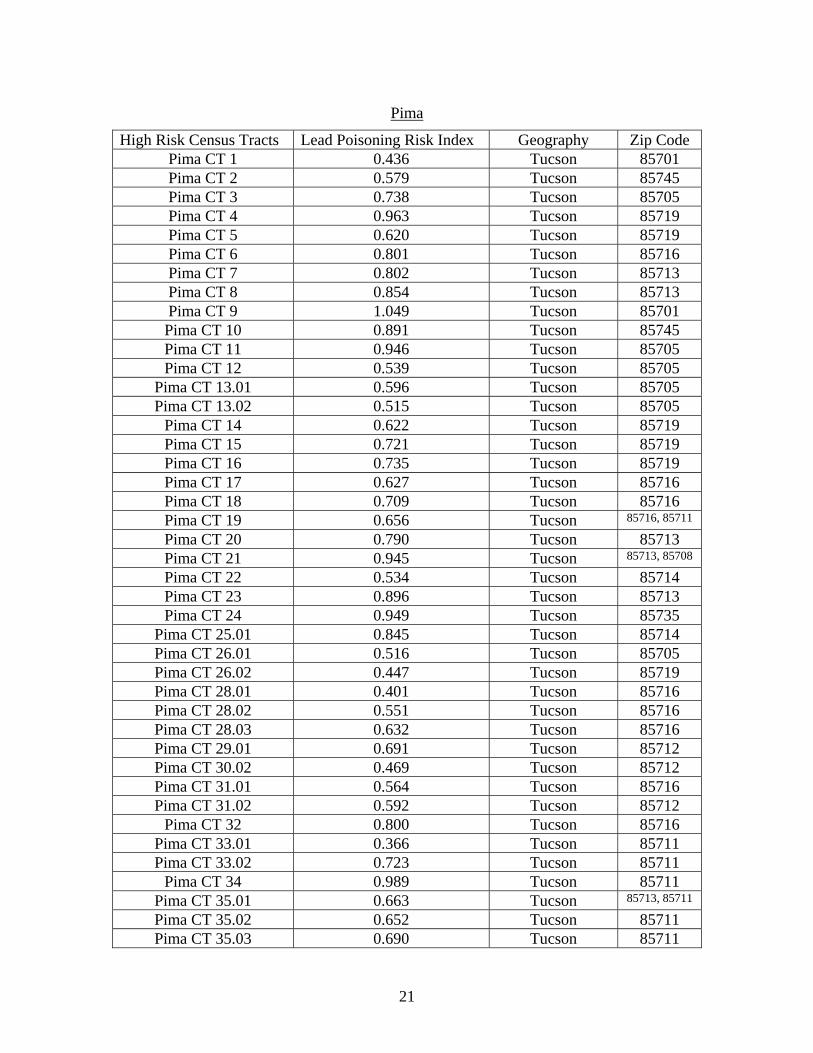
Pima
High Risk Census Tracts Lead Poisoning Risk Index Geography Zip Code Pima CT 1 0.436 Tucson 85701 Pima CT 2 0.579 Tucson 85745 Pima CT 3 0.738 Tucson 85705 Pima CT 4 0.963 Tucson 85719 Pima CT 5 0.620 Tucson 85719 Pima CT 6 0.801 Tucson 85716 Pima CT 7 0.802 Tucson 85713 Pima CT 8 0.854 Tucson 85713 Pima CT 9 1.049 Tucson 85701 Pima CT 10 0.891 Tucson 85745 Pima CT 11 0.946 Tucson 85705 Pima CT 12 0.539 Tucson 85705
Pima CT 13.01 0.596 Tucson 85705 Pima CT 13.02 0.515 Tucson 85705
Pima CT 14 0.622 Tucson 85719 Pima CT 15 0.721 Tucson 85719 Pima CT 16 0.735 Tucson 85719 Pima CT 17 0.627 Tucson 85716 Pima CT 18 0.709 Tucson 85716 Pima CT 19 0.656 Tucson 85716, 85711
Pima CT 20 0.790 Tucson 85713 Pima CT 21 0.945 Tucson 85713, 85708
Pima CT 22 0.534 Tucson 85714 Pima CT 23 0.896 Tucson 85713 Pima CT 24 0.949 Tucson 85735
Pima CT 25.01 0.845 Tucson 85714 Pima CT 26.01 0.516 Tucson 85705 Pima CT 26.02 0.447 Tucson 85719 Pima CT 28.01 0.401 Tucson 85716 Pima CT 28.02 0.551 Tucson 85716 Pima CT 28.03 0.632 Tucson 85716 Pima CT 29.01 0.691 Tucson 85712 Pima CT 30.02 0.469 Tucson 85712 Pima CT 31.01 0.564 Tucson 85716 Pima CT 31.02 0.592 Tucson 85712
Pima CT 32 0.800 Tucson 85716 Pima CT 33.01 0.366 Tucson 85711 Pima CT 33.02 0.723 Tucson 85711
Pima CT 34 0.989 Tucson 85711 Pima CT 35.01 0.663 Tucson 85713, 85711
Pima CT 35.02 0.652 Tucson 85711 Pima CT 35.03 0.690 Tucson 85711
21
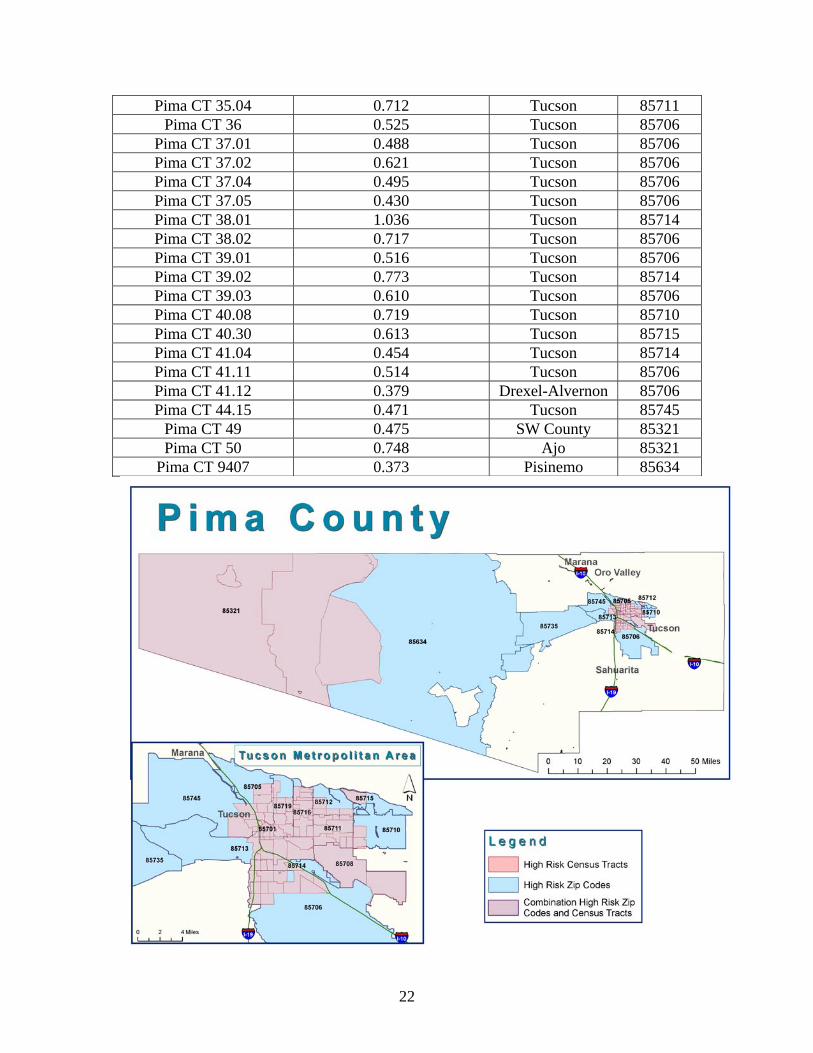
Pima CT 35.04 0.712 Tucson 85711 Pima CT 36 0.525 Tucson 85706
Pima CT 37.01 0.488 Tucson 85706 Pima CT 37.02 0.621 Tucson 85706 Pima CT 37.04 0.495 Tucson 85706 Pima CT 37.05 0.430 Tucson 85706 Pima CT 38.01 1.036 Tucson 85714 Pima CT 38.02 0.717 Tucson 85706 Pima CT 39.01 0.516 Tucson 85706 Pima CT 39.02 0.773 Tucson 85714 Pima CT 39.03 0.610 Tucson 85706 Pima CT 40.08 0.719 Tucson 85710 Pima CT 40.30 0.613 Tucson 85715 Pima CT 41.04 0.454 Tucson 85714 Pima CT 41.11 0.514 Tucson 85706 Pima CT 41.12 0.379 Drexel-Alvernon 85706 Pima CT 44.15 0.471 Tucson 85745
Pima CT 49 0.475 SW County 85321 Pima CT 50 0.748 Ajo 85321
Pima CT 9407 0.373 Pisinemo 85634
22
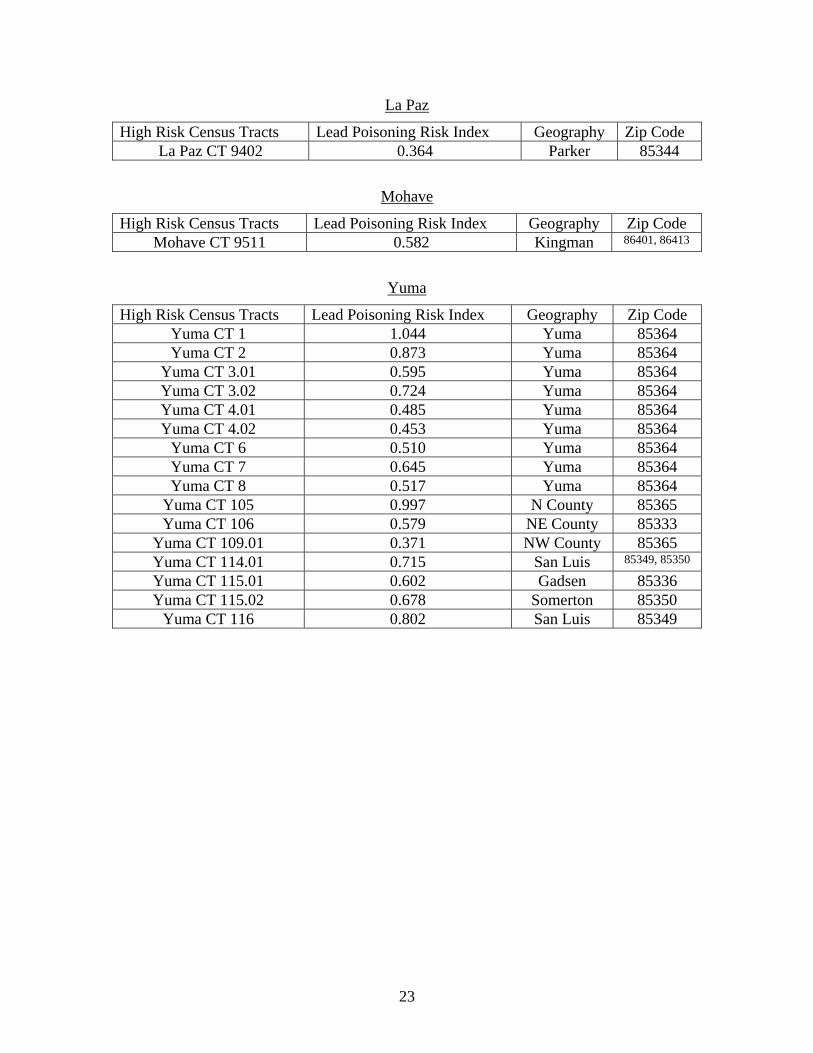
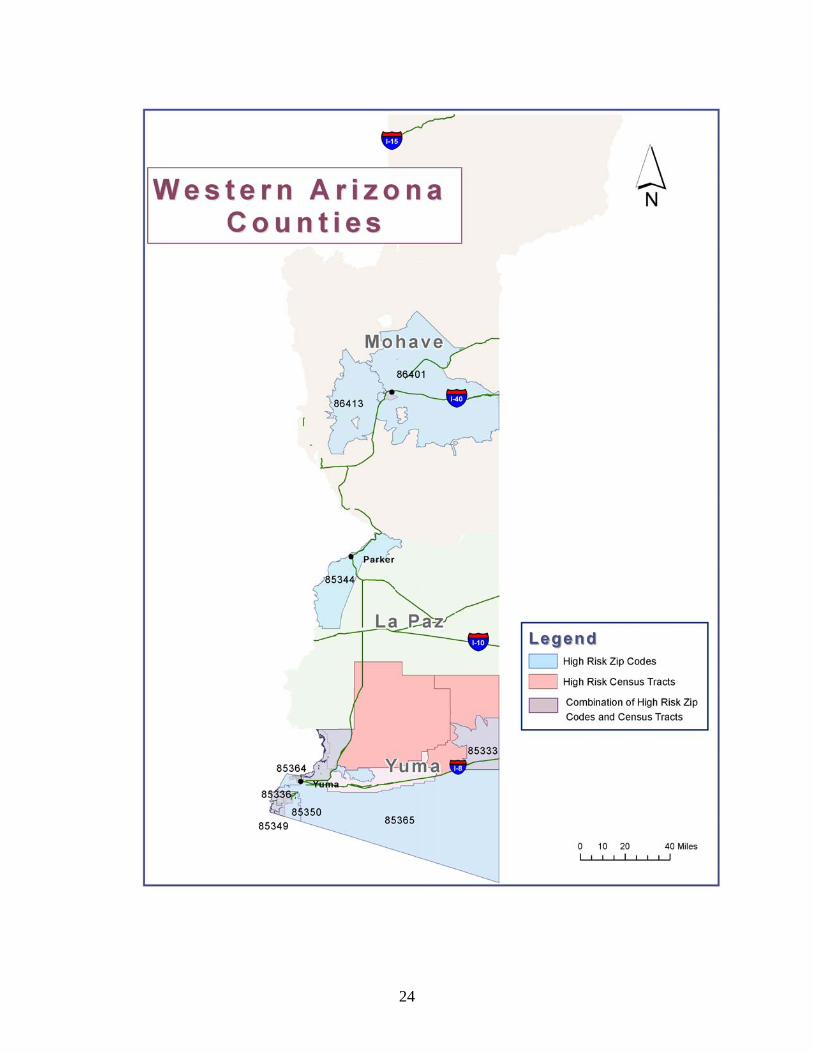
La Paz
High Risk Census Tracts Lead Poisoning Risk Index Geography Zip Code La Paz CT 9402 0.364 Parker 85344
Mohave
High Risk Census Tracts Lead Poisoning Risk Index Geography Zip Code Mohave CT 9511 0.582 Kingman 86401, 86413
Yuma
High Risk Census Tracts Lead Poisoning Risk Index Geography Zip Code Yuma CT 1 1.044 Yuma 85364 Yuma CT 2 0.873 Yuma 85364
Yuma CT 3.01 0.595 Yuma 85364 Yuma CT 3.02 0.724 Yuma 85364 Yuma CT 4.01 0.485 Yuma 85364 Yuma CT 4.02 0.453 Yuma 85364
Yuma CT 6 0.510 Yuma 85364 Yuma CT 7 0.645 Yuma 85364 Yuma CT 8 0.517 Yuma 85364
Yuma CT 105 0.997 N County 85365 Yuma CT 106 0.579 NE County 85333
Yuma CT 109.01 0.371 NW County 85365 Yuma CT 114.01 0.715 San Luis 85349, 85350
Yuma CT 115.01 0.602 Gadsen 85336 Yuma CT 115.02 0.678 Somerton 85350
Yuma CT 116 0.802 San Luis 85349
23
24
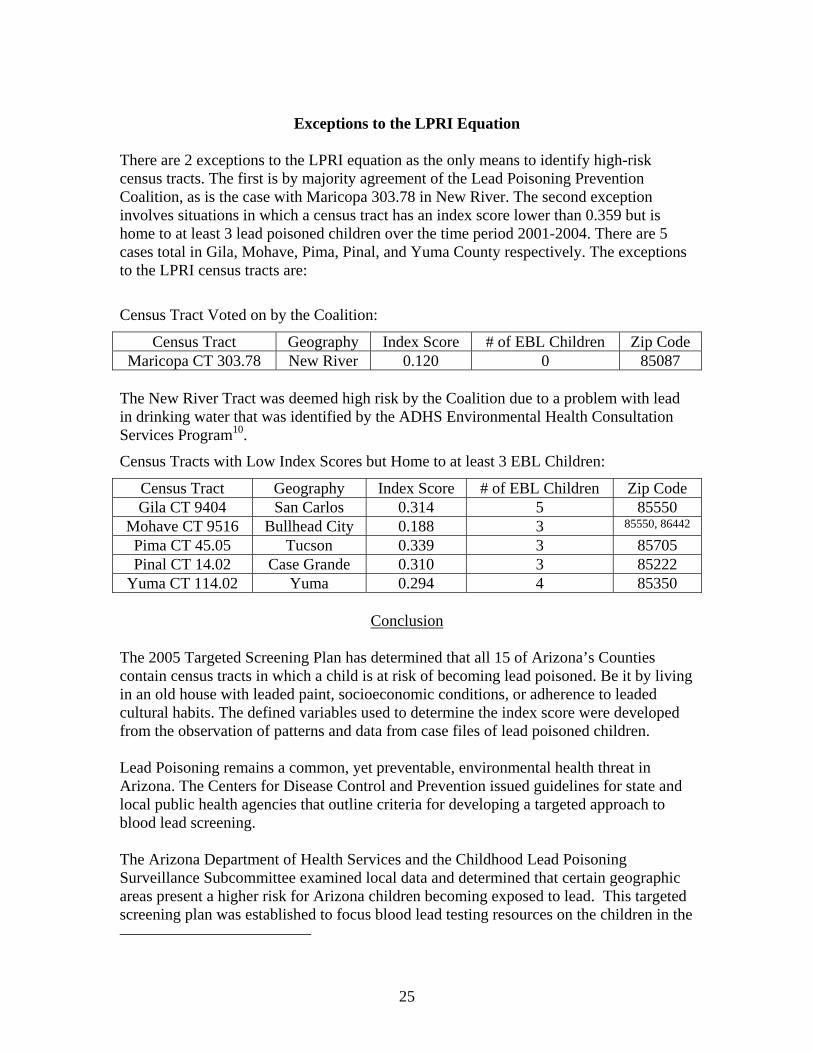
Exceptions to the LPRI Equation
There are 2 exceptions to the LPRI equation as the only means to identify high-risk census tracts. The first is by majority agreement of the Lead Poisoning Prevention Coalition, as is the case with Maricopa 303.78 in New River. The second exception involves situations in which a census tract has an index score lower than 0.359 but is home to at least 3 lead poisoned children over the time period 2001-2004. There are 5 cases total in Gila, Mohave, Pima, Pinal, and Yuma County respectively. The exceptions to the LPRI census tracts are:
Census Tract Voted on by the Coalition:
Census Tract Geography Index Score # of EBL Children Zip Code Maricopa CT 303.78 New River 0.120 0 85087
The New River Tract was deemed high risk by the Coalition due to a problem with lead in drinking water that was identified by the ADHS Environmental Health Consultation Services Program10.
Census Tracts with Low Index Scores but Home to at least 3 EBL Children:
Census Tract Geography Index Score # of EBL Children Zip Code Gila CT 9404 San Carlos 0.314 5 85550
Mohave CT 9516 Bullhead City 0.188 3 85550, 86442
Pima CT 45.05 Tucson 0.339 3 85705 Pinal CT 14.02 Case Grande 0.310 3 85222
Yuma CT 114.02 Yuma 0.294 4 85350
Conclusion The 2005 Targeted Screening Plan has determined that all 15 of Arizona’s Counties contain census tracts in which a child is at risk of becoming lead poisoned. Be it by living in an old house with leaded paint, socioeconomic conditions, or adherence to leaded cultural habits. The defined variables used to determine the index score were developed from the observation of patterns and data from case files of lead poisoned children. Lead Poisoning remains a common, yet preventable, environmental health threat in Arizona. The Centers for Disease Control and Prevention issued guidelines for state and local public health agencies that outline criteria for developing a targeted approach to blood lead screening. The Arizona Department of Health Services and the Childhood Lead Poisoning Surveillance Subcommittee examined local data and determined that certain geographic areas present a higher risk for Arizona children becoming exposed to lead. This targeted screening plan was established to focus blood lead testing resources on the children in the
25
state who are at higher risk for lead poisoning. This updated plan also supports the Arizona Health Care Cost Containment System (AHCCCS) mandatory blood lead test screening policy. Statewide support from local public health agencies, healthcare providers, managed-care organizations, Medicaid, private insurance organizations, and the community is essential for Arizona to meet the national goal of eliminating childhood lead poisoning by the year 2010.
References
1. Centers for Disease Control and Prevention. Preventing Lead Poisoning in Young Children: A Statement by the Centers for
Disease Control, October 1991. Atlanta, GA: US Dept of Health and Human Services; 1991
2. Robin LF, Beller M, Middaugh JP. Statewide assessment of lead poisoning and exposure risk among children receiving
Medicaid Services in Alaska. Pediatrics. 1997;99:E91-E96. http://www.pediatrics.org/cgi/content/full/99/4/e9
3. Nordin JD, Rolnick SJ, Griffin JM. Prevalence of excess lead absorption and associated risk factors in children enrolled in
a Midwestern health maintenance organization. Pediatrics. 1994;93:172-177
4. Tejeda DM, Wyatt DD, Rostek BR, Solomon WB. Do questions about lead exposure predict elevated lead levels?
Pediatrics. 1994;93:192-194
5. Binns HJ, LeBailly SA, Poncher J, Kinsella TR, Saunders SE. Is there lead in the suburbs? Risk assessment in Chicago
suburban pediatric practices. Pediatric Practice Research Group. Pediatrics. 1994;93:164-171
6. Snyder DC, Mohle-Boetani JC, Palla B, Fenstersheib M. Development of a population-specific risk assessment to predict
elevated blood lead levels in Santa Clara County, California. Pediatrics. 1995;96:643-648
7. France EK, Gitterman BA, Melinkovich P, Wright RA. The accuracy of a lead questionnaire in predicting elevated
pediatric blood lead levels. Arch Pediatr Adolesc Med. 1996;150:958-963
8. Centers for Disease Control and Prevention. Screening Young Children for Lead Poisoning. Guidance for State and Local
Public Health Officials. Atlanta, GA: US Dept of Health and Human Services, Public Health Service; November 1997
aCopies of this document can be obtained by request to Lead Poisoning Prevention Branch, Centers for Disease Control
and Prevention, Mail Stop F 42, 4770 Buford Hwy, NE, Atlanta, GA 30341-3724, or by calling 770-488-7330. The
document is also posted on the Internet at http://www.cdc.gov/nceh/programs/lead/guide/1997/guide97.htm
9. Centers for Disease Control and Prevention. Managing Elevated Blood Lead Levels Among Young Children:
Recommendations from the Advisory Committee on Childhood Lead Poisoning Prevention. Atlanta, GA: US Dept of
Health and Human Services, Public Health Service; March 2002
10. http:www.azdhs.gov/phs/oeh/pdf/new_river_consult_2004_final.pdf .
26
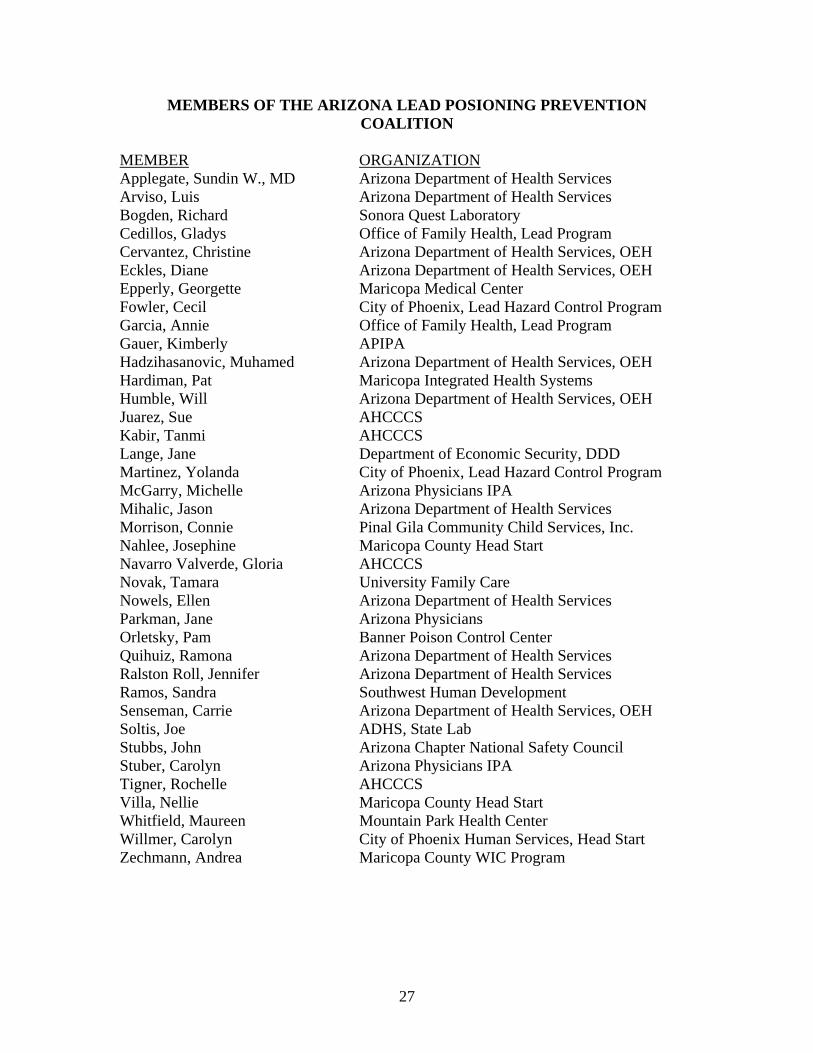
MEMBERS OF THE ARIZONA LEAD POSIONING PREVENTION COALITION
MEMBER ORGANIZATION Applegate, Sundin W., MD Arizona Department of Health Services Arviso, Luis Arizona Department of Health Services Bogden, Richard Sonora Quest Laboratory Cedillos, Gladys Office of Family Health, Lead Program Cervantez, Christine Arizona Department of Health Services, OEH Eckles, Diane Arizona Department of Health Services, OEH Epperly, Georgette Maricopa Medical Center Fowler, Cecil City of Phoenix, Lead Hazard Control Program Garcia, Annie Office of Family Health, Lead Program Gauer, Kimberly APIPA Hadzihasanovic, Muhamed Arizona Department of Health Services, OEH Hardiman, Pat Maricopa Integrated Health Systems Humble, Will Arizona Department of Health Services, OEH Juarez, Sue AHCCCS Kabir, Tanmi AHCCCS Lange, Jane Department of Economic Security, DDD Martinez, Yolanda City of Phoenix, Lead Hazard Control Program McGarry, Michelle Arizona Physicians IPA Mihalic, Jason Arizona Department of Health Services Morrison, Connie Pinal Gila Community Child Services, Inc. Nahlee, Josephine Maricopa County Head Start Navarro Valverde, Gloria AHCCCS Novak, Tamara University Family Care Nowels, Ellen Arizona Department of Health Services Parkman, Jane Arizona Physicians Orletsky, Pam Banner Poison Control Center Quihuiz, Ramona Arizona Department of Health Services Ralston Roll, Jennifer Arizona Department of Health Services Ramos, Sandra Southwest Human Development Senseman, Carrie Arizona Department of Health Services, OEH Soltis, Joe ADHS, State Lab Stubbs, John Arizona Chapter National Safety Council Stuber, Carolyn Arizona Physicians IPA Tigner, Rochelle AHCCCS Villa, Nellie Maricopa County Head Start Whitfield, Maureen Mountain Park Health Center Willmer, Carolyn City of Phoenix Human Services, Head Start Zechmann, Andrea Maricopa County WIC Program
27