Arizona / California Combined Crop Analysis 2017 Desert ...€¦ · Arizona / California Combined...
6
Arizona / California Combined Crop Analysis 2017 Desert Durum ® Crop Quality Report
Transcript of Arizona / California Combined Crop Analysis 2017 Desert ...€¦ · Arizona / California Combined...
Arizona / California Combined Crop Analysis
2017 Desert Durum® Crop Quality Report
2
2017 Desert Durum® Crop Quality Report
Desert Durum®
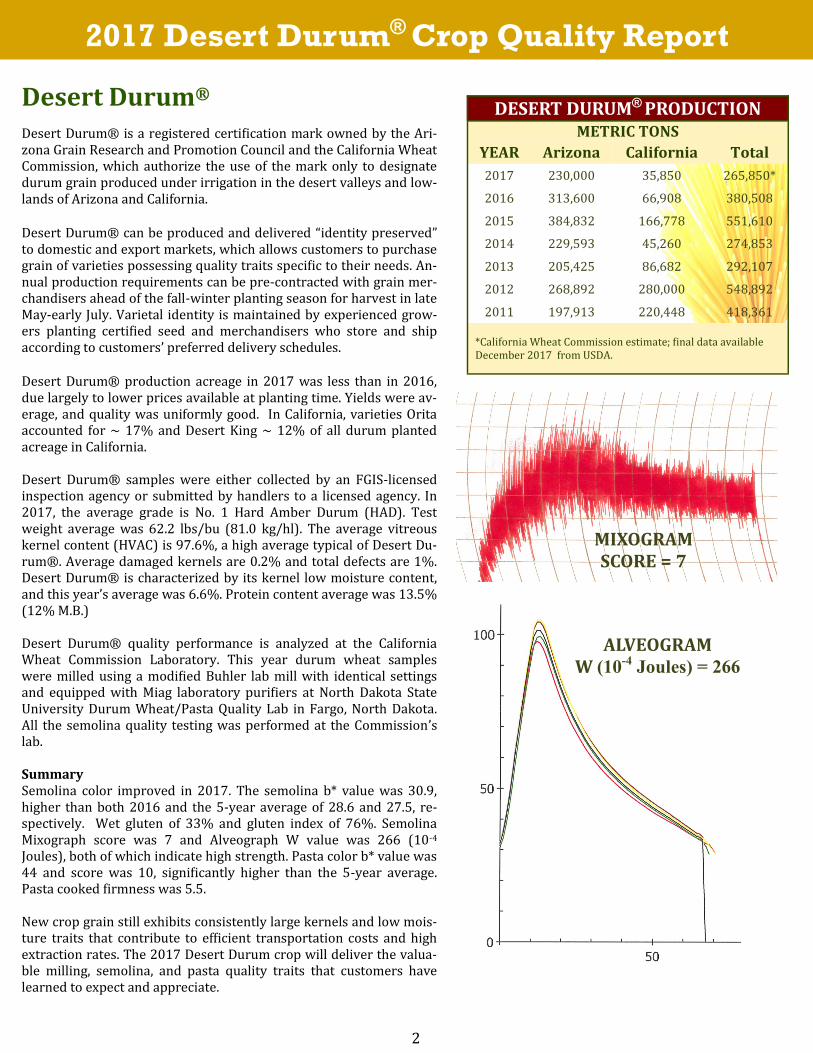
Desert Durum® is a registered certification mark owned by the Ari-zona Grain Research and Promotion Council and the California Wheat Commission, which authorize the use of the mark only to designate durum grain produced under irrigation in the desert valleys and low-lands of Arizona and California. Desert Durum® can be produced and delivered “identity preserved” to domestic and export markets, which allows customers to purchase grain of varieties possessing quality traits specific to their needs. An-nual production requirements can be pre-contracted with grain mer-chandisers ahead of the fall-winter planting season for harvest in late May-early July. Varietal identity is maintained by experienced grow-ers planting certified seed and merchandisers who store and ship according to customers’ preferred delivery schedules. Desert Durum® production acreage in 2017 was less than in 2016, due largely to lower prices available at planting time. Yields were av-erage, and quality was uniformly good. In California, varieties Orita accounted for ~ 17% and Desert King ~ 12% of all durum planted acreage in California. Desert Durum® samples were either collected by an FGIS-licensed inspection agency or submitted by handlers to a licensed agency. In 2017, the average grade is No. 1 Hard Amber Durum (HAD). Test weight average was 62.2 lbs/bu (81.0 kg/hl). The average vitreous kernel content (HVAC) is 97.6%, a high average typical of Desert Du-rum®. Average damaged kernels are 0.2% and total defects are 1%. Desert Durum® is characterized by its kernel low moisture content, and this year’s average was 6.6%. Protein content average was 13.5% (12% M.B.) Desert Durum® quality performance is analyzed at the California Wheat Commission Laboratory. This year durum wheat samples were milled using a modified Buhler lab mill with identical settings and equipped with Miag laboratory purifiers at North Dakota State University Durum Wheat/Pasta Quality Lab in Fargo, North Dakota. All the semolina quality testing was performed at the Commission’s lab. Summary Semolina color improved in 2017. The semolina b* value was 30.9, higher than both 2016 and the 5-year average of 28.6 and 27.5, re-spectively. Wet gluten of 33% and gluten index of 76%. Semolina Mixograph score was 7 and Alveograph W value was 266 (10-4 Joules), both of which indicate high strength. Pasta color b* value was 44 and score was 10, significantly higher than the 5-year average. Pasta cooked firmness was 5.5. New crop grain still exhibits consistently large kernels and low mois-ture traits that contribute to efficient transportation costs and high extraction rates. The 2017 Desert Durum crop will deliver the valua-ble milling, semolina, and pasta quality traits that customers have learned to expect and appreciate.
DESERT DURUM® PRODUCTION
METRIC TONS
YEAR Arizona California Total
2017 230,000 35,850 265,850*
2016 313,600 66,908 380,508
2015 384,832 166,778 551,610
2014 229,593 45,260 274,853
2013 205,425 86,682 292,107
2012 268,892 280,000 548,892
2011 197,913 220,448 418,361
*California Wheat Commission estimate; final data available December 2017 from USDA.
MIXOGRAM SCORE = 7
ALVEOGRAM W (10-4 Joules) = 266
3
2017 Desert Durum® Crop Quality Report
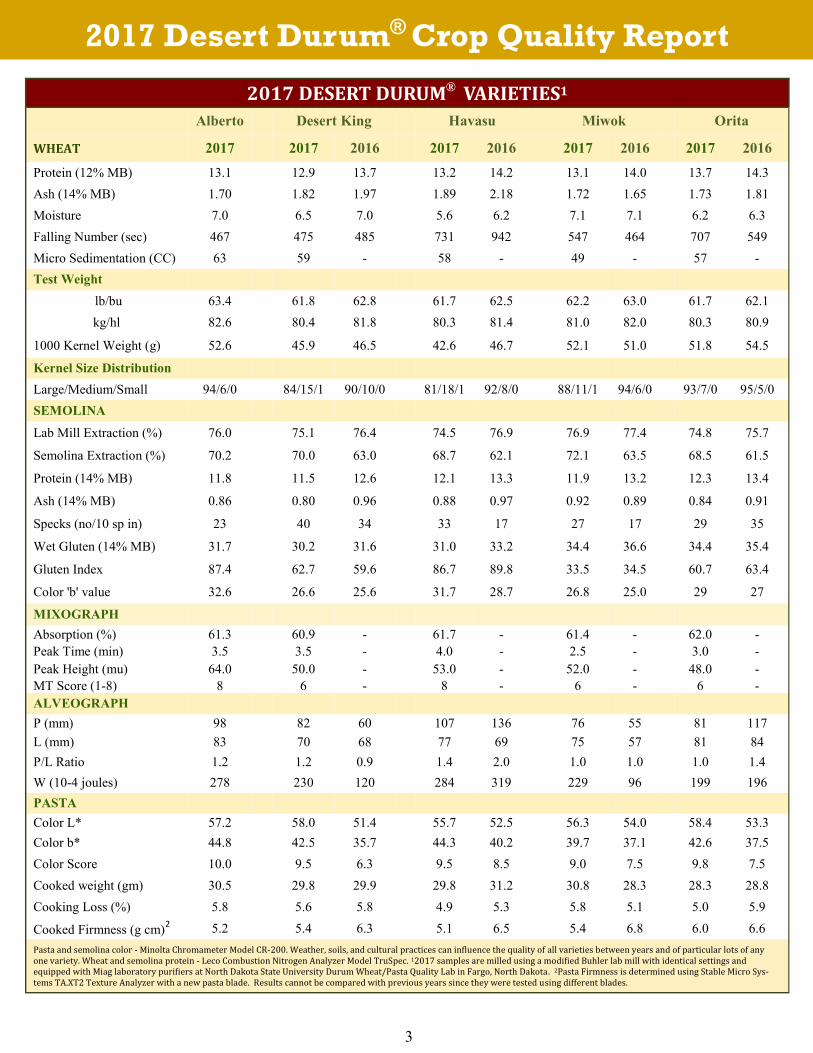
2017 DESERT DURUM® VARIETIES1
Alberto Desert King Havasu Miwok Orita
WHEAT 2017 2017 2016 2017 2016 2017 2016 2017 2016
Protein (12% MB) 13.1 12.9 13.7 13.2 14.2 13.1 14.0 13.7 14.3
Ash (14% MB) 1.70 1.82 1.97 1.89 2.18 1.72 1.65 1.73 1.81
Moisture 7.0 6.5 7.0 5.6 6.2 7.1 7.1 6.2 6.3
Falling Number (sec) 467 475 485 731 942 547 464 707 549
Micro Sedimentation (CC) 63 59 - 58 - 49 - 57 -
Test Weight
lb/bu 63.4 61.8 62.8 61.7 62.5 62.2 63.0 61.7 62.1
kg/hl 82.6 80.4 81.8 80.3 81.4 81.0 82.0 80.3 80.9
1000 Kernel Weight (g) 52.6 45.9 46.5 42.6 46.7 52.1 51.0 51.8 54.5
Kernel Size Distribution
Large/Medium/Small 94/6/0 84/15/1 90/10/0 81/18/1 92/8/0 88/11/1 94/6/0 93/7/0 95/5/0
SEMOLINA
Lab Mill Extraction (%) 76.0 75.1 76.4 74.5 76.9 76.9 77.4 74.8 75.7
Semolina Extraction (%) 70.2 70.0 63.0 68.7 62.1 72.1 63.5 68.5 61.5
Protein (14% MB) 11.8 11.5 12.6 12.1 13.3 11.9 13.2 12.3 13.4
Ash (14% MB) 0.86 0.80 0.96 0.88 0.97 0.92 0.89 0.84 0.91
Specks (no/10 sp in) 23 40 34 33 17 27 17 29 35
Wet Gluten (14% MB) 31.7 30.2 31.6 31.0 33.2 34.4 36.6 34.4 35.4
Gluten Index 87.4 62.7 59.6 86.7 89.8 33.5 34.5 60.7 63.4
Color 'b' value 32.6 26.6 25.6 31.7 28.7 26.8 25.0 29 27
MIXOGRAPH
Absorption (%) 61.3 60.9 - 61.7 - 61.4 - 62.0 -
Peak Time (min) 3.5 3.5 - 4.0 - 2.5 - 3.0 -
Peak Height (mu) 64.0 50.0 - 53.0 - 52.0 - 48.0 -
MT Score (1-8) 8 6 - 8 - 6 - 6 -
ALVEOGRAPH
P (mm) 98 82 60 107 136 76 55 81 117
L (mm) 83 70 68 77 69 75 57 81 84
P/L Ratio 1.2 1.2 0.9 1.4 2.0 1.0 1.0 1.0 1.4
W (10-4 joules) 278 230 120 284 319 229 96 199 196
PASTA
Color L* 57.2 58.0 51.4 55.7 52.5 56.3 54.0 58.4 53.3
Color b* 44.8 42.5 35.7 44.3 40.2 39.7 37.1 42.6 37.5
Color Score 10.0 9.5 6.3 9.5 8.5 9.0 7.5 9.8 7.5
Cooked weight (gm) 30.5 29.8 29.9 29.8 31.2 30.8 28.3 28.3 28.8
Cooking Loss (%) 5.8 5.6 5.8 4.9 5.3 5.8 5.1 5.0 5.9
Cooked Firmness (g cm)2 5.2 5.4 6.3 5.1 6.5 5.4 6.8 6.0 6.6
Pasta and semolina color - Minolta Chromameter Model CR-200. Weather, soils, and cultural practices can influence the quality of all varieties between years and of particular lots of any one variety. Wheat and semolina protein - Leco Combustion Nitrogen Analyzer Model TruSpec. 12017 samples are milled using a modified Buhler lab mill with identical settings and equipped with Miag laboratory purifiers at North Dakota State University Durum Wheat/Pasta Quality Lab in Fargo, North Dakota. 2Pasta Firmness is determined using Stable Micro Sys-tems TA.XT2 Texture Analyzer with a new pasta blade. Results cannot be compared with previous years since they were tested using different blades.
4
2017 Desert Durum® Crop Quality Report
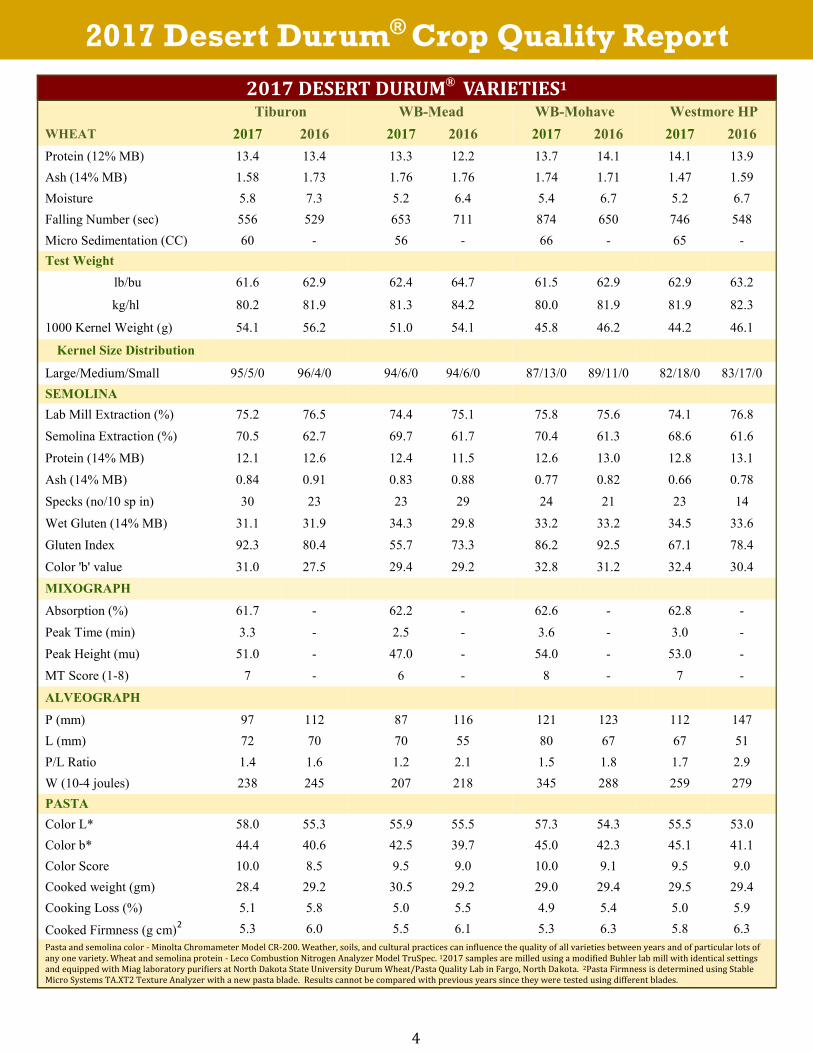
2017 DESERT DURUM® VARIETIES1 Tiburon WB-Mead WB-Mohave Westmore HP
WHEAT 2017 2016 2017 2016 2017 2016 2017 2016
Protein (12% MB) 13.4 13.4 13.3 12.2 13.7 14.1 14.1 13.9
Ash (14% MB) 1.58 1.73 1.76 1.76 1.74 1.71 1.47 1.59
Moisture 5.8 7.3 5.2 6.4 5.4 6.7 5.2 6.7
Falling Number (sec) 556 529 653 711 874 650 746 548
Micro Sedimentation (CC) 60 - 56 - 66 - 65 -
Test Weight
lb/bu 61.6 62.9 62.4 64.7 61.5 62.9 62.9 63.2
kg/hl 80.2 81.9 81.3 84.2 80.0 81.9 81.9 82.3
1000 Kernel Weight (g) 54.1 56.2 51.0 54.1 45.8 46.2 44.2 46.1
Kernel Size Distribution
Large/Medium/Small 95/5/0 96/4/0 94/6/0 94/6/0 87/13/0 89/11/0 82/18/0 83/17/0
SEMOLINA
Lab Mill Extraction (%) 75.2 76.5 74.4 75.1 75.8 75.6 74.1 76.8
Semolina Extraction (%) 70.5 62.7 69.7 61.7 70.4 61.3 68.6 61.6
Protein (14% MB) 12.1 12.6 12.4 11.5 12.6 13.0 12.8 13.1
Ash (14% MB) 0.84 0.91 0.83 0.88 0.77 0.82 0.66 0.78
Specks (no/10 sp in) 30 23 23 29 24 21 23 14
Wet Gluten (14% MB) 31.1 31.9 34.3 29.8 33.2 33.2 34.5 33.6
Gluten Index 92.3 80.4 55.7 73.3 86.2 92.5 67.1 78.4
Color 'b' value 31.0 27.5 29.4 29.2 32.8 31.2 32.4 30.4
MIXOGRAPH
Absorption (%) 61.7 - 62.2 - 62.6 - 62.8 -
Peak Time (min) 3.3 - 2.5 - 3.6 - 3.0 -
Peak Height (mu) 51.0 - 47.0 - 54.0 - 53.0 -
MT Score (1-8) 7 - 6 - 8 - 7 -
ALVEOGRAPH
P (mm) 97 112 87 116 121 123 112 147
L (mm) 72 70 70 55 80 67 67 51
P/L Ratio 1.4 1.6 1.2 2.1 1.5 1.8 1.7 2.9
W (10-4 joules) 238 245 207 218 345 288 259 279
PASTA
Color L* 58.0 55.3 55.9 55.5 57.3 54.3 55.5 53.0
Color b* 44.4 40.6 42.5 39.7 45.0 42.3 45.1 41.1
Color Score 10.0 8.5 9.5 9.0 10.0 9.1 9.5 9.0
Cooked weight (gm) 28.4 29.2 30.5 29.2 29.0 29.4 29.5 29.4
Cooking Loss (%) 5.1 5.8 5.0 5.5 4.9 5.4 5.0 5.9
Cooked Firmness (g cm)2 5.3 6.0 5.5 6.1 5.3 6.3 5.8 6.3
Pasta and semolina color - Minolta Chromameter Model CR-200. Weather, soils, and cultural practices can influence the quality of all varieties between years and of particular lots of any one variety. Wheat and semolina protein - Leco Combustion Nitrogen Analyzer Model TruSpec. 12017 samples are milled using a modified Buhler lab mill with identical settings and equipped with Miag laboratory purifiers at North Dakota State University Durum Wheat/Pasta Quality Lab in Fargo, North Dakota. 2Pasta Firmness is determined using Stable Micro Systems TA.XT2 Texture Analyzer with a new pasta blade. Results cannot be compared with previous years since they were tested using different blades.
5
2017 Desert Durum® Crop Quality Report
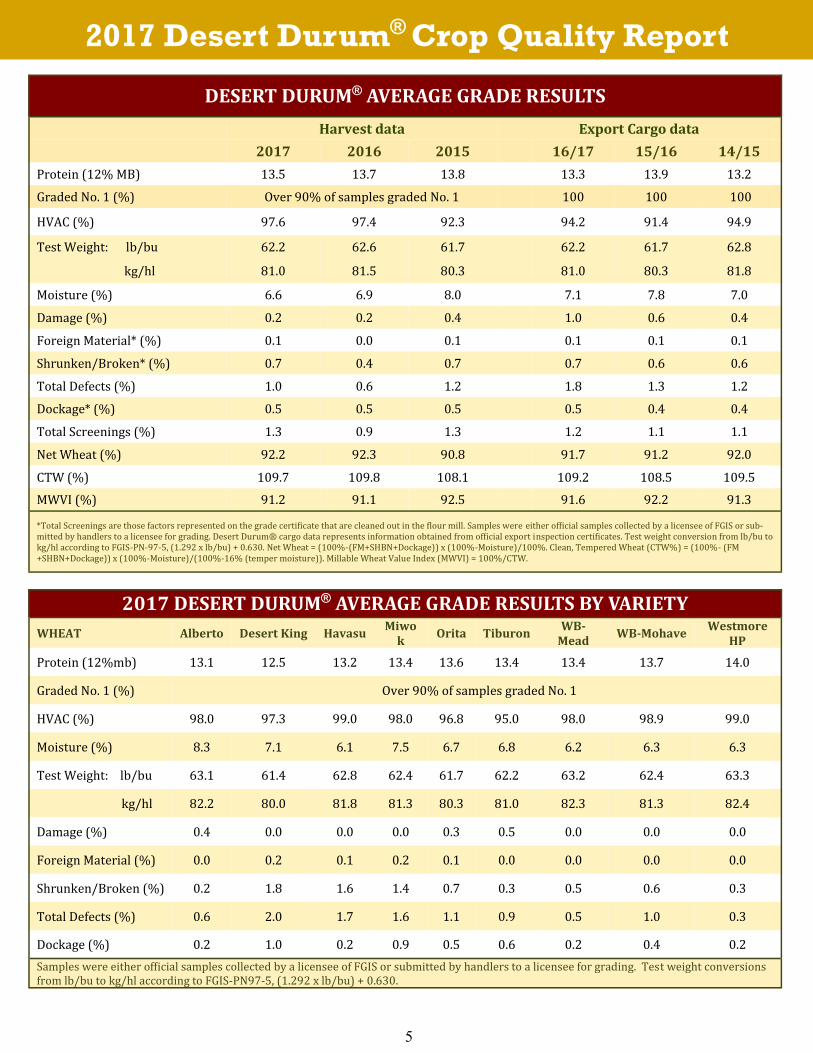
DESERT DURUM® AVERAGE GRADE RESULTS
Harvest data Export Cargo data
2017 2016 2015 15/16 14/15 16/17
Protein (12% MB) 13.5 13.7 13.8 13.9 13.2 13.3
Graded No. 1 (%) Over 90% of samples graded No. 1 100 100 100
HVAC (%) 97.6 97.4 92.3 91.4 94.9 94.2
Test Weight: lb/bu 62.2 62.6 61.7 61.7 62.8 62.2
kg/hl 81.0 81.5 80.3 80.3 81.8 81.0
Moisture (%) 6.6 6.9 8.0 7.8 7.0 7.1
Damage (%) 0.2 0.2 0.4 0.6 0.4 1.0
Foreign Material* (%) 0.1 0.0 0.1 0.1 0.1 0.1
Shrunken/Broken* (%) 0.7 0.4 0.7 0.6 0.6 0.7
Total Defects (%) 1.0 0.6 1.2 1.3 1.2 1.8
Dockage* (%) 0.5 0.5 0.5 0.4 0.4 0.5
Total Screenings (%) 1.3 0.9 1.3 1.1 1.1 1.2
Net Wheat (%) 92.2 92.3 90.8 91.2 92.0 91.7
CTW (%) 109.7 109.8 108.1 108.5 109.5 109.2
MWVI (%) 91.2 91.1 92.5 92.2 91.3 91.6
*Total Screenings are those factors represented on the grade certificate that are cleaned out in the flour mill. Samples were either official samples collected by a licensee of FGIS or sub-mitted by handlers to a licensee for grading. Desert Durum® cargo data represents information obtained from official export inspection certificates. Test weight conversion from lb/bu to kg/hl according to FGIS-PN-97-5, (1.292 x lb/bu) + 0.630. Net Wheat = (100%-(FM+SHBN+Dockage)) x (100%-Moisture)/100%. Clean, Tempered Wheat (CTW%) = (100%- (FM +SHBN+Dockage)) x (100%-Moisture)/(100%-16% (temper moisture)). Millable Wheat Value Index (MWVI) = 100%/CTW.
2017 DESERT DURUM® AVERAGE GRADE RESULTS BY VARIETY
WHEAT Alberto Desert King Havasu Miwo
k Orita Tiburon
WB-Mead
WB-Mohave Westmore
HP
Protein (12%mb) 13.1 12.5 13.2 13.4 13.6 13.4 13.4 13.7 14.0
Graded No. 1 (%) Over 90% of samples graded No. 1
HVAC (%) 98.0 97.3 99.0 98.0 96.8 95.0 98.0 98.9 99.0
Moisture (%) 8.3 7.1 6.1 7.5 6.7 6.8 6.2 6.3 6.3
Test Weight: lb/bu 63.1 61.4 62.8 62.4 61.7 62.2 63.2 62.4 63.3
kg/hl 82.2 80.0 81.8 81.3 80.3 81.0 82.3 81.3 82.4
Damage (%) 0.4 0.0 0.0 0.0 0.3 0.5 0.0 0.0 0.0
Foreign Material (%) 0.0 0.2 0.1 0.2 0.1 0.0 0.0 0.0 0.0
Shrunken/Broken (%) 0.2 1.8 1.6 1.4 0.7 0.3 0.5 0.6 0.3
Total Defects (%) 0.6 2.0 1.7 1.6 1.1 0.9 0.5 1.0 0.3
Dockage (%) 0.2 1.0 0.2 0.9 0.5 0.6 0.2 0.4 0.2
Samples were either official samples collected by a licensee of FGIS or submitted by handlers to a licensee for grading. Test weight conversions from lb/bu to kg/hl according to FGIS-PN97-5, (1.292 x lb/bu) + 0.630.
Technical and Laboratory Services
California Wheat Commission 1240 Commerce Avenue, Suite A Woodland, CA 95776-5923 Phone: 530.661.1292 Fax: 530.661.1332 Web: californiawheat.org
Arizona Grain Research and Promotion Council Arizona Department of Agriculture 1688 West Adams Street Phoenix, AZ 85007
Phone: 602.542.3262 Fax: 602.364.0830
2017 Desert Durum® Crop Quality Report
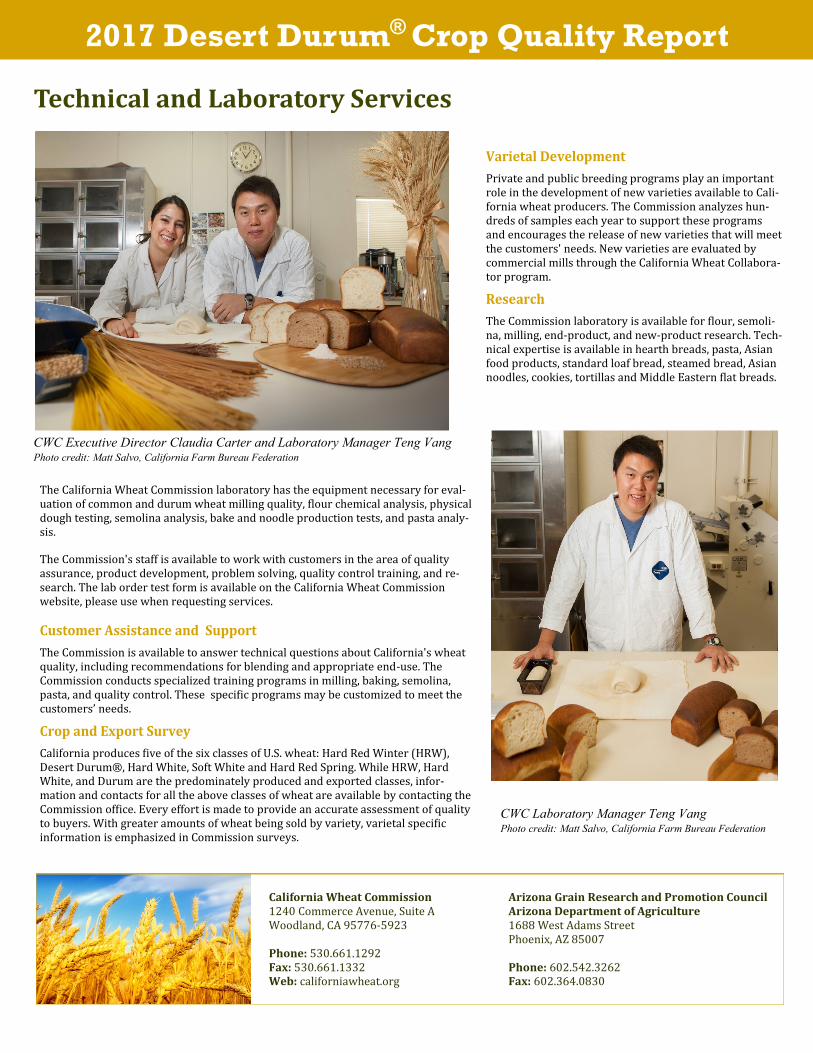
CWC Executive Director Claudia Carter and Laboratory Manager Teng Vang Photo credit: Matt Salvo, California Farm Bureau Federation
The California Wheat Commission laboratory has the equipment necessary for eval-uation of common and durum wheat milling quality, flour chemical analysis, physical dough testing, semolina analysis, bake and noodle production tests, and pasta analy-sis.
The Commission's staff is available to work with customers in the area of quality assurance, product development, problem solving, quality control training, and re-search. The lab order test form is available on the California Wheat Commission website, please use when requesting services.
The Commission is available to answer technical questions about California's wheat quality, including recommendations for blending and appropriate end-use. The Commission conducts specialized training programs in milling, baking, semolina, pasta, and quality control. These specific programs may be customized to meet the customers’ needs.
California produces five of the six classes of U.S. wheat: Hard Red Winter (HRW), Desert Durum®, Hard White, Soft White and Hard Red Spring. While HRW, Hard White, and Durum are the predominately produced and exported classes, infor-mation and contacts for all the above classes of wheat are available by contacting the Commission office. Every effort is made to provide an accurate assessment of quality to buyers. With greater amounts of wheat being sold by variety, varietal specific information is emphasized in Commission surveys.
Private and public breeding programs play an important role in the development of new varieties available to Cali-fornia wheat producers. The Commission analyzes hun-dreds of samples each year to support these programs and encourages the release of new varieties that will meet the customers' needs. New varieties are evaluated by commercial mills through the California Wheat Collabora-tor program.
The Commission laboratory is available for flour, semoli-na, milling, end-product, and new-product research. Tech-nical expertise is available in hearth breads, pasta, Asian food products, standard loaf bread, steamed bread, Asian noodles, cookies, tortillas and Middle Eastern flat breads.
CWC Laboratory Manager Teng Vang Photo credit: Matt Salvo, California Farm Bureau Federation