ARIDITY, CLIMATIC RISK PHENOMENON IN …pesd.ro/articole/nr.5/1/18. Lungu_Panaitescu.pdfKoppen's...
12
PRESENT ENVIRONMENT AND SUSTAINABLE DEVELOPMENT, VOL. 5, no. 1, 2011 ARIDITY, CLIMATIC RISK PHENOMENON IN DOBRUDJA Marius Lungu 1 , Liliana Panaitescu 2 Simona Niţă 3 Keywords: Dobrudja , aridity, climatic risk, desertification. Abstract. Aridity is a major permanent risk for the climate of Dobrudja territory. Water resources and its quality are declining, and this is a severely limiting factor for both Dobrudja and the world, particularly with increasing aridity due to global warming predicted by some climate scenarios. Knowledge of aridity is also necessary to explain the characteristics of the geographical landscape for the rational use of water resources. Definition and characterization of aridity as intensity were done by several methods and indicators, starting with Lang's rain factor (1920), continuing with De Martonne’s aridity index (1926), Thornthwaite’s aridity index (1948), moisture deficit and ending with the UNESCO aridity index (1979). De Martonne’s aridity index (1926) was recently amended by Murai and Hund (1991) to match the classification of vegetation in the world, but its use in the international literature has not been implemented so far. Dobrudja ’s aridity is highlighted by all climatic aridity indices presented above; additional indicators can also be used. Increasing aridity in Dobrudja due to global warming is a real hazard, with the threat of desertification. Introduction Koppen's climate classification (1936), a Russian-born German climatologist (1846-1940), distinguished, inter alia, the major type of dry climate, rank 1, denoted with a capital letter B. The degree of climate dryness is the dry climate splitting criterion, marked by uppercase letters: -S, Steppe (Steppe) and W for desert (Wüste) -BS, steppe subtype, semiarid, is spread among others in southern Africa, in Spain, in the south-east of our country and the Romanian Black Sea coast, Mexico, Iran, etc., being characterized by grassy vegetation, often thorny, succulent, with small size. It covers approximately 14% of the Earth's surface. It receives more rain than the deserts (BW), both from the convergence inter tropical air, and from 1 Lect. PhD., Ovidius University, Constanţa, [email protected] 2 Assist Prof. PhD., Ovidius University, Constanţa, [email protected] 3 Lect. PhD., USAB Timişoara
Transcript of ARIDITY, CLIMATIC RISK PHENOMENON IN …pesd.ro/articole/nr.5/1/18. Lungu_Panaitescu.pdfKoppen's...

PRESENT ENVIRONMENT AND SUSTAINABLE DEVELOPMENT, VOL. 5, no. 1, 2011
ARIDITY, CLIMATIC RISK PHENOMENON IN DOBRUDJA
Marius Lungu 1, Liliana Panaitescu2 Simona Niţă 3
Keywords: Dobrudja , aridity, climatic risk, desertification.
Abstract. Aridity is a major permanent risk for the climate of Dobrudja territory.
Water resources and its quality are declining, and this is a severely limiting factor
for both Dobrudja and the world, particularly with increasing aridity due to global
warming predicted by some climate scenarios. Knowledge of aridity is also
necessary to explain the characteristics of the geographical landscape for the rational
use of water resources. Definition and characterization of aridity as intensity were
done by several methods and indicators, starting with Lang's rain factor (1920),
continuing with De Martonne’s aridity index (1926), Thornthwaite’s aridity index
(1948), moisture deficit and ending with the UNESCO aridity index (1979). De
Martonne’s aridity index (1926) was recently amended by Murai and Hund (1991)
to match the classification of vegetation in the world, but its use in the international
literature has not been implemented so far. Dobrudja ’s aridity is highlighted by all
climatic aridity indices presented above; additional indicators can also be used.
Increasing aridity in Dobrudja due to global warming is a real hazard, with the threat
of desertification.
IntroductionKoppen's climate classification (1936), a Russian-born German climatologist
(1846-1940), distinguished, inter alia, the major type of dry climate, rank 1,
denoted with a capital letter B. The degree of climate dryness is the dry climate
splitting criterion, marked by uppercase letters:
-S, Steppe (Steppe) and W for desert (Wüste)
-BS, steppe subtype, semiarid, is spread among others in southern Africa, in Spain, in the south-east of our country and the Romanian Black Sea coast, Mexico,
Iran, etc., being characterized by grassy vegetation, often thorny, succulent, with
small size. It covers approximately 14% of the Earth's surface. It receives more rain than the deserts (BW), both from the convergence inter tropical air, and from
1 Lect. PhD., Ovidius University, Constanţa, [email protected]
2 Assist Prof. PhD., Ovidius University, Constanţa, [email protected]
3 Lect. PhD., USAB Timişoara

Marius Lungu, Liliana Panaitescu, Simona Niţă180
cyclones formed at median latitudes. To differentiate latitudinal semi-arid regions,
the letter h is used additionally for the subtropical areas (BSh) and the letter k for
those at median latitudes (BSk).
-BW, desert subtype is found in Patagonia, the Sahara, within the Arabian
Peninsula, Turkmenistan, the Aral and Caspian region, the central part of Australia,
etc. This subtype is sparsely grassy with discontinuous herbaceous vegetation,
xerophytic and very poor, located in relatively moist areas of the desert. The oases
due to the presence of ground water at the surface are an intrazonal exception of this subtype.
Fig. 1 - The location of meteorological stations and rainfall stations in Dobrudja used for
the study of aridity
Dobrudja fits in the BSk subtype within the Köppen climatic classification.
What follows are the indicators that characterize aridity and their geographical
distribution on the territory of Dobrudja .
For the preparation of this study we used climate data recorded between 1965-2005
from 18 meteorological stations and 23 rainfall stations, figure 1.

Aridity, climatic risk phenomenon in Dobrudja 181
1. Results and discussions1.1. De Martonne aridity index. Early studies on aridity in Dobrudja were
made by Ioan (1929), and continued afterwards by several other authors, including
Cernescu (1961), Berbecel (1984), and others.
A suggestive indicator for the characterization of the aridity index is De
Martonne’s (Iar-DM), described by the formula:
Iar-DM = P/(Tm + 10) where: P = total annual precipitation and Tm = mean annual temperature. The
denominator contains additionally the value of 10°C to produce positive results in
regions with negative average annual temperatures, such as mountainous regions or deserts from median latitudes. This indicator was introduced by De Martonne
(1926) to characterize the climate, and was subsequently used in the
characterization of soil hydrologic regime, including in our country. In general, low values of Iar-DM show dry conditions, while higher values show wet conditions.
Table 1 presents De Martonne’s climatic classification (1926) according to the Iar-
DM indicator.
Tab. 1 - Climatic classification according to De Martonne (1926)
Type of climate IVery dry = desert (arid)
0-5
Dry = steppe, semiarid (semi desert)5-15 (5-12)
Semi-dry (dry sub-humid) 15-20
Mildly wet (moist sub-humid) 20-30
Wed (wet) 30-60
Very wet (humid) over 60
# Iar-DM - annual average in Dobrudja (1965-2005). The spatial distribution of De
Martonne’s aridity index (Iar-DM) annually shows that Dobrudja has a high variability. In eastern Dobrudja, Iar-DM is below 20 (15-20), with small areas and
lower values (below 15), figure 2.
This region, with pronounced aridity, has a specific agricultural profile, mainly cereals, being generally associated with the development of grapevine
culture and thermophilic fruit trees, such as apricot and peach. High-yield
agriculture cannot be done here now without the application of irrigation. According to De Martonne’s global classification where even deserts are
considered (with values between 0-5, table 1), the Iar-DM values from most of the
Marius Lungu, Liliana Panaitescu, Simona Niţă182
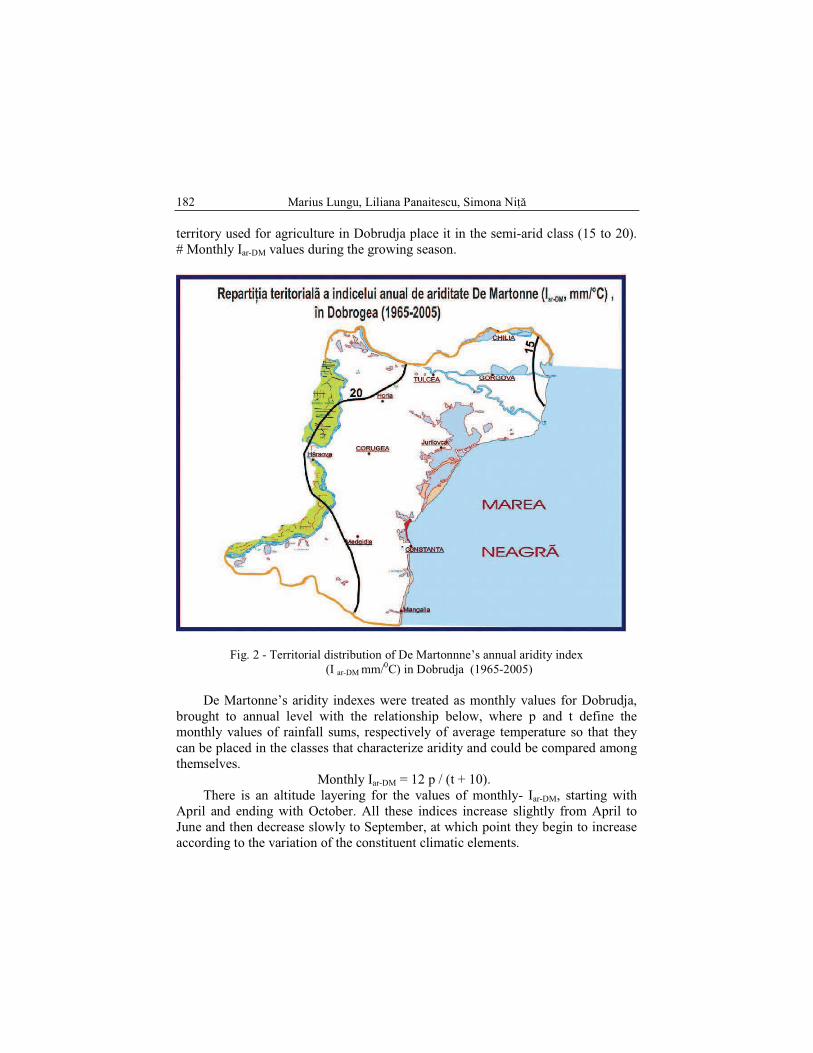
territory used for agriculture in Dobrudja place it in the semi-arid class (15 to 20).
# Monthly Iar-DM values during the growing season.
Fig. 2 - Territorial distribution of De Martonnne’s annual aridity index
(I ar-DM mm/0C) in Dobrudja (1965-2005)
De Martonne’s aridity indexes were treated as monthly values for Dobrudja,
brought to annual level with the relationship below, where p and t define the monthly values of rainfall sums, respectively of average temperature so that they
can be placed in the classes that characterize aridity and could be compared among
themselves. Monthly Iar-DM = 12 p / (t + 10).
There is an altitude layering for the values of monthly- Iar-DM, starting with
April and ending with October. All these indices increase slightly from April to
June and then decrease slowly to September, at which point they begin to increase
according to the variation of the constituent climatic elements.

Aridity, climatic risk phenomenon in Dobrudja 183
1.2. Reference evapotranspiration (potential) – ETo. Since the following
terms use ETo in their definition, a brief definition will be given as well as the
established methods for calculating ETo.
Evapotranspiration (ET, mm) is a complex process resulting from the
combination of evaporation and plant transpiration.
Evaporation occurs due to the absorption of solar energy by water, having a
particular influence, in addition to radiation, air temperature, air humidity and wind
speed. By evaporation, the liquid water from oceans and seas, rivers, lakes, soils and rocks, from moist vegetation, etc. is transformed into vapor and removed from
the surface by evaporation into the atmosphere.
The driving force that removes water vapor from the evaporation surface is the difference between the potential (pressure) of water vapor from the evaporation
surface and the pressure of the surrounding atmosphere, which gradually becomes
saturated with vapor. Thus, the evaporation is reduced and even stops to total saturation of the air. If the saturated air is removed from the evaporation surface by
wind, then the process continues, this pressure difference controlling its intensity.
When the evaporation surface is not water from aquatic surfaces but water
from the soil or rocks, then other factors such as water quantity or potential,
proximity or remoteness of groundwater and/or the presence of the capillary fringe
and plants shade intervene and influence this process. Where the porous soil
environment can provide continuous water vapor supply into the atmosphere, the
evaporation process is controlled only by atmospheric conditions. Otherwise, the
availability of water in the porous environment reduces evaporation and may even stop it as the soil or rocks dry up at values equivalent to air drying or the
hygroscopic coefficient.
Perspiration is also a process of water evaporation from plant tissues, from leaves through their openings - stomata. In leaves, water with nutrients is extracted
from soil by roots. Perspiration depends on the same factors as evaporation, to
which plant characteristics (plant type, size, stage of development, applied
technology, etc.) and water salinity are added, the latter retaining water in the
tissues.
In general, when plants are small evaporation prevails and when they are large and
shade the soil, perspiration prevails (80-90%), the combined process being called
evapotranspiration (ET).
Factors that affect evapotranspiration in Dobrudja. The intensity of evapotranspiration is expressed as atmospheric ETo (ETo), formerly known as
potential evapotranspiration (ETP). Today, it is recommended that the latter term
no longer be used, although it is still used under inertia. ETo was introduced to
express the evaporative demand of the atmosphere independently of vegetation, its
stage of development or management type. Water evaporation requires large

Marius Lungu, Liliana Panaitescu, Simona Niţă184
amounts of energy, the process being governed by energy exchange at the surface
of the vegetation as it is limited by the amount of energy available.
ETo is the evapotranspiration of a standard surface covered with grassy
vegetation of low height (about 12 cm) with a constant resistance of 70 s / m and
albedo of 0.23, which completely shades the soil, water being supplied with
optimal moisture amount so that soil humidity should not affect the ETo size. The
climatic factors are the only factors that influence the ETo.
Unlike ETo, defined above, ET depends on the type of vegetation (forest, grassland, orchards, cereals, etc.), phase of development and variety of plants,
resistance to perspiration, roughness and plant albedo, height and root system of
culture vegetation. In standardized conditions, the evapotranspiration of culture plants or of spontaneous vegetation (ETc, or crop water requirement) refers to the
evaporative demand of the atmosphere for plants grown on large areas with
optimum water and environmental conditions and provided with a correct management. Restrictive environmental factors such as: high salinity or poor soil
fertility, water pooling and lack of aeration of difficult soils, plant diseases, etc.
may reduce the value of ETC. Water demand for irrigation is the difference
between the culture water demand and actual rainfall.
There is a clear distinction between ETo and ETC. ETo is a climatic
parameter indicating the evaporative demand of the atmosphere, while ETC is an
agricultural parameter that shows the water consumption by vegetation, namely of
crops or forests that are supplied with optimal conditions of humidity, environment
and management. For each time period (month) and crop, if ETo and the correction coefficient of culture (Kc) are known, with monthly values, Etc can be determined,
as the following relationship exists between ETo (mm) and ETC (mm):
ETC = ETo Kc where: Kc is a factor that depends
on the type of crop and its evelopment phase, ranging generally between 0.3 and
0.4 at the beginning of the growing season, culminating with a maximum water
consumption month (mostly in July), when values of 1.2 can be encountered. Land
improvement or irrigation deals with its study.
Methods for calculating the ETo. In conditions of high accuracy, ET
determination can be made in special facilities called lysimeter, which are tanks
made of metal, concrete or composite materials, with dimensions of several square
meters, isolated and filled with soil under conditions similar to those in the field. Representative plants of the same size as the ones in the surrounding plot are then
cultivated here. Water consumption is determined based on the equation of balance
as the difference between water inputs (precipitation, irrigation) and its outputs
(drainage). There are lysimeters with weighing and drainage system, or only with
drainage system. When planted with grass and supplied with an optimal amount of
Aridity, climatic risk phenomenon in Dobrudja 185
water, the lysimeters determine ETo, while in the case of any other culture, they
determine ETC.
Water evaporation from open water surfaces, which integrates the effect of
global radiation, air temperature, air humidity and wind speed, is measured with
evaporimeters (pan evaporation), the best known of which is the class A
evaporimeter. These are cylindrical, metal tanks, with a diameter of approximately
1.2 m, in which the diurnal variation of water level due to evaporation is measured.
ETo can be estimated by applying empirical coefficients for local calibration, using water evaporation from evaporimeters.
1.3. Thornthwaite aridity index (IAR-TH). IAR-TH (%) was calculated
according to the Thornthwaite method (1948), as percentage ratio between the sum of monthly climatic water deficit (precipitations minus ETo-PM, without taking
into account the water excess in certain months of that period) and the sum of the
monthly values of ETo-PM calculated for the vegetation period (April-October) in the first case, and with the help of ETo-TH in the second case. If the rainfall
exceeded the ETo, the value of this index was considered invalid.
Iar–TH1 = 100 x Σ(P – ETo-PM) / Σ EToPM
Iar–TH2 = 100 x Σ(P – ETo-TH) / Σ EToTH
Dobrudja is characterized by a pronounced aridity (IAR-TH> 40) or even 60-
65% in the eastern part of Dobrudja and the Danube Plain, signifying a very high
aridity. Unlike IAR-DM (mm / ° C), IAR-TH (%) measures aridity as a percentage
of ETo for the growing season, being thus more suggestive than the former. Thus, the use of Iar–TH permits a more "realistic" framing of climate aridity in Dobrudja,
the arid zones in this classification being closer to the climatic and agricultural
findings.1.4. Annual climatic water deficit. The difference between the annual values
of precipitation and of ETo-PM is defined as the annual climate deficit (DEF) of
water, with a negative mark. Unlike IAR-DM, re is a relationship between
precipitation and temperature (with a conventional addition of 10° C to yield
positive values). DEF is the difference between the more appropriate terms that
characterize the essence of natural landscape, by the contribution of ETo instead of
temperature, as precipitation and ETo have the same measurement units, mm.
Compared with the IAR-TH, DEF displays absolute values (mm), and not relative
values, percentage of ETo.
According to the DEF values, the most arid region of the country is the
Black Sea coast, where values of approximately -400 mm and even -350 mm are recorded, Figure 3. The annual DEF-400 mm isoline crosses eastern Dobrudja
north of the city of Constanta. In contrast, the western part of the Dobrudja Plateau
is characterized by an annual DEF between -300 to -400 mm, this region being

Marius Lungu, Liliana Panaitescu, Simona Niţă186
ranked second in regards to the intensity of aridity. Unlike the indicators that
characterize drought (SPI) or the other indicators that characterize aridity, the DEF
indicator has the advantage of the precise quantification of the average water
demand for the reference culture (grass) in different regions of the country or
anywhere in the world. Using the correction coefficients of agricultural crops, this
indicator provides information regarding the standard monthly irrigation or during
the growing season. Therefore, for practical reasons, the DEF indicator fits best
because it is closely related to the amount of water applied by irrigation.
Fig. 3 - Annual climatic water deficit in Dobrudja (DEF,mm) compared to ET,PM,
(1965-2005)
1.5. The UNESCO aridity index 1979, as ratio between precipitation and ETo-PM. Another aridity index, called UNESCO 1979, Iar-P/ETo, is defined by
the ratio (P / ETo, annual values, mm / mm), which is widely used today, based on
the calculation of ETo ETo-PM in this paper, although initially it was based on
ETo-Penman (UNESCO, 1979). According to this aridity index, the climate

Aridity, climatic risk phenomenon in Dobrudja 187
classification is described in table 2. Dobrudja corresponds mostly to the mildly-
wet class (Iar-P/ETo = 0.5 to 0.55), whereas the eastern Danube Delta and the
Black Sea coast fit within the semiarid class (Iar-P/ETo = 0, 2 to 0.5), figure 3.
Tab. 2 - Climatic aridity classes according to Iar-P/ETo (UNESCO, 1979)
Value of Iar = P/ETo Climate Class
≤0.03 Hyper-arid
0.03-0.20 Arid
0.20-0.50 Semi-arid
0.50-0.65 Dry mildly-wet
> 0.65 wet
Fig. 3 - Annual values of I ar –P/ETO calculated with ETO-PM (mm/mm) in Dobrudja
(1965-2005)
Marius Lungu, Liliana Panaitescu, Simona Niţă188
ConclusionsDobrudja aridity is highlighted by all climatic aridity indices presented above.
It can be addressed with additional indicators. Increasing aridity in Dobrudja due to
global warming is a real hazard, with the threat of desertification. The impact of
climatic changes and the significant negative effects incurred on the main
components of water balance and on maize production are estimated based on the
CROPWAT model (Smith, 1992) and scenarios derived from the climate model
HadCM3. In this respect, the availability of water for crops will decrease due to the association of greater daily ETo values with a higher deficit of soil moisture and
decrease of the amount of rainfall. For example, the average monthly temperature
will increase by approximately 2.5º C in August in 2020 and by approximately 4.8ºC during 2050, when ETo will rise up to 8-16% over the same period while the
irrigation water demand will increase by approximately 15-28%. According to this
scenario, a decrease of soil moisture will lead to a reduction of the real maximum evapotranspiration of the crop by 16 to 24% by the years 2020-2050, despite an
increased evaporative demand of the atmosphere.
The Romanian Government and local authorities should develop appropriate
policies for the regions affected, such as rehabilitation of irrigation systems using a
strategic plan for all aspects of water requirements and application of a rational use
of water resources based on risk management and not crisis management.
Another strategic direction is to use the proper agricultural and horticultural
species, the cultivars and hybrids with maximum resistance to water stress,
especially in the southern regions of the country. Otherwise, the maize production for example, could be reduced to 60-70% due to water stress over the following
decades because of very high temperatures that would shorten the vegetation
period associated with the water stress during the seed filling phase. In conclusion, as we remarked in the previous section, there is a clear
difference in content between drought and aridity, although sometimes they are
confused in common expression. Aridity is a permanent feature of a region
characterized by low average rainfall, while drought is a temporary feature of any
region. This idea must be supplemented by the indication that the low rainfall
amount in arid regions is associated with intense evapotranspiration. Otherwise, the
precipitations could accumulate like in the polar regions with snow accumulation.
Bibliography: Bogdan, Octavia, Niculescu Elena (1999), „Riscurile climatice din România”, Academis
Romana, Institutul de Geografie, Tipar Compania Sega International, Bucureşti, 280p.
Bogdan, Octavia (1978), „Fenemone climatice de iarnă şi de vară”, Editura Ştiinţifică şi
Enciclopedică, Bucureşti.
Aridity, climatic risk phenomenon in Dobrudja 189
Bogdan, Octavia (1992), „Asupra noţiunilor de "hazarde", "riscuri" şi "catastrofe"
meteorologice şi climatice”, S.C. Geografic, t. XXXIX, Bucureşti, p. 99-105.
Ciulache, S., Ionac, Nicoleta (1995), „Fenomene atmosferice de risc şi catastrofe
climatice”, Ed. Ştiinţifică, Bucureşti.
Do, Ó, A. (2005), Regional Drought Analysis and Mitigation Using the SPI. CD-Rom,
ICID 21st European Regional Conference, Topic 4. 15-19 May 2005 - Frankfurt
(Oder) and Slubice - Germany and Poland.
Donciu, C. (1928), Perioade de uscăciune şi secetă în România, Bul. Meteor. Lunar, II, III,
3, IM, Bucureşti.
Lungu, M. (2009), „Fenomene climatice de risc din Dobrudja ”, Editura Universitara,
Bucureşti, 148p.
Păltineanu, Cr., , Mihailescu, I.F. (2005), Aridity distribution and irrigation water
requirements for the main fruit trees in Romania, International Commission on
Irrigation and Drainage, 21st European Regional Conference – Integrated land and
water resources management: towards sustainable rural development. 15-19 May
2005, CD Rom, ERC2005PDF, Frankfurt (Oder), Germany and Slubice (Poland),
Topic 4–Drought and drought management: 11 p.
Păltineanu, Cr., Mihailescu, I.F., Seceleanu, I., Dragota, Carmen, Vasenciuc, Felicia,
(2007), Using aridity indexes to describe some climate and soil features in Eastern Europe: a Romanian case study, Theoretical and applied climatology, Springer Velag
Vienna, Volume 90, no. 3-4, p. 263-274.
Păltineanu, Cr., Zoia, Prefac, Popescu, M. (2008), Aridity and extreme drought in
Dobrudja , Romania, Proceedings of the Conference on Desertification, Gent,
Belgium.
Thornthwaite, C.W. (1948), An approach toward a rational classification of climate, The
Geographical Rev., 38(1), p. 55-94.
*** (1979) – UNESCO. 1979. Map of the world distribution of arid regions:
Explanatory note, MAP Technical Notes 7, UNESCO, 54 pp + map, Paris.

Marius Lungu, Liliana Panaitescu, Simona Niţă190