Arguments for Free Trade and the costs of restricting Free Trade.
39
Arguments for Free Trade and the costs of restricting Free Trade
-
Upload
logan-henry -
Category
Documents
-
view
221 -
download
1
Transcript of Arguments for Free Trade and the costs of restricting Free Trade.

Arguments for Free Trade and the costs of restricting Free
Trade

Why Trade with other nations?1. To get a good which cannot be produced locally,
or to obtain a resource that is not available locally.
For the U.S., coffee would be such a good;
Certain metals for cars and military goods, etc
2. To obtain a good which can be produced in your country but to get that good at a cheaper price (that is at a lower opportunity cost).
Trade is a positive-sum game.
Both Nations will benefit by engaging in international trade.

Facts about international trade• International trade is as large as it ever has been and
is growing every year. 2005 - value in U.S. dollars $10.5 trillion dollars
• Top 10 exporting countries (as a % of world trade): Germany 9.3, U.S. 8.7 , China 7.3, Japan 5.7, France 4.4, Netherlands 3.9, U.K. 3.7, Italy 3.5, Canada 3.4, Belgium 3.2
• Top 10 importing countries(as a % of world trade): U.S. 16.1, Germany 7.2, China 6.1, Japan 4.8, U.K. 4.7, France 4.6, Italy 3.5, Netherlands 3.3, Canada 3.0, Belgium 3.0
• Most trade (73%) is from manufactured goods, of which machinery and transportation equipment are the most traded.
• Food, raw materials, and fuel make up 24.5% of trade.

Principal U.S. Exports & Imports of goods, 2006(in billions of $)
Exports (in billions of $)__Auto Vehicles & Parts 107.1Semiconductors 52.4Computers & acc. 47.4Chemicals 45.4Civilian Aircraft 40.7Engines(Aircraft & Ind) 32.8Industrial Machines 32.7Pharmaceutical Prep 30.8Electric Apparatus 29.7Telecommunications 28.9Plastic Materials 27.8Medical Equipment 22.7Civilian Aircraft Parts 17.4Fuel Oil 12.1
Imports (in billions of $)Auto Vehicles & Parts 256.6Crude Oil 216.8Computers & acc. 101.4Apparel 91.1Pharmaceutical Prep 64.6Other Petrol Products 44.1T.V., VCR’s, etc 41.8Telecommunications 40.2Electric Apparatus 33.6Chemicals 32.7Industrial Machines 29.0Sporting goods, toys 28.8Natural Gas 28.5Semiconductors 27.3
U.S. exports & imports of goods by area, 2006(in billions of $)
Exports to: Value % of total Total 1,037 100 Canada 230.6 22.2 Euro Union 213.9 20.6 Mexico 134.1 12.9 NICS 97.9 9.4 South America 89.0 8.6 Japan 59.6 5.7 China 55.2 5.3 OPEC 40.6 3.9 Africa 19.0 1.8Australia 17.8 1.7 Malaysia 12.6 1.2Other Europe 10.1 1.0 India 10.1 1.0 Russia 4.7 0.4
Imports from: Value % of totalTotal 1,855 100Euro Union 330.6 17.8Canada 303.4 16.3China 287.8 15.5Mexico 198.3 10.7Japan 148.1 8.0OPEC 145.5 7.8 South America 133.7 7.2NICS 109.8 5.9Africa 80.6 4.3Malaysia 36.5 2.0India 21.8 1.2Russia 19.8 1.1Other Europe 12.4 0.6Australia 8.2 0.4

Source:Bureau of Economic Analysis

Exports of goods & services as a % of GDPAs of August 2005

The Economic Basis for trade• Trade occurs between countries because the opportunity cost
(relative prices) of various goods differdiffer between countries.
Why do they differ? Because of differences in:1.Distribution of resources (different quantities of resources in countries)
Examples: Saudi Arabia has much more oil than Japan Climate may be favorable to the production of certain foods
China has much more labor resources than Canada
Countries specialize in the production of goods that require the resource they have in abundance because they can produce that good at a lower opportunity cost than other countries.
2.Technology/Productivity (different skills of workforce and/or resource quality)
U.S. has a highly skilled workforce that produces computer software & many pharmaceutical drugs.
Countries that have a greater technology in a good will produce it more efficiently and at a lower opportunity cost.

Free Trade (no government restrictions)• Benefit: Countries that engage in international trade, without
restrictions, will have greater consumption possibilitiesgreater consumption possibilities than without international trade. This is referred to as the gains gains from free tradefrom free trade.
• Definitions used in model:
a) Absolute advantage: being able to produce a good with less resources (per unit of output), or being able to produce more of a good with same resources (per unit of input) than another country
b) Comparative advantage: being able to produce a good at a lower opportunity cost than another country
Law of Comparative Advantage: Countries that specialize in goods which they produce cheapest (low opportunity cost)
and trade with other countries for goods in which they produce dearly (high opportunity cost)
will be able to consume moreconsume more of both goods of both goods than without international trade.

Law of comparative advantage • Both nations will benefit with more consumption • However, not all citizens in a country gain from free trade.
Some citizens will be made worse off, but the country as a whole is better off because:
The gainers are so much better off they could (if possible) compensate those who lose out and still be better off.
Two Models:• The Heckscher-Ohlin model. A country has a comparative
advantage in a good whose production is intensive in the factors that a country has in abundance. – Countries tend to export goods that are intensive in the
factors they have in abundance.• The Ricardian model of international trade analyzes
international trade under the assumption of differing technologies and that opportunity costs are constant.
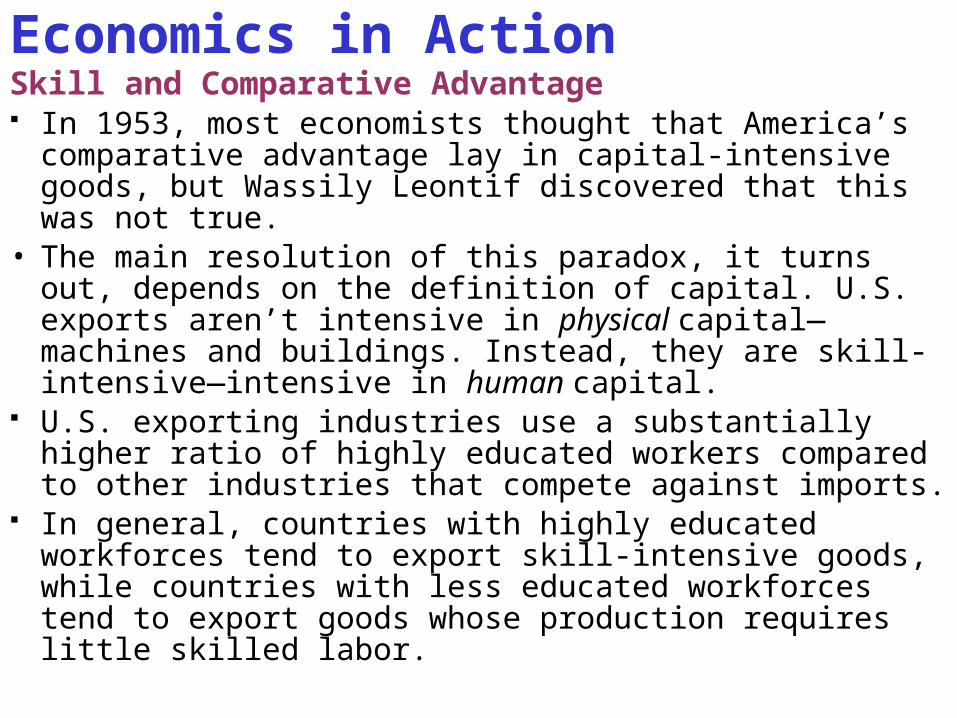
Economics in ActionSkill and Comparative Advantage In 1953, most economists thought that America’s
comparative advantage lay in capital-intensive goods, but Wassily Leontif discovered that this was not true.
• The main resolution of this paradox, it turns out, depends on the definition of capital. U.S. exports aren’t intensive in physical capital—machines and buildings. Instead, they are skill-intensive—intensive in human capital.
U.S. exporting industries use a substantially higher ratio of highly educated workers compared to other industries that compete against imports.
In general, countries with highly educated workforces tend to export skill-intensive goods, while countries with less educated workforces tend to export goods whose production requires little skilled labor.

Free Trade (no government restrictions)Law of comparative advantage
• PPF Example: Two countries (U.S. & Brazil)
Each produce two goods ( Coffee & Wheat)
Assume:
1.Constant opportunity cost between the two goods inside each country (means the PPF will be a straight line)
2. Opportunity costs between U.S. & Brazil are different
3. Countries are initially isolated (autarky)

Cof
f ee(
tons
)
Cof
fee(
tons
)
Wheat(tons) Wheat(tons)
U.S. Brazil
30
30
20
10U.S. can produce either 30 tons of coffee or 30 tons of wheat Brazil can produce either 20 tons of coffee or 10 tons of wheat
12
18
4
8
A
B
World Production of Coffee = 12 + 4 = 16 World Production of Wheat = 18 + 8 = 26
To make this example more concrete assume the U.S. is currently producing at point A
and Brazil is producing at point B.

Cof
f ee(
tons
)
Cof
fee(
tons
)
Wheat(tons) Wheat(tons)
U.S. Brazil
30
30
20
10
12
18
4
8
U.S. can produce either 30 tons of coffee or 30 tons of wheat Brazil can produce either 20 tons of coffee or 10 tons of wheat
4
A
B
U.S. has an absolute advantage in both goods.Does this mean the two countries cannot benefit from trade?No. Benefits from trade are based on comparative, not absolute advantage.

Cof
f ee(
tons
)
Cof
fee(
tons
)
Wheat(tons) Wheat(tons)
U.S. Brazil
30
30
20
10
Opportunity cost of wheat for U.S.= 30 coffee / 30 wheat =1 coffeeOpportunity cost of wheat for Brazil =20 coffee/10 wheat=2 coffee U.S. has comparative advantage in wheatOpportunity cost of coffee for U.S.=30 wheat/30 coffee=1 wheatOpportunity cost coffee for Brazil=10 wheat/20 coffee=1/2 wheat Brazil has comparative advantage in coffeeAs long as opportunity costs differ between countries each nation must have a comparative advantage in at least one good.
Slope of PPF = -1
Slope of PPF = -2
Wheat(tons)30
12
18
4
8
4
A
B

Cof
f ee(
tons
)
Cof
fee(
tons
)
Wheat(tons) Wheat(tons)
U.S. Brazil
30
20
10Wheat(tons)30
12
18
4
8
4
A
BW
C
Notice that Wheat production is 30 and coffee production is 20 which is greater world production than without trade!How do U.S. Citizens get coffee now? By trading with Brazil!How do Brazilians get wheat? By trading with the U.S.!What price will wheat producers want to sell at to people in Brazil?
According to the law of comparative advantage the U.S. will specialize in Wheat (production moves to point W)Brazil will specialize in Coffee (production moves to point C)
Slope of PPF = -1 Slope of PPF = -2

Cof
f ee(
tons
)
Cof
fee(
tons
)
Wheat(tons) Wheat(tons)
U.S. Brazil
30
20
10Wheat(tons)30
12
18
4
8
4
A
BW
C
Opportunity cost of wheat for U.S.=30 coffee/30 wheat=1 coffee Opportunity cost of wheat for Brazil=20 coffee/10 wheat=2 coffee
U.S. firms can get 1 coffee for 1 wheat in U.S. They must get more than 1 coffee from Brazilians to make them better off.Brazilians currently pay 2 coffee for 1 wheat. They must pay less than 2 coffee to make them better off. Can a price be agreed to? Yes! Any price between 2 and 1 coffee for 1 wheat. Let’s assume a price of 1.5 coffee for 1 what is agreed on.
Slope of PPF = -1 Slope of PPF = -2

Cof
f ee(
tons
)
Cof
fee(
tons
)
Wheat(tons) Wheat(tons)
U.S. Brazil
30
20
10Wheat(tons)30
12
18
4
8
4
A
B
W
C
Slope of PPF = -1 Slope of PPF = -2
Trading Possibilitiesline (slope =1.5)
Trading Possibilitiesline (slope =1.5)
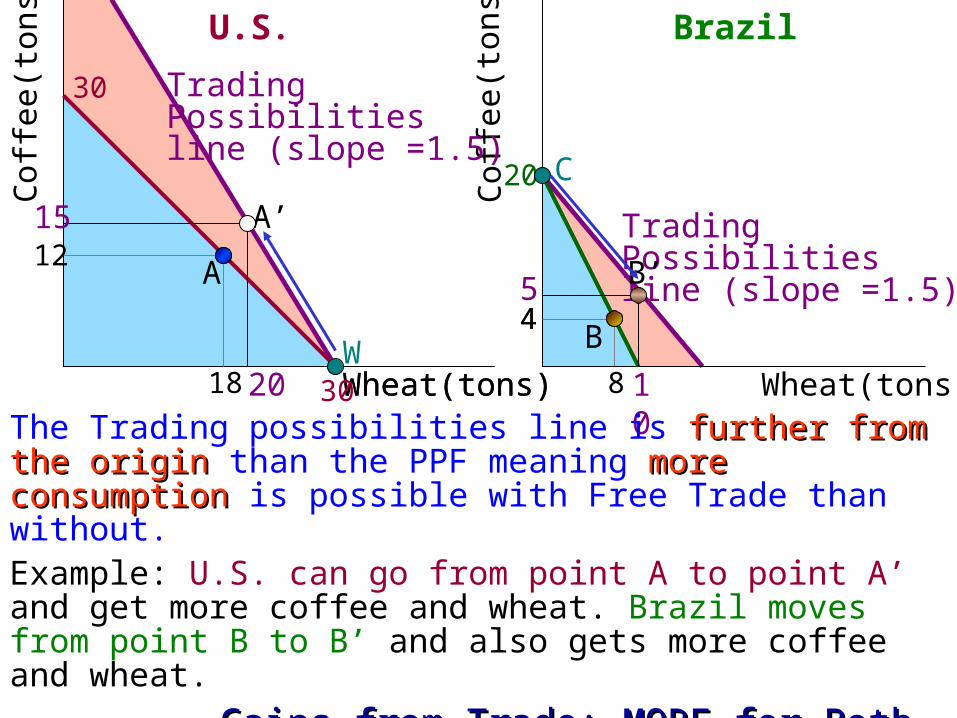
The U.S. exports wheat for coffee and Brazil exports coffee for wheatBoth Nations will now move along the Trading Possibilities line (instead of their PPF) to get the imported good.Both nations will now pay the same price for both goods.Price of the exported good increases compared to the no trade price; price of the imported good decreases compared to the no trade price.
A price of 1.5 coffee for 1 what is agreed on called the Terms of Trade.
Cof
f ee(
tons
)
Cof
fee(
tons
)
Wheat(tons) Wheat(tons)
U.S. Brazil
30
20
10Wheat(tons)30
12
18
4
8
4
A
BW
C
Trading Possibilitiesline (slope =1.5)
Trading Possibilitiesline (slope =1.5)
A’
B’
15
20
5
The Trading possibilities line is further from the originfurther from the origin than the PPF meaning more consumptionmore consumption is possible with Free Trade than without.Example: U.S. can go from point A to point A’ and get more coffee and wheat. Brazil moves from point B to B’ and also gets more coffee and wheat.
Gains from Trade: MORE for Both countries! Gains from Trade: MORE for Both countries!
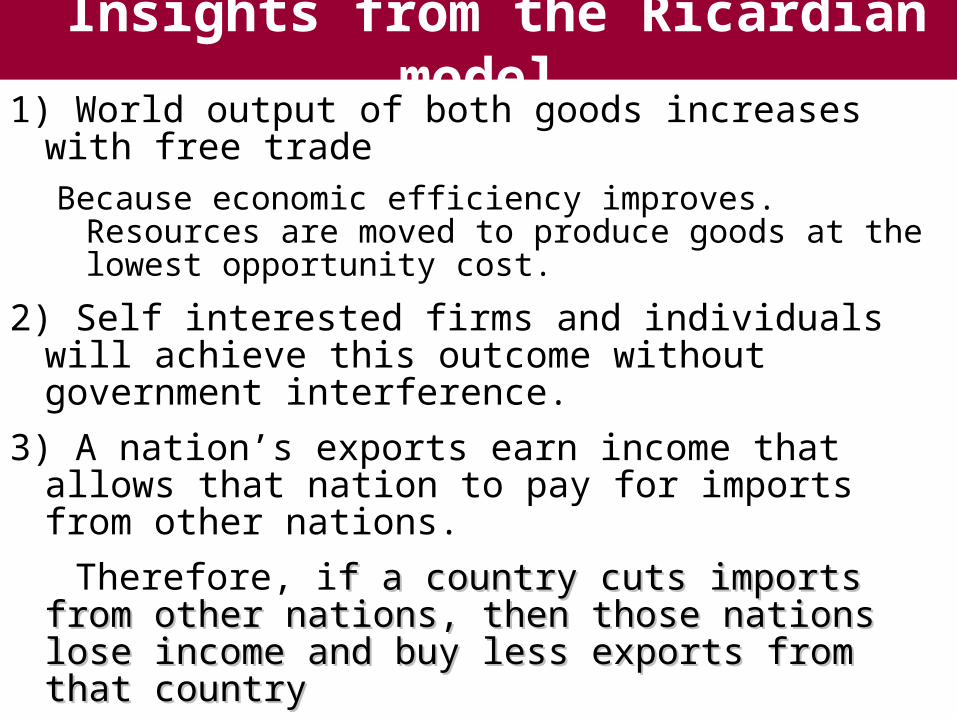
Insights from the Ricardian model1) World output of both goods increases with free trade
Because economic efficiency improves. Resources are moved to produce goods at the lowest opportunity cost.
2) Self interested firms and individuals will achieve this outcome without government interference.
3) A nation’s exports earn income that allows that nation to pay for imports from other nations.
Therefore, if a country cuts imports from other nations, f a country cuts imports from other nations, then those nations lose income and buy less exports then those nations lose income and buy less exports from that countryfrom that country

Supply, Demand,
and International Trade
Price of Cars
Domestic Supply
PNo Trade
DomesticDemand
Quantity of CarsQNo Trade
A
Consumer Surplus
Producer Surplus
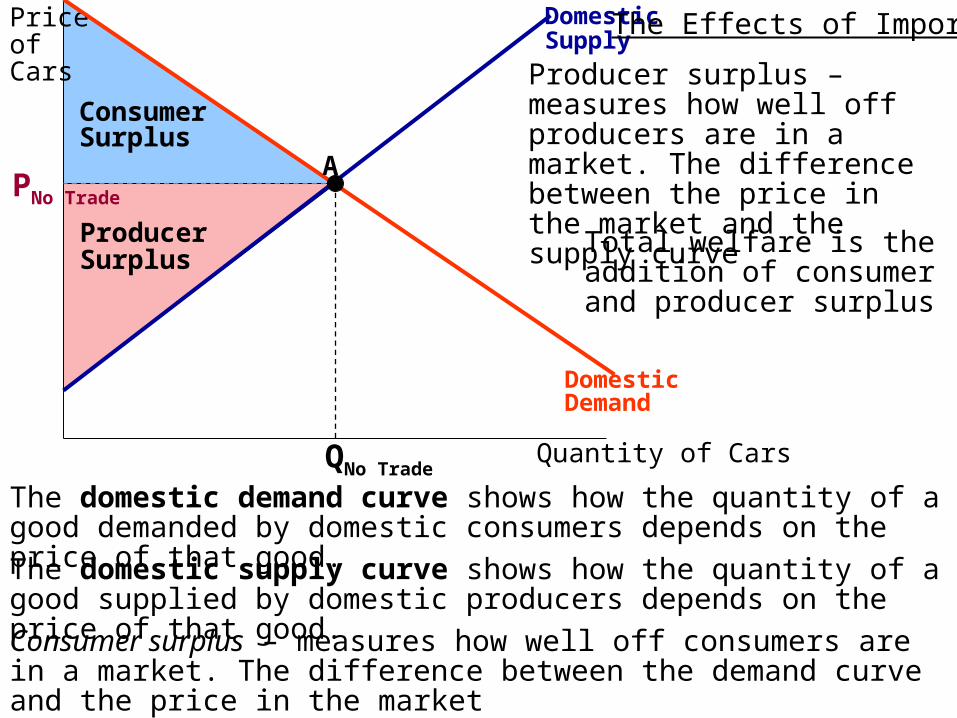
Consumer surplus – measures how well off consumers are in a market. The difference between the demand curve and the price in the market
Producer surplus – measures how well off producers are in a market. The difference between the price in the market and the supply curve
Total welfare is the addition of consumer and producer surplus
The Effects of Imports
The domestic demand curve shows how the quantity of a good demanded by domestic consumers depends on the price of that good.
The domestic supply curve shows how the quantity of a good supplied by domestic producers depends on the price of that good.

Price of Cars
Domestic Supply
PNo Trade
DomesticDemand
Quantity of CarsQNo Trade
A
PWorld
QDS QDD
Imports
The Effects of Imports
B C
When a market is opened to trade, competition among importers or exporters drives the domestic price to equality with the world price. If the world price is lower than the autarky price, trade leads to imports and a fall in the domestic price. There are overall gains from trade because consumer gains exceed the producer losses.
Consumers gain some of the Producer surplus as price decreases
They also gain an area that would not exist without trade

Price of Cars
Domestic Supply
PNo Trade
DomesticDemand
Quantity of CarsQNo Trade
A
PWorld
QDSQDD
Exports
The Effects of Exports
B C
If the world price is higher than the autarky price, trade leads to exports and a rise in the domestic price.
Producers gain some of the Consumer surplus as price increases
They also gain an area that would not exist without trade.
There are overall gains from trade because the producer gains exceed the consumers losses.

International Trade and Wages• Exporting industries produce goods and services
that are sold abroad.• Import-competing industries produce goods and
services that are also imported.• International trade tends to increase the demand
for factors that are abundant in our country compared with other countries.
• It will decrease the demand for factors that are scarce in our country compared with other countries.
• As a result, the prices of abundant factors tend to rise, and the prices of scarce factors tend to fall as international trade grows.

Effects of Trade Protection• Policies that limit imports are known as trade
protection or simply as protection.• Most economists advocate free trade, although many
governments engage in trade protection of import-competing industries.
• The two most common protectionist policies are tariffs and import quotas. In rare instances, governments subsidize export industries.
Why? Because some citizens are hurt by free trade, especially
in the importing good industry where jobs are lost.They ask the government to protect them from the
effects of free trade by restricting the quantity of the imported good.
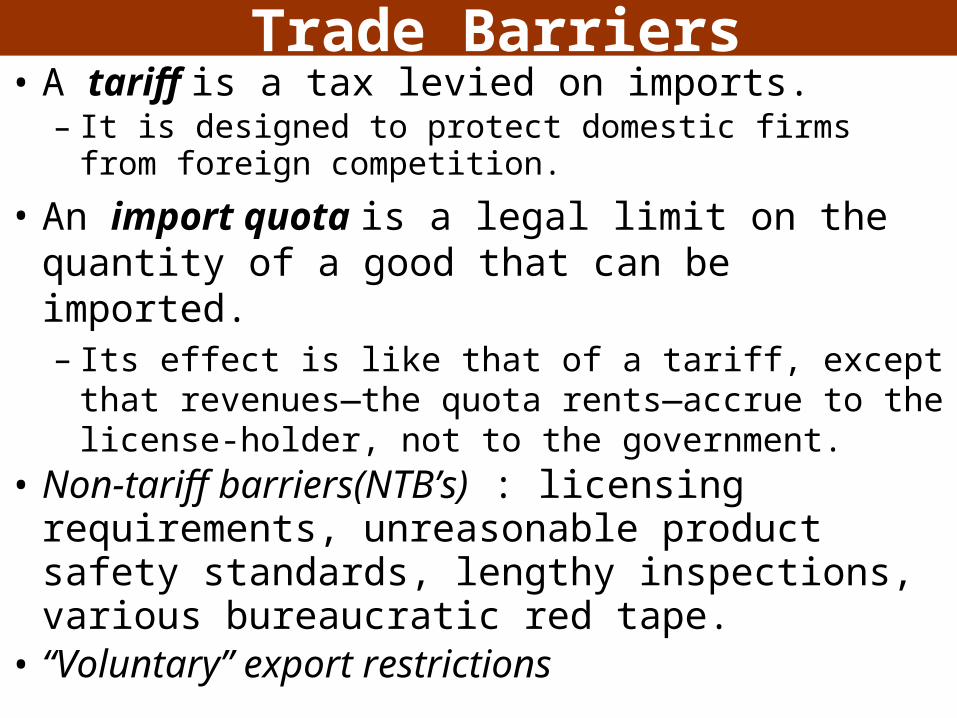
Trade Barriers• A tariff is a tax levied on imports.
– It is designed to protect domestic firms from foreign competition.
• An import quota is a legal limit on the quantity of a good that can be imported. – Its effect is like that of a tariff, except that revenues
—the quota rents—accrue to the license-holder, not to the government.
• Non-tariff barriers(NTB’s) : licensing requirements, unreasonable product safety standards, lengthy inspections, various bureaucratic red tape.
• “Voluntary” export restrictions

Price of Cars
Domestic Supply
PNo Trade
DomesticDemand
Quantity of CarsQNT
A
PWorld
QDS QDD
Imports with free trade
The Effects of a Tariff
B C
ED
QDST QDD
T
Imports with Tariff
PTariff
Government Revenue
Tariff
It raises the domestic price above the world price, leading to a fall in trade, total consumption, and a rise in domestic production.
Domestic producers and the government gain, but consumer has lost more than producers and government gains, leading to a deadweight loss in total surplus.

Source: Federal Reserve bank of Dallas, 2002 annual report

Costs of Protectionism
Source: Federal Reserve bank of Dallas, 2002 annual report

Effects of tariffs In addition tariffs (and other trade barriers):1) Expand inefficient industries (importing industries)
and contract efficient industries (exporting industries)
2) May invite retaliation from other nations whose exports have declined.
3) Price of domestic substitute goods will also increase (less competition for domestic firms)
4) More than likely also cause exports of the country to go down.

Trade Protection in the United States The United States today generally follows a policy of free
trade. Most manufactured goods are subject either to no or a low tariff.
There are two areas where imports are limited: Agriculture: A certain amount of imports are subject to low
a tariff rate and this acts like an import quota because only importers that are license holders are allowed to pay the low rate.
Clothing and Textiles: A surge of clothing from China led to a partial re-imposition of import quotas which had otherwise been removed at the start of 2005.
According to official U.S. estimates, the total economic cost of all quantifiable restrictions on imports is about $3.7 billion a year, or around one-fortieth of a percent on national income. Of this, about $1.9 billion comes from restrictions on clothing imports, $0.8 billion from restrictions on sugar, and $0.6 billion from restrictions on dairy. Everything else is small change.
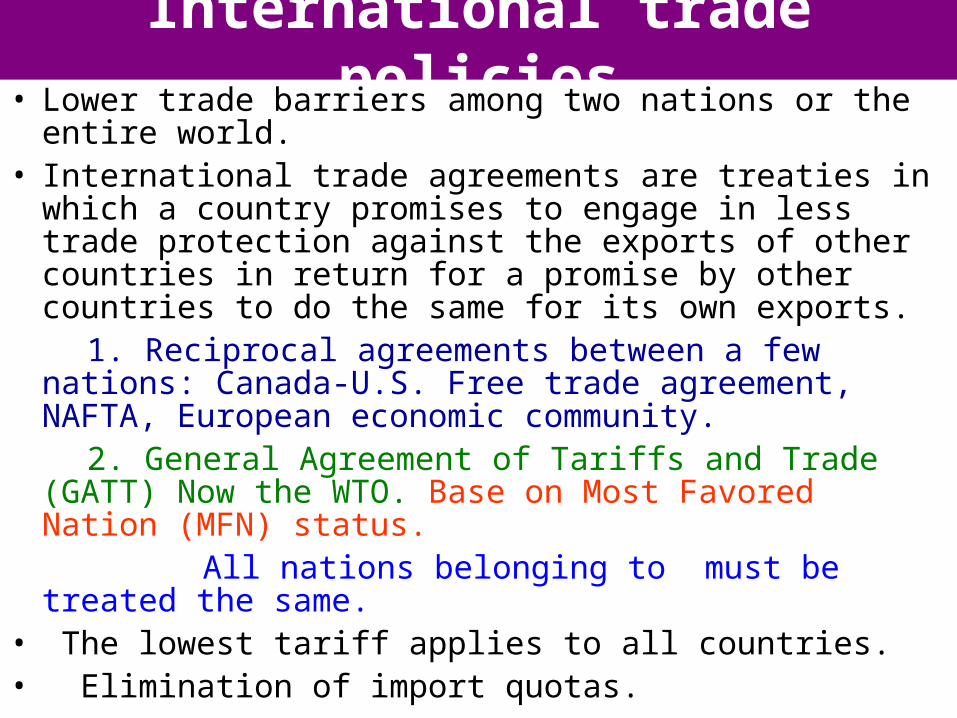
International trade policies• Lower trade barriers among two nations or the entire
world.• International trade agreements are treaties in which a
country promises to engage in less trade protection against the exports of other countries in return for a promise by other countries to do the same for its own exports.
1. Reciprocal agreements between a few nations: Canada-U.S. Free trade agreement, NAFTA, European economic community.
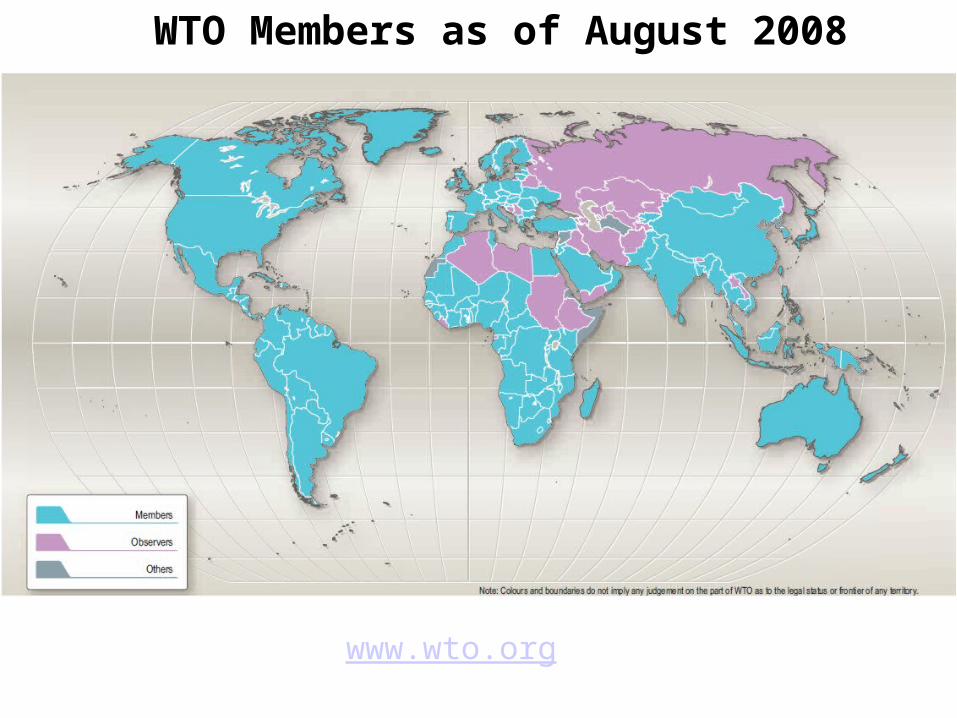
2. General Agreement of Tariffs and Trade (GATT) Now the WTO. Base on Most Favored Nation (MFN) status.
All nations belonging to must be treated the same. • The lowest tariff applies to all countries. • Elimination of import quotas.

World Trade Organization• Dedicated to continue GATT in a more formal
manner
• A “court” that will settle trade disputes
• Example: U.S. Steel tariffs were found to be in violation of the WTO agreement…
…therefore, affected nations would legally be able to punish U.S. with tariffs for violating agreement unless Steel tariffs were eliminated
• U.S. has agreed to drop tariffs and no punishing tariffs will be put on U.S. goods.

Since the end of World War II, there have been nine rounds of global trade negotiations.
A trade round is a multiyear process in which negotiators from many countries cut complex deals on trade policy.
The Doha Round started off in Doha, Qatar in 2001 and then moved to Geneva, Switzerland.
By late 2007, talks appeared deadlocked. Poorer countries that still have substantial trade protection
in manufactured goods, refused to reduce that protection without an agreement by rich countries to reduce the substantial subsidies they give farmers.
Because the farm lobbies in rich countries have a lot of political power, these countries weren’t willing to make sufficient concessions.
Even if the Doha Round fails, previous trade agreements will remain in force.
Economics in Action: The Doha Deadlock

1. International trade is of growing importance to the United States and of even greater importance to most other countries. Foreign trade has been growing rapidly, a phenomenon called globalization.
2. The Ricardian model of international trade assumes that opportunity costs are constant. It shows that there are gains from trade: two countries are better off with trade than in autarky.
3. The Heckscher–Ohlin model shows how differences in factor endowments determine comparative advantage.• Goods differ in factor intensity.• Countries tend to export goods that are intensive in the
factors they have in abundance.
Summary
4. The domestic demand curve and the domestic supply curve determine the price of a good in autarky. When international trade occurs, the domestic price is driven to equality with the world price, the price at which the good is bought and sold abroad.
5. If the world price is below the autarky price, a good is imported. This leads to an increase in consumer surplus, a fall in producer surplus, and a gain in total surplus. If the world price is above the autarky price, a good is exported. This leads to an increase in producer surplus, a fall in consumer surplus, and a gain in total surplus.
6. International trade leads to expansion in exporting industries and contraction in import-competing industries.
Summary
7. Most economists advocate free trade, but in practice many governments engage in trade protection.
8. A tariff is a tax levied on imports. An import quota is a legal limit on the quantity of a good that can be imported.
9. Although several popular arguments have been made in favor of trade protection, in practice the main reason for protection is probably political: import-competing industries are well-organized and well-informed about how they gain from trade protection, while consumers are unaware of the costs they pay.
10. Many concerns have been raised about the effects of globalization including ncome inequality due to the surge in imports from relatively poor countries and offshore outsourcing.
Summary