Are You Certain In Your Skills? Self ... - Scholars' Bank Home
33
Are You Certain In Your Skills? Self-Evaluations and Responses to Ambiguous Feedback By Danaan J. O’Donnell-Davidson A Thesis Presented to the Department of Psychology and the Robert D. Clark Honors College in partial fulfillment of the requirements for the degree of Bachelor of Science at the University of Oregon February 2014
Transcript of Are You Certain In Your Skills? Self ... - Scholars' Bank Home

Are You Certain In Your Skills?
Self-Evaluations and Responses to Ambiguous Feedback
By
Danaan J. O’Donnell-Davidson
A Thesis
Presented to the Department of Psychology and the Robert D. Clark Honors College
in partial fulfillment of the requirements for the degree of Bachelor of Science at the University of Oregon
February 2014
An Abstract of the Thesis of
Danaan James O'Donneii-Davidson for the degree of
Bachelor of Science in the Department of Psychology for March 2013
Title: Are You Certain In Your Skills?
Self Evaluations and Responses to Ambiguous Feedback
Approved:~ ~.,. ... __ _ ~~
Professor Sara Hodges
The STEM fields (science, technology, engineering, and mathematics) have
been historically male dominated, and continue to be so today. The reasons for this are
numerous and complex. This study focuses on the role that self-perceptions of ability
play in interpreting ambiguous feedback.
Participants consisted of 508 psychology and linguistic students recruited from
the University of Oregon. Everyone learned about a •·new dimension of human
cognitive performance" called Integrational Complexity. Those in an "excel" condition
were told that they should do well at IC, and those in an "uncertain" condition were told
that their performance ''on IC tasks is more uncertain and variable."
Participants completed an "Integrational Complexity Skills Assessment." All
participants. including those in the control condition, were then informed that their IC
skills were in the average range. They continued to another survey that gauged their
feelings towards IC. We hypothesized that participants made to feel uncertain about
their skills in IC would have more negative feelings towards the domain than either the
control group or the excel group.
Participants' scores for the self-perception measure (F(2,438)=3.96, p =0.02)
confirmed our hypothesis. We found an etTect for gender as well, such that men
reported significantly more positive self-perceptions with regards to IC than did women
(F(1,439)=34.44,p<0.001). We also found that women felt their scores to be more
accurate than did men (F(1,439)= 9.64, p= 0.002).
ii

iii
Acknowledgements
Without Sara Hodges and Karyn Lewis I would not have completed this thesis. I am
immensely grateful to them both for their guidance, and I couldn’t have asked for better
advisors. I would also like to thank Louise Bishop for serving as my CHC
representative. These three women have been wonderful mentors, and I hope to never
lose their friendship.
iv
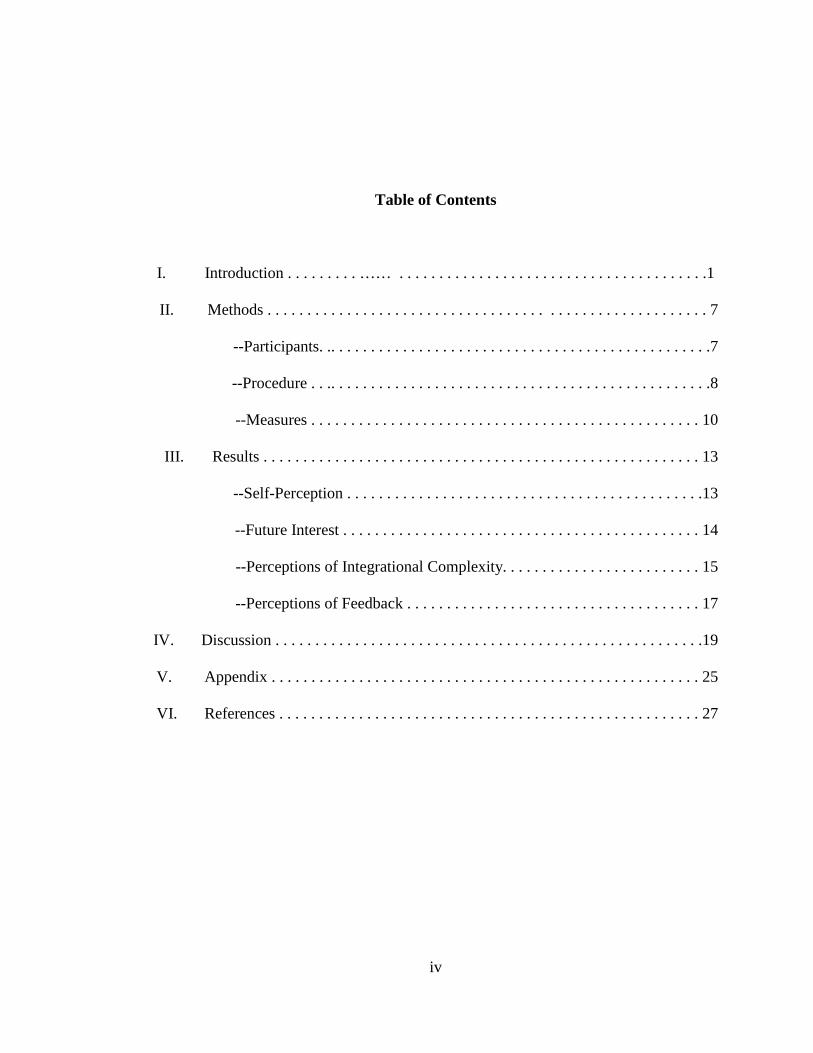
Table of Contents
I. Introduction . . . . . . . . . …… . . . . . . . . . . . . . . . . . . . . . . . . . . . . . . . . . . . . . . .1
II. Methods . . . . . . . . . . . . . . . . . . . . . . . . . . . . . . . . . . . . . . . . . . . . . . . . . . . . . . . 7
--Participants. .. . . . . . . . . . . . . . . . . . . . . . . . . . . . . . . . . . . . . . . . . . . . . . . .7
--Procedure . . .. . . . . . . . . . . . . . . . . . . . . . . . . . . . . . . . . . . . . . . . . . . . . . . .8
--Measures . . . . . . . . . . . . . . . . . . . . . . . . . . . . . . . . . . . . . . . . . . . . . . . . . 10
III. Results . . . . . . . . . . . . . . . . . . . . . . . . . . . . . . . . . . . . . . . . . . . . . . . . . . . . . . . 13
--Self-Perception . . . . . . . . . . . . . . . . . . . . . . . . . . . . . . . . . . . . . . . . . . . . .13
--Future Interest . . . . . . . . . . . . . . . . . . . . . . . . . . . . . . . . . . . . . . . . . . . . . 14
--Perceptions of Integrational Complexity. . . . . . . . . . . . . . . . . . . . . . . . . 15
--Perceptions of Feedback . . . . . . . . . . . . . . . . . . . . . . . . . . . . . . . . . . . . . 17
IV. Discussion . . . . . . . . . . . . . . . . . . . . . . . . . . . . . . . . . . . . . . . . . . . . . . . . . . . . . .19
V. Appendix . . . . . . . . . . . . . . . . . . . . . . . . . . . . . . . . . . . . . . . . . . . . . . . . . . . . . . 25
VI. References . . . . . . . . . . . . . . . . . . . . . . . . . . . . . . . . . . . . . . . . . . . . . . . . . . . . . 27
Are You Certain In Your Skills? Self-Evaluations and Responses to Ambiguous Feedback
Introduction Have you ever entered a classroom and wondered, "Am I any good at this
subject?" This situation can happen to anyone, and the potential reasons for its
occurrence are many, but certain people will experience these kinds of doubts more
often than others. This frequency is in part predicted by demographic characteristics of
the individual as well as what field of work/study the individual occupies. For example,
imagine you are a woman in one of the STEM fields (science, technology, engineering
and math). Most of your peers, teachers, and cited authors/researchers are male. This
atmosphere may prompt you to ask, “Why are there so few women here?” which could
lead to, “Are women bad at STEM?” and finally, “Am I bad at STEM?”
What makes STEM fields different from other fields? For one, the fields of
science, engineering, technology and math have been historically male dominated, and
continue to be so today (Blickenstaff, 2005). These fields are slow to gender equalize;
the only ones that seem to have come close so far are medicine and the life sciences,
and even these, at upper levels of management and academics, continue to be
overwhelmingly male (Beede et al., 2010; Bickel et al., 2002). The reasons for this are
many.
One reason is that some people still believe the long standing stereotype that
women are biologically worse than men at the kind of thinking necessary in STEM
fields (Steele, 1997), despite ample evidence to the contrary (Spelke, 2005). A meta-
analysis from 2010 concluded that there was no gender difference in recent studies of
mathematic performance (Lindberg, Hyde, Petersen, & Linn 2010). In 2005, Lawrence

2
Summers, at the time the president of Harvard University, suggested that the lack of
women in STEM was due to inherent sex differences (Steele & Ambady, 2006; Zhang,
Schmader & Forbes, 2009). Imagine the effects that statement could have on females in
STEM, especially those attending Harvard! Even if a woman does not believe the
stereotype, the mere fact that it exists can have powerful influences on her desire to
remain in the field. For instance, it was shown that simply changing the décor of
computer science classrooms from Star Trek posters and videogames to nature posters
and phone books increased the interest of female undergraduates in computer science
(Cheryan, Plaut, Davies, & Steele, 2009). The classic decorations in computer science
classrooms broadcast a masculine stereotype, which discourages women from entering
the field.
Besides the issues of stereotypes and male-oriented décor, STEM fields contain
relatively few women professors, and hence fail to provide role models within the
gender (Stout, Dasgupta, Hunsinger & McManus, 2011). Having role models who
possess the same characteristics (gender, ethnicity, etc.) shows students and employees
through concrete examples that they can reach the same levels of achievement as their
role model (Dasgupta & Asgari, 2004; Dee, 2001). Female role models can help
counteract negative stereotypes because they provide salient proof that women possess
the same skills as men and can succeed within the field. Right now, this proof remains
elusive to many women starting out in STEM fields because these fields consist
primarily of men, both in terms of students and faculty (NSF, 2011). Even in
circumstances of gender equity by number, labs usually have a male primary

3
investigator—communicating that women may be somewhat welcome, but only men
have what it takes to climb to the top of the ladder.
Even in situations with female professors, female students can face disparate
treatment. Both male and female professors may treat their female students differently
than their male students, and—consciously or not—treat their work differently as well
(Gunderson, 2012). Teacher’s attitudes strongly influence the views that students have
of their abilities. Hence, if a teacher expects less from students, then the students
oftentimes expect less from themselves. This is especially true if their teachers hold a
fixed (innate) theory of math intelligence (Rattan, Good, & Dweck, 2012). If female
students then receive lower grades (or assume their grades to be lower) on tests than
their male counterparts, they could attribute it to their own shortcomings.
This possibility is strengthened since women tend to underestimate their
performance on societally classified “masculine” tasks (Beyer, 1998). A study found
that even when women performed as well as men on a science quiz, they assumed they
performed worse because they believed they had worse scientific reasoning than men.
Consequently, when asked to enter a science competition, they were more likely to
refuse (Ehrlinger & Dunning, 2003). Women also attribute perceived poor performance
to a lack of underlying ability with greater frequency than men (Felder, Felder, Mauney,
Hamrin & Dietz, 1995). Taken together, this means that women may misjudge their
level of performance as poor and attribute it to a lack of underlying ability, when in
reality they could be performing as well—or even better—than male peers in the field.
What are the consequences of this compromising atmosphere?
4
To start, for those that begin to doubt their abilities, self-doubt predicts self-
defeating cognitive, emotional, and behavioral outcomes in the achievement realm.
When people doubt their self-competence, they are more likely to self-handicap and
attribute success to luck. This in turn may lead to further self-doubt (Braslow,
Guerrettaz, Arkin, & Oleson, 2012). Importantly, in STEM fields, the choice to pursue a
vocation is mediated by beliefs in one’s ability (Hackett, 1985). Lent and colleagues
found that self-efficacy predicted grades, persistence, and the range of perceived
options in STEM fields (Lent, Brown, & Larkin 1986; Multon, Brown, & Lent 1991).
People who think they have strong STEM abilities remain within their field, and those
who do not tend to change their focus (Zhang, et al., 2009).
It is important to understand how these types of self-perceptions form because
perception of performance is a better predictor of future interest than actual
performance (Ehrlinger & Dunning, 2003). In fact, actual performance does not even
necessarily predict self-ratings of abilities, especially for children (Dweck, 1986). How
a person thinks she will perform predicts self-ratings of performance (Beyer & Bowden,
1997). When individuals are told that they have high ability in a domain, they predict
that they will do better on future performances within the domain than those who have
been given less positive feedback regarding their domain specific abilities (Stangor,
Carr & Kiang, 1998). However, factors such as stereotypes (Bornholt, 2000; Stangor et
al., 1998) and social contexts (Walton & Cohen, 2007) that favor men in certain
domains—such as STEM fields—influence these expectancies. All this taken together
suggests that if STEM students initially doubt their abilities, even positive performance
may not change their view of self-competence, and these view will likely lead to

5
discontinuation within the field. However, if people expect to perform well in STEM,
they will continue to rate their performance positively regardless of actual performance,
and they will be more likely to remain within the field. At the same time, current
stereotypes and social contexts likely prevent women from holding these positive
expectancies to a comparable degree to men’s.
In short, historical discrimination along with female underrepresentation in
STEM fields has created a situation in which women may interpret feedback differently
than their male peers. However, it is unclear whether this process is unique to women in
STEM fields, or rather if anyone made uncertain about his or her abilities in a particular
field might interpret feedback in a less positive light than his or her peers. Pushing this
question further, is the discrimination and underrepresentation that women have
experienced in STEM even necessary to create a context in which individuals interpret
feedback negatively?
We designed the current study to examine how feelings of uncertainty about
abilities within a given domain affect opinions towards said domain and self-
perceptions of one’s ability in a given domain in the face of ambiguous feedback. In this
way our work furthers research exploring the experiences of women in STEM fields
and how those experiences affect the gender imbalance in STEM. However, we set out
to test whether similar processes might apply to any domain or situation that has created
a context in which individuals question their abilities and then receive ambiguous
feedback.
We chose to examine responses to ambiguous feedback specifically because
ambiguous feedback is more easily misinterpreted than other forms of feedback. While
6
most people tend to perform in the average range (feedback that indicates an average
performance is ambiguous because it does not clearly suggest a positive or negative
performance), not all people respond to this performance similarly. For example,
depressed individuals are more likely to interpret ambiguous feedback more negatively
than non-depressed individuals (Dykman, Abramson, Alloy, & Hartlage, 1989).
Additionally, the circumstance of receiving ambiguous feedback could differ
from that of receiving other feedback types. In the case of ambiguity, outside influences
(e.g., stereotypes) can more easily skew recipients’ interpretations of their level of
achievement (Dykman et al., 1989). Vulnerable populations, who are already at risk of
negative interpretation of the feedback they receive, have this hazard compounded when
the feedback is of an ambiguous nature. A student, if given an “A” on a test, will know
he or she performed well almost regardless of the situation, but when given a “B,” that
same student may now question his or her abilities.
The current study examines how feelings of uncertainty towards ability in a
given domain will affect the interpretation of ambiguous feedback within the domain.
We created a fictional domain (“integrational complexity”) to ensure no pre-existing
stereotypes can influence these results. Based on previous research (Beyer & Bowden,
1997), men may report higher scores on self-perception of ability measures than
women, but gender is not expected to moderate the effects of manipulating uncertainty,
described in more detail below.
Setting overall gender differences aside, the main purpose of this study is to find
out whether anyone, when made to feel uncertain about his or her skills in a given
domain and then provided with ambiguous feedback, will have more negative feelings
7
towards the domain in terms of self-perceptions, future interest, perceptions of the
domain, and perceptions of feedback. If uncertainty affects men and women alike, this
suggests that women’s underrepresentation in STEM is not due to innate ability
differences, but instead a normal response to uncertainty that is created for them in male
dominated/oriented fields.
To test this we assigned participants to one of three conditions where their
performance expectations in a novel domain were manipulated (uncertain expectation,
control (no expectation), or expectation to excel). Everyone received the same
ambiguous results and we then measured participants’ self-perceptions and feelings
towards the fabricated domain. We hypothesize that participants made to feel uncertain
about their skills in a given domain would have more negative feelings towards the
domain than either a control group or a group told that they would likely excel. We
included a control condition (where no performance expectancies were introduced) in
order to better understand whether uncertainty hurts self-perceptions or rather if
expecting to excel boosts self-perceptions. We hypothesize that both will be the case.
Method
Participants
A total of 508 psychology and linguistic students recruited from the human
subjects pool at the University of Oregon participated in this study for class research
credit. Due to the online nature of the experiment, students could participate in the study
at any time and place, at a computer of their choosing. Out of the 508 total participants,
73.6% were female and 26.4% male. Ages ranged from 18 to 43 (M=19.63, SD=2.53);
most participants were white (72.9%) and native English speakers (92.9%). Data were
8
excluded from 57 individuals for failure to pass the manipulation check (i.e., they could
not identify what condition they had been assigned to), 6 individuals who expressed
suspicion (discussed below), and another 5 individuals who did not complete the study,
leaving a total sample of 440 individuals.
Procedure
After reading an informed consent page and completing a basic demographic
survey, participants were brought to a screen on the computer explaining the purpose of
the study. Participants were told that the study was about “a new dimension of human
cognitive performance” that has gained psychologists’ interests as electronic and online
communication has increased. From this point on, all information given to the students
about this “cognitive dimension” was fictitious. This deception created an opportunity
for participants to form feelings towards a domain they had never previously
encountered, thus ensuring they had no preconceived notions regarding how they would
perform or whether they would belong. The cognitive dimension was called
Integrational Complexity (IC for short). Participants read that IC skills were important
for multitasking and electronic media skills and that IC skills were associated with
college success. After reading the description of IC, the procedure diverged for the
experimental and control conditions. In the control condition, participants continued
straight from the description of the domain of IC to the “Integrational Complexity Skills
Assessment” (described below).
In the experimental conditions, prior to the skills assessment, participants’
expectations for how they would perform on the assessment were manipulated.
Participants in the experimental conditions were told that when they first signed up to
9
be a part of the human subjects pool, among the background measures they initially
completed were measures that could predict how they would perform on tests requiring
IC skills. They were also told that previous research using these measures had identified
two types of cognitive profiles: “Group C,” who tend to perform well on IC tasks, and
“Group X,” whose performance “on IC tasks is more uncertain and variable.”
Participants were told that because they had already filled out the general survey, their
cognitive profiles could be calculated to see which group they were in. After clicking to
continue, a “loading” screen appeared in order to give the impression that their profile
was actually being computed. At this point participants in the experimental condition
were randomly assigned to one of the two IC groups (i.e., Group C or Group X) and
reminded of what that profile meant for IC performance (i.e., tendency to excel or
uncertain performance). Participants in the control condition were not told anything
about a preliminary measure that predicted their IC skills; nor were they told anything
about the two IC groups. After receiving the cognitive profile information, participants
were told that “To help us learn more about how this cognitive profile is related to IC,
next you will take a test of your IC skills.”
Participants in all conditions completed the bogus “Integrational Complexity
Skills Assessment.” This assessment consisted of 21 questions that were designed to
have no obvious correct answers so that participants would be unsure of how they were
performing. Some of the questions asked for the participant to make a comparison
judgment between two pictures (e.g., participants were shown pictures of two different
renderings of trains in motion and asked “Which train appears to be moving faster to
you?”). Other questions asked for the participant’s opinion on an optical illusion (e.g.,
10
participants were shown a picture of a spinning dancer and asked, “Which direction
does the dancer appear to be spinning?”).
After they finished the IC assessment, participants waited while the computer
ostensibly processed their results. All participants received the same feedback
regardless of condition. They were shown a graph that displayed the distribution of IC
skills in the general population with three areas labeled: low competency, average, and
high competency (see figure in the Appendix). The participant’s score was marked as a
red line in the center of the graph—clearly a very average score—and they were told
that:
Your Integrational Complexity skills are in the average range. Because they are not in the high competency range at this point, many Integrational Complexity tasks would challenge you, but your performance suggests that with training and practice, you could improve substantially at Integrational Complexity.
After receiving feedback on their performance participants were told that they would
answer questions about their experiences and the feedback they received.
Measures
As a manipulation check, first participants were asked which cognitive profile
they had been assigned to before completing the IC assessment: Group C, Group X, or
no profile provided (i.e., what participants in the control condition should have
responded, as they received no information regarding previous IC performance and
were not assigned any profile group).
Next, participants answered 10 questions created to gauge their responses
towards IC and their self-evaluations of their IC skills. Each of these questions fell into
one of four categories: self-perceptions, future interest, perceptions of IC, and
perceptions of feedback. Following each of the items, participants were given a sliding
11
bar scale that was anchored with “1” at the low end and “7” at the high end. The
specific items are described below.
Self-perceptions: Participants were asked, “Overall, how good do you think your
Integrational Complexity skills are?” with the sliding scale anchored by “poor” and
“superb.” They were also asked, “When you think about your Integrational Complexity
skills compared to other college students, where do you think your relative standing is?”
with the sliding scale anchored by “a great deal worse than other college students” and
“a great deal better than other college students.”
Future interest: Participants were asked to, “Imagine that a course offered on
campus was good at helping you improve your Integrational Complexity skills. How
likely would you be to take that course?” with the sliding scale anchored with “a great
deal less likely to take it” and “a great deal more likely to take it.” Participants were
also asked, “Imagine that the university offered workshops designed to help students
improve Integrational Complexity skills as part of a ‘college to career preparation
program.’ How interested would you be in taking such a workshop?” with the sliding
scale anchored with “not at all interested” and “very interested.”
Perceptions of IC: Participants were asked three questions about their
perceptions of IC. The first was “To what extent do you think you could improve your
Integrational Complexity skills?” (with the sliding scale going from “I couldn’t improve
them at all” and “I could improve them drastically”). They were also asked, “To what
extent do you think your level of Integrational Complexity skill is something you are
born with?” (with the sliding scale going from “not at all” to “entirely”) and “To what
extent do you think your Integrational Complexity skills are important to your future
12
success both in college and your chosen career?” (sliding scale ranging from “not at all
important” to “very important”).
Perceptions of feedback: Participants were asked three questions about their
perceptions of the IC feedback they received. These questions included “How positive
was the feedback you received on your Integrational Complexity test performance?”
(sliding scale ranging from “not at all positive” to “entirely positive”); “Do you think
the feedback you received on your Integrational Complexity test performance is
accurate of your actual skill level?” (sliding scale ranging from “not at all accurate” to
“entirely accurate”); and “How much did the feedback you received on your
Integrational Complexity test performance motivate you to improve your skills in the
future?” (sliding scale ranging from “not at all” to “very much”).
A final, open-ended question asked, “Do you have any additional comments or
concerns you'd like to share with us?” This was intended to allow participants to report
any suspicions they had regarding the study. Three participants reported that IC
probably was not real and that the study must be measuring something else. Two of
these participants indicated that the optical illusion questions were what gave it away,
and the third managed to ascertain that the average feedback was probably fake and
given to all participants. Only two participants identified the false nature of the results.
In total, the data of six participants were excluded based on their responses to this
question.
After completing the dependent measures, participants were provided with a
written debriefing form. It was explained to them that IC is not a real cognitive
dimension, that the participant’s assigned cognitive profile was fabricated as a

13
manipulation in the study, and the IC assessment they took and the feedback they
received were false. Participants were thanked for their time and asked not to talk about
the purposes of the study with anyone.
Results
Self-Perception:
The two items designed to assess Self-Perceptions were highly correlated (r=.52,
p<.001), thus these items were averaged to form a composite. We hypothesized that the
performance expectations would affect participants’ Self-Perceptions of their IC skills.
To test this, we used analysis of covariance (ANCOVA) to determine whether
expectation condition (Excel v. Uncertain v. Control) and gender (Male v. Female)
impacted Self-Perceptions, with GPA as a covariate in this analysis because GPA is a
real measurement of student competence, and we wanted to ascertain that performance
expectations would predict Self-Perceptions of IC above and beyond performance as a
student.
Consistent with our hypotheses, this analysis revealed a significant main effect
of condition (F(2,438)= 3.96, p= 0.02). We used post-hoc comparisons to break down
this omnibus effect. As displayed in Figure 1, the uncertain condition (M= 4.47, SD=
0.78) reported significantly lower average scores than the excel condition (M= 4.72,
SD= 0.75) on Self-Perceptions (p=0.003). The average score from the control group
(M= 4.58, SD= 0.75) fell between the uncertain and excel conditions and was not
significantly different from either. There was also a main effect of gender (see Figure
1). On average, males (M= 4.91, SD= 0.85) reported more positive Self-Perceptions
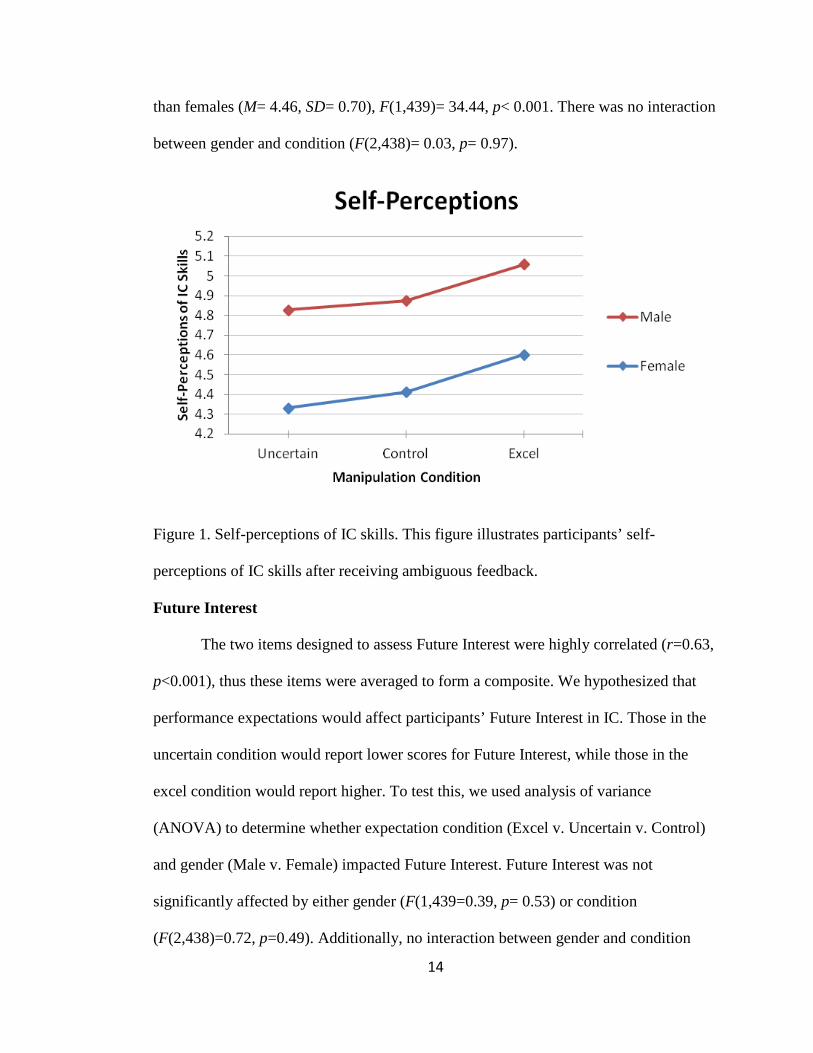
14
than females (M= 4.46, SD= 0.70), F(1,439)= 34.44, p< 0.001. There was no interaction
between gender and condition (F(2,438)= 0.03, p= 0.97).
Figure 1. Self-perceptions of IC skills. This figure illustrates participants’ self-
perceptions of IC skills after receiving ambiguous feedback.
Future Interest
The two items designed to assess Future Interest were highly correlated (r=0.63,
p<0.001), thus these items were averaged to form a composite. We hypothesized that
performance expectations would affect participants’ Future Interest in IC. Those in the
uncertain condition would report lower scores for Future Interest, while those in the
excel condition would report higher. To test this, we used analysis of variance
(ANOVA) to determine whether expectation condition (Excel v. Uncertain v. Control)
and gender (Male v. Female) impacted Future Interest. Future Interest was not
significantly affected by either gender (F(1,439=0.39, p= 0.53) or condition
(F(2,438)=0.72, p=0.49). Additionally, no interaction between gender and condition

15
was found (F(2,438)=0.013, p= 0.99). This suggests that all participants, regardless of
gender and condition, responded similarly to the measures of Future Interest.
Perceptions of Integrational Complexity:
Out of the three items designed to measure Perceptions of IC, the two measuring
Innateness and Improvability were not highly correlated (r= -0.03, p= 0.531), so they
were analyzed separately. The third item was measuring something different—the
importance of IC to Future Success—and was never intended for joint analysis.
However, we predicted the same pattern of results for all three measures: Those in the
uncertain condition would report lower scores for Perceptions of IC, while those in the
excel condition would report higher. To test whether expectation condition (Excel v.
Uncertain v. Control) and gender (Male v. Female) impacted Perceptions of IC, we ran
separate analyses of variance (ANOVAs) on Improvability, Innate Ability, and Future
Success.
The analysis of Improvability revealed that neither gender (F(1,439)=3.53, p=
0.23), nor the interaction of gender and condition (F(2,438)=0.37, p= 0.75) had an
effect. However, Improvability was significantly affected by condition, F(2,438)= 3.53,
p= 0.30. We used post-hoc comparisons to break down this omnibus effect. As
displayed in Figure 2, the excel condition (M= 4.83, SD= 1.18) reported significantly
lower average scores than the control condition (M= 5.32, SD= 1.05) on Improvability
(p< 0.001). The average score from the uncertain condition (M= 5.03, SD= 1.11)
trended towards significantly different from the control group (p= 0.053). Therefore,
participants in both experimental conditions, but especially the excel condition, were

16
less likely to feel they could improve their Integrational Complexity skills compared to
those in the control group.
Figure 2. Improvability of IC skills. This figure illustrates how improvable participants
felt their IC skills were after receiving ambiguous feedback.
Next, analysis revealed that neither gender (F(1,439)= 0.16, p=0.69) nor
condition (F(2, 438)= 2.44, p= 0.09) had an effect on perceptions of Innate Ability.
However, Innate Ability perceptions were significantly affected by the interaction of
gender and condition (F(2, 438)= 4.22, p= 0.015). As displayed in Figure 3, in the
uncertain condition women (M=3.57, SD=0.11) reported lower average scores than men
(M=4.08, SD=0.17), but in the control condition women (M=3.76, SD=0.16) reported
higher scores than men (M=3.29, SD=0.21), and in the excel condition women (M=3.83,
SD=0.12) and men (M=3.95, SD=0.19) reported very similar scores.
4.44.54.64.74.84.9
55.15.25.35.4
Uncertain Control Excel
Impr
ovab
ility
of I
C Sk
ills
Manipulation Condition
Improvability
Male
Female

17
Figure 3. Innateness of IC skills. This figure illustrates how innate participants felt their
IC skills were after receiving ambiguous feedback.
Neither of the main effects nor the interaction were significant for the Future
Success item.
Perceptions of Feedback:
We hypothesized that performance expectations would affect participants’
Perceptions of Feedback they received. Those in the uncertain condition would report
lower scores for Perceptions of Feedback, while those in the excel condition would
report higher. To test this, we used analysis of variance (ANOVA) to determine whether
expectation condition (Excel v. Uncertain v. Control) and gender (Male v. Female)
impacted Perceptions of Feedback. The three Perceptions of Feedback items: Positivity,
Accuracy, and Motivation were each analyzed individually because they addressed
different aspects of participant’s perceptions of their feedback.
2.52.72.93.13.33.53.73.94.14.3
Uncertain Control Excel
Inna
tene
ss o
f IC
Skill
s
Manipulation Condition
Innate Ability
Male
Female

18
The analysis of Positivity of IC feedback revealed that neither gender
(F(1,439)=1.42, p= 0.24), condition (F(2,438)=0.39, p=0.68), nor the interaction
between gender and condition (F(2,438)=1.20, p= 0.30) significantly affected Positivity.
This suggests that participants, regardless of gender and condition, did not differ in their
Positivity towards IC.
The analysis of Accuracy revealed that there was a main affect by gender. On
average, women (M= 4.23, SD= 1.41) reported that the feedback was more accurate
than did males (M=3.74, SD=1.46), F(1,439)= 9.64, p= 0.002 (see Figure 4). No effect
was found for either condition (F(2,438)=0.08, p= 0.93) or the interaction between
gender and condition (F(2,438)=0.002, p=1.00).
Figure 4. Accuracy of IC skills. This figure illustrates how accurate participants felt
their IC skills were after receiving ambiguous feedback.
The analysis of the Motivation item revealed that neither gender (F(1,439)=0.18,
p= 0.67), condition (F(2,438)=0.06, p= 0.94), nor the interaction between gender and
3.43.53.63.73.83.9
44.14.24.3
Uncertain Control Excel
Accu
racy
of I
C Sk
ills
Manipulation Condition
Accuracy
Male
Female
19
condition (F(2,438)=0.06, p= 0.94) had a significant effect on how much the feedback
affected participants’ motivation to improve their IC skills. This suggests that
participants, regardless of gender and condition, reported similar scores on the measures
of how feedback affected Motivation.
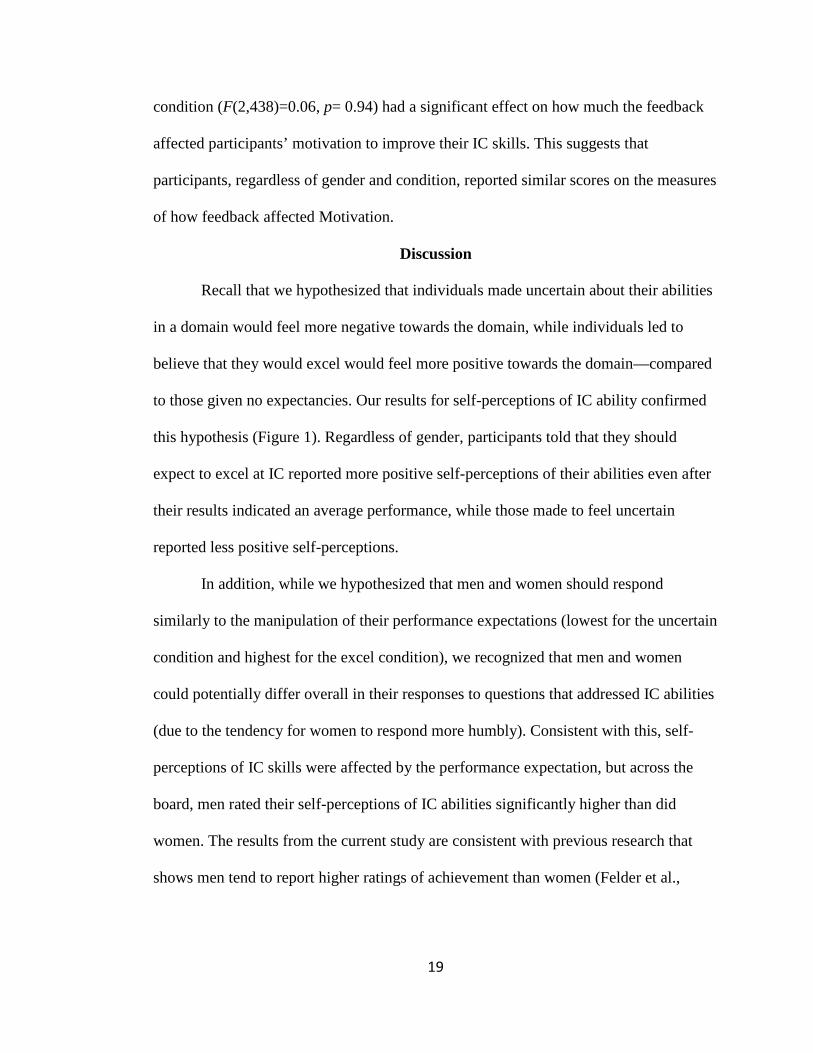
Discussion
Recall that we hypothesized that individuals made uncertain about their abilities
in a domain would feel more negative towards the domain, while individuals led to
believe that they would excel would feel more positive towards the domain—compared
to those given no expectancies. Our results for self-perceptions of IC ability confirmed
this hypothesis (Figure 1). Regardless of gender, participants told that they should
expect to excel at IC reported more positive self-perceptions of their abilities even after
their results indicated an average performance, while those made to feel uncertain
reported less positive self-perceptions.
In addition, while we hypothesized that men and women should respond
similarly to the manipulation of their performance expectations (lowest for the uncertain
condition and highest for the excel condition), we recognized that men and women
could potentially differ overall in their responses to questions that addressed IC abilities
(due to the tendency for women to respond more humbly). Consistent with this, self-
perceptions of IC skills were affected by the performance expectation, but across the
board, men rated their self-perceptions of IC abilities significantly higher than did
women. The results from the current study are consistent with previous research that
shows men tend to report higher ratings of achievement than women (Felder et al.,
20
1995). Our analyses of participants’ ratings of their feedback showed that women also
felt the feedback they received to be significantly more accurate than did men.
This combination of findings creates a troubling pattern. It seems that, compared
to men, women both under-rate their performance and feel that ambiguous feedback is
accurate. As discussed earlier, retention within STEM fields is largely dependent upon
self-perceptions, and women feeling that they are merely average may not be enough to
keep them in the field. It seems likely that men feel their results under-represent their
actual ability, considering that they reported lower scores for feedback accuracy and
higher scores for self-perception than women. In fact, if men felt their feedback was
inaccurately low, that could be the cause for their higher self-perception scores. Future
work testing whether men’s accuracy ratings were driven by their belief that their scores
were low would lend strength to this interpretation of the findings in the current study.
These two results—when combined—help paint a picture for why women leave
STEM fields. The field presents them with an atmosphere that promotes feelings of
uncertainty with regards to ability, and then, when presented with ambiguous feedback,
they feel that this feedback is accurate. Most people do not strive for “average”, and
when women receive this feedback, it is not surprising that they choose to pursue
another vocation. For men in STEM, the situation is quite different. They do not face a
compromising atmosphere; if anything, they are encouraged by societal stereotypes of
men’s competence at math and science. When they do receive ambiguous feedback,
they may dismiss it as inaccurate.
Another interesting set of results emerges when looking at how participants
reacted to being given information about their skills before the assessment. People who

21
were given no information felt more capable of improving their IC skills than people
who were given information—regardless of whether they were told that it was uncertain
how they would perform or whether they were led to believe they would excel (Figure
2). It seems that participants who were given a profile may have had their abilities
anchored by these assigned profiles and thus felt there was less possibility to improve
those skills.
These findings build upon previous research by Cimpian, Mu, and Erickson
(2012) that addressed children’s task performance after being linked to a social group.
They found that 4- to 7-year-olds who were told that “boys are good at this game”
performed worse “regardless of whether the children themselves belonged to that
group” (Cimpian et al., 2012). They hypothesized that this exposure to a stereotype led
to the children adopting entity theories – that is, theories that skills in this domain are
innate and fixed. Our results suggest that exposure to cognitive profiles may also lead to
an adoption of entity theories, and can even do so for adults.
A similar pattern of results presented itself in the innate ability item, but only for
men. Men who were given information about their abilities beforehand rated IC as
being the result of innate talent much more than males who were not given any
information about their abilities. It appears that men, by being assigned a cognitive
profile, were led to believe that IC abilities were innate, whereas women were not. This
strengthens a case for the formation of entity theories, but raises the question of why
men and women would differ. Perhaps men feel that if a human quality can be
measured (e.g. IQ), it is innate.

22
We originally hypothesized that manipulating how participants’ felt about their
abilities would affect how much future interest they held towards IC. While we didn’t
confirm this hypothesis, we know based on previous literature that for women in
STEM, the choice to remain within the field is dependent upon positive beliefs in one’s
abilities (Hackett, 1985; Lent et al., 1986; Multon et al., 1991), and the current study
shows that feeling uncertain about your abilities, and then receiving ambiguous
feedback, will result in more negative self-perceptions within the domain. In addition,
perhaps it should not surprise us that we found no results for future interest because this
study was based around a single event, whereas underrepresented groups face these
conditions on a continuous basis.
One potential limitation is that existing societal stereotypes could have affected
the outcomes of this study, despite the fact that a new domain—Integrational
Complexity—was created solely for the purpose of minimizing this potential. However,
one of the largest components of IC was described as multitasking ability, which people
correctly identify as favoring women (Stoet, 2013). If pre-existing stereotypes for this
skill were to have affected this study, we should have seen women report higher scores
in self-perception than men.
Individuals uncertain of their abilities, after receiving ambiguous feedback, feel
these abilities cannot be improved. Considering that participants made to feel uncertain
about their abilities perceived their abilities as significantly lower than did those who
were told they would excel, this result is concerning. Studies examining how to
counteract these results would be of interest.
23
A similar study to the current one, but using multiple delivery methods to
influence participants’ opinions regarding their abilities, instead of just cognitive
profiles, could give insight into why individuals who were given information about their
abilities (uncertain or positive), reacted differently to the improvability measures and, in
the case of men, to measures of innate ability. The potential study’s manipulation would
occur at the same time as it did in this study, but instead of varying cognitive profiles, it
would vary the delivery method of information—cognitive profile would be just one of
these conditions. For example, one condition could be the opinion from their academic
advisor (e.g., “Based on your degree audit, your academic advisor (name) thinks you
will perform well at IC”). Such a study could address the question of whether all forms
of delivery affect people in the same way. We hypothesize that impersonal delivery
methods (e.g. cognitive profiles and stereotypes) might feel outside of a participant’s
control, and therefore would reduce perceptions of improvability further than more
personal feedback methods (e.g. a teacher’s opinion).
Our results showed that if people were led to believe they had strong abilities
within a domain, they in turn felt more positive about their abilities after receiving
ambiguous feedback. Conversely, if made to feel uncertain about their abilities, they
perceived these abilities as low after seeing their feedback. Right now, atmospheres
exist that make specific groups of people uncertain about their abilities (e.g. women in
STEM fields). In order to give students and others the highest self-perceptions possible,
procedures could be put in place to reassure individuals of their abilities before tests.
Ideally, this would create a situation in which students with differing group

24
characteristics (race, gender, ethnicity and sexual orientation) would respond similarly
to ambiguous feedback.
The fact that women—on average—underrate their performances compared to
men, should be circulated. The simple act of spreading this knowledge could potentially
assist women in reevaluating their abilities, and help college advisers or other
professionals give relevant advice. As previously mentioned, the choice to pursue a
vocation in STEM fields is mediated by beliefs in one’s ability (Hackett, 1985; Lent et
al., 1986; Multon et al., 1991). If women are underestimating their STEM abilities, this
may decrease their likelihood of continuing in STEM fields. An effective campaign
promoting the gender differences in ability judgment could have a broad impact on self-
perceptions and a specific influence on retention rates of women in STEM.

25
Appendix
This figure illustrates the ambiguous feedback given to all participants after their
completion of the IC assessment.

26
Appendix ii
Dependent Variable Grand Mean Standard Deviation Self-Perception 4.59 0.77 Future-Interest 4.12 1.33 Innate Ability 3.75 1.24 Improvability 5.01 1.14
Future Success 4.61 1.37 Positivity 4.29 1.11 Accuracy 4.09 1.44
Motivation 3.91 1.53
Table 1. Dependent variable grand means and standard deviations.

27
References
Beede, D., Julian, T., Langdon, D., Mckittrick, G., Khan, B., & Doms, M. (2010). Women in STEM: A gender gap to innovation; executive summary. U.S. Department of Commerce, Economics and Statistics Administration. http://www.esa.doc.gov/Reports/women-stem-gender-gap-innovation Beyer, S. (1998). Gender differences in self-perception and negative recall biases. Sex Roles, 38, 103-133.
Beyer, S., & Bowden, E. M. (1997). Gender differences in self-perceptions: Convergent
evidence from three measures of accuracy and bias. Personality and Social Psychology Bulletin, 23, 157-172
Bickel, J., Wara, D., Atkinson, B. F., Cohen, L. S., Dunn, M., Hostler, S., Johnson,
T.R,… (2002). Increasing women's leadership in academic medicine: Report of the AAMC Project Implementation Committee. Academic Medicine, 77, 1043-1061.
Blickenstaff, J. (2005). Women and science careers: Leaky pipeline or gender filter? Gender and Education, 17, 369-386.
Braslow, M. D., Guerrettaz, J., Arkin, R. M., & Oleson, K. C. (2012). Self-doubt. Social
and Personality Psychology Compass, 6, 470-482.
Cheryan, S., Plaut, V. C., Davies, P. G., & Steele, C. M. (2009). Ambient belonging: How stereotypical cues impact gender participation in computer science. Journal of Personality and Social Psychology, 97, 1045-1060.
Cimpian, A., Mu, Y., & Erickson, L. C. (2012). Who is good at this game? Linking an
activity to a social category undermines children’s achievement. Psychological Science, 23, 533–541.
Dasgupta, N., & Asgari, S. (2004). Seeing is believing: Exposure to counterstereotypic
women leaders and its effect on the malleability of automatic gender stereotyping, Journal of Experimental Social Psychology, 40, 642-658
Dee, T. (2001). Teachers, race and student achievement (Report No. W8432). Dweck, C. S. (1986). Motivational processes affecting learning. American Psychologist, 41, 1040-1048. Dykman, B. M., Abramson, L. Y., Alloy, L. B., & Hartlage, S. (1989). Processing of ambiguous and unambiguous feedback by depressed and nondepressed college students: Schematic biases and their implications for depressive realism. Journal of Personality and Social Psychology, 56, 431-445.

28
Ehrlinger, J., & Dunning, D,. (2003). How chronic self-views influence (and potentially
mislead) estimates of performance. Journal of Personality and Social Psychology, 84, 5–17.
Felder, R.M, Felder, G.N., Mauney, M., Hamrin, C.E., & Dietz, E.J. (1995). A
longitudinal study of engineering student performance and retention: Gender differences in student performance and attitudes. Journal of Engineering Education, 84, 151–174.
Gunderson, E. A., Ramirez, G., Levine, S. C., & Beilock, S. L. (2012). New directions for research on the role of parents and teachers in the development of gender- related math attitudes: response to commentaries. Sex Roles, 66, 191-196.
Hackett, G. (1985). The role of mathematics self-efficacy in the choice of math-related majors of college women and men: A path analysis. Journal of Counseling Psychology, 32, 47-56. Lent, R. W., Brown, S. D., & Larkin, K. C. (1986). Self-efficacy in the prediction of
academic performance and perceived career options. Journal of Counseling Psychology, 33, 265-269.
Lindberg, S. M., Hyde, J. S., Petersen, J. L., & Linn, M. C. (2010). New trends in
gender and mathematics performance: A meta-analysis. Psychological Bulletin, 136, 1123-1135.
Multon, K. D., Brown, S. D., & Lent, R. W. (1991). Relation of self-efficacy beliefs to academic outcomes: A meta-analytic investigation. Journal of Counseling Psychology, 38, 30-38.
Rattan, A., Good, C., & Dweck, C. S. (2012). “It's ok—Not everyone can be good at math”: Instructors with an entity theory comfort (and demotivate) students. Journal of Experimental Social Psychology, 48, 731-737. Stangor, C., Carr, C., & Kiang, L. (1998). Activating stereotypes undermines task
performance expectations. Journal of Personality and Social Psychology, 75, 1191-1197.
Steele, C. M. (1997). A threat in the air: How stereotypes shape intellectual identity
and performance. American Psychologist, 52, 613–629. Steele, J. R., & Ambady, N. (2006). “Math is Hard!” The effect of gender priming on women’s attitudes. Journal of Experimental Social Psychology, 42, 428-436.
29
Stout, J. G., Dasgupta, N., Hunsinger, M., & McManus, M. A. (2011). STEMing the tide: Using ingroup experts to inoculate women's self-concept in science, technology, engineering, and mathematics (STEM). Journal of Personality and Social Psychology, 100, 255-270. Zhang, S., Schmader, T., & Forbes, C. (2009). The effects of gender stereotypes on women's career choice: Opening the glass door. M. Barreto, M. K. Ryan, & M. T. Schmitt (Eds.),. The glass ceiling in the 21st century: Understanding barriers to gender equality. Psychology of women book series. 125-150. Washington, DC: American Psychological Association. doi: 10.1037/11863-006