Are there Regional Variations in the Utili- zation of Maternal and Child Care Services Across Income...
23
1 Research Fellow, Philippine Institute for Development Studies. Email [email protected] for correspondence. 2 Medical Officer VII, Health Policy Development and Planning Bureau of the Department of Health, Manila, Philippines. Email [email protected] for correspondence. The authors would like to acknowledge the National Statistics Office and ORC Macro for permitting the use of the 2003 National Health Demographic Survey data, the participants of UNU-Wider Health Equity Conference and American Public Health Association Annual Conference for their insightful comments, and Ms. Ida Marie Pantig for her excellent research assistance. All errors and omissions are the sole responsibility of the authors. Philippine Journal of Development Number 65, Second Semester 2008 Volume XXXV, No. 2 ROUSELLE F. LAVADO 1 AND LEIZEL P. LAGRADA 2 ABSTRACT While the national average for maternal and child health services utilization shows improvement, the Philippines is yet to achieve the Millennium Development Goals (MDG) targets for maternal and child health. This study shows inequality in maternal and child health services utilization across economic classes and across regions. Moreover, based on regional Gini coefficient, there are various patterns of utilization and concentration of services across living standards. Interventions to increase the uptake of maternal and child health services based on these patterns are recommended. INTRODUCTION Deaths due to pregnancy and childbirth still persist, with more than 99 percent of annual maternal deaths occurring in developing countries (WHO 2004). Effective interventions to reduce the risk of maternal mortality have been identified (Campbell and Graham 2006) yet about half a million women continue to die annually due to complications of pregnancy and childbirth. Except in few countries, improvements in curbing maternal deaths over the last 15 years were slow and patchy (Shah and Say 2007). Unequal access to health care still remains as one of the major barriers of reducing maternal deaths as there are still huge differences Are there Regional Variations in the Utili- zation of Maternal and Child Care Services Across Income Groups?
Transcript of Are there Regional Variations in the Utili- zation of Maternal and Child Care Services Across Income...

1 Research Fellow, Philippine Institute for Development Studies. Email [email protected] forcorrespondence.2 Medical Officer VII, Health Policy Development and Planning Bureau of the Department of Health, Manila,Philippines. Email [email protected] for correspondence. The authors would like to acknowledge the NationalStatistics Office and ORC Macro for permitting the use of the 2003 National Health Demographic Survey data,the participants of UNU-Wider Health Equity Conference and American Public Health Association AnnualConference for their insightful comments, and Ms. Ida Marie Pantig for her excellent research assistance. Allerrors and omissions are the sole responsibility of the authors.
Philippine Journal of DevelopmentNumber 65, Second Semester 2008
Volume XXXV, No. 2
ROUSELLE F. LAVADO1 AND LEIZEL P. LAGRADA2
ABSTRACTWhile the national average for maternal and child health servicesutilization shows improvement, the Philippines is yet to achieve theMillennium Development Goals (MDG) targets for maternal and childhealth. This study shows inequality in maternal and child healthservices utilization across economic classes and across regions.Moreover, based on regional Gini coefficient, there are various patternsof utilization and concentration of services across living standards.Interventions to increase the uptake of maternal and child healthservices based on these patterns are recommended.
INTRODUCTIONDeaths due to pregnancy and childbirth still persist, with more than 99 percent ofannual maternal deaths occurring in developing countries (WHO 2004). Effectiveinterventions to reduce the risk of maternal mortality have been identified(Campbell and Graham 2006) yet about half a million women continue to dieannually due to complications of pregnancy and childbirth. Except in few countries,improvements in curbing maternal deaths over the last 15 years were slow andpatchy (Shah and Say 2007). Unequal access to health care still remains as oneof the major barriers of reducing maternal deaths as there are still huge differences
Are there Regional Variations in the Utili-zation of Maternal and Child Care ServicesAcross Income Groups?

54 PHILIPPINE JOURNAL OF DEVELOPMENT 2009
in health status among population groups, particularly based on income classesand geographic areas.
Consistent with its constitutional mandate of making essential goods, health,and other social services available to all the people at affordable cost, with prioritygiven to the vulnerable populations, the Philippine government has committed toachieve the Millennium Development Goals (MDGs) by 2015. This commitmentincludes, among others, reducing the under-5 mortality rate by two-thirds andreducing the maternal mortality ratio by three-fourths. The health goals and thestrategies to reach these targets are further reiterated in the Medium-TermPhilippine Development Plan (MTPDP) 2004–2010, the National Objectives forHealth 2005–2010, and the Fourmula One for Health (the Department of Health[DOH] implementation framework for health reforms).
Despite the government’s efforts, however, the reduction of maternal deathswas slow, from an estimated 209 per 100,000 live births in 1987–1993 to 162 per100,000 live births in 2006 (Family Planning Survey 2006) while the under-5mortality rate has declined from 52 per 1000 live births in 1993 to 40 in 2004(DOH 2007). Moreover, reports show that under-5 mortality and maternal mortalityrates by province show large differentials. For example, in both 1990 and 1995,the infant and maternal mortality rates of top five high mortality provinces aretwice as high as the five lowest mortality provinces (DOH 1999). In addition, thechild mortality rate among children 2–4 years old per 1,000 live births in NationalCapital Region (NCR) was seven while Autonomous Region of Muslim Mindanao(ARMM) was 30. Maternal mortality rate ranges from 119 in NCR and 320 inARMM. With these figures, it is not surprising that the projected life expectancyof females in 2005 was 74 in NCR and 62 in ARMM while males in NCR outlivedwomen by about 12 years longer than those in ARMM, with 69 years as opposedto only 58 in the latter.
OVERVIEW OF THE MATERNAL AND CHILD CARE PROGRAMSThe maternal and child care programs include pre-pregnancy services, antenatal,delivery, postpartum care; also newborn care, immunization, breastfeeding,maternal and child nutrition through micronutrient supplementation and foodfortification, and integrated management of common childhood illnesses, amongothers (DOH 2000). Although all these services are provided by public providers,there is a parallel provision of these services by the private sector, particularlythose involving personal maternal and child health care like antenatal, assistingin delivery, and management of common childhood illnesses. Public healthinterventions like immunization and micronutrient supplementation are mostlyprovided by the public sector. Thus, the financing of maternal and child careservices come from mixed sources, mostly public financing for those servicesprovided at the public facilities and, until recently, private financing for thoseservices provided by the private providers. In 2000, the Philippine Health InsuranceCorporation (PhilHealth), the government’s health insurance system, developeda package for maternal care service which was enhanced in 2003 to cover the

LAVADO AND LAGRADA 55
continuum of maternal care services including prenatal care, normal delivery,newborn care, postpartum care, and family planning counseling that can beprovided by both accredited hospital and nonhospital facilities. Under this currenthealth delivery system, there are several combinations of utilizing the differentmaternal and child care services. For example, a woman utilizes family planningservices at the health center without cost (if free family planning commodities areavailable at that facility), goes to the health center for prenatal care when she getspregnant, delivers her baby at home with the family paying out-of-pocket towhoever assisted in the delivery, and goes back to the health center again forpostpartum and postnatal care for her baby. In another scenario, a woman mayutilize all these services through the private sector and be financed through privatesources. The first example may be the reason for the 2003 Demographic andHealth Survey (DHS) report that while 86 percent of pregnant women accessantenatal care (ANC) services from a health professional, only 60 percent of themare assisted by a medical professional during birth. Although the quality of antenatalcare, measured as a composite of antenatal care from DHS 2003 data (Lavado etal. 2008), is negatively correlated with maternal mortality rate (MMR) and under-5 mortality rate (U5MR), facility-based delivery is still critical in ensuring safedelivery.3 The Family Planning Survey in 2004 shows that both the nonpoor andthe poor deliver at the health facility, with higher proportion among the nonpoor(56.2% versus 17.4%). Moreover, both of these groups utilize public healthfacilities more than the private ones, with 34.8 percent of the nonpoor and 14.9percent of the poor utilizing public health facilities. These different scenarios ofdelivering and financing maternal and child care services in the country providethe background that emphasizes the three major gaps in the health care deliverysystem that increase the risk of dying among mothers and children (DOH 2009).These include: 1) gaps in the delivery of services, which may be breaks in theprovision of continuum of services across various stages of life cycle; 2) gaps inthe utilization of these services, which occur when clients do not avail ofrecommended services owing to lack of information, poor capacity to pay andpoor geographic access, and personal beliefs; and 3) gaps resulting fromweaknesses in the health system itself, which arise when the capacity to deliverservices is lacking, financing is inadequate, regulations fail, and governance isweak.
To address these gaps, the DOH through the years has taken innovativestrategies to protect mothers and children—from adopting the Safe MotherhoodInitiative in 1988 to ensure that childbirth will be safe and will not carry with it
3 A composite measure of quality ANC is developed by assigning 1 point for the following antenatal care-relatedquestions asked in the DHS 2003: (1) weigh checked; (2) height checked; (3) blood pressure is taken; (4) urineexamination performed; (5) blood sample examination performed; (6) told about pregnancy complications; (7)told where to go for pregnancy complications; (8) received tetanus toxoid injection; and (9) received ironsupplementation. Levels of quality of care are classified as no antenatal care, poor quality ANC (1-3 points), fairANC (4-6 points) and very good ANC (7-9 points).

56 PHILIPPINE JOURNAL OF DEVELOPMENT 2009
the risk of death or disability for the woman and her infant; to developing theWomen’s Health and Development Program in 1998 to examine not only biologicalbut also sociocultural factors to understand the health needs of women; andinvesting in Women’s Health and Safe Motherhood to reduce the maternal mortalityand morbidity by supporting the efforts at the local level to provide women’shealth services to targeted groups and strengthening the DOH capability to supportthe local government units (LGUs) in carrying out these services/activities. Morerecently, the DOH applied the reform approach for the local implementation ofan integrated Maternal, Neonatal, and Child Health and Nutrition (MNCHN)Strategy to rapidly reduce maternal and neonatal mortality. To address the risksthat women, mothers, and children face, the MNCHN policy identified theminimum standard MNCHN services, which will be delivered through a seamlesscontinuum of care that will focus on prepregnancy care, antenatal care, care duringdelivery, and postpartum and postnatal care (Annex 1).
These integrated MNCHN services will be provided through a deliverynetwork of facilities and providers that consists of Comprehensive EmergencyObstetric and Neonatal Care Facilities (CEmONCs), Basic Emergency Obstetricand Neonatal Care Facilities (BEmONCs), and Women’s Health Teams that areconfigured in an interlocal health zone (ILHZ), health district, or integrated urbanhealth system setup and supported by an adequate communication andtransportation systems. The CEmONCs may be a district or provincial hospitalwhile the BEmONCs may be a Barangay Health Station (BHS) or a Rural HealthUnit (RHU). These facilities are identified in the provincewide and citywide healthfacilities rationalization plan to optimize the utilization of health facilities.Investments to improve the capacities of these facilities (whether through DOHsupport, LGU budget, or foreign funding) are reflected in the ProvincewideInvestment Plan for Health. The services provided by the different levels ofMNCHN care are enumerated in Annex 3.
While the DOH is ensuring that critical investments and policies are in placeto support the strategies that will reduce the maternal and newborn mortality,PhilHealth continues to enhance its maternal care package to ensure that mothersand their families will have financial protection when they utilize services relatedto maternal and neonatal care services. Moreover, PhilHealth does not only accreditnonhospital facilities like BHS and RHUs in implementing the maternal packagebut it also recognizes and accredits trained midwives to provide appropriate care towomen during pregnancy and normal birth, including assessing the risks andrecognizing signs of complications.
Considering that the Philippines is a signatory to achieve the MDGs by 2015,it is important to know if the critical health programs are reaching the intendedpopulation. This paper assesses the maternal and child health programs in thePhilippines by demonstrating the inequality in access to maternal and child healthservices across economic classes and regions. In addition, this paper also identifiespatterns of inequalities among regions based on their economic characteristics.

LAVADO AND LAGRADA 57
METHODOLOGY
DataThe 2003 National Demographic and Health Survey (NDHS) was a nationalrepresentative survey conducted to calculate demographic indicators, particularlypertaining to maternal and child health and fertility practices. Between June andSeptember 2003, households were interviewed regarding their knowledge andattitudes toward health.
For the analysis on maternal health, a subsample of 1,529 women who gavebirth a year prior to the survey was used. The information based on women withchildren 1–5 years old was utilized for child immunization. The survey compositionis presented in Annex 2.
The indicators used to evaluate maternal and child health services are basedon the recommendations of the Department of Health. Antenatal care is assessedusing indicators such as timing of the first prenatal checkup (anytime during thefirst three months of pregnancy), the number of prenatal visits of a pregnant woman(at least four prenatal visits), and iron supplementation. Delivery care is evaluatedusing skilled birth attendance and deliveries done in a health facility while theindicator for child health care is a fully immunized child.
Method of analysisThe methodology employed attempted to derive the distribution of serviceutilization across population classified in terms of wealth. Since no data on income,expenditure, or consumption could be obtained from the dataset, wealth wasmeasured in terms of assets that the household possessed. Asset index scoresadopted were included in the dataset obtained using the technique proposed byFilmer and Pritchett (2001) and Gwatkin et al. (2000). The asset index scoreswere then expressed in quintiles.
Both coverage and concentration of services were derived for each program.Health service utilization coverage was calculated for the whole subsample perasset quintile and region. The degree of inequality was measured usingconcentration curves and indices.
Derivation of wealth indexA household’s economic status can be ascertained by measuring household income,household consumption, or household wealth. Based on economic theories,household income is the best indicator among the three. Due to difficulties in datacollection, however, income is rarely included in health surveys such as theDemographic and Health Survey (DHS). Measuring household income is alsofraught with difficulties particularly for developing countries because most peopledo not know their exact income or some try to hide their real incomes frominterviewers. Household expenditure is a good alternative but it is also laden withdifficulties.

58 PHILIPPINE JOURNAL OF DEVELOPMENT 2009
According to Rutstein and Johnson (2004), a common problem of measuringhousehold income and expenditure in developing countries is their volatility arisingfrom seasonality and randomness. Households tend to adjust discretionaryexpenditure while maintaining necessities such as food, clothing, and shelter.Since most expenditure for preventive health is usually considered discretionaryexpenditures, they are more a factor of household permanent income rather thancurrent income or expenditure. Household wealth can represent permanent incomebetter than the other two measures, therefore, it is more reasonable to look at therelationship between health utilization and household wealth.
This study used the wealth index calculated by ORC Macro which wasincluded in the DHS dataset.4 All household assets and utility services wereincluded as indicator variables. For the Philippine index, household assetscomprised of television, refrigerator, and car, among others, while utilities pertainedto connection to power supply and telephone and type of water source.
Concentration curve and concentration indexA concentration curve is similar to a Lorenz curve in that it depicts the degree ofinequality in a specific health variable. The concentration curve in Figure 1illustrates income-related inequality in health utilization. The x-axis graphs thecumulative percent of births, ranked according to wealth index, while the y-axisplots the cumulative percent of those utilizing the health service according toeach cumulative wealth quintile. The closer a curve is to the 45-degree line, themore equal is the access to a particular health service. If the poorer people havehigher utilization than others, the concentration curve will lie above the 45-degree-line. In contrast, when the poorer people have lower utilization of service comparedto others, the concentration curve will lie below the line of equality and the fartherit is to the line, the more concentrated the service is towards the richer people inthe sample. For illustration purposes, the concentration curve for live birthsdelivered in a medical facility is shown in Figure 1.
4 In assigning weighing values for indicator variables, ORC Macro used principal components analysis assuggested by Filmer and Pritchett. This procedure first calculates the z values for each asset and utility thencalculates factor loadings for each indicator. Household assets and utilities (taking zero and one) are multipliedby the factor loading score and are added to come up with the household wealth index. The households arethen ranked according to their wealth quintile.
Accompanying concentration curves is the concentration index which,similar to the Gini coefficient, is defined as twice the area between theconcentration curve, L(p) and the 45-degree line. The higher the value, thehigher the inequality among the quintiles while a value of zero means that thereis no wealth-related inequality. Concentration index C, is computed using theformula,
where p is the cumulative percent of the sample ranked by economic status, L(p)is the corresponding concentration curve ordinate, and T is the number of socioeconomic

LAVADO AND LAGRADA 59
Figure 1. Concentration curve for deliveries in medical facilities
1 2 2 1 2 3 3 2 1 1( ) ( ) ... ( )T T T TC p L p L p L p L p L p L− −= − + − + + −
groups (O’Donnell et al. 2007). Statistical inference to test the significance of the indicesis computed based on the formula derived by Kakwani et al. (1997).
Categorizing regions based on Gini coefficientRegions were categorized based on Gini coefficients that were calculated usingthe estimates from the Family Income and Expenditure Survey (FIES) 2003 toidentify the patterns of maternal and child health (MCH) services utilizationamong regions. In this study, regions are categorized as either having low (<0.40)or high (>0.45) Gini coefficient.
In summary, the following steps were undertaken in this paper: first, womenwho were pregnant a year prior to the survey and women with child five yearsold and below were identified. Second, each household was ranked into quintilesbased on its asset score. Third, patterns of utilization were analyzed dependingon the woman’s level of welfare and region. Fourth, concentration curves wereplotted and concentration indices were calculated to discern the extent ofinequality. Welfare dominance tests were conducted to test for statisticallysignificant differences. Lastly, further analyses based on other data wereconducted to trace the sources of inequality in access to public health programs.
UTILIZATION OF MATERNAL AND CHILD HEALTH SERVICESAntenatal care is necessary to identify women who are at risk of havingpregnancy complications. To accomplish this, it is important that a pregnant
SOURCE: Authors’ calculations based on the 2003 National Demographic and Health Survey.

60 PHILIPPINE JOURNAL OF DEVELOPMENT 2009
woman’s first antenatal checkup occur during the first trimester as this periodpresents the most risk for her. Of all women who were pregnant one year beforethe survey, only 51 percent had antenatal checkups during the first three monthsof pregnancy. It is also recommended that at least four antenatal checkups beundertaken by the mother during the duration of pregnancy. A considerablepercentage of women comply with this recommendation, with 67 percent of thesample going to doctors four or more times. Iron supplementation is more favorablethan the two other indicators with 78 percent of the sample taking iron duringpregnancy.
The presence of professional care during delivery (with proper equipment,drugs, and supplies to handle complications) is a major factor on the survival ofthe mother and the newborn during delivery. Sixty-two percent of births a yearbefore the survey were assisted by health professionals such as doctors, midwives,and nurses. This figure did not meet the target set by the DOH of 80 percent by2004. Only 40 percent of births were delivered in health facilities such asgovernment hospitals, government health centers, or private hospitals and clinics.Most deliveries were conducted at home.
The NDHS survey collected immunization information for children born 5years before the survey based on vaccination cards and mother’s oral report.Seventy-three percent of children 1–5 years old received three dosages of DPTand oral polio vaccines and one dose each of measles and BCG vaccines based oneither mother’s recall or vaccination cards.5
Utilization of maternal and child health programs vary by region (Table 1).Within regions, it differs depending on the level of urbanization or proximity tourban areas. Coverage tends to be higher in Luzon particularly Metro Manila andregions surrounding Manila such as Regions 3 and 4A. Only areas in the northernand southernmost parts of Luzon, Cordillera Administrative Region (CAR), Region5, and Region 4B have very low coverage.
Of the three regions in the Visayas, only Region 7 (where Cebu, the secondlargest city, is located) exceeds the national average in almost all indicators. Withthe exception of the ARMM, utilization of antenatal programs in most regions inMindanao exceeds or is very close to the national average. The same cannot besaid, however, for skilled birth attendance where all the regions fall below averageon births attended by health professionals. For births in a medical facility, onlyRegion 11 exceeds the national average. Region 11 is where Davao City is, thethird largest city in the Philippines. In all indicators, the region with the lowestcoverage is ARMM.
5 If the sample for child immunization is to be based on vaccination cards, only 26 percent of the children willhave complete immunization records.

LAVADO AND LAGRADA 61
Checkupduring
firsttrimester
NCRCARRegion 1Region 2Region 3Region 4ARegion 4BRegion 5Region 6Region 7Region 8Region 9Region 10Region 11Region 12Region 13ARMMNationalAverage
64.5847.6253.8563.0459.3861.7646.9427.1744.7943.8628.1758.8245.1651.6755.3846.5128.57
81.4454.1761.6458.8274.2472.0767.92
5466.6773.7356.5862.0755.2268.7570.4276.7443.1
64.56
78.8262.5
80.8268.5282.0977.78
8073.2785.29
90.672
72.4176.4778.1371.8384.7855.1775.91
87.6865.22
72.663.4693.3376.6729.6354.55
4670.9439.47
4043.2851.6132.8646.6731.0355.59
73.8952.17
27.433.3347.0146.6718.52
2833.3347.0119.2320.3432.8446.7721.4329.5515.52
81.1972.7376.0675.8375.8073.5668.3261.9878.5473.9870.2560.2867.7968.1874.5176.5351.67
Regions At least 4antenatal
visits
Births withskilled
attendant
Ironsupple-
mentation
Childrenfully
immunized
Births ina medical
facility
Table 1. Antenatal, delivery care and immunization utilization, per region
SOURCE: Authors’ calculations based on the 2003 National Demographic and Health Survey.
INEQUALITIES IN UTILIZATION OF MCH SERVICES
Inequalities in antenatal care, delivery care, and immunizationAs Table 2 shows, inequality in utilization is evident across asset quintiles. Those in therichest quintile are two times more likely to have an antenatal checkup than those in thepoorest and second quintile. Similarly, pregnant women who have at least four antenatalcheckups during the duration of pregnancy vary depending on asset quintiles—90 percentof the richest having adequate number of checkups while only 50 percent of those in thepoorest quintile does. Among the three antenatal indicators, iron supplementation hasthe flattest curve indicating relatively equal access between the rich and the poor.
The differences of women who were assisted by skilled attendants during deliverywere also very stark across wealth quintiles. Those in the richest quintile were five timesmore likely to have births attended by a health professional than the poorest. Moreover,mothers who delivered in health facilities differ across wealth quintiles. While 77 percentof the richest quintile can deliver their babies in a health facility, only 9 percent of thepoorest can afford to do so.

62 PHILIPPINE JOURNAL OF DEVELOPMENT 2009
Table 2.
Assetquintiles
Checkupduring
firsttrimester
> 4ante-natalvisits
Ironsupple-
mentation
Birthswith
skilledattendant
Births ina medical
facility
Fullyimmunized
Poorest2ndMiddle4thRichestAllConcentrationIndexStd. error
37.9337.7844.4456.9473.8750.61
0.1502
0.015
50.3458.0261.6477.2190.0367.420.1222
0.01
64.6576.6978.5780.0789.1977.820.0516
0.01
22.2248.9964.7583.8491.2262.190.2296
0.01
8.7524.3236.0553.5476.6939.860.3452
0.015
57.3570.4
77.3179.9
83.9672.8
0.078
0.006
Antenatal, delivery care and immunization, utilization by wealth quintiles, andconcentration indices
Utilization of delivery care services is more varied compared toantenatal care utilization. Since most antenatal care programs are availablefor free or for a minimal fee at government health centers, the cost barrier isremoved even for those at the poorest quintile. Deliveries, however, are notprovided free of charge even at health centers, leaving the poor with noother choice but the cheaper alternative of having it at home, assisted by atraditional health worker or hilot.
To formalize the defini t ion of inequal i ty between quint i les ,concentration curves for these five indicators are presented in Figure 2. Theservice with the most unequal utilization is facility-based delivery followedby births with professional assistance. Iron supplementation is the leastunequal among these maternal care services. From the figure, it can be seenthat the poorest 40 percent of all mothers who gave birth comprise 37 percentof all mothers who took iron supplements during pregnancy. In terms ofantenatal checkups, the poorest 40 percent account for 32 percent of thosewith four or more antenatal checkups and 30 percent of those who went todoctors during their first trimester. Utilization of the poor drops tremendouslyfor delivery care services. Among the poorest 40 percent of mothers, only23 percent of births had their deliveries assisted by a medical professionaland only 17 percent had their deliveries in a medical facility.
The disparity across wealth quintiles in terms of the extent of utilizingthe maternal care services, namely, checkup during the first trimester, atleast four antenatal visits, iron supplementation, birth assisted by skilledattendant, and facility-based delivery, is shown in Table 3. Those who didnot utilize any of the maternal care services are highest among the poorestquintile while those who were able to avail of all the five services are highestamong the richest group.

LAVADO AND LAGRADA 63Figure 2. Concentration curve for maternal health care utilization
SOURCE: Authors’ calculations based on the 2003 National Demographic and Health Survey.
Poorest
Poor
Middle
Richer
Richest
61.64
23.29
13.70
1.37
0.00
47.45
32.65
12.24
5.61
2.04
41.63
30.20
17.55
6.12
4.49
27.62
30.16
22.22
14.29
5.71
11.00
19.67
27.00
25.00
17.33
5.23
10.10
20.56
29.27
34.84
0 1 2 3 4 5
Table 3. Extent of utilization of maternal care services, by wealth quintile (in percent)
NOTE: Maternal care services in this study include checkup during the first trimester, at least four antenatalservices, iron supplementation, birth assisted by skilled attendant, and delivery at a health facility. Zero meansnone of the five services were utilized; 1–4 means any 1–4 combination of the services was utilized; and 5means all of the services were utilized.
0
.2.4
.6.8
1
cumulative pe
rcen
t of a
dequ
ate se
rvice
0 .2 .4 .6 .8 1
proportion of births from poorest to richest
visit timingmedical facility iron supplementmedical prof. line of equality
cum
ulat
ive
perc
ent
of a
dequ
ate
serv
ice
Compared to indicators of maternal delivery, utilization of immunizationservices is not very unequal as shown in Figure 3. However, since vaccination isoffered for free at health centers, it is alarming that immunization coverage stillvaries with wealth status. While 84 percent of children whose households belongto the richest quintile are immunized, only 57 percent of children belonging tothe poorest quintile are. This might suggest that despite the subsidy, there re-mains some gap in the delivery of immunization services.

64 PHILIPPINE JOURNAL OF DEVELOPMENT 2009
Figure 3. Concentration curve for child immunization
0.2
.4.6
.81
cum
ulat
ive
perc
ent o
f im
mun
ized
chi
ldre
n
0 .2 .4 .6 .8 1cumulative percent of children
Cumulative population proportion Concentration curve
Patterns of regional inequalitiesTable 4 shows the disparity across regions in terms of the extent of utilizationof different maternal care services considered in this study. Those who did notutilize any of maternal care services are highest in ARMM, followed by RegionV and Region VIII. In contrast, those who were able to complete all five servicesare highest in the NCR, followed by Regions 3 and 7.
It is not surprising that the regions with the lowest level of coverage, theARMM and Bicol region, are also the poorest regions in the Philippines. Povertyincidence computed based on the FIES shows that 53 percent of the families inthe ARMM have per capita incomes below the poverty threshold. The richestregions are NCR, Regions 3 and 4A in Luzon, Region 7 in Visayas, and Region11 in Mindanao.
According to the Medium-Term Philippine Development Plan (MTPDP)2004–2010, the regions with the highest poverty incidence do not necessarilyhave high level of inequality. Table 5 shows that the ARMM, which posted thehighest poverty incidence in the country, has the lowest level of incomeinequality. Gini coefficients presented are based on income estimates from theFIES in 2003. Low Gini coefficients, however, do not necessarily translate intolow regional concentration indices as well.
Five patterns of relationship between Gini coefficients and concentrationindices can be deduced based on Table 5. First, regions with highly urbanizedcities, such as Regions 11, 7, and the NCR, have high Gini coefficients, highutilization rates, and relatively high concentration indices. Second, there are
SOURCE: Authors’ calculations based on the 2003 National Demographic and Health Survey.

LAVADO AND LAGRADA 65
Table 4. Extent of utilization of maternal care services, by region (in percent)
National Capital Region
Cordillera Administrative Region
I - Ilocos
II - Cagayan Valley
III - Central Luzon
IVA - CALABARZON
IVB - MIMAROPA
V - Bicol
VI - Western Visayas
VII - Central Visayas
VIII - Eastern Visayas
IX - Zamboanga Peninsula
X - Northern Mindanao
XI - Davao
XII - SOCCSKSARGEN
XIII - Caraga
ARMM
2.74
4.11
4.11
1.37
1.37
5.48
2.74
13.70
6.85
2.74
9.59
0.00
6.85
4.11
5.48
4.11
24.66
2.55
3.06
3.57
5.10
3.57
7.14
5.61
10.20
6.63
6.63
10.20
5.61
6.12
4.59
5.10
4.59
9.69
6.53
3.27
4.08
2.86
4.08
2.86
8.98
9.39
5.31
7.76
10.20
6.12
4.90
4.90
6.94
3.67
8.16
7.94
1.90
5.08
6.98
6.35
9.52
5.08
6.03
6.35
4.13
4.44
4.76
6.67
4.13
8.89
7.94
3.81
17.00
3.67
5.67
2.67
10.67
11.33
4.67
5.33
4.67
8.67
3.00
5.33
2.33
4.67
3.00
5.67
1.67
26.13
4.18
4.18
3.83
9.06
13.59
1.39
3.83
5.23
9.06
2.44
1.39
3.48
4.88
3.14
2.44
1.74
0 1 32 54
NOTE: Maternal care services in this study include checkup during the first trimester, at least four antenatalservices, iron supplementation, birth assisted by skilled attendant, and delivery at a health facility. Zero meansnone of the five services were utilized; 1–4 means any 1–4 combination of the services was utilized; and 5means all of the services were utilized.
richer regions with low Gini coefficients and low concentration indices likeRegions 3 and 4A. Third, Region 5 is a poor region with both high incomeinequality and health concentration indices. Fourth, the ARMM has a low levelof income inequality but very high level of disparity in public health utiliza-tion. And last, the remaining regions have high Gini coefficients, varying levelsof utilization, and low levels of concentration indices for antenatal care andhigh levels for delivery care.
Provinces in Regions 3 and 4A are in close proximity to Metro Manila.Due to the high price of land, however, many people who work in Manila opt toreside in the adjoining provinces of Regions 3 and 4A. Most export processingzones are also located in the two regions (Ballesteros 2000). These characteristicsprobably explain why the two regions exhibit low poverty incidence as well aslow levels of income inequality. Utilization level of maternal and child healthservices are also less unequal compared to other regions.

66 PHILIPPINE JOURNAL OF DEVELOPMENT 2009
Figure 4 clearly illustrates the different patterns of exclusion in birthsdelivered at health facilities for NCR and ARMM. The ARMM suffers from lowlevels of coverage with only the rich quintile substantially utilizing the healthservices. As explained earlier, although there are high levels of service utilizationat the NCR, the poorest residents remain marginalized.
Region 5 and the ARMM are the two poorest regions in the Philippines yetboth exhibit very different patterns of utilization of maternal and child health
Source: National Statistical Coordination Board and 2003 National Demographic and Health Survey.Notes: Gini Coefficients are from the National Statistical Coordination Board and concentration indices are
authors’ calculations based on the 2003 National Demographic and Health Survey. Standard errorsin parenthesis.
Table 5. Gini coefficients and concentration index for maternal and child health servicesPoverty
incidenceamong
population(2003)
Region Ginicoefficient
(2003) Checkupduring first
trimester
Concentration indicesAt least 4antenatal
visits
Ironsupple-
mentation
Birthswith
skilledattendant
Birthsin a
medicalfacility
Fullimmuni-zation
NCR
CAR
Region 1
Region 2
Region 3
Region 4A
Region 4B
Region 5
Region 6
Region 7
Region 8
Region 9
Region 10
Region 11
Region 12
Region 13
ARMM
National
6.9
32.2
30.2
24.5
17.5
18.4
48.1
48.5
39.2
28.3
43.0
49.2
44.0
34.7
38.4
54.0
52.8
30.0
0.40
0.43
0.39
0.44
0.35
0.40
0.44
0.47
0.44
0.47
0.46
0.52
0.48
0.46
0.48
0.43
0.36
0.46
0.27(0.0823)
0.17(0.1171)
0.22(0.0806)
0.09(0.0737)
0.13(0.0822)
0.17(0.0653)
0.01(0.0818)
0.28(0.0896)
0.15(0.0592)
0.10(0.0635)
0.26(0.0607)
-0.05(0.0843)
0.05(0.0862)
0.12(0.0619)
0.03(0.0531)
0.05(0.0782)
0.21(0.0700)
0.15(0.01521)
0.18(0.0499)
0.25(0.0637)
0.17(0.0679)
0.15(0.0712)
0.12(0.0584)
0.11(0.0483)
0.06(0.0377)
0.16(0.0533)
0.11(0.0402)
0.11(0.0324)
0.09(0.0432)
0.15(0.0396)
0.09(0.0626)
0.11(0.0424)
0.07(0.0303)
0.13(0.0357)
0.18(0.05208)
0.12(0.0100)
0.12(0.0456)
0.22(0.0564)
0.06(0.0374)
0.08(0.0598)
0.05(0.0424)
0.06(0.0345)
0.07(0.0279)
0.07(0.0378)
0.02(0.0557) -0.0008(0.0178)
0 .03(0.0360)
0.06(0.0409)
0.10(0.0674)
0.04(0.0379)
0.09(0.0295)
0.07(0.0327)
0.14(0.0470)
0.05(0.0100)
0.14(0.0382)
0.28(0.0570)
0.19(0.0575)
0.20(0.0576)
0.06(0.0346)
0.1(0.0421)
0.35(0.0290)
0.19(0.0483)
0.25(0.0408)
0.12(0.0355)
0.26(0.0429)
0.22(0.0576)
0.20(0.0620)
0.26(0.0428)
0.27(0.0450)
0.39(0.0491)
0.26(0.0524)
0.23(0.0106)
0.24(0.0624)
0.43(0.0684)
0.52(0.1656)
0.35(0.1079)
0.38(0.1398)
0.28(0.0876)
0.38(0.0337)
0.40(0.0738)
0.32(0.0463)
0.30(0.0520)
0.37(0.0500)
0.21(0.1000)
0.26(0.0693)
0.27(0.0472)
0.34(0.0500)
0.48(0.0581 )
0.41(0.0462)
0.35(0.0153)
0.06(0.0232)
0.1(0.0304)
0.06(0.0343)
0.06(0.0278)
0.08(0.0291)
0.07(0.0303)
0.07(0.0305)
0.11(0.0301)
0.01(0.0252)
0.08(0.0232)
0.12(0.0231)
0.12(0.0282)
0.10(0.0294)
0.09(0.0272)
0.07(0.0212)
0.11(0.0235)
0.07(0.0541)
0.08(0.0062)

LAVADO AND LAGRADA 67
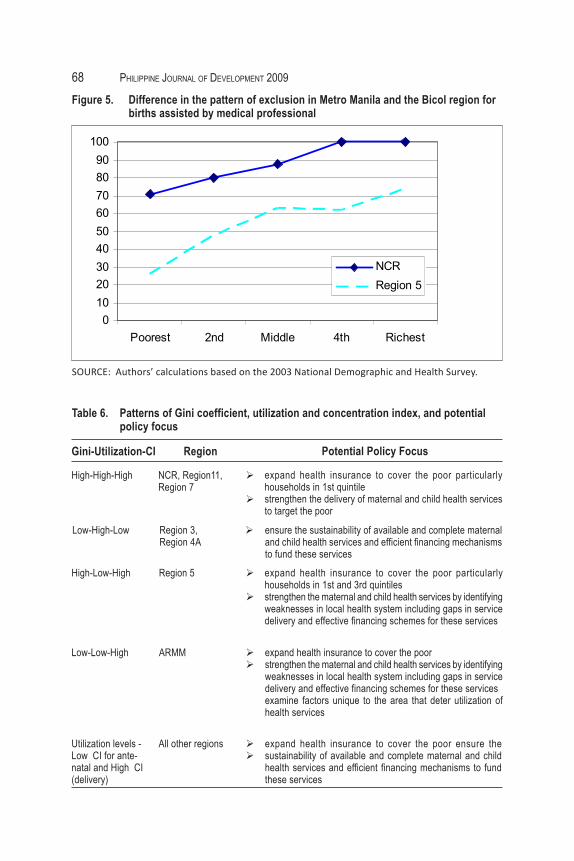
services and the patterns of inequality have implications to the uptake of healthservices in the area. Region 5 is not only poor but has one of the most unequalpatterns of utilization, with an exclusion pattern similar to that of NCR (Figure5). In the case of the ARMM, health facilities and personnel are very limited.Majority of the people are also poor so that even those in the middle or fourthquintile may not be able to afford delivery in a health facility, even if it wereaccessible (Figure 4). In the case of Region 5, facilities and personnel may beadequate, but only those who are rich enough are able to avail it.Figure 4.
010
2030
4050
6070
8090
100
Poorest 2nd Middle 4th Richest
NCRARMM
SOURCE: Authors’ calculations based on the 2003 National Demographic and Health Survey.
DISCUSSION AND POLICY IMPLICATIONSAddressing inequalities in MCH services utilization from the standpoint of policyis of utmost importance. As this paper provides another evidence for inequalitiesin MCH services utilization, various barriers that prevent an individual fromutilizing health services must be identified. These barriers could range fromindividual’s health knowledge and financial capacity to availability of healthfacilities, personnel, and services in the area. Based on the above findings, Table6 summarizes the possible policies or strategies that must be in place orstrengthened to reduce the inequalities in MCH services utilization.
In regions where there is high utilization of MCH services vis-à-vis highdisparity in household income and utilization of services between the richest andthe poorest (Pattern One), this finding suggests that the rich households havehigher uptake of health services than the poorer households, whether fully subsi-dized by the government like immunization and antenatal care or those servicesthat require out-of-pocket payments like skilled birth attendance and facility-based
Difference in the pattern of exclusion in the National Capital Region andAutonomous Region of Muslim Mindanao for births in health facilities
68 PHILIPPINE JOURNAL OF DEVELOPMENT 2009
Figure 5. Difference in the pattern of exclusion in Metro Manila and the Bicol region forbirths assisted by medical professional
0102030405060708090
100
Poorest 2nd Middle 4th Richest
NCRRegion 5
SOURCE: Authors’ calculations based on the 2003 National Demographic and Health Survey.
Table 6. Patterns of Gini coefficient, utilization and concentration index, and potentialpolicy focus
High-High-High NCR, Region11,Region 7
Gini-Utilization-CI Region
Low-High-Low
High-Low-High
Low-Low-High
Utilization levels -Low CI for ante-natal and High CI(delivery)
Region 3,Region 4A
Region 5
ARMM
All other regions
Potential Policy Focus
expand health insurance to cover the poor particularlyhouseholds in 1st quintilestrengthen the delivery of maternal and child health servicesto target the poor
ensure the sustainability of available and complete maternaland child health services and efficient financing mechanismsto fund these services
expand health insurance to cover the poor particularlyhouseholds in 1st and 3rd quintilesstrengthen the maternal and child health services by identifyingweaknesses in local health system including gaps in servicedelivery and effective financing schemes for these services
expand health insurance to cover the poorstrengthen the maternal and child health services by identifyingweaknesses in local health system including gaps in servicedelivery and effective financing schemes for these servicesexamine factors unique to the area that deter utilization ofhealth services
expand health insurance to cover the poor ensure thesustainability of available and complete maternal and childhealth services and efficient financing mechanisms to fundthese services

LAVADO AND LAGRADA 69
delivery. Literature provides a lot of evidence on inequalities in health utilizationand health outcomes across socioeconomic strata. Financial barriers in healthservice use at individual level can be viewed at two aspects, the household’scapacity to pay and the availability of health insurance. Houweling et al. (2007)described poor-rich inequalities in maternity and child care utilization in 45 de-veloping countries. Similar to the findings of the present study, the use of antena-tal care and skilled birth attendance is higher among the rich compared to thepoor households. Moreover, facility-based deliveries are also prorich. Likewise,immunization is prorich but the disparity between the rich and the poor is smallerthan in maternal care services. In World Bank’s Filipino Report Card on PropoorServices, better-off households visit health facilities more often than the poor.When the poor do need health services, they utilize public health facilities. More-over, on the average, the rich spend 10 times more than the poor on health ser-vices. Several studies, however, showed that government financing and healthinsurance determines utilization and choice of maternal care (Kruk et al. 2007;Hotchkiss 1998; Celik and Hotchkiss 2000; Falkingham 2004; WHO 2005). It isimportant to expand the health insurance to enroll the poorest population for theseregions. On the supply side, the public health facilities that are accessible to thepoor must be improved so as to qualify for PhilHealth accreditation and amplestock of drugs and medical supplies must be made available. This way, when thepoorest members of PhilHealth access the public health facilities, they will beable to feel the financial risk protection that their PhilHealth membership pro-vides.
Two regions have low disparity in income among households and high uptakeof health services regardless of household’s economic status. Consistently, theconcentration index of health services is low or close to zero which means thatthere is equal utilization across wealth quintiles (Pattern Two). In Regions 3 and4A, the concentration index of maternal and child health services is 0.1 or lessexcept for facility-based delivery. Although the three trends (Gini, utilization,and concentration index) in Pattern Two may look good, the sustainability ofavailable and comprehensive maternal and child health services must be assuredand efficient financing mechanisms to fund these services must be in place.
Yet another region shows high income disparity among households vis-à-vis low utilization of health services. The high concentration index in all maternaland child health services suggests that those who utilize the services belong towealthier households (Pattern Three). However, exclusion from services may notonly be due to lack of capacity to pay. In a country as diverse as the Philippines,the extent and depth of exclusion from maternal and child care can also varydepending on geography. In a poor region like Region 5, the poor uptake of healthservices may not only be due to financial barrier but also due to unavailable orinaccessible maternal and child health services. The policy and strategies mustfocus, therefore, in providing financial risk protection for the population, especiallythe poor, and ensuring that maternal and child health services are available andaccessible.

70 PHILIPPINE JOURNAL OF DEVELOPMENT 2009
In a region where both income disparity and utilization of services are low butthe concentration index is high as in ARMM (Pattern Four), this finding suggeststhat only the richest of the population are able to utilize health services.6 This maybe due to financial, geographic, and cultural barriers to health services for the majorityof the population who may be living in depressed or geographically isolated areas.Similar to Pattern Three, policy and strategies must focus on providing financialrisk protection for the population, especially the poor, and ensuring that maternaland child health services are available and accessible. It might also be important toexamine beliefs and cultural preferences in the area that might deter utilization ofmaternal and child care services.
For the rest of the regions where income disparity is high, utilization is variableacross living standards, but antenatal care is less unequal across quintiles whilefacility-based delivery is concentrated among the rich households (Pattern Five).This implies that whether utilization is high or low, the antenatal care uptake acrossliving standards is almost the same while facility-based delivery is only accessedby the rich. Thus, expanding the health insurance to cover the poor, ensuring availableand comprehensive maternal and child health services provided in a continuum ofcare, and establishing efficient financing mechanisms to fund these services mustbe the priority strategies.
The findings of this study provide yet another evidence to support the policyof the DOH in terms of investing in priority provinces. Current investments tosupport the implementation of MNCHN strategy to reduce the maternal and neonatalmortality focus on regions ARMM, Regions 7, 11, and 5, regions that exhibitedhigh disparity in service utilization regardless of utilization levels (DOH 2009).Moreover, the findings of this study call for an implementation of a continuum ofmaternal and child care services so that these services will be available regardlessof the woman’s economic standing or residence. The focus of the DOH on MNCHNto rapidly reduce the maternal and neonatal deaths and the comprehensive list ofservices to be provided from prepregnancy to postnatal/postpartum care acrossdifferent levels of care (Women’s Health Team, BEmONC, CEmONC) if coupledwith wider coverage of PhilHealth membership to prioritize the poor and betterbenefit package for maternal and child care services that reduce, if not totally remove,copayment, the disparities in the utilization of maternal and child care across wealthquintile and across regions can be reduced, if not totally eliminated.
Since the sampling structure of NDHS allowed only for regional comparisons,this study looked at inequalities at the regional level. In the context ofdecentralization, however, provinces, cities, and municipalities are those that arein the frontline in the delivery of maternal and child health services. In futurestudies, more effort should be put in place in collecting information at a lowerlevel of disaggregation to understand how services are being delivered at localgovernment units.
6 Compared to other regions, utilization is below average even among the richest quintile in ARMM.

LAVADO AND LAGRADA 71
CONCLUSIONThis study shows that while the uptake of maternal and child health programs hasbeen reasonably satisfactory, the poor continues to have low utilization of maternaland child care services, not only in utilizing each maternal care service but interms of completeness of the utilized services. Moreover, vast differences inpatterns and extent of utilization across regions exist. Women residing in richerregions have higher and more complete utilization of maternal and child careservices while the poorer regions are left out.
To address the disparities of utilizing maternal and child care services acrosswealth and regions, this study proposes two main strategies: 1) ensuring availableand comprehensive maternal and child health services provided in a continuumof care by investing in and getting accreditation for public health facilities thatare utilized by the poor, especially in regions with low utilization and highconcentration index and 2) providing financial risk protection for the population,especially the poor, by expanding the national health insurance membershipcoverage and developing better benefit package for maternal and child care servicesthat will reduce, if not remove, copayment especially in regions where disparityin income is already high.

72 PHILIPPINE JOURNAL OF DEVELOPMENT 2009
Prepregnancy care• correct provision and responsive counseling for fertility awareness, maternal nutrition, birth spacing,
and adolescent health• active identification and servicing of those who have unmet family planning needs for family planning
and referral to alternative sources of services and supplies when these are not available in one’sservice outlet or facility
• assurance of a safety net of free family planning services and supplies for indigent potential users• provision of other basic and essential services for young female and women in reproductive age
groupAntenatal Care
• provision of eight essential antenatal care services, which include monitoring of height and weight,taking blood pressure, blood testing, urine testing, iron and folate supplementation, tetanus toxoidimmunization, malaria prophylaxis whenever necessary, and birth planning
• focused attention to individualized counseling for birth preparedness• discussion with household members and preparation for childbirth with partner support and
involvement in care-seeking decisionsCare during delivery
• proper channeling of patient workloads with aggressive promotion of shifting from home-baseddeliveries to delivery in either a BEmONC or CEmONC facility, especially for women with medicalconditions and other special needs by classifying them as priority for transport and servicing by theappropriate delivery/birthing facility
• deliberate planning and special provisions for hard-to-reach segments of the population within theprovince or citywide health system to promote facility-based deliveries
• active conversion and mobilization of traditional birth attendants into advocates and agents offacility-based deliveries
• correct and updated monitoring and reporting of the number and proportion of facility-based deliveriesPostpartum and postnatal care
• provision of proper postpartum/postnatal care for mothers and neonates• provision of the whole range of women’s health care services for mothers and child survival package
for childrena
Annex 1. Maternal, neonatal, and child health and nutrition strategy (MNCHN) minimumstandard services
a Women’s health care services include, among others, postabortion care, interpregnancy interval counseling,breast and cervical cancer screening, assessing maternal nutrition, tetanus toxoid immunization, counselingon healthy lifestyle, and prevention and management of other diseases. Child survival services include skilledattendance by health professionals during pregnancy, delivery and the immediate postpartumcare, care of thenewborn, breastfeeding and complementary feeding, micronutrient supplementation and deworming,immunization of children and mothers, integrated management of sick children, child injury prevention andcontrol, birth spacing, and proper personal hygiene.

LAVADO AND LAGRADA 73Annex 2. Demographic and health survey composition
Of whichIndividual members of householdsOf which
Women interviewedOf which
Children of women interviewed whoare 1–5 years oldChildren who are fully immunizedPregnant a year prior to the survey
Of whichHave complete information onadequate number of visitHave complete information on timingof first antenatal visit
Have complete information on intakeHave complete information onassistance by health professionalHave complete information ondelivery in medical facilities
Total Number of Household
Number
12,586
61,864
13,633
3,401
2,4481,529
1,515
1,427
1,5261,526
1,526
SOURCE: Authors’ calculations based on the 2003 National Demographic and Health Survey.
b Six signal obstetric functions include: 1) parenteral administration of oxytocin on the third stage of labor; 2) parenteraladministration of loading dose of anticonvulsants; 3) parenteral administration of initial dose of antibiotics; 4) performance ofassisted deliveries; 5) removal of retained products of conception; and (6) manual removal of retained placenta.c Neonatal emergency interventions include at the minimum: 1) newborn resuscitation; 2) treatment of neonatal sepsis/infection;and 3) oxygen support.
Annex 3. Services provided by different facilities and providers in an MNCHNnetwork
Women’s Health Team• early detection and referral of high risk pregnancies• advocacy for birth spacing and counseling for family planning services• tracking and masterlisting of pregnant women• assisting pregnant women and their families in formulating a birthing plan
• reporting of maternal and neonatal deaths• facilitating community issues affecting mothers and children
Basic Emergency Obstetric and Neonatal Care (BEmONC) Facility• six signal obstetric functionsb
• neonatal emergency interventionsc
• blood transfusion servicesComprehensive Emergency Obstetric and Neonatal Care (CEmONC)
• six signal obstetric functions and caesarian section• blood banking and transfusion services• neonatal emergency interventions and management of low birth weight or
premature newborn and other specialized neonatal services

74 PHILIPPINE JOURNAL OF DEVELOPMENT 2009
REFERENCESBallesteros, M.M. 2000. Land use planning in metro manila and urban fringe:
implications on the land and real estate market. Discussion Paper 2000–20.Makati City, Philippines: Philippine Institute for Development Studies.
Campbell O. and W. Graham. 2006. Strategies for reducing maternal mortality:getting on with what works. Lancet 368:1284–99.
Celik, Y. and D. Hotchkiss. 2000. The socioeconomic determinants of maternalhealth care utilization in Turkey. Soc Sci Med 50(12):1797–806.
Department of Health (DOH). 1999. Sector reform agenda 1999–2004. Manila,Philippines: DOH.
_____. 2000. Safe motherhood and women’s health program._____. 2007. National objectives for health 2005–2010. 2007. Manila, Philippines:
DOH._____. 2008. Implementing health reforms for rapid reduction of maternal and
neonatal mortality. Administrative Order 2008–0029. Manila, Philippines:DOH.
_____. 2009. Health reforms for rapid reduction of maternal and neonatalmortality manual of operations. Manila, Philippines: DOH.
Falkingham, J. 2004. Poverty, out-of-pocket payments, and access to healthcare:evidence from Tajikistan. Soc Sci Med 58(2):247–58.
Filmer, D. and L. Pritchett. 2001. Estimating wealth effects without expendituredata—or tears: an application to educational enrollments in states of India.Demography 38(1):115–32.
Gwatkin, D.R., S. Rutstein, K. Johnson, E. Suliman, and A. Wagstaff. 2000.Socioeconomic differences in health nutrition and population in Pakistan.HNP/Poverty Thematic Group. Washington, DC: The World Bank.
Hotchkiss, D.R. 1998. The tradeoff between price and quality of services in thePhilippines. Soc Sci Med 46(2):227–42.
Houweling, T.A., C. Ronsmans, O.M. Campbell, A.E. Kunst. 2007. Huge poor-rich inequalities in maternity care: an international comparative study ofmaternity and child care in developing countries. Bull World Health Organ85(10):745–54.
Kakwani, N., A. Wagstaff, and E.V. Doorslaer. 1997. Socioeconomic inequalitiesin health: measurement, computation, and statistical inference. Journal ofEconometrics 77(1):87–104.
Kruk, M.E., S. Galea, M. Prescott, and L. Freedman. 2007. Healthcare financingand utilization of maternal health services in developing countries. HealthPolicy Planning 22(5):303–10.
Lavado, R.F. and Lagrada L.P. 2008. Who provides poor quality of basic antenatalcare and who are at risk? Unpublished article.
National Statistics Office (NSO). 2004. National Demographic and Health Survey2003. Galveston, Maryland : NSO and ORC Macro.
_____. 2006. Family planning survey 2006. Manila, Philippines: NSO.

LAVADO AND LAGRADA 75
O’Donnel, O., E. Van Doorslaer, A. Wagstaff, and M. Lindelow. 2008. Analyzinghealth equity using household survey data. Washington DC: The World Bank.
Rutstein, S. and K. Johnson. 2004. The DHS wealth index. DHS ComparativeReports 6. ORC Macro: Calverton, Maryland.
Shah, I.H. and L. Say. 2007. Maternal mortality and maternity care from 1990 to2005: uneven but important gains. Reproductive Health Matters 15(30):17–27.
World Health Organization (WHO). 2004. Maternal mortality in 2000: estimatesdeveloped by WHO, UNICEF, UNFPA. Geneva: WHO.
_____. 2005. Make every mother and child count. World Health Report 2005.Geneva: WHO.
World Bank. 2000. The Filipino report card on propoor services. Pasig City,Philippines: World Bank.