
Are stock M&A offerers smart market timers? Contrary...
25
Are stock M&A offerers smart market timers? Contrary Australian evidence By Martin Bugeja , Ray da Silva Rosa , & Vishal Kanji Working Paper: August 2013 Abstract We investigate if ASX-listed acquirers that offer their stock as consideration are able to benefit their long-term shareholders by opportunistically making bids when their equity is over-valued. Contrary to US-based research, we find no evidence that stock-based offerers that fail to acquire their targets subsequently underperform stock-based bidders that acquired control of their target. Our results are consistent with the takeover provisions in Australia’s Corporations Law substantially reducing the possibility of opportunistic behaviour by over-valued prospective acquirers. We contend our results and those reported for the US may be accommodated in a neo-classical framework that assumes information is costly to acquire and that allows for agency costs. UTS Business School, University of Technology, Sydney Email: [email protected] UWA Business School, University of Western Australia: Email: [email protected], [email protected] All errors are ours.
Transcript of Are stock M&A offerers smart market timers? Contrary...
Are stock M&A offerers smart market t imers? Contrary Austral ian evidence
By
Martin BugejaÙ, Ray da Silva RosaÌ, & Vishal KanjiÌ
Working Paper: August 2013
Abstract
We investigate if ASX-listed acquirers that offer their stock as consideration are able to benefit their long-term shareholders by opportunistically making bids when their equity is over-valued. Contrary to US-based research, we find no evidence that stock-based offerers that fail to acquire their targets subsequently underperform stock-based bidders that acquired control of their target. Our results are consistent with the takeover provisions in Australia’s Corporations Law substantially reducing the possibility of opportunistic behaviour by over-valued prospective acquirers. We contend our results and those reported for the US may be accommodated in a neo-classical framework that assumes information is costly to acquire and that allows for agency costs.
Ù UTS Business School, University of Technology, Sydney Email: [email protected] Ì UWA Business School, University of Western Australia: Email: [email protected], [email protected] All errors are ours.
1
Introduction
Not all investors are equal. Those with greater resources, intellectual firepower, and insider knowledge have an edge. However their ability to profit is typically not as stark as their advantage because the less privileged take steps to protect themselves (e.g., by widening bid-ask spreads or simply not trading) and also because of extensive market regulation that aims to “level the trading floor” to enhance investor confidence. In equilibrium, the superior profits, if any, earned by the privileged equal the marginal cost of the levelling mechanisms. One implication is that rents from privilege vary across markets in line with the effectiveness of the levelling mechanisms in their regulatory infrastructure. For example, US-based findings of sizeable rents accruing to insiders who use their informed position to profitably time their entry to the M&A market may not be applicable in, say, Australia where changes of corporate control are subject to more extensive regulation. This perspective motivates this paper.
Savour and Lu (2009) find managers of glamour (ie, “richly valued”) acquirers in the US are able to time the market to the advantage of long-term shareholders. They do so by using their over-valued shares as consideration in acquisitions. Long-term shareholders in the acquiring firm benefit as the purchase of assets at an effective discount hedges the eventual fall in value of the over-valued shares. Shleifer and Vishny (2003) note this theory is consistent with the widely observed post-acquisition under-performance of acquiring firms that offer their shares as consideration. They also posit “managers of targets in stock acquisitions are likely to have relatively short horizons or, alternatively, get paid for agreeing to the deal”. In effect, the managers and long-term shareholders of the acquiring firm conspire with the managers of the target firm to undertake a deal with payoffs that come at the expense of the target firm’s long-term shareholders.
The theory of and evidence on “stock market driven acquisitions”, also the title of Shleifer and Vishny (2003), is commonly instanced as a triumph of behavioural finance notwithstanding an eclectic set of assumptions. As Shleifer and Vishny (2003) put it, “the fundamental assumption of the model is that financial markets are inefficient, so some firms are valued incorrectly. In contrast, managers are completely rational, understand stock market inefficiencies, and take advantage of them, in part through merger decisions”.
Given unconstrained, not to say arbitrary, assumptions – managers keep their heads whilst investors are influenced by mass sentiment – it is not surprising the available evidence is consistent with behavioural theory. However, the classification of managers as “completely rational” and investors, by implication, as wholly susceptible to sentiment is as implausible (or as unrealistic) as the assumption of a perfect market. A descriptively more accurate model would make investors’ susceptibility to sentiment a function of their access to information.
Being cognizant of access to information highlights the relevance of institutional features of markets and also agency-principal issues. In world where information is costly, organised markets offer different solutions to facilitate access.
For instance, in the US acquirers are allowed to negotiate deals without having to make an offer to all target firm shareholders based on the same terms. This feature facilitates target firm shareholders being prompted to accept share offers against their own interest; to illustrate, if target firm shareholders have a short window to evaluate stock-based offers that lead to a change of control and have no special access to information they are likely to rely heavily on the recommendation of the target firm’s management. Studies consistently find that the recommendation of target firm directors is the most important variable in determining takeover outcome. This finding applies to both
2
the US and Australia, however the various provisions of Australia’s Corporations Law that aim to ensure target firm shareholders know the identity of the bidder, have equal opportunity to participate in the benefits of any takeover offer and are granted sufficient time and information to assess the offer implies that collusion between the acquiring firm and the target firm shareholders at the expense of long-term shareholders in the target firm is less likely to succeed. This is the empirical issue this paper addresses.
Context and earl ier work
It is now widely accepted that mergers occur in waves, cluster by industry over time (Andrade et al., 2001) and that there is a positive relationship between market valuation and merger waves (Shleifer and Vishny, 2003, Rhodes-Kropf and Viswanathan, 2004). The neo-classical explanation is that economic “shocks” disrupt industries and takeovers are amongst the mechanisms used to restructure companies in response. Clustering occurs because restructuring is easier to undertake when liquidity is high; this generally coincides with periods of positive market sentiment.
In contrast, the behavioural finance interpretation is that merger activity increases over periods when a firm’s equity is valued above its intrinsic value. Managers of over-valued firms take advantage of the mispricing by offering their firm’s stock as consideration to acquire assets, including other companies. The acquiring firm’s long-term shareholders benefit in the long-term as the purchase of assets at a discount hedge against the eventual fall in the value of their equity.
The critical assumption of the behavioural theory is that stock-based acquirers are are able to overcome informational asymmetries and the lemons problem (Myers and Majluf, 1984, Amihud et al., 1990, Hansen, 1987). Shleifer and Vishny (2003) posit that differences in investment horizon amongst stakeholders of the target relative to stakeholders in the acquirer address this problem. If target managers or controlling shareholders have a short investment horizon they may give up control of the target in the expectation that they will be able to sell their shares in the acquirer before any price reversal. In contrast, Rhodes-Kropf and Viswanathan (2004) posit the lemons problem is overcome through the inability of the target managers to distinguish between market-wide mispricing and firm-specific mispricing. This facilitates the acquirer using its overvalued equity to gain control of the target’s assets. Both variants of the market timing hypothesis predict stock acquisitions are associated with negative returns post-acquisition but nevertheless create value for the long-term shareholders of the acquirer. Both theories also imply cash acquisitions result in positive returns. Neo-classical theory does not generate these predictions.
Research findings in support of the behavioural finance perspective are based principally on US markets. There is a need for caution in extrapolating US findings to other markets because of differences in market structure and incentives. For instance, unlike the US, the UK market for acquisitions is driven by cash bids which characterise in excess of 80% of all merger activity (Faccio and Masulis, 2005). This finding also applies to the Australian market over a similar period (Da Silva Rosa et al., 2006). Different tax and regulatory policies likely account for the difference between the US and UK and Australian markets. For instance, Chapter 6 of the Corporations Act (2001) aim reduce information asymmetries between bidder and target firms. Whilst this is also the purpose of US legislation, it is limited to those offers that are made to all shareholders only (i.e., tender offers). Therefore the conduct of any private bids is not subject to these stringent disclosure requirements. This allows the acquirer to negotiate a deal without having to make an offer to all the shareholders based on the same terms. This facilitates for a greater use of stock acquisitions based on market valuation as it allows the acquirer to capture the gains of using overvalued equity without incurring
3
the full cost. The disclosure requirements, as per the Corporations Act (2001), thus act as a deterrent in using stock as medium of exchange. This is supported by Da Silva Rosa et al. (2006) where it is found that the incidence of stock acquisitions has dropped following the introduction of this legislation. The Australian market make it an convenient market to test the implications of the market timing theory (Da Silva Rosa et al., 2006).
In assessing the impact of method of payment on outcome, we need to control for the other drivers of method of payment. These include the relative size of the target relative to the acquirer, the level of acquirer free cash flows, tax considerations, growth opportunities available to the acquirer, a firm’s capital structure and the ownership structure of the firm. Each is discussed below.
Relative size of target to acquirer
When a small acquirer is looking to acquire a large target it not be able to raise enough cash to do so therefore its only option is to offer its equity. Another size-related issue is that the level of information asymmetry increases as the relative size of the target increases. The acquirer is therefore more likely to offer its equity in order to mitigate the prospective “lemons” problem (Hansen, 1987). The evidence is mixed. Martin (1996) investigates 846 US acquisitions over the period 1978-1988 and finds that the relative size of the target has no influence on the choice of payment of an acquisition. He concludes that the relative size may be a poor measure of the willingness of the acquirer to share the abovementioned risk. In contrast Grullon et al. (1997) finds that relative size is a determinant of the method of payment in banking industry mergers.
Free cash flows
In (Myers, 1984) pecking order theory, firms prefer to use internal financing relative to external financing. The predictions of the market timing theory fit within the pecking order theory on the basis that informational asymmetries account for the choice of equity financing. However, the pecking order theory does not explain the high correlation between market valuation and use of equity as consideration in takeover bids as found in Maksimovic and Gordon (2001) and Martin (1996).
Martin (1996) finds some support for the pecking order hypothesis. The greater level of cash on the balance sheet relative to the value of the target, the greater the likelihood of cash being offered in the deal, though this is not supported by refined measures of free cash flow. Support on to the result of the refined variables is also found in Da Silva Rosa et al. (2000), where a measure using EBITDA1 adjusted for dividends paid was not associated with the decision to opt for a cash bid. The evidence is sensitive to the measures used in order to determine the level of free cash flow within the firm.
Tax Considerations
Differences in the taxation2 of the proceeds received from acquisitions have implications for both the acquiring and target shareholders. Where stock is used as method of payment, the proceeds received by target shareholders only become taxable once these securities are sold, whereas any cash based proceeds become taxable once received. This disadvantage may result in the offering of larger premiums for cash based offers. This may favour the use of stock over cash for US acquirers. Under the Australian taxation system both cash and stock proceeds are taxable upon receipt, thus ameliorating the effect of this disparity. This provision was amended as of the 10th of December 19993. Target shareholders are now able to defer the payment of capital gains tax to such
1 Earnings before interest, tax and depreciation. 2 The differences in tax treatment refer to that of capital gains tax (CGT). 3 This provides the motivation behind the sub period analysis conducted within this study.
4
a time when these securities are sold, though some disparity4 remains as to which shareholders are eligible to do so. As a result of this change, it is found that the preference for stock acquisitions had increased (Bugeja and da Silva Rosa, 2008).
Growth opportunities
Myers (1977) posits there is an inverse relationship between the firm’s level of debt and the value of future growth opportunities available to the firm as a proportion of its total value. The reasoning is that a high level of debt may preclude the managers of a firm from engaging in projects that have been restricted by debt covenants or through the servicing of the debt itself. Jung et al. (1996) incorporate this insight to improve the timing and agency theories of capital structure. Agency theory implies firms that issue equity are subject to the adverse effects of signalling. Those firms with highly valued opportunities for growth are able to mitigate the effects of this signalling and are thus consequently able to make use of their equity. On the other hand firms that do not have these highly valued opportunities for growth prefer debt as they are not insulated from the effects of signalling. High growth firms are also more likely not to have a large amount of free cash available, thus driving the tendency to use stock; whereas, a mature firm (low growth) is likely to have a large amount of free cash available, driving the tendency to use cash.
Martin (1996) find that firms that use their stock in acquisitions have lower book to market or higher Q ratios5. For the sample of firms with high Q ratios the proportion of stock to cash financing is 48:27 where this is 34:40 for the sample of firms with a low Q ratio. The choice of stock financing allows for increased manager flexibility in the current investing and future financing plans.
Managerial ownership and ownership structure
If managers hold a stake within the acquiring firm, either through holding options or shares, using stock with which to finance the acquisition may result in a dilution of their interests. It is noted in Martin (1996) that this may apply to both ends of the managerial ownership spectrum. This is where ownership is either low or really high. This may create an agency problem if using stock creates value for the acquiring shareholders. This reluctance to use stock may also be because the managers, who are classified as insiders to the firm, believe that the stock is undervalued. Amihud et al. (1990) find evidence of the fact; firms with low managerial ownership who use stock as a medium of exchange are associated with negative abnormal returns relative to those that have high managerial ownership. This theory is qualified within Shleifer and Vishny (2003) and (Savor and Lu, 2009)6. In addition to the managerial ownership within the acquirer, the ownership composition of the target may also determine what form of payment is offered by the acquirer. Stulz (1988) find’s that the likelihood of a stock acquisition increases with lower managerial ownership within the target. This is because the higher the ownership, the more entrenched the managers become. Where the performance of managers has been poor, the use of cash ensures that these managers do not have any influence7 over the combined entity. Evidence to the contrary is found within Ghosh and Ruland (1998), who find that the likelihood of a stock acquisition increases with the level of managerial ownership within the target. It is also found that target firm managers are likely to retain their following a stock acquisition. The differences in results between these two studies may be related to
4 The disparity is also in terms of the percentage of shares to be acquired in order for the provision to apply. US regulation dictates that the acquirer should acquire greater than 50% in order to defer the CGT in a stock exchange. This figure is 80% within the Australian regulation. 5 A high Q ratio is interpreted as an indicator of a firm that has abundant growth opportunities, where these growth opportunities are defined as anticipated profitable investments that form a significant proportion of firm value (Martin, 1996). 6 The nature of the under/over valuation must be measured on a relative basis to that of the target. This and not the absolute mispricing of the acquirer alone will determine choice of payment. 7 This is in terms of voting power.
5
the sample of transactions used, for which a comparison of management retention may explain the difference in results.
The choice of method of payment is not solely influenced by the ownership structure of management alone, but is also related to the makeup of its shareholders. Blockholders as well as institutional shareholders have the ability to direct and monitor the actions of managers. Given the signalling effects of stock acquisitions, investors may take action against such a decision through the exertion of their voting power at an extraordinary general meeting or by attempting to restructure the board. The failed acquisition of Avexa limited by Progen Pharmaceuticals, in 2009, is an example of the exercise of power by the shareholders.
Changes in the business cycle
A surge in economic activity is likely to result in the choice of stock over cash as the medium of exchange. There are a number of theories that may be used in order to reconcile this occurrence. It is purported that during this phase of the business cycle adverse selection cost are low (Choe et al., 1993). This theory is an extension of the information asymmetry hypothesis as evidenced in Myers and Majluf (1984). Choe et al. (1993) uses a sample of 5694 seasoned stock issues over a period of 20 years; finding support for this theory as well as some of the alternative hypotheses8. Of these alternatives is support for the market timing theory.
Hypotheses
Value creation and the market timing hypothesis
The market timing theory predicts that managers are able to time the market such that they use overvalued stock to finance acquisitions. To determine whether the managers create value for their long-term shareholders, the performance of the acquirer needs to be measured relative to the scenario in which the firm does not make an acquisition. Savor and Lu (2009) propose the use of failed acquirers as a proxy9 for how successful acquirers would have performed had they not made the acquisition.
HYPOTHESIS 1: Failed stock acquirers10 underperform successful stock acquirers in the post acquisition period following bid announcement.
Hypothesis one is also consistent with neo-classical theories of acquisitions. Maksimovic and Gordon (2001) posit acquisitions may be motivated by efficiency gains11 or profit maximization. This is achieved through the ‘redeployment’ of assets to firms who are better able to derive greater economic benefits from them. Mitchell and Mulherin (1996) posit that acquisitions are the most cost efficient way to respond to changes within the operating environment of a firm. These changes are characterised as regulatory, economic, technological or industry related. Under this theory, the predictions for cash and stock acquirers are the same, as failure to consummate a deal results in poor firm performance given the acquirer is no longer able to capitalise on any efficiency gains. Therefore the disparity in performance between successful and failed acquirers is the same regardless of medium of exchange.
8 These hypotheses pertain to explanations such as market timing, wealth redistribution and costs of flotation. 9 This approach relies on the assumption that the nature of the overvaluation within the market is pervasive or systematic in nature and that successful and failed acquisitions do not cluster in different periods over time. This is important as the nature of market overvaluation corresponds to changes in market conditions overtime. There is no evidence in the literature to suggest a violation of this assumption. 10 Stock acquirer are defined as those acquirer who purely offer stock as the medium of exchange in an acquisition. 11 Efficiency gains and synergies are used interchangeably within this study.
6
The predictions for the market timing theory are however different (Savor and Lu, 2009). Under this theory, notwithstanding the loss in benefits from any efficiency gains, stock acquirers also forgo the opportunity to acquire the assets of the target at an effective discount. This is not the case for cash acquirers who are not able to capture the value from this effective discount. Therefore the disparity between successful and failed stock acquirers is in effect larger than the disparity between successful and failed cash acquirers as the former stand to lose out on more than the latter. Cash acquirers are therefore used as the control sample within this experiment. Therefore failed cash acquirers will outperform successful cash acquirers in the post acquisition period following bid announcement.
Choice of method of payment
The choice of payment within an acquisition may be affected by a number of factors12 internal and external to the firm. The first of these characteristics pertains to the relative size of the acquiring firm. Based on the risk sharing hypothesis of Hansen (1987), the second hypothesis is stated as follows:
HYPOTHESIS 2): The larger the size of the target firm relative to the acquiring firm; the higher the probability that stock will be used as a medium of exchange in an acquisition.
Based on the cash availability hypothesis of Jensen (1986), the third hypothesis is stated as follows:
HYPOTHESIS 3): The larger the amount of free cash flows on hand; the lower the probability that stock will be used as a medium of exchange in an acquisition.
Based on the growth hypothesis of Jung et al. (1996), the fourth hypothesis is stated as follows:
HYPOTHESIS 4): The larger the growth opportunities for the acquirer; the higher the probability that stock will be used as a medium of exchange in an acquisition.
Data and sample
The Securities Data Company Inc (U.S) ‘SDC Platinum’ Database13 is used identify the sample of Australian mergers and acquisitions. This commercial database contains information for all Australian related takeovers dating back to 1988. The database provides information on deal attitude, medium of exchange, deal value and the relevant dates between bid announcement and completion or termination. The calendar sample period for this study begins in 1990 and ends in 2008. The sample period t allows for a sub period analysis to assess the impact of changes to the taxation of acquisition proceeds that came to pass in 1999.
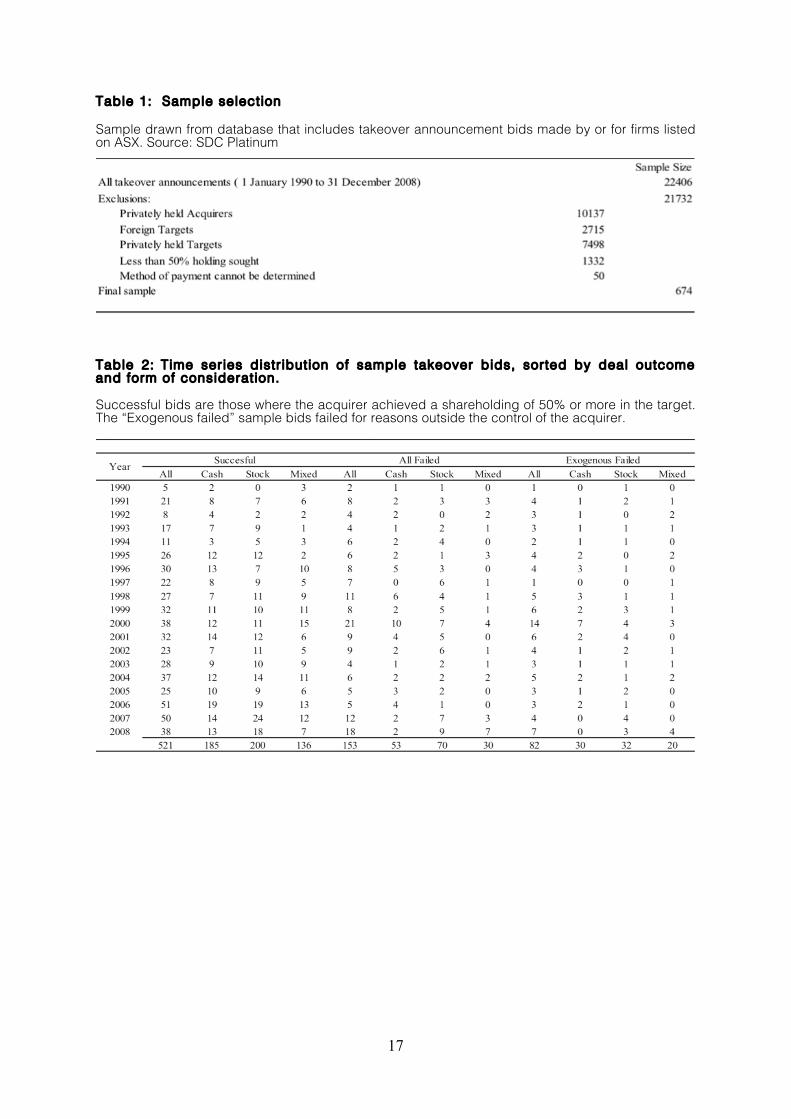
Table 1 outlines the data filters. SDC has information on 22,406 takeover offers over the sample period. All takeovers involving foreign targets, non-listed targets and non-listed acquirers are removed (20,350 observations). Of the remaining 2,056 observations, those where the acquirer was looking to purchase less than 50% of the target were also deleted. The definition of a takeover within this study is consistent with that of Nathan and O'Keefe (1989), it is required that the acquirer be able to control the assets of the target in order to realise the full benefits of the acquisition. Any bids where the acquirer has engaged in an acquisition 3 years prior to the bid using the same medium of exchange are removed, as this may create noise when measuring acquirer performance. Bids where the values are less than 1% of the value of the acquirer are also excluded as are bids where method
12 These characteristics are discussed under Section 2 of this study. The theories behind why these characteristics may result in the choice of either stock or cash as the medium of exchange during an acquisition are also discussed within this Section. The purpose of this section is to create a set of testable hypotheses on the basis of such theories. The relevant proxies used in order to test these hypotheses are discussed under Section 5 of this study. 13 Referred to as SDC henceforth.
7
of payment could not be determined. The experimental sample thus consists of 674 transactions. Of these 521 are successful in their bids, leaving 153 unsuccessful acquiring firms. This sample of transactions is used to test both the hypotheses based on market timing and choice of method of payment, subject to the availability of financial data.
Data on dates, medium of exchange and ticker codes are cross referenced to the information available through the relevant announcements publish on the Australian Securities Exchange (ASX) website. As these announcements are only available from 1998 onwards; the SIRCA database, from Thompson Reuters, and Factiva, from Dow Jones and Company, are used in its stead. The medium of exchange is verified to ensure that purely cash and stock financed deals are included in the tests of the market timing hypothesis and that the consideration offered is correctly classified for use in the test of hypotheses two to four. Lastly, the ticker codes contained within the SDC database do not account for name changes of the acquirer and target and thus the subsequent changes in ticker code. These codes are verified and updated where necessary.
Share price information is obtained from Share Price and Price Relative database (SPPR). All financial information is obtained from Aspect Huntley FinAnalysis, which contains data from 1989 onwards.
Research design
Unsuccessful acquirers are used as a proxy for the performance of the successful acquirers had they not made an acquisition. An important issue is the endogeneity of the acquisition decision (Savor and Lu, 2009). That is, the most over-valued acquirers have the greatest incentive to use stock as a medium of exchange. One implication is that unsuccessful acquirers will underperform successful acquirers if the reason for failure is related to the overvaluation of the acquirer14. This issue is addressed by identifying the sample of bids that failed for reasons other than the valuation of the acquirer, thus creating a subsample of firms whose bids failed for exogenous reasons. Bids classified as failed for endogenous reasons are those where the target refuses the offer based on valuation, the acquirer walks away following negotiations, the acquirer is unable to raise financing, unfavourable market conditions for the acquirer or a downgrade in the forecast for future performance of the acquirer occurs. Those bids that fail for exogenous reasons fail as a result of regulatory action15, competing offers or unexpected target developments.
Sample stratification
The primary reason for bid failure is identified through an investigation of the deal history. This is done using the Thompson Reuters SIRCA database, the ASX website and Factiva. Where a number of reasons are responsible for the failure of a deal, the primary reason is identified to classify that particular transaction. Of the 153 bids that failed, 82 are exogenous. This is across all payment types.
Research methods and performance evaluation
An event study research design used cumulative abnormal returns to a buy-and-hold approach is used. The event is defined as the bid or termination16 announcement. Event day (t=0) is the day the announcement is made. The event window is three days wide to capture market reaction that occurs
14 This result holds independent of the market timing theory and amounts to a misspecification in research design. 15 This is generally as a result of disapproval from the Australian Competition and Consumer Commission (ACCC) in accordance with the Competition and Consumer Act 2010 in addition to other statutory Acts. 16 Termination announcements are used in conjunction with the sample of failed acquirers as an additional test of the market timing hypothesis. This is described below.
8
after the announcement17 and to account for information that may have been leaked to the market prior to the announcement. The event window is thus [ -1, +1 ] days relative to the event day.
The three-days centred on bid announcement day may not capture long term value created (or destroyed). Kothari and Warner (2007) note correct adjustment of risk when measuring long term performance is critical. Small errors in the risk adjustment process make a significant economic difference over longer horizons relative to short horizons. Firm size is known to be associated with cross sectional variation of expected stock returns and so has an influence on measures of post event performance. This is an issue as acquiring firms are generally larger than non-acquiring firms (Brown and da Silva Rosa, 1998).
Fama and French (1993) find that the book to market ratio in conjunction with the size effect account for most of the variation in returns regardless of any other factors that are included within the model. Lyon et al. (1999) substantiate the use of the book to market ratio as a control when measure sample firm performance. Gharghori et al. (2009) find evidence consistent with the presence of the book to market effect within the Australian market. Anderson et al. (1990), however, find that this effectis driven by the size effect within the Australian market.
(Brown et al., 1995) posit that the returns for newly and delisted firms are significantly different to those firms that have survived over the period of measurement. Conditioning a sample to only include control firms that have survived imposes a positive bias18 in the measure of abnormal returns. The survivorship bias may be of greater importance within the Australian market, where it has been found that half of all delistings occur as a result of an acquisition (Brown and da Silva Rosa, 1998).
The use of parametric tests with which to determine the significance of abnormal performance results in a test misspecification if the underlying assumption of normality is violated. Kothari and Warner (1997) note that the distribution of long term buy and hold abnormal returns are significantly skewed to the right and thus do not follow a normal distribution. The skewness results in a positive correlation between the sample means and standard deviations. This leads to a negatively biased test statistic which underestimates the significance of the long term abnormal returns (Barber and Lyon, 1997). This is controlled for by utilising non parametric test statistics or through the adoption of bootstrapping procedures.
Tests of the market timing hypothesis
Buy and hold methodology
Two variations of the buy and hold design will be used within this study. The first of these methods is a variation of the model proposed by Barber and Lyon (1997). Prior evidence has shown that mergers cluster by industry. We match each sample firm with a control firm within the same industry to ensure our results do not reflect differences in performance due to industry-specific factors. Industry codes are attained from the SIRCA database and thus follow the classifications as dictated by this database. Once the relevant industry has been identified the control firms are then matched on their market value of equity on the date of announcement19. This is to control for the size effect. Savor and Lu (2009) only use those control firms whose market value fall within 50% to 150%20 to of
17 This is of importance if the announcement is made late in the date or after the market has closed. 18 It is found in Loughran and Ritter (1995) that newly listed are associated with negative performance. 19 There are two different announcement dates that are used in order to test for the predictions of the market timing theory. The first being the date the intention to acquire was announced to the market and the send being the date it was announced that the merger would be terminated. 20 Prior studies have used 70% to 130%. Savor and Lu (2009) find that their results are robust to this selection criterion.
9
that of the sample firm. The authors then control for the book to market effect by determining a portfolio of firms that have the closest book to market ratios to that of the sample firm. As noted earlier the book to market effect within the Australian market is to a large extent driven by the size effect. The approach of Savor and Lu (2009) is consequently adapted to suit the Australian market by using the a single control firm with the closest market value to that of the sample firm. Buy and hold abnormal returns are calculated as follows:
𝑩𝑯𝑨𝑹𝒕𝒊 = 𝑩𝑯𝒕𝒊 − 𝑩𝑯𝒕
𝒊𝒏𝒅_𝒎𝒂𝒕𝒄𝒉_𝒊
where 𝑩𝑯𝒕𝒊 is the buy and hold returns of the sample firm over the period of t days. 𝑩𝑯𝒕
𝒊𝒏𝒅_𝒎𝒂𝒕𝒄𝒉_𝒊 represents the buy and hold return of the control firm. Savor and Lu (2009) find that their results are robust to the use of a single control firm relative to the portfolio approach. Finally, this method is used to allow for comparability of results with other such studies.
The second method used is based on the work of Brown and da Silva Rosa (1998), who use a variation of the bootstrapping procedure of (Lyon et al., 1999) that is effective in controlling for skewness bias. All acquiring firms are sorted into size deciles based on their market value of equity on the date of announcement. The firms that form part of the returns of the control portfolio are then selected based on the corresponding size decile. Long-term returns are calculated for 12, 24 and 36 months after the announcement was made. Only firms that have survived over the period of measurement are used within the sampling process. This process involves the repeated drawing of control firms from the relevant decile and calculating the buy and hold return for that firm. The control firm is then returned to the pool of firms comprising the decile and the process is repeated 1001 times. The returns are then aggregated on an equally weighted basis in order to determine the portfolio return. Abnormal returns are then calculated by subtracting this return from that of the acquiring firm over the corresponding measurement window.
Tests of the method of payment
The decision to use either stock or cash (dependent variables) as the medium of exchange in an acquisition is investigated using a qualitative response model based on simple logistic regression. Pertinently, there is no assumption of normality within the independent variables, which is important when using financial ratios as independent variables (Da Silva Rosa et al., 2000, Deakin, 1976). The model provides an estimated probability as to whether the event of interest occurs or not and is stated as follows:
𝑷 = 𝟏𝟏!𝒆!𝒁𝒊
= 𝒆𝒛
𝟏!𝒆𝒛
𝒁𝒊 = 𝜶 + 𝜷𝟏𝑿𝟏 + 𝜷𝟐𝑿𝟐 + … + 𝜷𝒏𝑿𝒏
where; 𝑷 is the probability of the event occurring, 𝜶 is the constant, 𝑿 is the vector of the linear function of 𝒁𝒊 and 𝜷 is the vector of the corresponding coefficient. The value of 𝑷 is bound within the interval of (1,0) where both 1 and 0 are asymptotes and thus the probability of an event occurring is will never be 100% though it is plausible that it may get infinitesimally close.
Variable specification
Four different variables are controlled: The first is REL, a measure of the relative size of the target firm to that of the acquirer. This is calculated by dividing the market value of the acquirer by that of the target. The second variable is the book to market (BTM) ratio of the acquiring firm, to control for
10
investment or growth opportunities, which, within the prior literature has been proxied by the used of Tobins Q. The market value of the firm is measured on the date of the bid announcement. Growth opportunities can also be proxied by using the historical growth of sales in the years prior to acquisition. The assumption here is that this trend of past growth is representative of the firm’s future growth opportunities. The third variable is incorporated to control for the cash availability. Free cash flow is proxied by earnings before interest, taxation and depreciation (EBITDA), adjusted for dividends paid. The final variable used is leverage (LEV) of the acquiring firms, measured using the debt ratio (total liabilities to total assets). This is to control for the impact, if any, of the acquiring firm’s capital structure on its choice of financing used. The use of leverage is correlated with the costs associated with distress against that of the agency costs when stock financing is used. All financial data are taken from the preceding financial year.
Results
Descriptive statistics
Table 2 shows the distribution of bids over the sample period classified by deal outcome and method of payment. Over the entire sample period stock acquirers account for 200 of the 521 successful bids. The use of stock appears to increase over time as a percentage of all bids made. Stock acquisitions appear to peak in the year 2006, accounting for almost half the successful deals in 2007. This result coincides with the resource boom (2005) and bullish market conditions, the All Ords spending the majority of 2007 above the 6,000 mark.
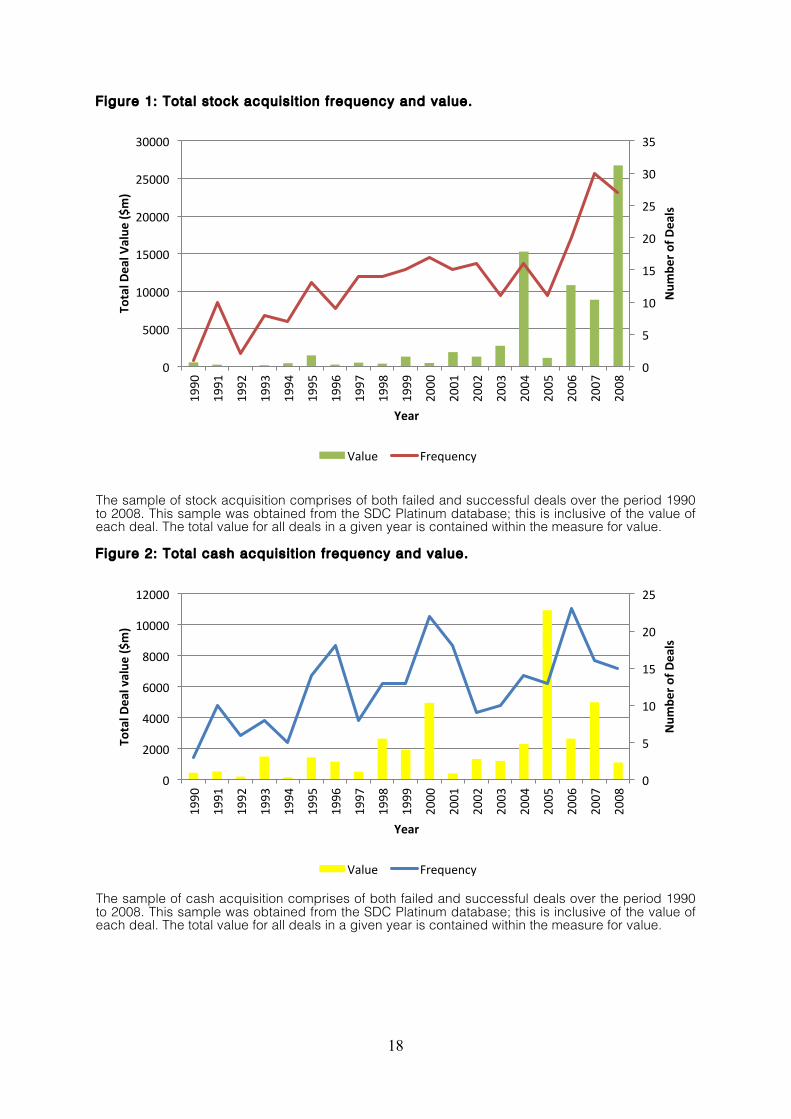
Figure 1 shows an increase in the frequency of stock acquisitions, flattening out in the late 1990’s. However deal value did not increase as much. The frequency of stock financing appears to increase over time. Figure 2 shows cash was widely used as a method of payment during 1998 to 2000.
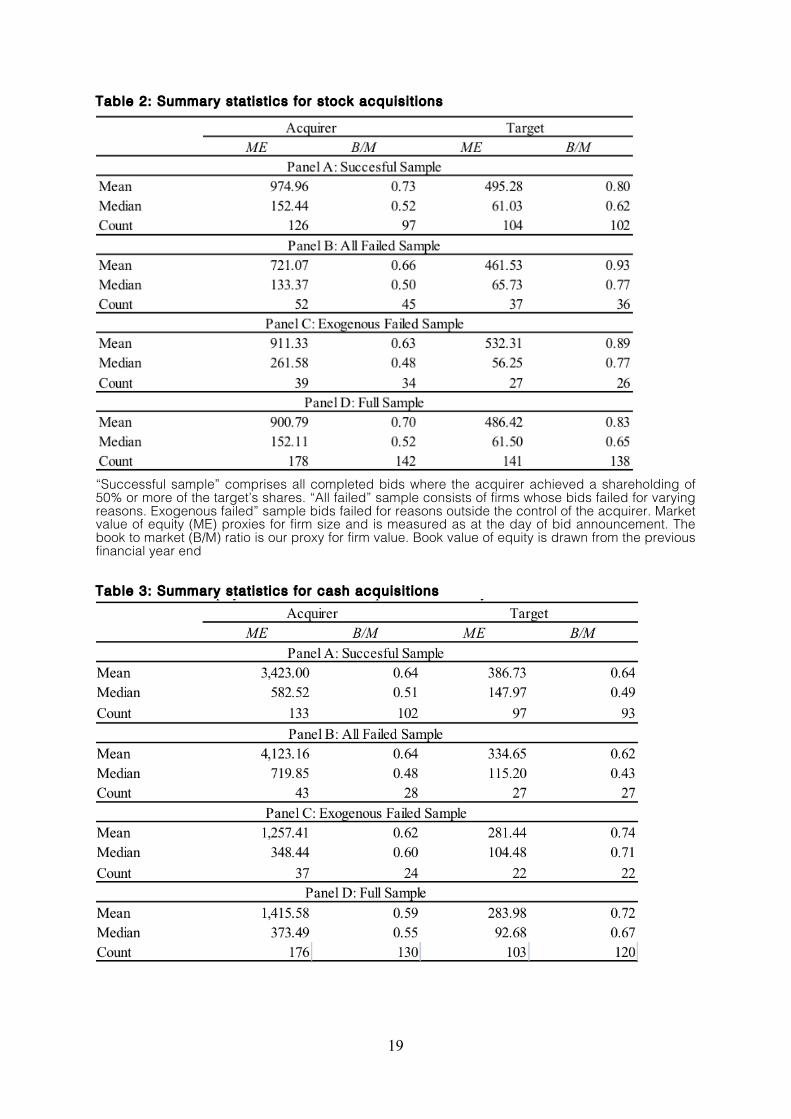
Summary statistics for the stock and cash financed bids are contained within Tables 2 and 3 respectively. Acquirers are generally larger than their target with their mean and median values exceeding that of the target for each sub sample. Shleifer and Vishny (2003) note one of the assumptions underlying the market timing theory is that the acquiring firm is more overvalued relative to the target. This provides the basis for the acquirer to opportunistically purchase the assets of the target. Pertinently, the book to market ratio (B/M) of the acquiring firm is lower in all the samples of stock acquirers.
The finding of a higher book to market for failed acquirers relative to successful ones is of some concern because the research design hinges on stock acquirers being more richly valued. If the failed acquirers are more richly valued than their successful counterparts, the difference in their returns may be as a result of the relative mispricing.
The book to market ratio for cash acquirers are, however, more closely related to that of the target. This average ratio is the same for both acquiring and target firms in the sample of successful acquisitions. The median ratios in the successful and failed sample are however greater than those of the target firms. This is consistent with the signalling hypothesis. Firms that are undervalued are more than likely to use cash financing.
Performance relative to bid announcement date
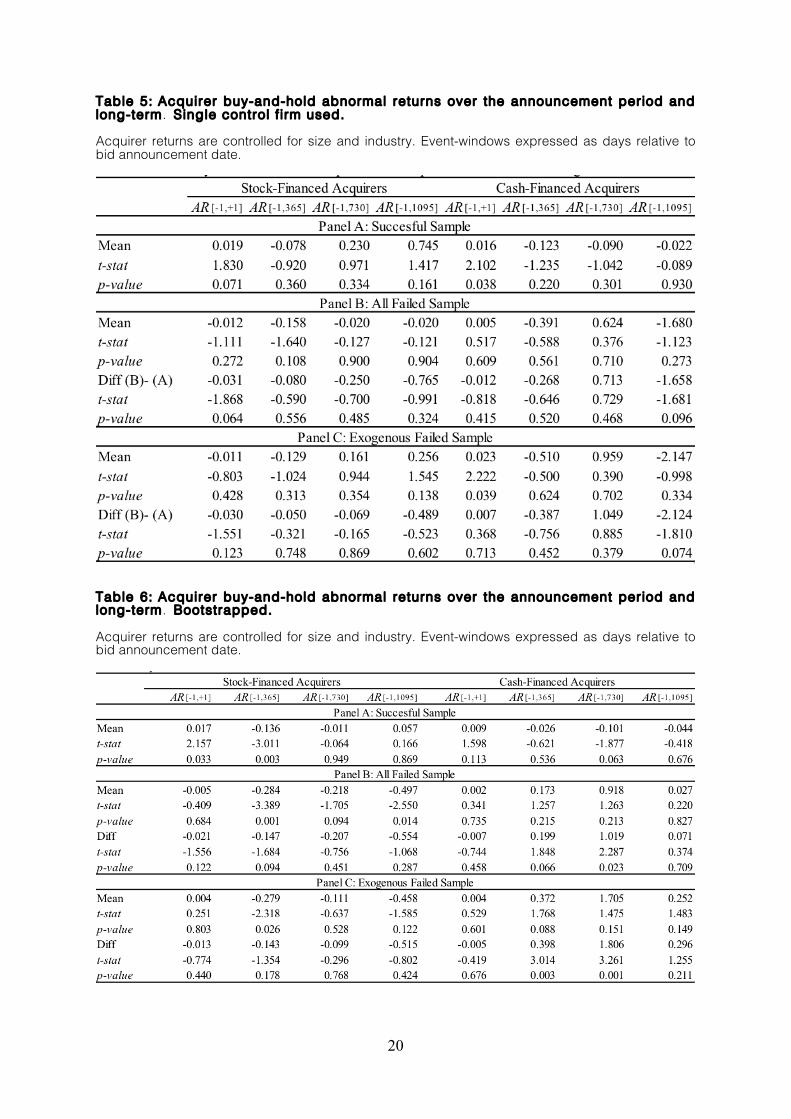
Tables 5 and 6 report buy and hold abnormal returns to acquirers. Table 5 reports results obtained using a variation of the Barber and Lyon (1997) methodology. Both stock and cash financed acquirers enjoy positive announcement returns. This result is significant at the 10% level (t stat =
11
1.83) for the group of successful stock acquirers, whilst being significant at the 5% level (t-stat = 2.10) for the successful cash acquirer. The bid announcement returns indicate the market does not interpret the news as a signal that the acquirer is mispriced. Interestingly, over the long term the successful acquiring firms that offer stock as consideration earn an insignificant (though positive) abnormal return. Savor and Lu (2009) note the main focus is not on the returns to the acquirer alone but the performance relative to other acquirer based on deal outcome, that is, returns relative to the successful sample. It appears that unsuccessful acquirers do in fact underperform their successful counterparts by 3% (t-stat = -1.87) over the announcement period. This difference gets larger over longer time horizons indicating that failure leaves the stock acquirer worse off, though not significantly so. The disparity between unsuccessful and successful cash acquirer appears to increase over time. This is inconsistent with the predictions of the market timing theory, where it is held that the disparity should in fact be larger for stock acquirers as they fail to capitalise on the overvaluation of their stock.
Table 6 reports performance based on the bootstrapping procedure of Brown and da Silva Rosa (1998). These outcomes appear more consistent with those reported by Savor and Lu (2009) where failed cash acquirers are associated with positive returns in the post announcement period. The results for “successful” and “all failed” sample allow us to test the predictions of the behavioural theory relative to that of the neoclassical theory. The difference in performance between the stock acquirers is negative and gets larger over time. The opposite of held for cash acquirers who are associated with positive returns relative to their counterparts.
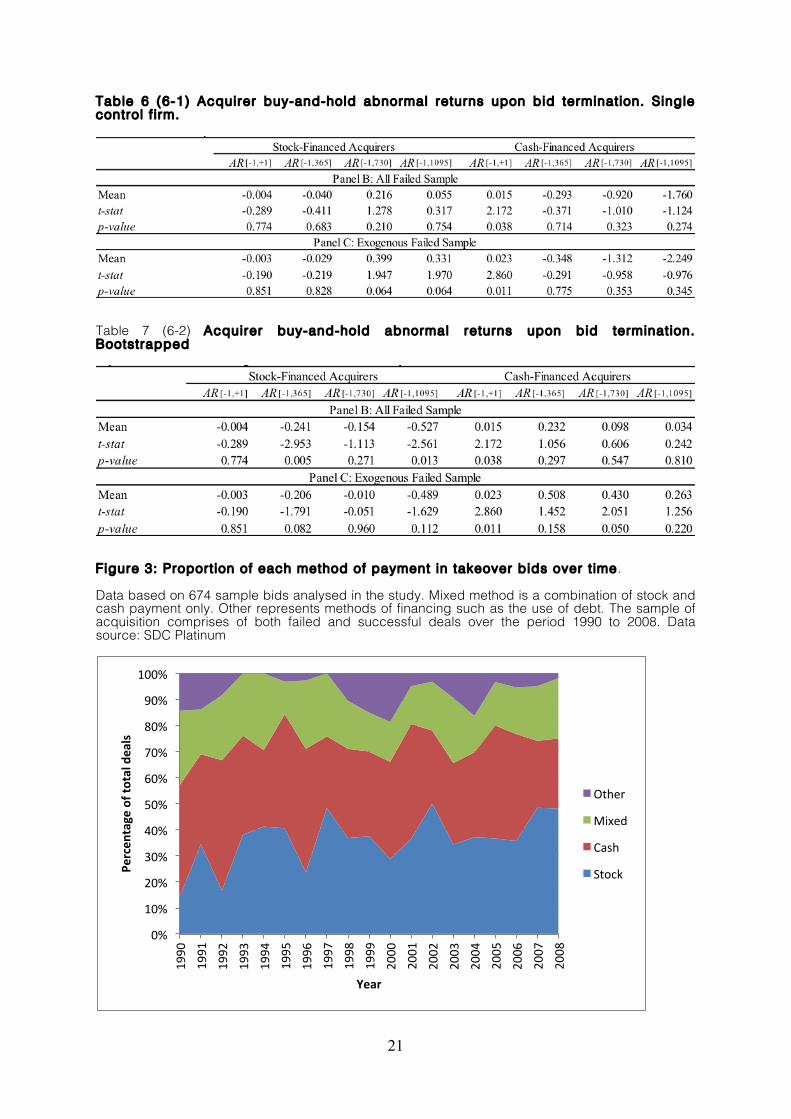
Performance relative to bid termination announcement date
Reviewing returns to acquiring firms to the point of termination of their bids allows us to see if the poor performance of failed acquirers is related to the events associated with the merger. Savor and Lu (2009) find that failed stock acquirers perform poorly over the long term while would-be cash acquirers earn positive abnormal returns, albeit insignificant. We do not find a statistically significant difference in our sample, which is consistent with the delay and disclose provision of the Corporations Act (2001) being effective in preventing opportunistic bids by over-valued acquirers. Taxation changes enacted in 1999 allowing for the deferral of capital gains tax on consideration received in stock may be relevant here. After the change, stock as a method of payment will appeal to long-term shareholders in target firms.
We review returns through to termination date to see if the bid itself alters the intrinsic value of the firm. If so any difference in performance between unsuccessful and successful acquirers may reflect deal specific issues rather than change in performance as a result of the acquisition of the target.
The bootstrapped termination returns more strongly support the market timing theory than the same returns based on Barber and Lyon (1997) approach. Failed stock acquirers perform poorly over the long term with a negative return of 24% (t-stat= -2.953) over the one year period and a negative 52.7% (t-stat = -2.561) over the three year period. Cash acquirers earn positive returns over a similar period. These findings are not easily accounted for by neoclassical theories of mergers .
Method of payment
Given that our results do not match those of Savor and Lu (2009) we conclude that, in Australia, attempts by managers to time the market do not create value for their long-term shareholders. In the following section we investigate other explanations of method of payment.
12
Figure 3 shows the proportion of various methods of payment over the sample period. Stock acquisitions exhibit an increasing trend over time but there are fluctuations. This is evident from 1994 to 1997 and then again from 2005 to 2007. Cash was favoured during the former period whilst stock was preferred during the latter.
Summary statistics
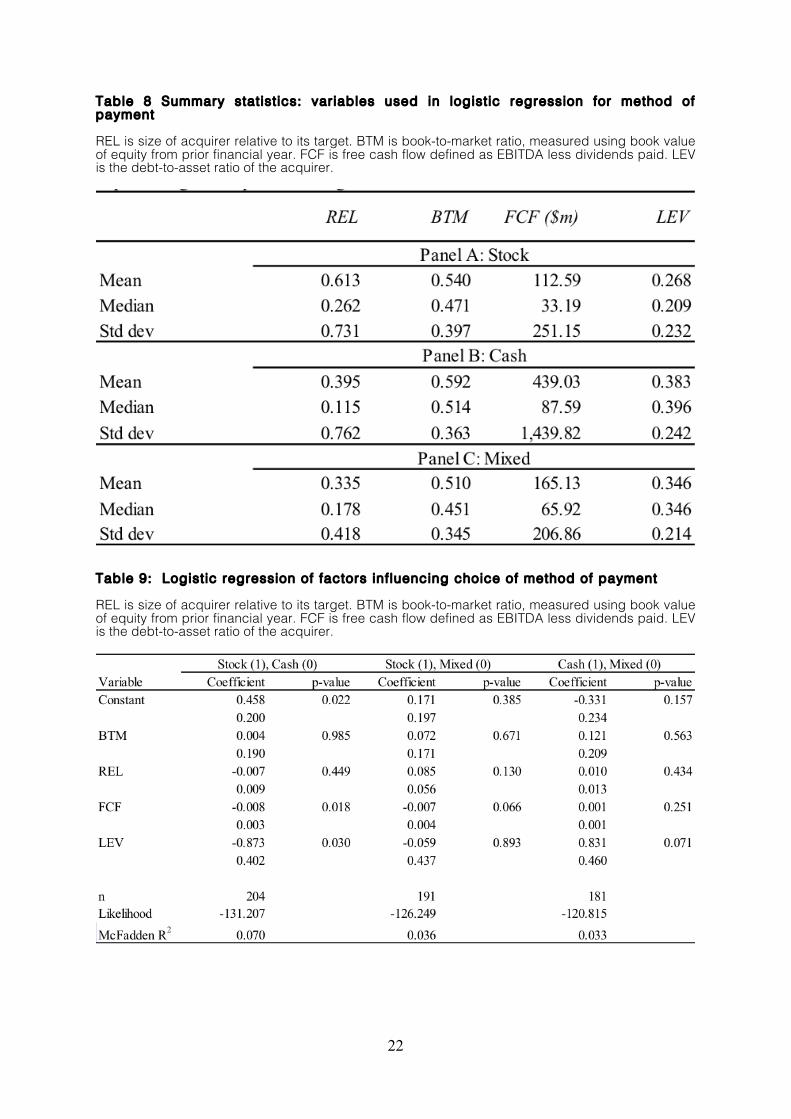
Table 8 shows the summary statistics for the four variables by the three methods of financing. Consistent with the risk sharing hypothesis, stock financing is preferred when the relative size of the target is larger (0.613) in contrast to when cash financing is used (0.395). The mean and median of the book-to-market ratio are both lower for acquisitions using stock financing, consistent with the acquirer being more likely to use stock financing the greater its growth opportunities. The measure of free cash flow is substantially larger for cash financed acquisitions with the difference in means between the two amounting to $326m. Average leverage ratios are smaller for stock financed acquisitions relative to cash financed acquisitions.
Regression Analysis
We use logistic regression to test the influence of relevant variables on choice of method of payment. The coefficients in Table 9 are the log of the odds ratio, which is based on the probability of an event occurring relative to the probability of it not occurring. FCF and LEV are significant at the 5% level for the choice between stock and cash. Both variables have negative signs indicating that the higher the level of free cash flow or leverage the higher the probability that cash financing will be used. LEV is also significant at the 10% level when the choice is between cash or mixed financing. This result implies that the agency cost, between shareholders and managers, increases as the leverage of a firm increases. This would hold until the firm reaches its optimal capital structure21. That is to say that as the leverage of firm continues to increase beyond its optimal capital structure, the lower the agency cost will be. The FCF variable is significant, at the 10% level, for the choice between stock and a mixed form of payment. This is plausible where the target is larger in size relative to the acquirer. If the acquirer has a large amount of free cash flows on hand but does not want to assume all the risk, the risk sharing hypothesis implies mixed payment will be offered
Robustness
Measurement of returns
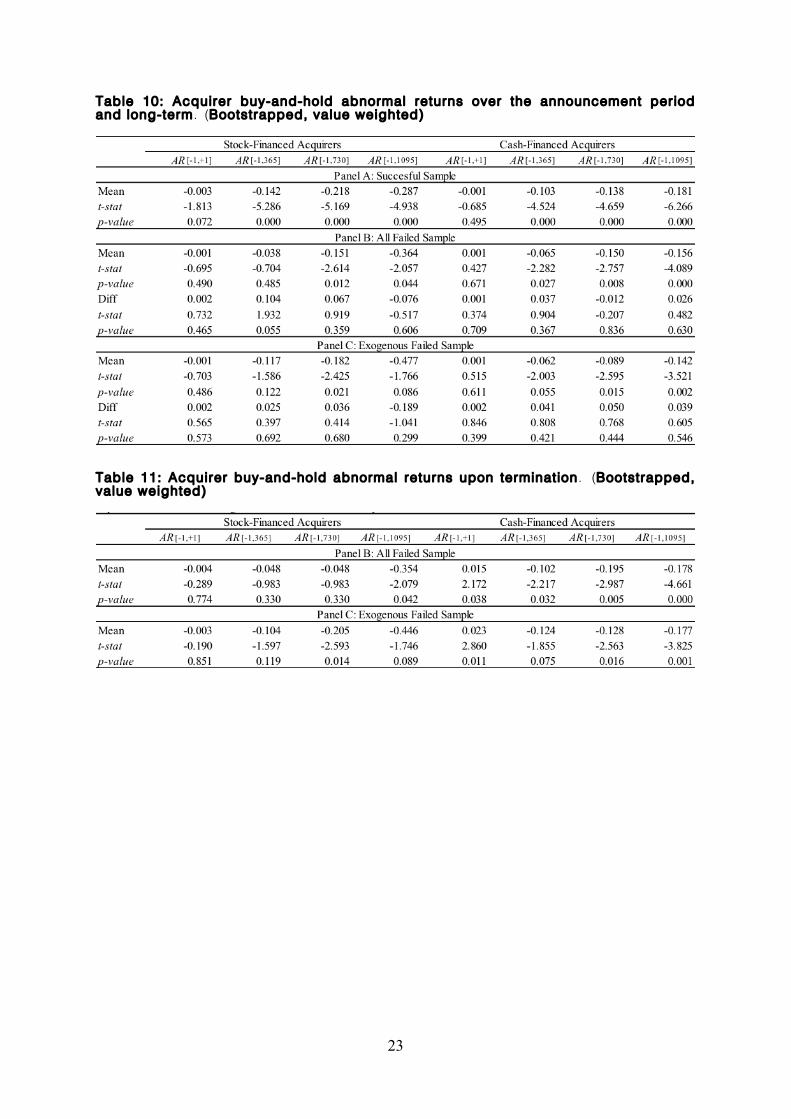
Table 10 shows use of value-weighted returns increases significance of the results in both the successful and failed samples. The two tailed t-tests indicate a rejection of the null hypothesis, hence the buy and hold sample firm returns are different from the control firms. The negative returns to stock acquirer’s increase over time which is consistent with the reversal in returns that we expect to see if overvaluation is the reason behind the acquisition. The difference between failed and successful acquirers, however, is not significant. The premise of the market timing theory is that managers are able to time the market, and consequently create value in this way. Our results do not find support for this hypothesis.
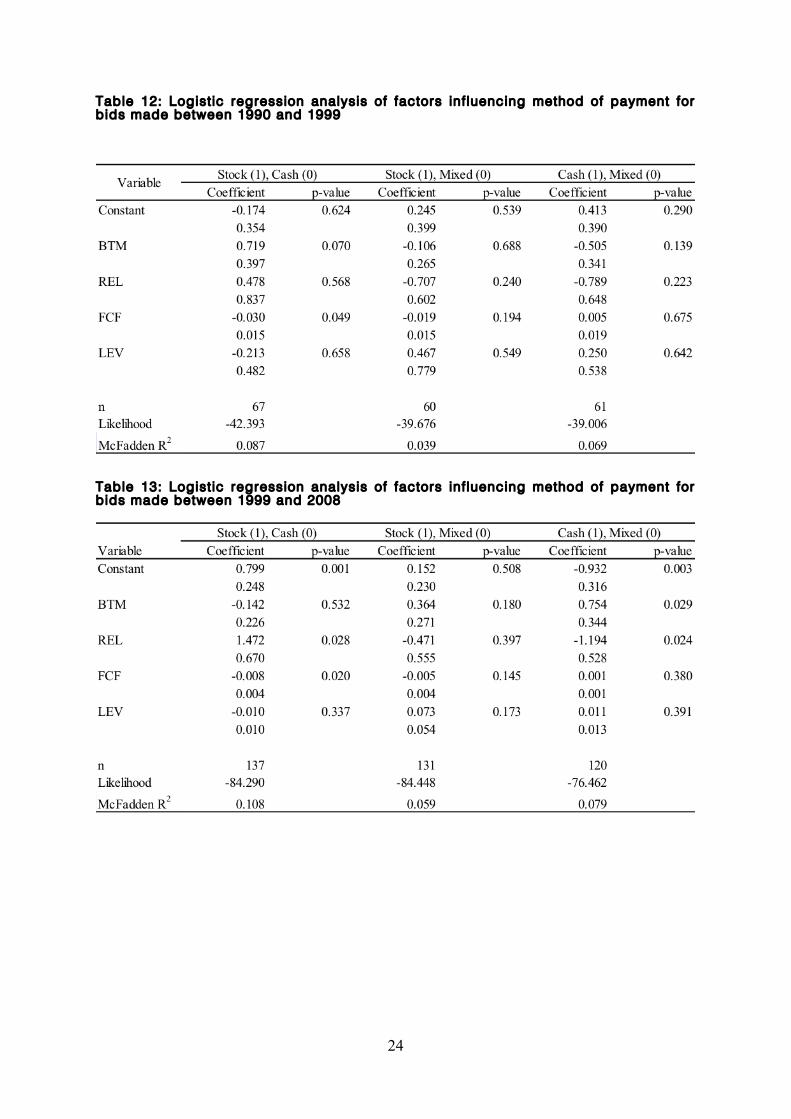
Sub period analysis
Changes to the taxation of proceeds received in an acquisition were enacted on the 10th of December 1999. Prior to this date, capital gains tax was payable on the proceeds received as a result of an acquisition, regardless of type. This changed so that where stock is used as the method
21 This is where the agency costs of equity is equal to the distress costs of debt.
13
of payment; the proceeds received by target shareholders only become taxable once these securities are sold, whereas any cash based proceeds become taxable once received. This disadvantage may result in the offering of larger premiums for cash based offers. This may favour the use of stock over cash and thus influence our findings. Table 12 presents the results for the period 1 January 1990 to 10 December 1999 and Table 13 presents the results for the period 11 December 1999 to 31 December 2008.
The free cash flow variable remains a significant determinant of in the choice of cash financing over stock financing. This result remains robust at the 5% level of significance. Consistent with the changes in CGT and the rise in the use of stock, REL becomes significant in the latter period. The BTM, although having the predicted sign (-) in the period ending 2008, is significant at the 10% level in the period prior to 1999, but is not so in the period after this. This result in the period ending 1999 is inconsistent with what we would expect as the sign in front of the coefficient is positive and may be driven by the acquisitions made between 1994 and 1996, where the disparity between cash and stock financing was especially large22. This result is representative of firms with low growth opportunities and cash on hand.
Conclusions
Contrary to Savor and Lu (2009) we find little evidence that supports the proposition that stock-based acquirers are able to successfully time their offers to the advantage of their long-term shareholders and at the expense of long-term target firm shareholders. Our findings are consistent with the extensive regulatory framework around corporate takeovers in Australia being effective in closing off avenues for opportunistic behaviour. We highlight that our findings and those in the US are explicable in terms of a costly contracting framework; there is no need to call upon a behavioural perspective. That said, both neo-classical and behavioural theories can account for our findings.
References
AMIHUD, Y., LEV, B. & TRAVLOS, N. G. 1990. Corporate Control and the Choice of Investment Financing: The Case of Corporate Acquisitions. The Journal of Finance, 45, 603-616.
ANDERSON, D., LYNCH, A. & MATHIOU, N. 1990. Behaviour of CAPM anomalies in smaller firms: Australian evidence. AUSTRALIAN JOURNAL OF MANAGEMENT, 15, 1-38.
ANDRADE, G., MITCHELL, M. & STAFFORD, E. 2001. New Evidence and Perspectives on Mergers. The Journal of Economic Perspectives, 15, 103-120.
BARBER, B. M. & LYON, J. D. 1997. Detecting long-run abnormal stock returns: The empirical power and specification of test statistics. Journal of Financial Economics, 43, 341-372.
BEEDLES, W. L. 1986. Asymmetry in Australian equity returns. AUSTRALIAN JOURNAL OF MANAGEMENT, 11, 1-12.
BROWN, P. & DA SILVA ROSA, R. 1998. Research method and the long-run performance of acquiring firms. Australian Journal of Management (University of New South Wales), 23, 23.
BROWN, S. J., GOETZMANN, W. N. & ROSS, S. A. 1995. Survival. The Journal of Finance, 50, 853-873.
22 See figure 6.3.
14
BROWN, S. J. & WARNER, J. B. 1985. Using daily stock returns: The case of event studies. Journal of Financial Economics, 14, 3-31.
BUGEJA, M. & DA SILVA ROSA, R. 2008. Taxation of shareholder capital gains and the choice of payment method in takeovers. Accounting & Business Research (Wolters Kluwer UK), 38, 331-350.
CARHART, M. M. 1997. On persistence in mutual fund performance. The Journal of Finance, 52, 57-82.
CHATTERJEE, R., KUENZI, A. & STUDIES, C. U. J. I. O. M. 2001. Mergers and acquisitions: the influence of methods of payment on bidder's share price. RESEARCH PAPERS IN MANAGEMENT STUDIES-UNIVERSITY OF CAMBRIDGE JUDGE INSTITUTE OF MANAGEMENT STUDIES WP.
CHOE, H., MASULIS, R. W. & NANDA, V. 1993. Common stock offerings across the business cycle: Theory and evidence. Journal of Empirical Finance, 1, 3-31.
CONRAD, J. & KAUL, G. 1993. Long-Term Market Overreaction or Biases in Computed Returns? The Journal of Finance, 48, 39-63.
DA SILVA ROSA, R., IZAN, H. Y. & JI, S. 2006. Market misvaluation driven acquisitions: Contrary Australian evidence. Company and Securities Law Journal, 24, 75-92.
DA SILVA ROSA, R., IZAN, H. Y., STEINBECK, A. & WALTER, T. 2000. The Method of Payment Decision in Australian Takeovers: An Investigation of Causes and Effects. ustralian Journal of Management (University of New South Wales), 25, 67-94.
DEAKIN, E. B. 1976. Distributions of financial accounting ratios: some empirical evidence. The Accounting Review, 51, 90-96.
DONG, M., HIRSHLEIFER, D., RICHARDSON, S. & TEOH, S. H. 2006. Does Investor Misvaluation Drive the Takeover Market? The Journal of Finance, 61, 725-762.
FACCIO, M. & MASULIS, R. W. 2005. The Choice of Payment Method in European Mergers and Acquisitions. The Journal of Finance, 60, 1345-1388.
FAMA, E. F. 1991. Efficient Capital Markets: II. The Journal of Finance, 46, 1575-1617.
FAMA, E. F. & FRENCH, K. R. 1992. The Cross-Section of Expected Stock Returns. The Journal of Finance, 47, 427-465.
FAMA, E. F. & FRENCH, K. R. 1993. Common risk factors in the returns on stocks and bonds. Journal of Financial Economics, 33, 3-56.
GHARGHORI, P., LEE, R. & VEERARAGHAVAN, M. 2009. Anomalies and stock returns: Australian evidence. Accounting & Finance, 49, 555-576.
GHOSH, A. & RULAND, W. 1998. Managerial Ownership, the Method of Payment for Acquisitions, and Executive Job Retention. The Journal of Finance, 53, 785-798.
GOLAN, A., MORETTI, E. & PERLOFF, J. M. 2004. A small-sample estimator for the sample-selection model. Econometric Reviews, 23, 71-91.
GRULLON, G., MICHAELY, R. & SWARY, I. 1997. Capital adequacy, bank mergers, and the medium of payment. Journal of Business Finance & Accounting, 24, 97-124.
15
HANSEN, R. G. 1987. A theory for the choice of exchange medium in mergers and acquisitions. Journal of business, 75-95.
HEALY, P. M., PALEPU, K. G. & RUBACK, R. S. 1992. Does corporate performance improve after mergers? Journal of Financial Economics, 31, 135-175.
HECKMAN, J. J. 1979. Sample selection bias as a specification error. Econometrica: Journal of the econometric society, 153-161.
JENSEN, M. C. 1986. Agency Costs of Free Cash Flow, Corporate Finance, and Takeovers. The American Economic Review, 76, 323-329.
JUNG, K., KIM, Y. C. & STULZ, R. M. 1996. Timing, investment opportunities, managerial discretion, and the security issue decision. Journal of Financial Economics, 42, 159-186.
KOTHARI, S. & WARNER, J. B. 2007. Econometrics of Event Studies. Handbook of Corporate Finance: Empirical Corporate Finance. B. Espen Eckbo. Elsevier/North-Holland.
KOTHARI, S. P. & WARNER, J. B. 1997. Measuring long-horizon security price performance. Journal of Financial Economics, 43, 301-339.
LINN, S. C. & SWITZER, J. A. 2001. Are cash acquisitions associated with better postcombination operating performance than stock acquisitions? Journal of Banking & Finance, 25, 1113-1138.
LOUGHRAN, T. & RITTER, J. R. 1995. The new issues puzzle. The Journal of Finance, 50, 23-51.
LOUGHRAN, T. & RITTER, J. R. 2000. Uniformly least powerful tests of market efficiency. Journal of Financial Economics, 55, 361-389.
LOUGHRAN, T. I. M. & VIJH, A. M. 1997. Do Long-Term Shareholders Benefit From Corporate Acquisitions? The Journal of Finance, 52, 1765-1790.
LYON, J. D., BARBER, B. M. & TSAI, C. L. 1999. Improved methods for tests of long-run abnormal
stock returns. The Journal of Finance, 54, 165-201.
MAKSIMOVIC, V. & GORDON, P. 2001. The Market for Corporate Assets: Who Engages in Mergers and Asset Sales and Are There Efficiency Gains? The Journal of Finance, 56, 2019-2065.
MALKIEL, B. G. & FAMA, E. F. 1970. Effecient capital markets: A review of theory and empirical work. The Journal of Finance, 25, 383-417.
MARTIN, K. J. 1996. The Method of Payment in Corporate Acquisitions, Investment Opportunities, and Management Ownership. The Journal of Finance, 51, 1227-1246.
MITCHELL, M. L. & MULHERIN, J. H. 1996. The impact of industry shocks on takeover and restructuring activity. Journal of Financial Economics, 41, 193-229.
MOELLER, S. B., SCHLINGEMANN, F. P. & STULZ, R. M. 2005. Wealth Destruction on a Massive Scale? A Study of Acquiring-Firm Returns in the Recent Merger Wave. The Journal of Finance, 60, 757-782.
MYERS, S. C. 1977. Determinants of corporate borrowing. Journal of Financial Economics, 5, 147-175.
MYERS, S. C. 1984. The Capital Structure Puzzle. The Journal of Finance, 39, 575-592.
16
MYERS, S. C. & MAJLUF, N. S. 1984. Corporate financing and investment decisions when firms have information that investors do not have. Journal of Financial Economics, 13, 187-221.
NATHAN, K. S. & O'KEEFE, T. B. 1989. The rise in takeover premiums: An exploratory study. Journal of Financial Economics, 23, 101-119.
PUHANI, P. 2000. The Heckman correction for sample selection and its critique. Journal of Economic Surveys, 14, 53-68.
RHODES-KROPF, M. & VISWANATHAN, S. 2004. Market Valuation and Merger Waves. The Journal of Finance, 59, 2685-2718.
ROLL, R. 1983. On computing mean returns and the small firm premium. Journal of Financial Economics, 12, 371-386.
SAVOR, P. G. & LU, Q. I. 2009. Do Stock Mergers Create Value for Acquirers? The Journal of Finance, 64, 1061-1097.
SHLEIFER, A. & VISHNY, R. W. 2003. Stock market driven acquisitions. Journal of Financial Economics, 70, 295-311.
STULZ, R. M. 1988. Managerial control of voting rights: Financing policies and the market for corporate control. Journal of Financial Economics, 20, 25-54.
TRAVLOS, N. G. 1987. Corporate Takeover Bids, Methods of Payment, and Bidding Firms' Stock Returns. The Journal of Finance, 42, 943-963.
WALKER, M. M. 2000. Corporate Takeovers, Strategic Objectives, and Acquiring-Firm Shareholder Wealth. Financial Management, 29, 53-66.
17
Table 1: Sample selection
Sample drawn from database that includes takeover announcement bids made by or for firms listed on ASX. Source: SDC Platinum
Table 2: Time series distr ibution of sample takeover bids, sorted by deal outcome and form of consideration.
Successful bids are those where the acquirer achieved a shareholding of 50% or more in the target. The “Exogenous failed” sample bids failed for reasons outside the control of the acquirer.
18
Figure 1: Total stock acquisit ion frequency and value.
The sample of stock acquisition comprises of both failed and successful deals over the period 1990 to 2008. This sample was obtained from the SDC Platinum database; this is inclusive of the value of each deal. The total value for all deals in a given year is contained within the measure for value.
Figure 2: Total cash acquisit ion frequency and value.
The sample of cash acquisition comprises of both failed and successful deals over the period 1990 to 2008. This sample was obtained from the SDC Platinum database; this is inclusive of the value of each deal. The total value for all deals in a given year is contained within the measure for value.
0
5
10
15
20
25
30
35
0
5000
10000
15000
20000
25000
30000
1990
1991
1992
1993
1994
1995
1996
1997
1998
1999
2000
2001
2002
2003
2004
2005
2006
2007
2008
Num
ber o
f Deals
Total D
eal V
alue
($m)
Year
Value Frequency
0
5
10
15
20
25
0
2000
4000
6000
8000
10000
12000
1990
1991
1992
1993
1994
1995
1996
1997
1998
1999
2000
2001
2002
2003
2004
2005
2006
2007
2008
Num
ber o
f Deals
Total D
eal value
($m)
Year
Value Frequency
19
Table 2: Summary stat ist ics for stock acquisit ions
“Successful sample” comprises all completed bids where the acquirer achieved a shareholding of 50% or more of the target’s shares. “All failed” sample consists of firms whose bids failed for varying reasons. Exogenous failed” sample bids failed for reasons outside the control of the acquirer. Market value of equity (ME) proxies for firm size and is measured as at the day of bid announcement. The book to market (B/M) ratio is our proxy for firm value. Book value of equity is drawn from the previous financial year end
Table 3: Summary stat ist ics for cash acquisit ions
20
Table 5: Acquirer buy-and-hold abnormal returns over the announcement period and long-term. Single control f irm used.
Acquirer returns are controlled for size and industry. Event-windows expressed as days relative to bid announcement date.
Table 6: Acquirer buy-and-hold abnormal returns over the announcement period and long-term. Bootstrapped.
Acquirer returns are controlled for size and industry. Event-windows expressed as days relative to bid announcement date.
21
Table 6 (6-1) Acquirer buy-and-hold abnormal returns upon bid termination. Single control f irm.
Table 7 (6-2) Acquirer buy-and-hold abnormal returns upon bid termination. Bootstrapped
Figure 3: Proport ion of each method of payment in takeover bids over t ime.
Data based on 674 sample bids analysed in the study. Mixed method is a combination of stock and cash payment only. Other represents methods of financing such as the use of debt. The sample of acquisition comprises of both failed and successful deals over the period 1990 to 2008. Data source: SDC Platinum
0%
10%
20%
30%
40%
50%
60%
70%
80%
90%
100%
1990
1991
1992
1993
1994
1995
1996
1997
1998
1999
2000
2001
2002
2003
2004
2005
2006
2007
2008
Percen
tage of total deals
Year
Other
Mixed
Cash
Stock
22
Table 8 Summary stat ist ics: variables used in logist ic regression for method of payment
REL is size of acquirer relative to its target. BTM is book-to-market ratio, measured using book value of equity from prior financial year. FCF is free cash flow defined as EBITDA less dividends paid. LEV is the debt-to-asset ratio of the acquirer.
Table 9: Logist ic regression of factors inf luencing choice of method of payment REL is size of acquirer relative to its target. BTM is book-to-market ratio, measured using book value of equity from prior financial year. FCF is free cash flow defined as EBITDA less dividends paid. LEV is the debt-to-asset ratio of the acquirer.
23
Table 10: Acquirer buy-and-hold abnormal returns over the announcement period and long-term. (Bootstrapped, value weighted)
Table 11: Acquirer buy-and-hold abnormal returns upon termination. (Bootstrapped, value weighted)
24
Table 12: Logist ic regression analysis of factors inf luencing method of payment for bids made between 1990 and 1999
Table 13: Logist ic regression analysis of factors inf luencing method of payment for bids made between 1999 and 2008