Are Risk Aversion and Impatience Related to Cognitive Ability? Thomas Dohmen, Armin Falk, David...
39
Are Risk Aversion and Impatience Related to Cognitive Ability? Thomas Dohmen, Armin Falk, David Huffman, Uwe Sunde IZA Bonn and University of Bonn 01-07-07 ESA World Meeting 2007 LUISS Rome
-
Upload
doreen-wilkinson -
Category
Documents
-
view
221 -
download
0
Transcript of Are Risk Aversion and Impatience Related to Cognitive Ability? Thomas Dohmen, Armin Falk, David...
Are Risk Aversion and Impatience
Related to Cognitive Ability?
Thomas Dohmen, Armin Falk, David Huffman, Uwe SundeIZA Bonn and University of Bonn
01-07-07ESA World Meeting 2007
LUISS Rome
2
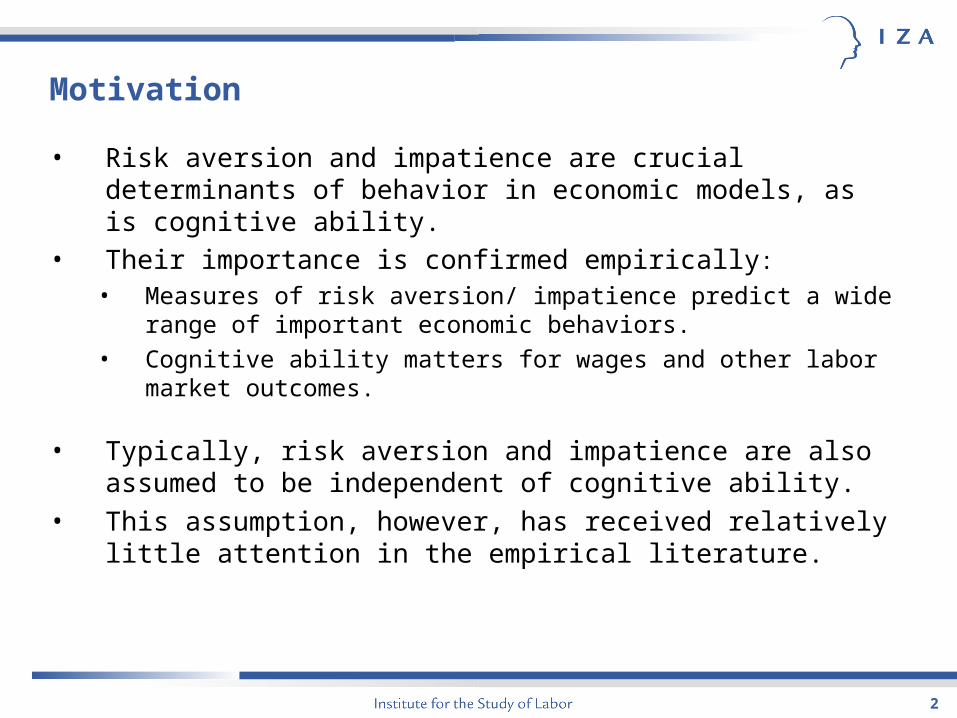
Motivation
• Risk aversion and impatience are crucial determinants of behavior in economic models, as is cognitive ability.
• Their importance is confirmed empirically:
• Measures of risk aversion/ impatience predict a wide range of important economic behaviors.
• Cognitive ability matters for wages and other labor market outcomes.
• Typically, risk aversion and impatience are also assumed to be independent of cognitive ability.
• This assumption, however, has received relatively little attention in the empirical literature.

3
Psychology Literature
• Several psychology studies find that higher cognitive ability is associated with greater patience, although some others find no relationship.
• There has been little work on cognitive ability and risk-taking.• Limitations of psychological evidence:
– Typically studies have reported raw correlations, without controls for, e.g., education, income.
– Studies have been restricted to small samples of young children, or students, as subjects.
– Measures of risk aversion or impatience are often (but not always) hypothetical.
4
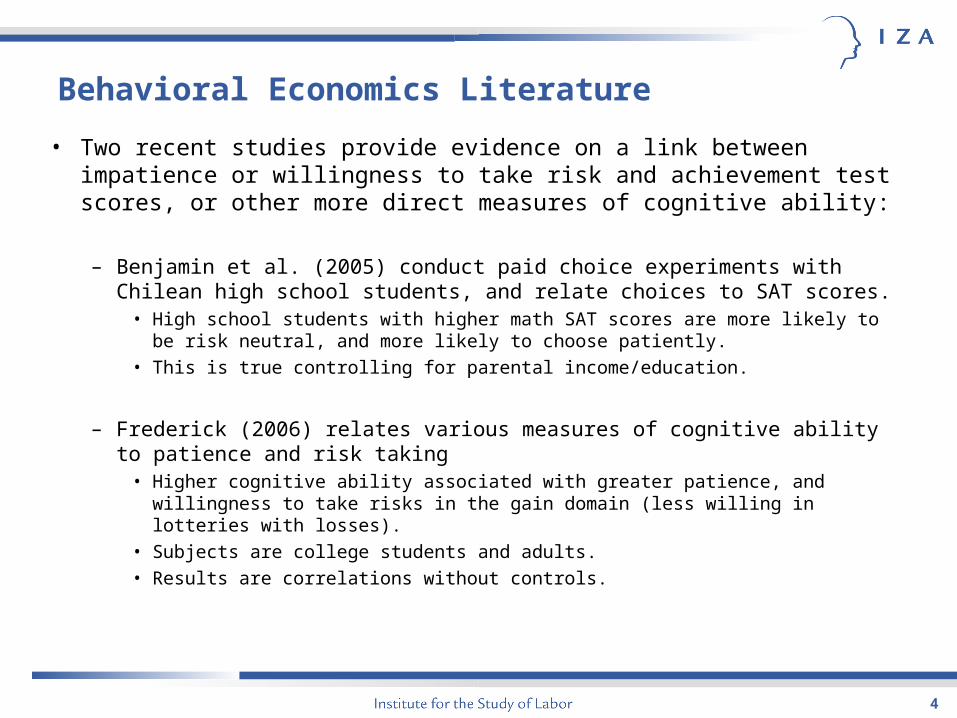
Behavioral Economics Literature
• Two recent studies provide evidence on a link between impatience or willingness to take risk and achievement test scores, or other more direct measures of cognitive ability:
– Benjamin et al. (2005) conduct paid choice experiments with Chilean high school students, and relate choices to SAT scores.
• High school students with higher math SAT scores are more likely to be risk neutral, and more likely to choose patiently.
• This is true controlling for parental income/education.
– Frederick (2006) relates various measures of cognitive ability to patience and risk taking
• Higher cognitive ability associated with greater patience, and willingness to take risks in the gain domain (less willing in lotteries with losses).
• Subjects are college students and adults. • Results are correlations without controls.
5
A Representative Field Experiment
• This paper contributes to this literature, in a way that complements and extends previous research.
– We provide the first evidence based on a representative sample:• 1,012 adults living in Germany.• Roughly half participate in paid choice experiments measuring risk aversion.• Roughly half participate in paid experiments measuring impatience over an
annual time horizon.
– Experiments involve relatively high stakes.– All participants take two tests of cognitive ability, corresponding to sub-
models of widely-used IQ test.– We address confounds that could affect our study, as well as previous
studies, in a series of robustness checks.

6
Why is it important to answer this question?
• Relevant for the specification of structural models that include both cognitive ability and preferences.– E.g., Heckman et al. (2006) are unusual in allowing the discount rate to
be related to cognitive ability.
– Our study can shed light on the value of this flexible approach, and suggest a direction of correlation.
• Interpretation of reduced form models with cognitive ability on right-hand side but not risk aversion or impatience.– E.g., regressing schooling on cognitive ability, without patience, leads
to omitted variable bias.
7
Why is it important to answer this question?
• Important for understanding intergenerational transmission of preferences and socio-economic status.
– IQ known to be transmitted from parents to children.
– Risk aversion and patience are strongly correlated between parents and children.
• Dohmen et al. (2006), Knowles and Postlewaite (2005).
– Could transmission of IQ be a mechanism behind similar choices over time or under uncertainty?
• Ramifications for policy interventions focused on improving child IQ.
– Potential for important feedback effects between child IQ and preferences.

Data
9
Design
• Data were collected between June 9th to July 4th, 2005.• Our sample was drawn so as to be representative of the adult
population living in Germany.• We used the same company that conducts the surveys for the
German Socio-Economic Panel (SOEP).• As for the SOEP, interviewers start at a randomly chosen address, and
then knock on doors.• Interviews conducted in subjects’ homes.
• In total, our data include 1,012 participants.
• The interview had two parts:• First, subjects answered a questionnaire.• Second, subjects were asked to participate in either a lottery
experiment or inter-temporal choice experiment.
• Answers were typed into a laptop computer.

10
Design (continued)
• A random device in CAPI software determined whether the subject was asked to participate in a lottery experiment or an inter-temporal choice experiment.
• We deliberately had subjects participate in only one experiment to avoid order effects.

11
Cognitive Ability Measures
• Each of our two measures is designed to correspond to a different sub-module of the Wechsler Adult Intelligence Scale (German version).– The WAIS is one of the most widely used IQ tests, with 6 verbal and 5
non-verbal sub-modules.– One sub-module involves matching numbers and symbols with a 90
second time limit.– Another sub-module involves a timed vocabulary test.– Previous research shows that our tests correlate well with these sub-
modules, other WAIS modules, and other prominent IQ measures • (Lang et al., 2003 and 2007)
12
Symbol Correspondence Test
• Subjects were posed with 9 unfamiliar symbols, each paired with one of the digits 1 to 9.
• After brief instructions, subjects saw a new screen:– Mapping from numbers to symbols at the top.
– In the center of the screen, one of the symbols, and a box underneath in which the subject could type a number.
– After a subject entered a number, a new screen would appear, with another symbol.
• Subjects had 90 seconds to match as many as possible.
• 105 declined to participate, and procedural problems arose in a couple of cases, leaving 905 subjects with non-missing scores
13
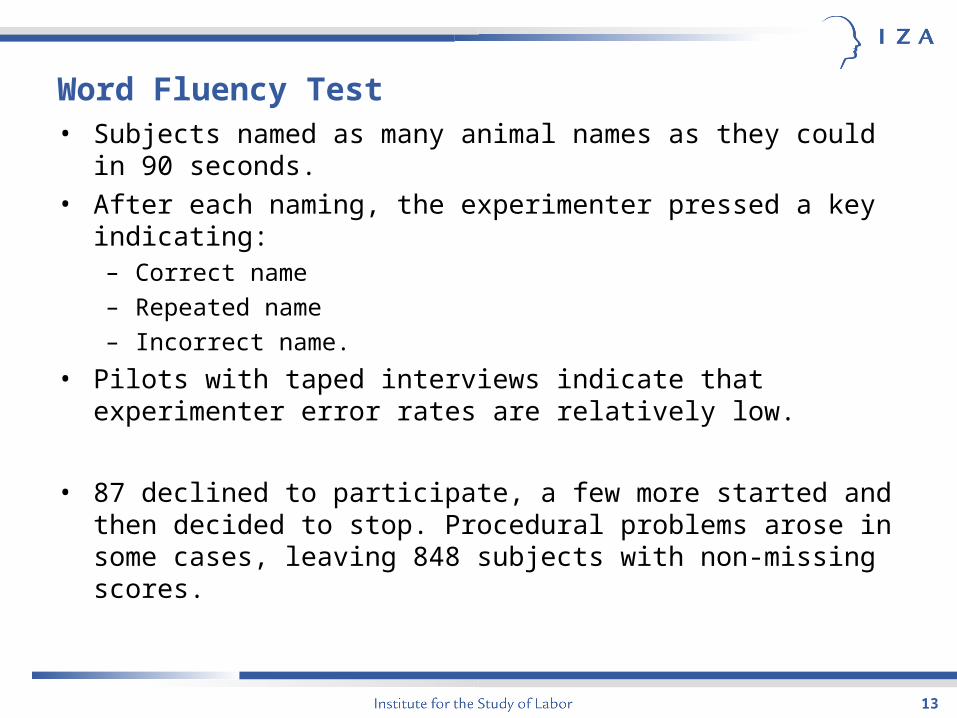
Word Fluency Test• Subjects named as many animal names as they could in 90
seconds.• After each naming, the experimenter pressed a key indicating:
– Correct name
– Repeated name
– Incorrect name.
• Pilots with taped interviews indicate that experimenter error rates are relatively low.
• 87 declined to participate, a few more started and then decided to stop. Procedural problems arose in some cases, leaving 848 subjects with non-missing scores.

14
Distribution of Symbol Correspondence Scores
fluid IQ
15
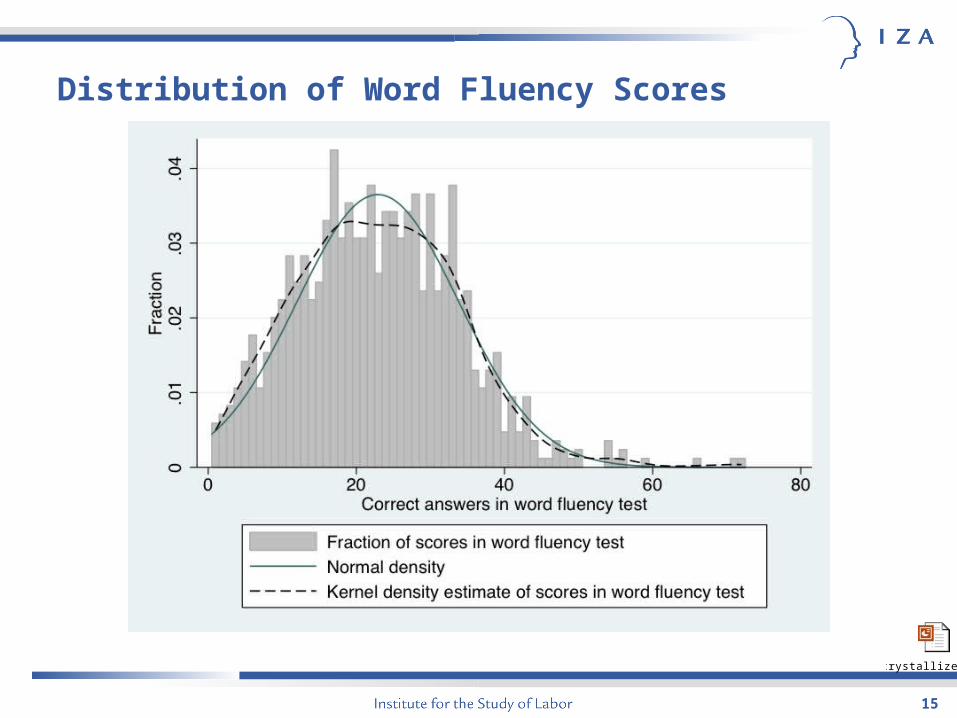
Distribution of Word Fluency Scores
crystallized IQ

16
Lottery Experiment
• Subjects made 20 choices in a choice table.• The choice in each row was between a lottery and a safe option.
– Lottery: 300 or 0 Euros with equal probability.
– Safe option: X Euros, where X varies across 20 choices.
• Subjects knew that at the end, one row would be randomly selected, choice in that row implemented.
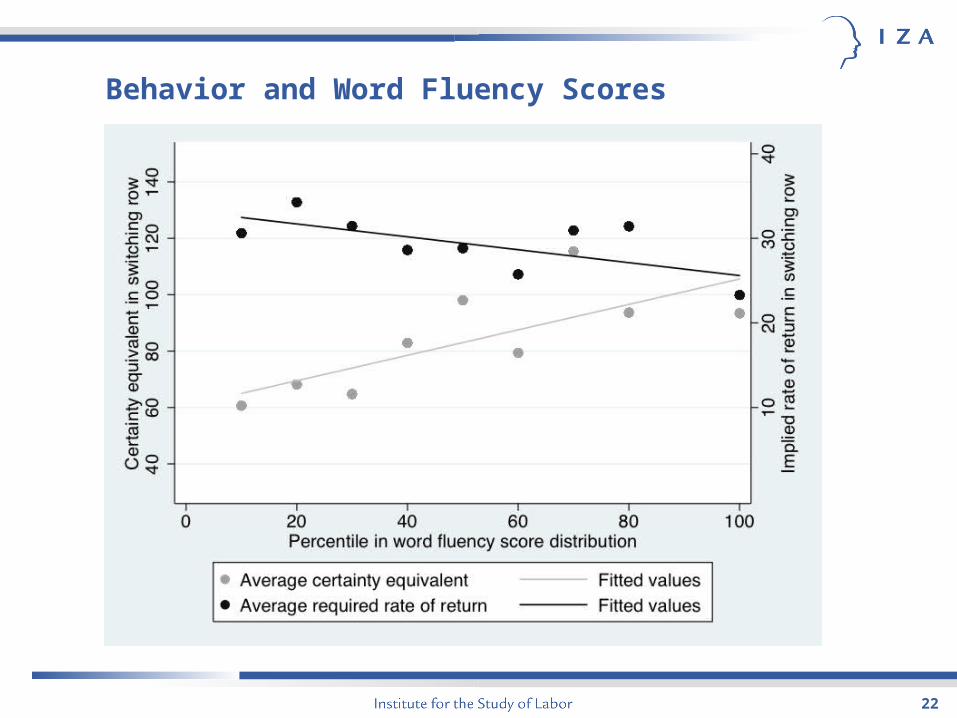
• Switching row in the choice table is an incentive compatible measure of certainty equivalent.
• Switching later in the table indicates a greater willingness to take risks.

17
Choices in the Lottery Experiment
18
Inter-Temporal Choice Experiment
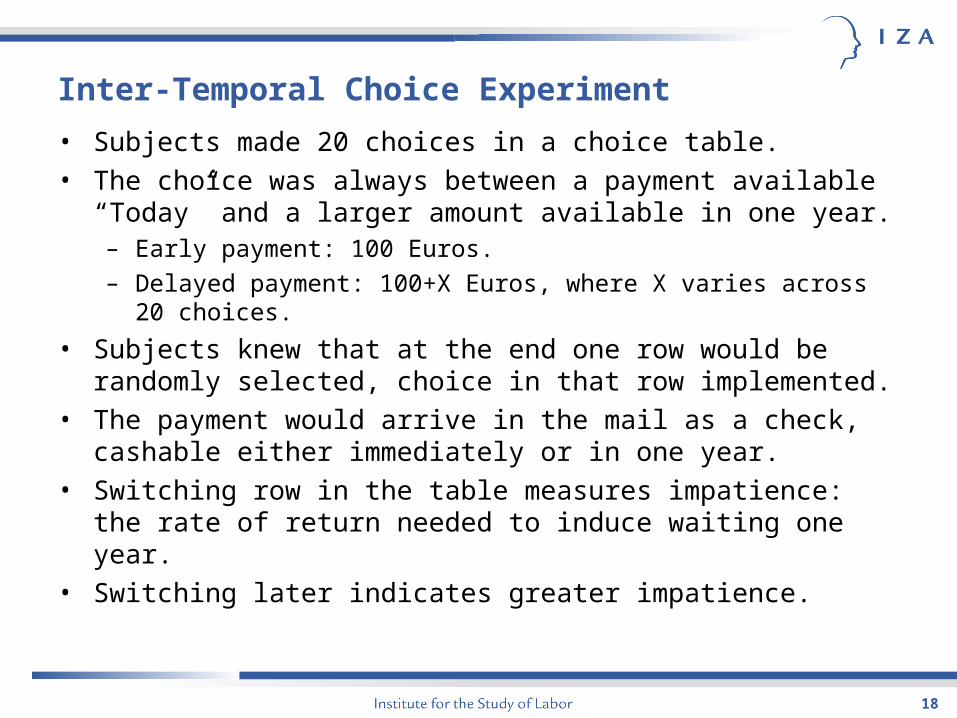
• Subjects made 20 choices in a choice table.• The choice was always between a payment available “Today” and a
larger amount available in one year.– Early payment: 100 Euros.
– Delayed payment: 100+X Euros, where X varies across 20 choices.
• Subjects knew that at the end one row would be randomly selected, choice in that row implemented.
• The payment would arrive in the mail as a check, cashable either immediately or in one year.
• Switching row in the table measures impatience: the rate of return needed to induce waiting one year.
• Switching later indicates greater impatience.

19
Choices in the Inter-Temporal Choice Experiment

Results
21
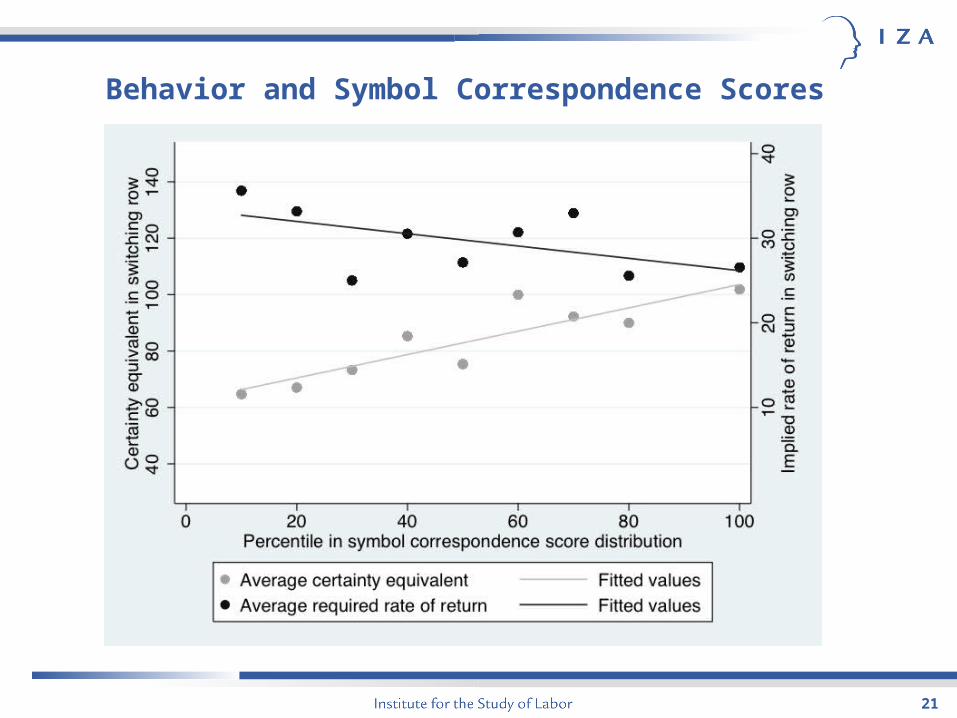
Behavior and Symbol Correspondence Scores
22
Behavior and Word Fluency Scores

23
Baseline Regressions: Willingness to Take Risks
Dependent variable:(1) (2) (3) (4)
Standardized symbol correspondence score 1.142*** 0.816**[0.277] [0.351]
Standardized word fluency score 1.189*** 0.908***[0.306] [0.313]
1 if female 1.075 1.168[0.806] [0.826]
Age (in years) -0.020 -0.029[0.021] [0.018]
Height (in cm) 0.113** 0.099**[0.045] [0.048]
Constant 8.992*** -10.062 9.045***[0.319] [8.282] [0.324]
Log Pseudo-Likelihood -1246.42 -1235.34 -1160.19 -1152.29Observations 413 411 383 382
Willingness to take risks (experimental measure)
Notes: Interval regression coefficients, marginal effects. Robust s.e..

24
Baseline Regressions: Willingness to Take Risks
Dependent variable:(1) (2) (3) (4)
Standardized symbol correspondence score 1.142*** 0.816**[0.277] [0.351]
Standardized word fluency score 1.189*** 0.908***[0.306] [0.313]
1 if female 1.075 1.168[0.806] [0.826]
Age (in years) -0.020 -0.029[0.021] [0.018]
Height (in cm) 0.113** 0.099**[0.045] [0.048]
Constant 8.992*** -10.062 9.045***[0.319] [8.282] [0.324]
Log Pseudo-Likelihood -1246.42 -1235.34 -1160.19 -1152.29Observations 413 411 383 382
Willingness to take risks (experimental measure)
Notes: Interval regression coefficients, marginal effects. Robust s.e..
25
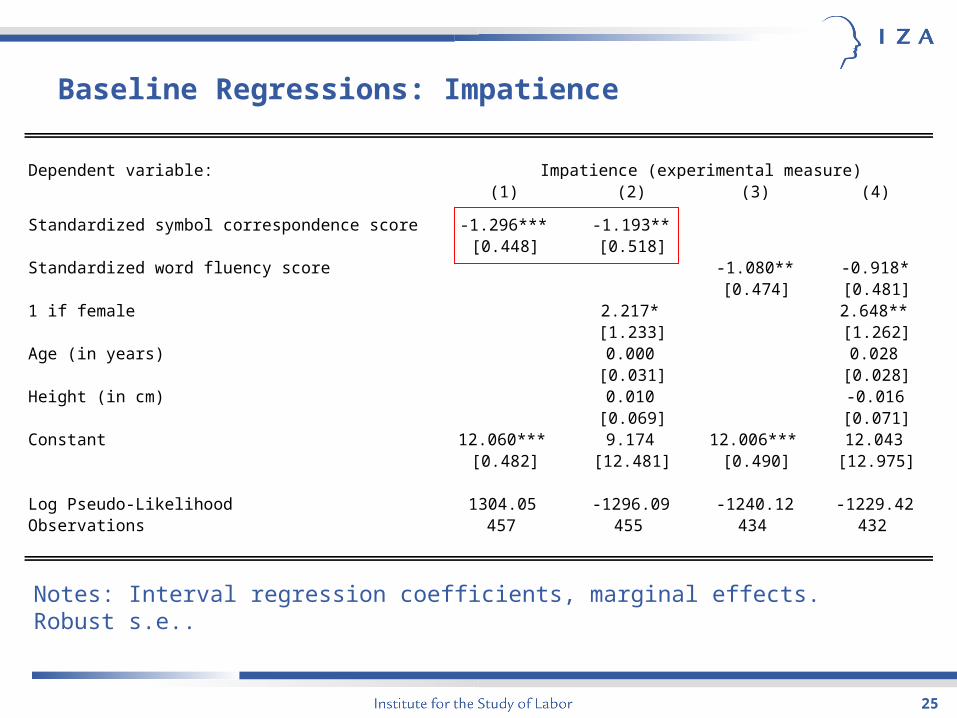
Baseline Regressions: Impatience
Dependent variable:(1) (2) (3) (4)
Standardized symbol correspondence score -1.296*** -1.193**[0.448] [0.518]
Standardized word fluency score -1.080** -0.918*[0.474] [0.481]
1 if female 2.217* 2.648**[1.233] [1.262]
Age (in years) 0.000 0.028[0.031] [0.028]
Height (in cm) 0.010 -0.016[0.069] [0.071]
Constant 12.060*** 9.174 12.006*** 12.043[0.482] [12.481] [0.490] [12.975]
Log Pseudo-Likelihood 1304.05 -1296.09 -1240.12 -1229.42Observations 457 455 434 432
Impatience (experimental measure)
Notes: Interval regression coefficients, marginal effects. Robust s.e..
26
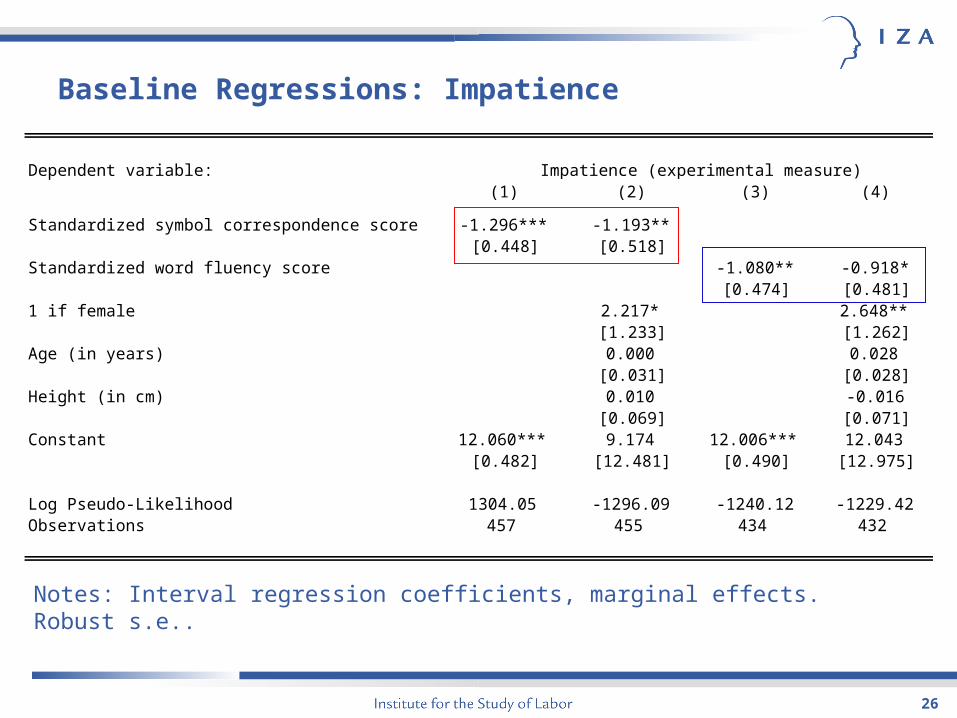
Baseline Regressions: Impatience
Dependent variable:(1) (2) (3) (4)
Standardized symbol correspondence score -1.296*** -1.193**[0.448] [0.518]
Standardized word fluency score -1.080** -0.918*[0.474] [0.481]
1 if female 2.217* 2.648**[1.233] [1.262]
Age (in years) 0.000 0.028[0.031] [0.028]
Height (in cm) 0.010 -0.016[0.069] [0.071]
Constant 12.060*** 9.174 12.006*** 12.043[0.482] [12.481] [0.490] [12.975]
Log Pseudo-Likelihood 1304.05 -1296.09 -1240.12 -1229.42Observations 457 455 434 432
Impatience (experimental measure)
Notes: Interval regression coefficients, marginal effects. Robust s.e..
Robustness
28
Education
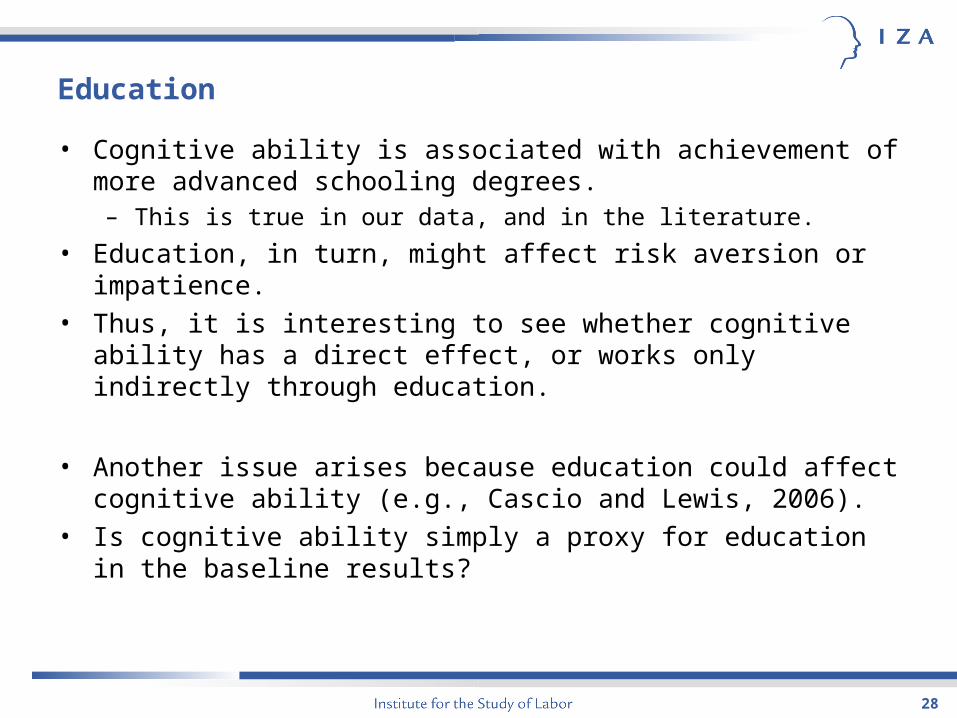
• Cognitive ability is associated with achievement of more advanced schooling degrees.– This is true in our data, and in the literature.
• Education, in turn, might affect risk aversion or impatience.• Thus, it is interesting to see whether cognitive ability has a direct
effect, or works only indirectly through education.
• Another issue arises because education could affect cognitive ability (e.g., Cascio and Lewis, 2006).
• Is cognitive ability simply a proxy for education in the baseline results?

29
Risk Results are Robust to Adding Education
Dependent variable:(1) (2) (3) (4)
Standardized symbol correspondence score 0.823*** 0.600*[0.312] [0.350]
Standardized word fluency score 0.823** 0.675**[0.327] [0.325]
Controls for shooling degree Yes Yes Yes YesControls for gender, age, height No Yes No Yes
Log Pseudo-Likelihood -1237.8 -1228.84 -1153.99 -1148.19Observations 413 411 383 382
Willingness to take risks (experimental measure)
Notes: Interval regression coefficients, marginal effects. Robust s.e..

30
Impatience Results Robust to Adding Education
Dependent variable:(1) (2) (3) (4)
Standardized symbol correspondence score -1.262*** -1.084**[0.474] [0.542]
Standardized word fluency score -0.908* -0.729[0.500] [0.497]
Controls for shooling degree Yes Yes Yes YesControls for gender, age, height No Yes No Yes
Log Pseudo-Likelihood -1302.17 -1294.50 -1235.92 -1225.58Observations 457 455 434 432
Impatience (experimental measure)
Notes: Interval regression coefficients, marginal effects. Robust s.e..
31
Income and Credit Constraints
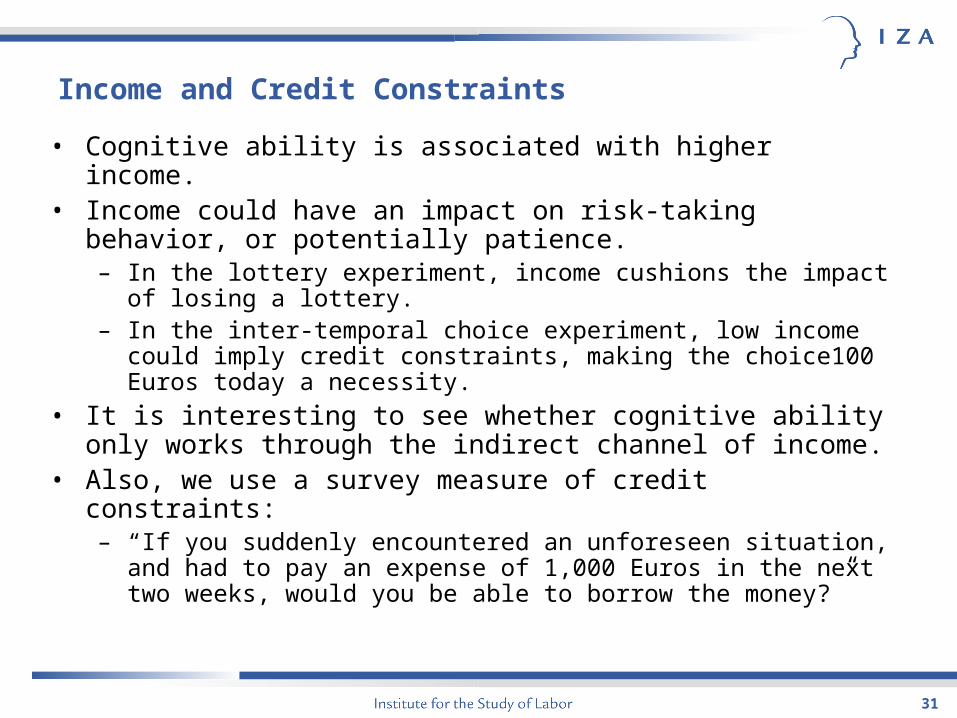
• Cognitive ability is associated with higher income.• Income could have an impact on risk-taking behavior, or potentially
patience.– In the lottery experiment, income cushions the impact of losing a lottery.– In the inter-temporal choice experiment, low income could imply credit
constraints, making the choice100 Euros today a necessity.
• It is interesting to see whether cognitive ability only works through the indirect channel of income.
• Also, we use a survey measure of credit constraints:– “If you suddenly encountered an unforeseen situation, and had to pay
an expense of 1,000 Euros in the next two weeks, would you be able to borrow the money?”
32
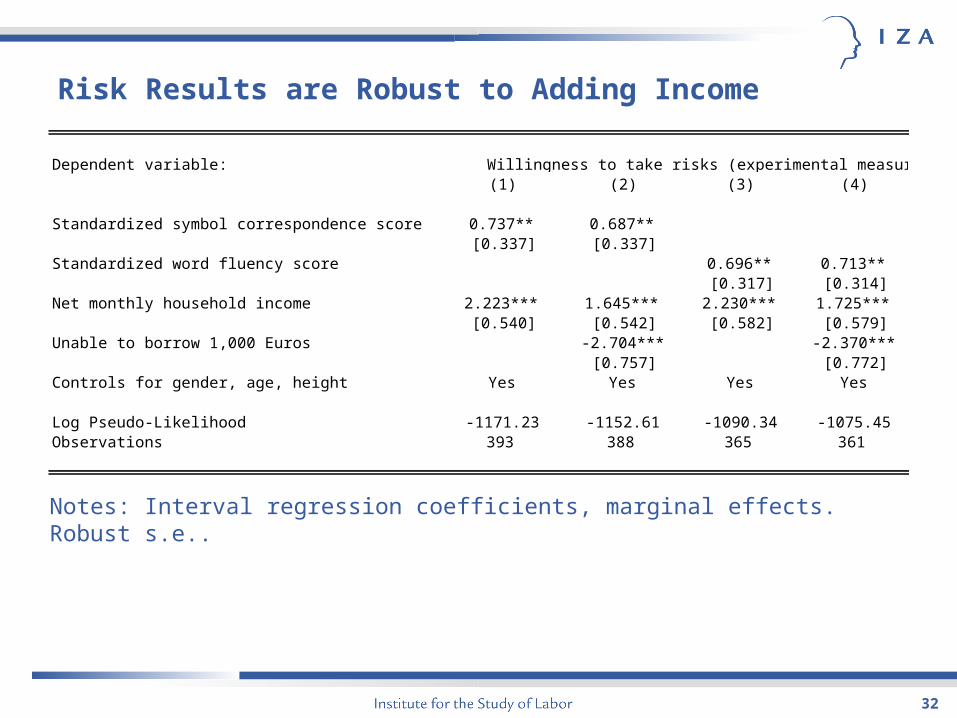
Risk Results are Robust to Adding Income
Dependent variable:(1) (2) (3) (4)
Standardized symbol correspondence score 0.737** 0.687**[0.337] [0.337]
Standardized word fluency score 0.696** 0.713**[0.317] [0.314]
Net monthly household income 2.223*** 1.645*** 2.230*** 1.725***[0.540] [0.542] [0.582] [0.579]
Unable to borrow 1,000 Euros -2.704*** -2.370***[0.757] [0.772]
Controls for gender, age, height Yes Yes Yes Yes
Log Pseudo-Likelihood -1171.23 -1152.61 -1090.34 -1075.45Observations 393 388 365 361
Willingness to take risks (experimental measure)
Notes: Interval regression coefficients, marginal effects. Robust s.e..
33
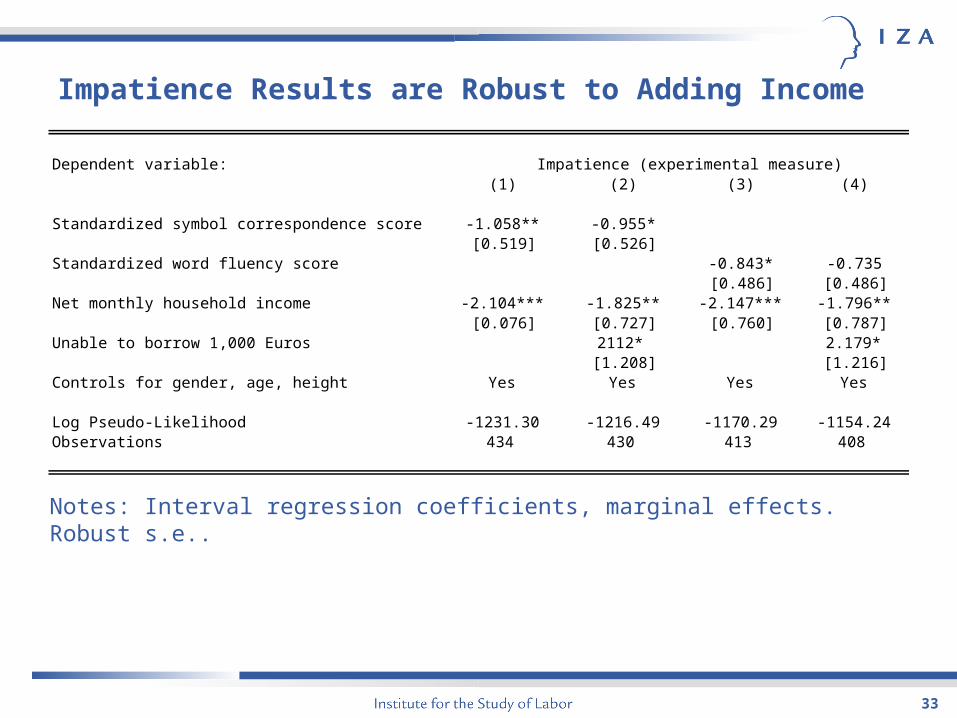
Impatience Results are Robust to Adding Income
Dependent variable:(1) (2) (3) (4)
Standardized symbol correspondence score -1.058** -0.955*[0.519] [0.526]
Standardized word fluency score -0.843* -0.735[0.486] [0.486]
Net monthly household income -2.104*** -1.825** -2.147*** -1.796**[0.076] [0.727] [0.760] [0.787]
Unable to borrow 1,000 Euros 2112* 2.179*[1.208] [1.216]
Controls for gender, age, height Yes Yes Yes Yes
Log Pseudo-Likelihood -1231.30 -1216.49 -1170.29 -1154.24Observations 434 430 413 408
Impatience (experimental measure)
Notes: Interval regression coefficients, marginal effects. Robust s.e..

34
Confusion about Incentives?
• One potential confound could arise if low cognitive ability caused people to be confused about incentives.– This would be a problem if confusion lead to behavior that happened to
look like, e.g., greater risk aversion.
• For risk attitudes we have a way to address this issue explicitly.• We use a very simple survey measure that asks about willingness to
take risks:– “In general, are you a person who is fully prepared to take risks, or do
you try to avoid taking risks?”
– Respondents answer on a scale for 0 to 10, where 0 indicates “completely unwilling” and 10 “completely willing”
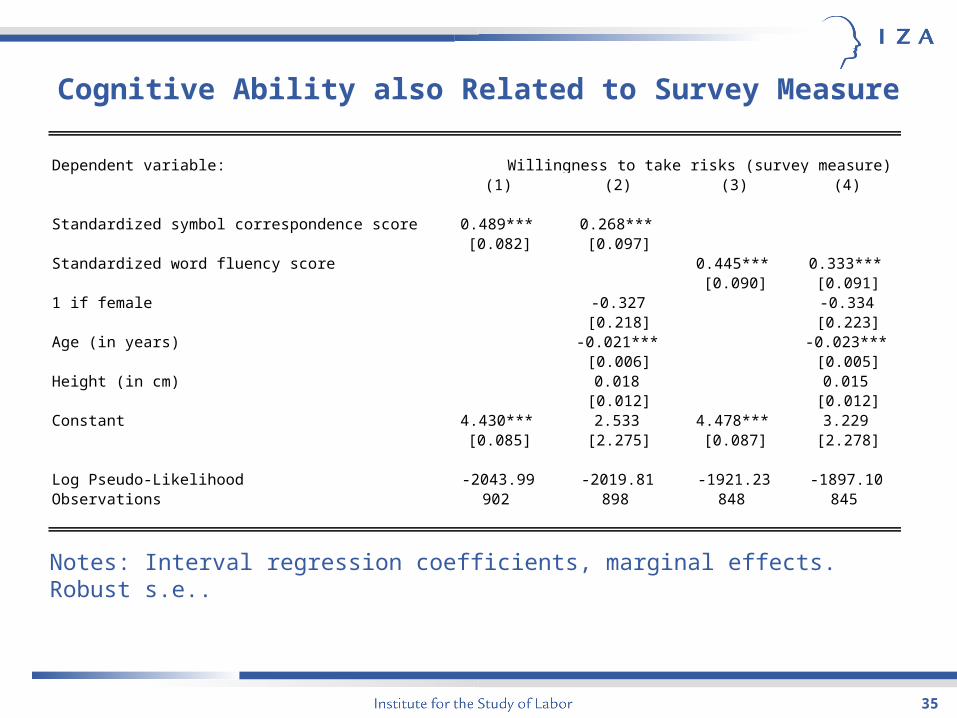
35
Cognitive Ability also Related to Survey Measure
Dependent variable:(1) (2) (3) (4)
Standardized symbol correspondence score 0.489*** 0.268***[0.082] [0.097]
Standardized word fluency score 0.445*** 0.333***[0.090] [0.091]
1 if female -0.327 -0.334[0.218] [0.223]
Age (in years) -0.021*** -0.023***[0.006] [0.005]
Height (in cm) 0.018 0.015[0.012] [0.012]
Constant 4.430*** 2.533 4.478*** 3.229[0.085] [2.275] [0.087] [2.278]
Log Pseudo-Likelihood -2043.99 -2019.81 -1921.23 -1897.10Observations 902 898 848 845
Willingness to take risks (survey measure)
Notes: Interval regression coefficients, marginal effects. Robust s.e..

36
Other Robustness Checks
• Could Test Scores Proxy for Personality?
• Arbitrage between experiment and market rates of return.
• Risk aversion, impatience, and test-taking strategy.
• Time preference vs. concavity of utility (risk aversion) as determinants of impatient behavior.
Arbitrage
Concavity of utility
Personality
37
Conclusions
• We find a significant and robust relationship between cognitive ability, risk aversion, and impatience.– People with higher cognitive ability are more patient, and more willing to
take risks.
• Regardless of the precise mechanism, it is important to know that cognitive ability, risk aversion, and impatience are systematically related.– Implications for specifying econometric models.
– Interpretation of reduced form models.
– Intergenerational transmission.
– Inequality and IQ.
– Implications for policy interventions focused on improving child IQ.
38
Conclusions• For future research: establishing underlying mechanisms.
– Bounded rationality, in the sense of choice bracketing?• Cognitive ability could affect whether people bracket narrowly, making risky
choices in isolation, or recognize that they form part of a larger portfolio.• Cognitive ability could also affect whether people integrate present and
future considerations.
– Two-system explanation?• Cognitive system in the brain can be overpowered by affective system;
affective system is the source of urges for immediate consumption, fear of losses.
• Cognitive ability could proxy for the resources an individual has to suppress emotional urges.
– Feedback from preferences to development of cognitive skills?• Although cognitive ability may affect risk aversion and impatience, there
could also be important feedback effects.• E.g., patience conducive to developing cognitive skills.
– Evolution• Adaptive for low-cognitive ability to go with conservative strategies of risk
aversion and grabbing immediate rewards?

Thomas Dohmen
IZA, P.O. Box 7240, 53072 Bonn, Germany
Phone: +49 (0) 228 - 38 94 -204Fax: +49 (0) 228 - 38 94 180
E-mail: [email protected]
http://www.iza.org