Are network effects causal or spurious? Evidence from ...
53
i Are network effects causal or spurious? Evidence from alliance-network externalities Exequiel Hernandez The Wharton School University of Pennsylvania [email protected] Jason Lee The Wharton School University of Pennsylvania [email protected] J. Myles Shaver Carlson School of Management University of Minnesota [email protected] Authors contributed equally and listed alphabetically Draft: 9 September 2020 ABSTRACT: We investigate whether the effect of alliance network position on innovation is causal or spurious. Do firms innovate more because of their structural position, or do they occupy that position because of their innovation strategies and capabilities? To disentangle cause and effect, we advance a theoretical concept—alliance-network externalities—that distinguishes ego-driven network changes (endogenous) from alter-driven changes (exogenous). We further develop a novel methodology to identify those two types of network change and assess the causal effect of network position on innovation. We apply our approach to re-evaluate the relationship between structural holes and firm patenting in the biotechnology industry alliance network (1995-2012) and find no evidence of a causal effect. Structural holes are positively associated with innovation only under conditions of endogenous (ego-driven) network change, and they have no discernible impact on innovation under conditions of exogenous (alter-driven) network change. We discuss the implications our findings have for the theoretical development and empirical testing of interorganizational network effects. Acknowledgements: We received helpful comments from Paul Nary, Lori Rosenkopf, and seminar participants at Wharton. We thank Matt Higgins for providing the alliance data and Emilie Feldman for providing the divestiture data. We also thank the Mack Institute for Innovation Management for funding this project. The usual disclaimers apply.
Transcript of Are network effects causal or spurious? Evidence from ...

i
Are network effects causal or spurious? Evidence from alliance-network externalities
Exequiel Hernandez
The Wharton School
University of Pennsylvania
Jason Lee
The Wharton School
University of Pennsylvania
J. Myles Shaver
Carlson School of Management
University of Minnesota
Authors contributed equally and listed alphabetically
Draft: 9 September 2020
ABSTRACT: We investigate whether the effect of alliance network position on innovation is
causal or spurious. Do firms innovate more because of their structural position, or do they
occupy that position because of their innovation strategies and capabilities? To disentangle
cause and effect, we advance a theoretical concept—alliance-network externalities—that
distinguishes ego-driven network changes (endogenous) from alter-driven changes
(exogenous). We further develop a novel methodology to identify those two types of network
change and assess the causal effect of network position on innovation. We apply our
approach to re-evaluate the relationship between structural holes and firm patenting in the
biotechnology industry alliance network (1995-2012) and find no evidence of a causal effect.
Structural holes are positively associated with innovation only under conditions of
endogenous (ego-driven) network change, and they have no discernible impact on
innovation under conditions of exogenous (alter-driven) network change. We discuss the
implications our findings have for the theoretical development and empirical testing of
interorganizational network effects.
Acknowledgements: We received helpful comments from Paul Nary, Lori Rosenkopf, and
seminar participants at Wharton. We thank Matt Higgins for providing the alliance data and
Emilie Feldman for providing the divestiture data. We also thank the Mack Institute for
Innovation Management for funding this project. The usual disclaimers apply.

1
We investigate whether the well-documented effect of alliance network position on
firm innovation is causal or spurious. Although there is much empirical evidence that certain
positions within an alliance network (e.g., structural holes, centrality) are associated with
innovation (e.g. Ahuja, 2000a; Phelps, Heidl, and Wadhwa, 2012; Balachandran and
Hernandez, 2018), the actions and capabilities that allow a firm to obtain advantageous
network positions are hard to separate from the innovation outcomes that might stem from
those positions. In other words, do firms innovate more because of their position, or do they
occupy those positions because of their innovation goals, strategies, or capabilities? While
isolating the causal mechanism might appear to be an empirical issue, it is fundamentally a
theoretical endeavor because the resolution depends on how scholars conceptualize the
underlying mechanisms by which interfirm networks arise and change (see Shaver, 2020, for
a general discussion).
To help disentangle cause and effect in this line of research, we advance a
theoretical concept: alliance–network externalities, defined as the structural change in a
focal firm’s network caused by another firm’s corporate activities. This concept helps
distinguish if changes in a firm’s network stem from its own actions (i.e., ego-driven or
endogenous) or from the actions of other firms (i.e., alter-driven or exogenous to the focal
firm). From this theoretical foundation, we advance a novel research design to identify if the
established empirical relationships between network position and innovation are causal.
Building on recent work (Hernandez and Menon, 2018, 2020), we explore how the
network position of a firm can be unexpectedly and suddenly—thus exogenously—reshaped
by the corporate activities of other firms. By corporate activities, we refer to acquisitions,
alliance formation and dissolution, divestitures, and industry entries or exits that modify the
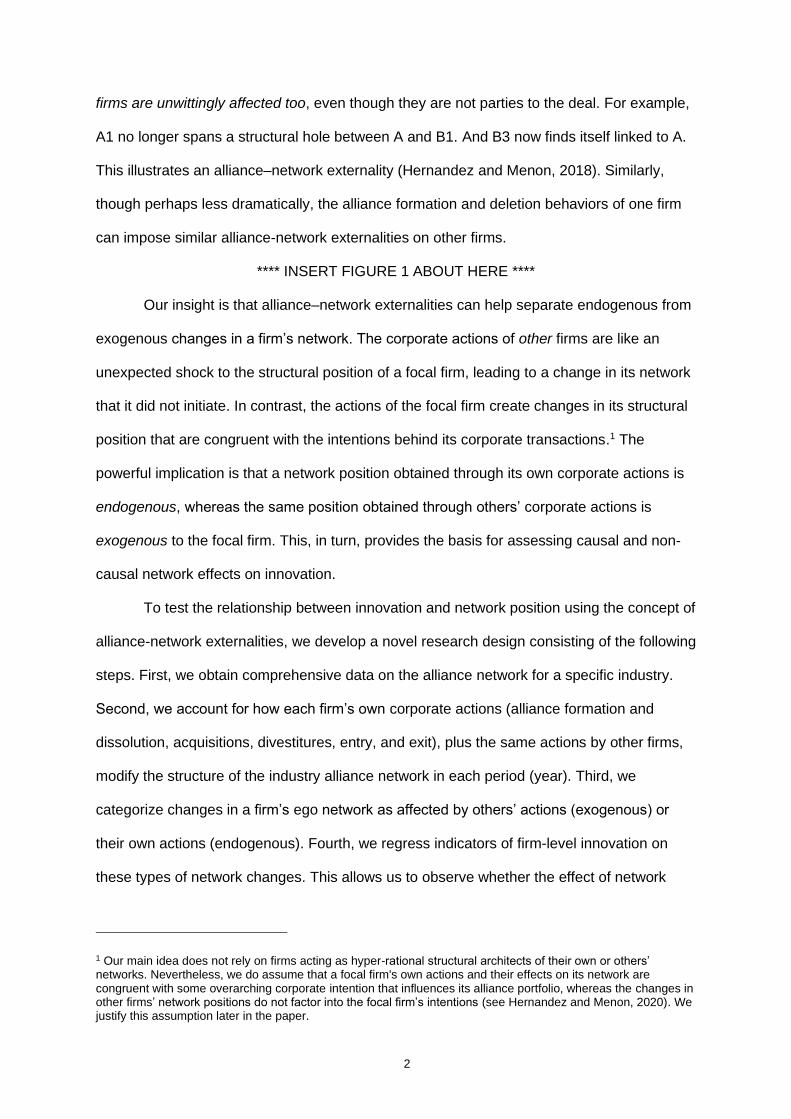
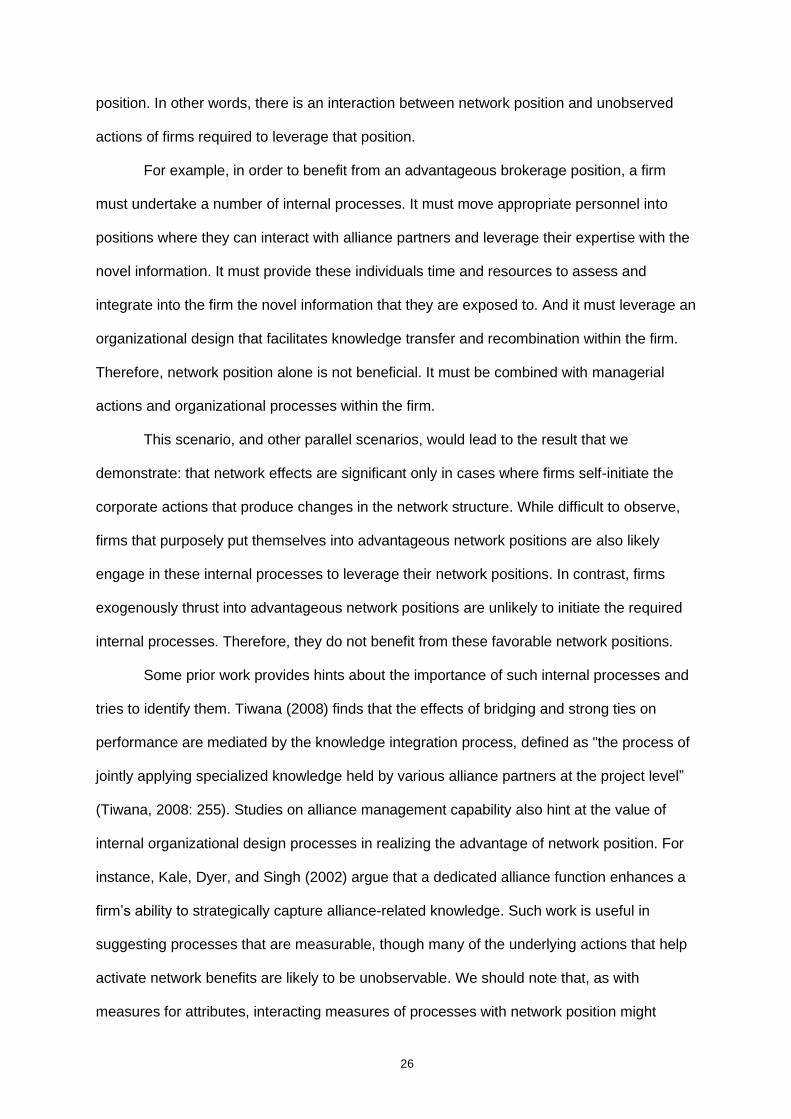
nodes and the ties in an interfirm alliance network (Hernandez and Menon, 2020). Figure 1
offers a simple illustration pertaining to acquisitions. The network on the left shows the ego
networks of firms A and B. The one on the right shows what happens to the network after A
and B merge. Previous research focuses on how such network combination affects the
acquiring firm (A) (Hernandez and Menon, 2018; Hernandez and Shaver, 2019). But other
2
firms are unwittingly affected too, even though they are not parties to the deal. For example,
A1 no longer spans a structural hole between A and B1. And B3 now finds itself linked to A.
This illustrates an alliance–network externality (Hernandez and Menon, 2018). Similarly,
though perhaps less dramatically, the alliance formation and deletion behaviors of one firm
can impose similar alliance-network externalities on other firms.
**** INSERT FIGURE 1 ABOUT HERE ****
Our insight is that alliance–network externalities can help separate endogenous from
exogenous changes in a firm’s network. The corporate actions of other firms are like an
unexpected shock to the structural position of a focal firm, leading to a change in its network
that it did not initiate. In contrast, the actions of the focal firm create changes in its structural
position that are congruent with the intentions behind its corporate transactions.1 The
powerful implication is that a network position obtained through its own corporate actions is
endogenous, whereas the same position obtained through others’ corporate actions is
exogenous to the focal firm. This, in turn, provides the basis for assessing causal and non-
causal network effects on innovation.
To test the relationship between innovation and network position using the concept of
alliance-network externalities, we develop a novel research design consisting of the following
steps. First, we obtain comprehensive data on the alliance network for a specific industry.
Second, we account for how each firm’s own corporate actions (alliance formation and
dissolution, acquisitions, divestitures, entry, and exit), plus the same actions by other firms,
modify the structure of the industry alliance network in each period (year). Third, we
categorize changes in a firm’s ego network as affected by others’ actions (exogenous) or
their own actions (endogenous). Fourth, we regress indicators of firm-level innovation on
these types of network changes. This allows us to observe whether the effect of network
1 Our main idea does not rely on firms acting as hyper-rational structural architects of their own or others’ networks. Nevertheless, we do assume that a focal firm's own actions and their effects on its network are congruent with some overarching corporate intention that influences its alliance portfolio, whereas the changes in other firms’ network positions do not factor into the focal firm’s intentions (see Hernandez and Menon, 2020). We justify this assumption later in the paper.

3
position on organizational outcomes is statistically significant under distinct exogenous and
endogenous network change conditions.
We apply this approach to re-assess the impact of structural holes on patent-based
indicators of innovation—one of the most commonly studied relationships in research on
interorganizational networks, but for which there is mixed empirical support (see Phelps,
Heidl, and Wadhwa, 2012 for a review). Our empirical context is the life sciences
(biotechnology) industry. We use data on alliances, acquisitions, and other corporate actions
between 1995 and 2007, and data on patents between 1996 and 2012. This well-researched
setting is advantageous because it allows us to replicate prior work before adopting our
novel approach. Our replication confirms prior findings consistent with the canonical theory
(Burt, 1992, 2004): a positive relationship between structural holes and innovation (i.e., a
negative effect of constraint on innovation). Thus, we replicate a common finding—despite
some mixed prior evidence—which ensures that our results are not driven by choosing a
setting different from prior research. Yet once we apply our novel research design to identify
alliance–network externalities, the positive relationship between structural holes and
innovation holds only under conditions of endogenous network change. Under conditions of
exogenous network change, structural holes have no effect on innovation (positive or
negative).
Our central conclusion is that the effect of network position on firm innovation is not
causal. We discuss the implications of our findings for existing and future research. Existing
findings might reflect that network effects are spurious or that network effects need to be
paired with a firm’s attributes or actions (not measured in existing studies) to be activated
(c.f. Smith, Menon, and Thompson, 2012). For each of these possibilities, we highlight
theoretical and empirical considerations to rigorously advance future research on networks
and organizational performance.
4
BACKGROUND
The networks perspective has become one of the most important lenses to
understand how the external environment affects firms. Among the many outcomes affected
by networks, innovation has received significant attention. Innovation is often conceptualized
as a process of knowledge recombination, whereby firms obtain multiple bits of knowledge
and put them together in original combinations (Fleming, 2001). Networks factor into this
process because the structural position a firm occupies affects the amount of knowledge that
flows to the firm, the variety of knowledge to which the firm is exposed, and the exclusivity of
the knowledge available to the firm. These are crucial inputs into the process of
recombination.
A major complication of assessing the relationship between network positions and
firm-level outcomes, such as innovation, is that the “network generating process” is not
clearly theorized (Salancik, 1995). That is, there is no generally accepted account of how
firms end up in certain positions of interest. Unless network position is random, making
causal claims about network position on firm outcomes is complicated. It is difficult to know if
the effect of the network position on the outcome of interest reflects the network position or
the factors that lead to the network position. In other words, is the network effect causal or
spurious? In the context of studying firm innovation, where scholars assess the network
structure in webs of alliances between firms, the assumption that alliance formation is a
random process is untenable because many studies demonstrate the strategic, agentic
nature of alliance formation (e.g. Eisenhardt and Schoonhoven, 1996; Ahuja, 2000b;
Mindruta, 2013).
We are not making a purely empirical point, although this issue has important
empirical implications. Instead, we mean that the theoretical mechanism driving the
relationship between the network position and the outcome (e.g. innovation) could be factors
related to the process that lead firms to end up in that position to begin with, rather than with
the position itself. In the case of firms, those factors would be related to the organization’s
motivations, abilities, or opportunities. Thus, how we theorize about the network generating
5
process is central to making causal claims about the effects of networks on firm outcomes
(Pearl and Mackenzie, 2018).
To demonstrate the importance of these considerations, consider a relationship with
wide application in the literature: the effect of structural holes on firm innovation. The theory
is well known (Burt, 2004). A firm spans more structural holes the more disconnected
partners it has. Different partners belong to different knowledge communities. Because
knowledge across communities is more different than within communities, each
disconnected partner exposes the focal actor to a distinct body of knowledge. And because
the partners are disconnected, the focal firm is in the unique position of being the only one
with access to the intersection of those distinct knowledge bits. Hence, networks with many
structural holes expose a focal firm to a greater amount and variety of knowledge with
greater exclusivity. Therefore, brokers should have an advantage in terms of identifying and
accessing non-redundant ideas.
To span many structural holes, a firm needs to have (a) many partners who are (b)
disconnected from one another, (c) representing a diverse and non-redundant set of
knowledge spheres. Further, the theory relating structural holes to innovation implies the
following mechanisms once a firm is positioned to span structural holes (see Vasudeva,
Zaheer, and Hernandez, 2013): (d) knowledge flows from the partners to the broker and (e)
the broker is capable of absorbing and recombining that knowledge in creative ways.
Given those conditions, it is useful to consider what kind of factors would lead a firm
to end up in such an advantaged position. In terms of condition (a), firms that can attract
many alliance partners are technically, commercially, and socially strong (Ahuja, 2000b).
That is, they have strong technological capabilities, or powerful brands and products, or they
are of high status in their social communities. In terms of conditions (b) and (c), firms that
establish alliances across a variety of knowledge spaces are likely to be following a
diversified product and technological strategy (Hernandez and Shaver, 2019) or to be in
dynamic industries (Tatarynowicz, Sytch, and Gulati, 2016). In terms of condition (d), firms
that can motivate their partners to share knowledge probably have strong alliance

6
management capabilities (Kale, Dyer, and Singh, 2002). And in terms of condition (e), firms
that can absorb and recombine multiple sources of knowledge must have a reasonably high
absorptive capacity (Cohen and Levinthal, 1990) and creativity.
The conclusion from such an exercise is that the strategic goals, actions, and
capabilities of firms play an essential role in determining who ends up with many structural
holes. And because those strategic goals and capabilities are associated with enhanced
innovation outcomes, separating the "structural hole generating process" from the causal
effect of structural holes on innovation is extremely challenging. Although we focus on
structural holes, this same issue arises for other network characteristics.
The appeal of the theory linking structural holes to innovation has led to a significant
amount of empirical research (see Phelps, Heidl, and Wadhwa, 2012). The findings of that
research, however, are mixed. Some work finds that structural holes positively affect
innovation, in line with the canonical theory. For example, in studies examining inventors’
collaboration networks, structural holes are associated with increases in exploratory
innovations (Wang et al., 2014) and new combinations of knowledge (Fleming, Mingo, and
Chen, 2007). Vasudeva, Zaheer, and Hernandez (2013) report a positive main effect of
structural holes in a network of fuel-cell R&D alliances on citation-weighted patents, after
which they explore institutional contingencies that modify that relationship. Other research
has documented a negative effect of structural holes on innovation, seemingly contradicting
the original theory. Ahuja (2000a) tests the theory in the chemicals industry and finds a
negative relationship between structural holes and patent counts. Guler and Nerkar (2012)
find that a closed alliance network of is positively associated with the focal firm’s patents
output. Phelps (2010) highlights that closed networks are positively associated with the
production of exploratory patents in the telecommunications industry.
Efforts to establish a relationship between structural holes and innovation suffer from
the difficulties we just outlined because of the myriad of factors that lead firms to end up in
brokerage positions are often unobservable (i.e., cannot be controlled for in empirical
analyses). Scholars are not blind to these concerns and have tried to address them in one of

7
three ways. First, some studies introduce firm-fixed effects to try and minimize unobserved
firm heterogeneity (e.g., Ahuja, 2000a; Phelps, 2010). But inasmuch as the unobservables
that determine firms’ network positions vary over time, this solution is far from perfect.
Second, some studies seek to address endogeneity problems by adopting instrumental
variables to mitigate the effect of unobserved factors (Fleming, Mingo, and Chen, 2007;
Zaheer and Soda, 2009; Vasudeva, Zaheer, and Hernandez, 2013). Yet instrumental
variables are only as good as the assumptions and theories that justify them, and weak
instruments can exacerbate the problem (Angrist and Pischke, 2008). Third, some studies
theorize about factors that modify the relationship between structural holes and innovation
by introducing contingency variables, which are tested by interacting network position with
the moderator of interest (Shipilov, 2009; Soh, 2010; Aral and Van Alstyne, 2011). But
interactions are still subject to the omitted variable problem—a point we discuss later.
A better solution would be to find a scenario in which the theoretical mechanism
leading to the firm’s network position is exogenous to its goals, actions, and capabilities. We
introduce such a mechanism in this paper and use it as the basis of our test to assess if
network position has a causal impact on innovation. As a result, we derive a novel
theoretical design that invokes exogenous variance in network structure, rather than relying
on the assumptions underlying a statistical approach to mitigate endogeneity concerns.
THEORY
Recent advances in the study of interfirm networks provide a means of identifying
situations in which the network of a focal firm changes as a result of other firms' actions. We
apply those ideas to distinguish between intentional and unintentional network change
processes, which form the conceptual basis of a test of causal network effects.
Alliance–Network Externalities
A network is composed of nodes and ties; thus, network change is fundamentally
about modifications in nodes and ties. Existing research overwhelmingly considers
processes of network formation and change driven by modifications of ties. For interfirm
networks, tie changes happen when two firms either form or end a relationship, such as an
8
alliance. But Hernandez and Menon (2020) point out that firms also engage in corporate
actions that modify network structures by affecting the existence and ownership of nodes,
including acquisitions (“node collapses”), divestitures (“node splits”), industry entry (“node
appearance”), and industry exit (“node disappearance”). A few papers have explored how
those actions affect network change in ways that differ from tie additions and deletions, with
a focus on the network of the focal firm undertaking those actions (Hernandez and Menon,
2018; Hernandez and Shaver, 2019)
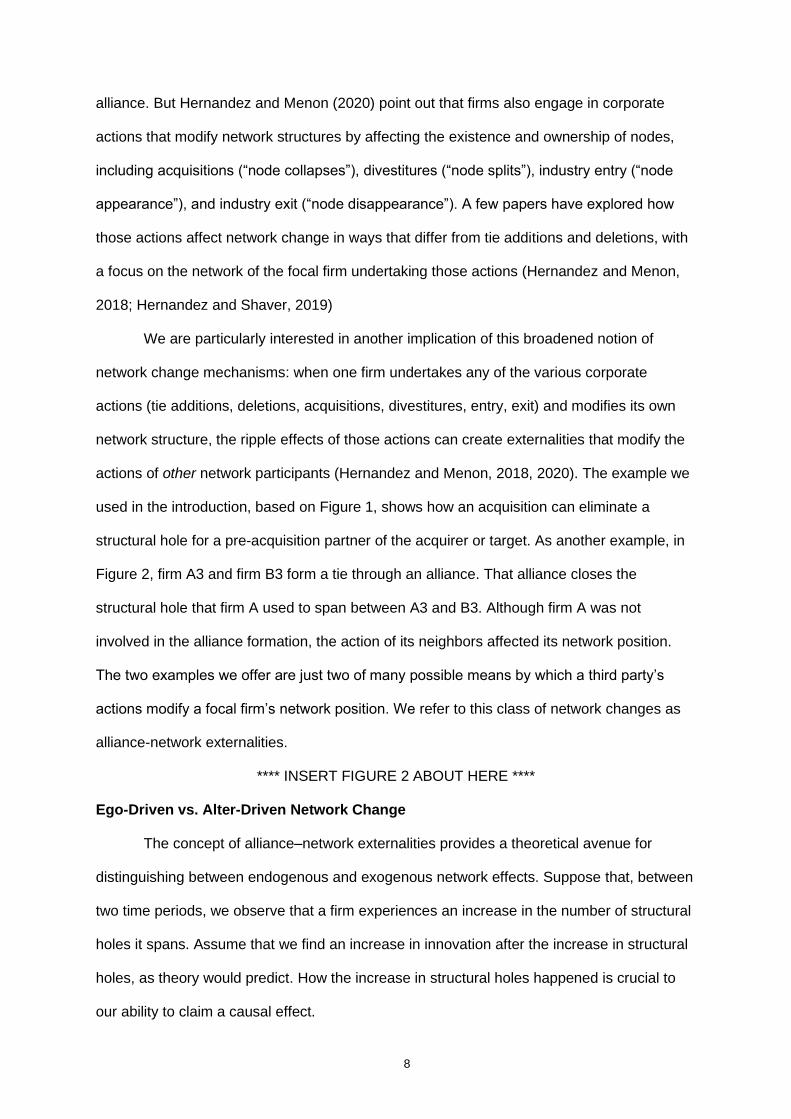
We are particularly interested in another implication of this broadened notion of
network change mechanisms: when one firm undertakes any of the various corporate
actions (tie additions, deletions, acquisitions, divestitures, entry, exit) and modifies its own
network structure, the ripple effects of those actions can create externalities that modify the
actions of other network participants (Hernandez and Menon, 2018, 2020). The example we
used in the introduction, based on Figure 1, shows how an acquisition can eliminate a
structural hole for a pre-acquisition partner of the acquirer or target. As another example, in
Figure 2, firm A3 and firm B3 form a tie through an alliance. That alliance closes the
structural hole that firm A used to span between A3 and B3. Although firm A was not
involved in the alliance formation, the action of its neighbors affected its network position.
The two examples we offer are just two of many possible means by which a third party’s
actions modify a focal firm’s network position. We refer to this class of network changes as
alliance-network externalities.
**** INSERT FIGURE 2 ABOUT HERE ****
Ego-Driven vs. Alter-Driven Network Change
The concept of alliance–network externalities provides a theoretical avenue for
distinguishing between endogenous and exogenous network effects. Suppose that, between
two time periods, we observe that a firm experiences an increase in the number of structural
holes it spans. Assume that we find an increase in innovation after the increase in structural
holes, as theory would predict. How the increase in structural holes happened is crucial to
our ability to claim a causal effect.
9
If the increase happened because of the firm’s own actions (say the firm established
a handful of new alliances or made an acquisition by which it inherited a few non-redundant
ties) it is difficult to isolate the intentions behind the alliance formation or the acquisition from
the overarching innovation goals and capabilities of the firm. Are we observing a selection
effect, where a firm with strong innovation capabilities engages in innovation-enhancing
partnerships or acquisitions and epiphenomenally ends up spanning structural holes? Or are
we witnessing a treatment effect where the increased structure holes caused the
improvement in innovation? This reflects that the network change is endogenously driven by
the focal firm.
In contrast, if the increase in structural holes was the result of another firm's actions
(e.g., the acquisition of a proximate firm in the network results in more structural holes for the
focal firm) we can plausibly claim to isolate a treatment effect of structural holes on
innovation. Namely, the change in network position is exogenous to the focal firm because it
is the choice of another actor in the network motivated by its strategic goals and not seeking
to benefit the focal actor’s network position.
We recognize that it is possible for network actors to undertake actions with the sole
purpose to put their competitors in less advantageous network positions. In this case, alter-
driven network change would not be exogenous. However, for this possibility to negate our
approach requires the assumptions that (a) firms’ primary motivation for acquisitions,
divestitures, and alliances is to harm their indirectly-connected rivals in the network—not to
benefit themselves; and (b) this occurs for the majority of network changes. We find it a
much more valid assumption that firms undertake the expense of an acquisition, divestiture,
or alliance with the primary purpose of enhancing its own innovation outcomes. As we
document shorty, the nature and direction of intentional versus unintentional network
changes in our data align with this assumption.
Alliance–network externalities thus provide a theoretical foundation to separate
intentional from unintentional network change. To state the point formally:

10
If a change in network position for a focal firm results from the focal firm’s own
actions, the impact of that change in network position on an outcome cannot be
attributed to a causal effect of network position. If a change in network position for a
focal firm results from the alliance–network externalities created by other firms’
actions, the impact of that change in network position on an outcome can be more
confidently attributed to a causal effect of the network position.
We now apply this insight to assess the relationship between structural holes and
innovation.2 To do so, we have to develop a novel research design, which we describe in the
next section.
RESEARCH DESIGN
General Approach
We undertake the following steps to empirically examine our proposition as it applies
to the relationship between structural holes and innovation. First, we replicate the analysis
reported in previous studies. The typical specification is a panel data analysis that regresses
patent outcomes on a measure of structural holes, with firm and year fixed effects. Second,
we go beyond current studies that focus exclusively on alliance formation or termination as
the main actions modifying the network structure; we include acquisitions and divestitures
into the construction of the network. Accounting for all possible network change mechanisms
allows us to develop a more precise measure of network position. Third, we relax the
assumption underlying the fixed effects model that unmeasured effects are constant over the
period of study by adopting a first-difference model. Fourth, we distinguish between
intentional and unintentional network change. We do so by categorizing the changes in
network position as being driven by one of three type of events: (1) only unintentional
change, (2) only intentional change, or (3) simultaneous change of both types. Lastly, we
employ an empirical specification that allows us to distinguish how each of the four
categories of change affects the relationship between structural holes and patenting
2 The concept of alliance-network externalities we advance in this paper differs from the notion of “secondhand brokerage” (Burt, 2007). We consider how the focal firm’s performance is affected by externally-driven changes in the structure of the ‘pipes’ in the network, whereas that work considers whether secondhand flows of resources from brokers benefit focal firm performance without any changes in the structure of the ‘pipes’.

11
outcomes. Before presenting theses analyses, we describe our data and explain how we
measure innovation and structural holes.
Empirical Setting and Data
We perform our analysis in the context of the life sciences (biotechnology) industry.
We chose this industry for the following reasons. Using a well-researched context in which
alliance networks are known to affect innovation (Sytch and Bubenzer, 2008) has
advantages when evaluating a novel analytical approach. The ability to replicate the results
of prior work before introducing anything new provides confidence that our findings are not
driven by an unusual setting. Our approach also requires accounting for multiple types of
corporation actions—alliances, acquisitions, divestitures, entries, and exits—and the life
sciences industry exhibits substantial corporate activity in all of them. In addition, alliance
networks play a crucial role in the innovation and performance outcomes of firms in this
industry because technological development is too complex for firms to go it alone (Baum,
Calabrese, and Silverman, 2000). Life sciences firms value innovation because it is directly
associated with performance, and they systematically file patents for any significant
innovation they create. This provides a measurable form of innovation output and allows us
to capture most firm innovations. Finally, excellent sources of data on firms networks,
corporate actions, and patents are available for this industry.
We construct the alliance network for the period spanning 1995-2007. We obtain
alliance data from the Recombinant Capital (Recap) database. Every entry in Recap is
defined by an agreement between two or more firms to cooperate on a life sciences activity.
The firms in the sample are small to medium biotechnology firms and large pharmaceutical
firms whose primary focus is on life sciences activities. We define an alliance as any form of
voluntary collaboration to exchange, share, or co-develop resources in which the two firms
remain independently owned (Gulati, 1998). We are interested in knowledge-related
collaborations that plausibly affect patentable innovations. Research shows that many kinds
of alliances help firms develop new knowledge, so we include various types of collaborations
(e.g. R&D, licensing, manufacturing, etc.) and drop those that clearly have no potential for

12
knowledge transfer (see Alcacer and Oxley, 2014). The eliminated deals include categories
such as asset purchases, loans, and settlements.
We identify 19,131 unique alliances initiated between 1991 and 2007 involving 7,910
unique firms. We assume that each alliance has a five-year lifespan, after which it is
terminated, consistent with prior research (e.g., Gulati, 1995; Stuart, 2000). To have a full
five-year alliance duration in our first year of observation, our sample begins in 1995 (with
alliances formed between 1991 and 1995). We then capture the alliance network in each
subsequent year through rolling 5-year windows. Our final year of observation for the
network is 2007 because we have Recap data only up until that year.
Although the network of interest is defined by alliance ties, a central aspect of our
research design is the fact that other corporate actions—acquisitions, divestitures, entries,
and exits—can restructure the network. Similar to prior work, we assume that firms enter or
exit the industry network based on their appearance and disappearance from the Recap
database. A firm enters the network in the first year in which it appears in Recap. If a firm
has not been active in Recap for 5 years, we consider that it is no longer active in the
alliance network, consistent with the assumption made in prior work.3 To account for
acquisitions and divestitures, we obtain data on those events from SDC Platinum for the
years 1995-2007. We explain later how we accounted for those events in the network.
We obtained data on firms’ patents from the USPTO’s PatentsView database.
Because we observe patenting outcomes in the 5-year period following the observation of
the alliance network, we gathered patent data for the years 1996-2012. For instance, if we
observe a firm’s network position in 2007, we capture the patenting outcomes for that firm
during 2008-2012—in line with prior research (e.g., Fleming, King, and Juda, 2007;
Balachandran and Hernandez, 2018).
3 We note that firms could still be active in the industry even if they are not actively involved in alliances, for example by engaging in internal R&D. A firm can re-enter the network if it establishes an alliance more than five years after its previous alliance in Recap, although this is very unusual in our data.
13
Measures
Innovation. We measure innovation using the two most common metrics in the
literature: patent counts and citation-weighted patent counts (e.g. Ahuja, 2000a; Sampson,
2007; Vasudeva, Zaheer, and Hernandez, 2013). We calculate patent counts by summing
the number of patent applications made during the five-year window after the focal year, as
explained above. Like all prior work in this area, we keep only patents that were eventually
granted, but we consider the year of application as the moment in which the invention was
created. We measure citation-weighted patent counts by weighting each patent by the
number of citations it receives during the five-year window following the application date
(e.g., Vasudeva, Zaheer, and Hernandez, 2013; Funk, 2014) and summing all the firms’
citation-weighted counts for the five-year period following the focal year.
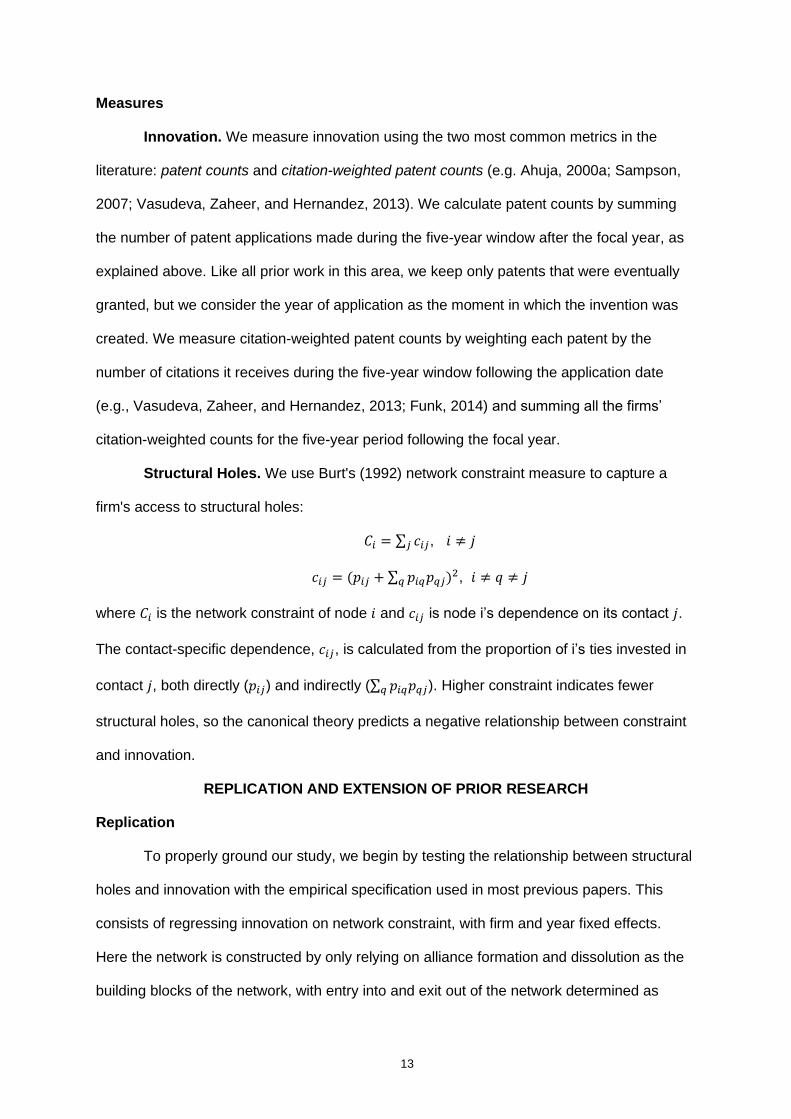
Structural Holes. We use Burt's (1992) network constraint measure to capture a
firm's access to structural holes:
𝐶𝑖 = ∑ 𝑐𝑖𝑗𝑗 , 𝑖 ≠ 𝑗
𝑐𝑖𝑗 = (𝑝𝑖𝑗 + ∑ 𝑝𝑖𝑞𝑝𝑞𝑗𝑞 )2, 𝑖 ≠ 𝑞 ≠ 𝑗
where 𝐶𝑖 is the network constraint of node 𝑖 and 𝑐𝑖𝑗 is node i’s dependence on its contact 𝑗.
The contact-specific dependence, 𝑐𝑖𝑗, is calculated from the proportion of i’s ties invested in
contact 𝑗, both directly (𝑝𝑖𝑗) and indirectly (∑ 𝑝𝑖𝑞𝑝𝑞𝑗𝑞 ). Higher constraint indicates fewer
structural holes, so the canonical theory predicts a negative relationship between constraint
and innovation.
REPLICATION AND EXTENSION OF PRIOR RESEARCH
Replication
To properly ground our study, we begin by testing the relationship between structural
holes and innovation with the empirical specification used in most previous papers. This
consists of regressing innovation on network constraint, with firm and year fixed effects.
Here the network is constructed by only relying on alliance formation and dissolution as the
building blocks of the network, with entry into and exit out of the network determined as
14
explained earlier. We do not yet account for the impact of acquisitions and divestitures on
the network. This is the typical setup in prior research, although some studies remove
acquired firms from the data altogether.
We will present our results in the main body of the paper without time-varying control
variables for simplicity of exposition. The findings and conclusions remain qualitatively
unchanged in models with several control variables, which we report in Appendix A3-1. (We
note that there is no clear agreement as to what control variables are essential, other than
including firm and year fixed effects, which we do in all specifications.)
Models 1 and 2 in Table 1 show the results. Model 1 presents the effect of structural
holes on patent counts. Model 2 shows the effect on citation-weighted patent counts. A one-
unit decline in network constraint is associated with an increase of about 2.7 patents and 8.1
citation-weighted patents. Both effects are statistically significant. These findings support the
canonical theory (Burt, 1992, 2004) and replicate prior empirical findings showing that
structural holes increase patenting.
**** INSERT TABLE 1 ABOUT HERE ****
Incorporating Acquisitions and Divestitures into the Network
As a second step, we account for acquisitions and divestitures as events that modify
the structure of the alliance network. This improves the precision with which network
structure is measured. To reflect the impact of acquisitions on the alliance network, we
generate a list of all the acquisitions made by firms in this industry during the relevant period
as recorded in SDC Platinum. We identify 1,387 acquisition deals during 1991-2007. With
that information, we “regenerate” the biotechnology alliance network in each period by
reassigning the alliances of the target firm to the acquiring firm for the remaining life of each
alliance during the post-acquisition period (see Hernandez and Shaver, 2019). The target
firm thus disappears from the network, but its alliances get reassigned to the acquirer.4 After
4 This procedure assumes that all alliances remain post-acquisition. It could be that an acquisition causes a subset of the alliances of a target firm to dissolve. Hernandez and Shaver (2019) find no evidence of post-acquisition loss of alliances in a smaller sample of deals from the same industry (life sciences) as in this study. Our anecdotal exploration of firms’ press releases suggests that many times firms have strong incentives to keep
15
regenerating the alliance network at the beginning of each year, we calculate network
constraint for every firm in the sample. Acquisitions can modify the ego networks of the
acquirer directly and, via alliance-network externalities, the ego networks of other firms in the
pre-acquisition network neighborhood of the acquirer and target. In any given year, many
acquisitions reshape the structure of the industry network. Thus, we are not able to attribute
the structural change experienced by a focal firm to a specific deal—we can only capture the
aggregate impact of all deals affecting a focal firm on its network position in any given year.
(This also happens when firms establish or end multiple alliances in the same year—the
change in structural position cannot be attributed to a single tie change.)
Divestitures represent a distinct form of network change, where one node splits into
two nodes and a fraction of the parent firm’s alliances may get reassigned to the newly
created firm (see Hernandez and Menon, 2020). Reflecting divestitures in the alliance
network is impossible in our case because we are not able to observe how the ties are re-
allocated between the split nodes. We decided to drop firms that experienced a divestiture to
lower the chance of measurement error. Doing so does not substantially modify the network
because divestitures were rare in the life sciences industry during our time frame. Between
1995 and 2007, only 34 firms experienced divestitures (more information is provided in
appendix A1). If a firm divested more than once, we dropped it in the year of its first
divestiture. This results in a relatively small loss of 100 firm-year observations.
After accounting for acquisitions and divestitures, we estimated the relationship
between structural holes and innovation using the typical fixed effects specification. Models
3 and 4 in Table1 present the results, with model 3 showing the effect on patent counts and
4 showing the effect on citation-weighted counts. The results are largely similar to those in
Models 1-2. A one-unit decline in network constraint is associated with an increase of about
target’s alliances because they are a source of synergy in acquisitions (e.g. PR Newswire, 2004). If any loss of alliances caused by acquisitions were randomly distributed throughout the industry, this would create noise but not bias in empirical estimates. If such a loss were systematically related to certain types of deals, this could imply bias in our estimates. However, the lack of information on the fate of alliances post-acquisition makes it hard to know how many alliances are lost or what may predict that loss.

16
2.6 patents and 6.9 citation-weighted patents. With more precise measurement, the
coefficients are slightly smaller than before but the effects remain statistically significant. The
effect size on patenting reduces by about 4 percent and of citation-weighed patents by about
15 percent.
First-difference analysis
Before delving into our approach to separate endogenous from exogenous effects,
we take one more step in the spirit of extending prior work by assessing if the main effect of
structural holes on innovation holds after adopting a more stringent specification. We adopt a
different panel estimator than the standard firm fixed effects specification. The fixed effects
estimator assumes that unobservable effects are constant (i.e., no serial correlation in the
error structure). We are concerned that this assumption may not hold in our data because
the duration of the panel is long (13 years, from 1995 to 2007) and the biotechnology
industry is fast-changing. It seems unrealistic to assume that firm-specific characteristics
stay the same for over a decade in this industry. Therefore, we adopt a first-difference
specification, where all the variables (dependent and independent) are subtracted from the
values of the previous year's observation. For example, constraint in year t+1 is subtracted
from constraint year t. Like the fixed-effect estimator, this model accounts for unobservable
firm effects, but it makes a less-restrictive assumption that changes in unobservable effects
follow a random walk (Wooldridge, 2012).
**** INSERT TABLE 2 ABOUT HERE ****
Table 2 shows the comparison between the first-difference model and the
conventional regression with firm fixed effects. Note that the sample size is a bit smaller
because the first year of observation is lost (subtracted away). We continue to find a
statistically significant negative effect of network constraint on the two patenting outcomes
(the statistical significance when estimating citation-weighted patent counts increases).
However, the magnitude of the coefficients is much smaller: about a quarter of the size for
patent counts and less than half the size for citation-weighted patent counts. The reduction
in effect sizes suggests that time-varying unobservable effects (not captured in the typical
17
fixed effects model) play an important role in determining how network positions affects
patent outcomes.
ENDOGENOUS VS. EXOGENOUS EFFECTS
Identifying alliance–network externalities
Our next step is to distinguish between instances of intentional and unintentional
changes in structural holes (constraint). Recall that we consider changes resulting from the
focal firm’s corporate activities as intentional, which we label as endogenous network
change. Such a change happens any time a firm’s network is modified by its own corporate
actions: its own alliance formation or dissolution or its own acquisitions (recall that we
dropped firms once they engaged in a divestiture). We categorize alliance dissolutions after
the assumed five-year lifespan as endogenous changes. We consider network changes
resulting from others’ actions as unintentional, which we label as exogenous network
change. Such a change happens any time a firm’s network is modified by the corporate
actions (alliance formation or dissolution or acquisitions) of third parties.
Knowing that a firm is affected by its own actions is straightforward. In contrast,
determining whether a firm was affected by another party’s actions is more complicated
because the magnitude of alliance–network externalities varies according to the proximity of
the focal firm to the parties involved in alliances or acquisitions. For instance, an acquisition
by a directly connected partner can cause a much greater change in the focal firm’s network
compared to an acquisition by a firm several degrees away in the network. The same is true
for the alliance formation or dissolution actions of others. Like with an earthquake, the
distance to the “epicenter” determines whether a firm is truly subject to an alliance-network
externality. Thus, we require some kind of rule to determine when a firm is subject to
network change driven by externalities.
Prior work shows that alliance-network externalities tend to be localized within the
focal firm’s network neighborhood (Hernandez and Menon, 2018, 2020). We thus follow the
rule that a firm’s structural position is significantly modified when it is within the reach of the
firm’s ego network: one degree of separation from a firm directly involved in an acquisition

18
(either the acquirer or the target) or a firm forming or terminating an alliance (to either of the
allying parties). This radius includes changes in the ties between the focal firm and its direct
partners as well as the ties among the focal firm’s partners (i.e. the ego network). We note
that the results are robust if we consider changes within two degrees from the focal firm.
Categorizing exogenous and endogenous network change. Ideally, we could
separate the portion of a focal firm’s ego network resulting from the firm’s own actions from
the portion resulting from others’ actions. But this is not feasible because we cannot identify
exactly which of the focal firms’ versus others’ actions lead to modifications in each
individual tie comprising the focal firm’s ego network. For example, when a firm experiences
both an endogenous and an exogenous change in a given year, (i.e., a focal firm and
proximate third parties initiate change), it is not possible to isolate the effect of each change.
We can determine, however, if the firm was subject to one of four mutually exclusive
and comprehensive categories in each year of observation: (1) exogenous change (affected
only by others’ actions), (2) endogenous change (affected only by the firm’s own actions), (3)
both exogenous and endogenous changes, or (4) no change or distant change (beyond the
focal firm’s ego network). We categorize each firm-year as falling into one of those four
conditions.
Table 3 shows the incidence of all four in our data. In all, 26,963 firm-year
observations involve exogenous change and 13,650 observations involve endogenous
change. There is a meaningful number of purely exogenous changes (14,012 or 44 percent
of all firm-year observations) in the data. While there are not many cases of purely
endogenous change (699 firm-years), we have a large number of cases of both endogenous
and exogenous change (12,951) which can be considered partially endogenous.
**** INSERT TABLE 3 AND FIGURES 4a-4c ABOUT HERE ****
Figures 4a-4c depict different network change categories from our data. In figure 4a,
we observe an instance of exogenous network change driven by other firms’ acquisitions
and alliances. Oxford Molecular, the focal firm, did not initiate any structure-modifying
actions between 1998-1999. However, two of its network neighbors did: Polymasc merged
19
with Valentis, while Celltech established a pair of new alliances. As a result, Oxford
Molecular’s network constraint decreased through no action of its own.
Figure 4b shows how a sequence of alter-initiated alliance changes can both
increase and decrease constraint. Between 2002 and 2003, two of Lifespan Biosciences
partners ended their alliance, increasing the structural holes of Lifespan. A year later, two of
its other partners formed a tie with each other, decreasing Lifespan’s structural holes.
Finally, figure 4c illustrates a case of purely endogenous change for Watson
Pharmaceuticals between 1996 and 1997. Watson began the period as a highly
disconnected firm, on the periphery of a cluster controlled by firm #45. By undertaking two
acquisitions and initiating two alliances, Watson put itself in the center of an impressive
network spanning three distinct clusters in the alliance network.
We are concerned that purely exogenous network changes might be small in
magnitude, making it difficult to find effects in empirical tests. It is not necessary that
endogenous and exogenous network changes be similar in magnitude. Sufficient for our
purposes is that meaningful variance exists across both types for empirical testing to be
feasible. Table 4 shows that both purely endogenous and purely exogenous events produce
variance in network constraint from year to year. Unsurprisingly, endogenous actions (i.e.,
firms’ own alliances and acquisitions) create larger average changes in constraint than
exogenous actions. Nevertheless, the variance in changes produced by exogenous actions
is larger than the variance produced by endogenous actions. The mean magnitude of
exogenous change in constraint is very small because about 98 percent of these cases
experience no change (zero) from year to year. This is because we include all the network
neighbors of alliance and acquisition participants in the “exogenous change” category, yet
many of these neighbors do not experience actual changes in their networks. Table 4,
therefore, shows the descriptive statistics for cases of non-zero change. As before, the mean
of endogenous change is larger, but the variance of exogenous change is greater than that
of endogenous change. The no change condition exhibits zero variance for obvious reasons.
**** INSERT TABLE 4 ABOUT HERE ****
20
We also investigate the distribution of non-zero changes caused by endogenous and
exogenous change, shown in Figure 3. The endogenous constraint changes are mostly
negative. This reflects that firms initiating network changes tend put themselves in positions
to span more structural holes (recall that lower constraint = more structural holes), which
according to theory is beneficial. In contrast, network changes initiated by other firms cluster
around zero, suggesting that they do not systematically benefit or harm a focal firm’s
network structure..
In concert, these descriptive statistics are consistent with our assumption that
network changes are not primarily and predominantly driven to affect other firms’ network
positions (i.e., they are exogenous with respect to other firms). This is manifest by (a) the
magnitude of endogenous change being larger than the magnitude of exogenous change;
(b) the vast majority of endogenous changes putting the focal firm in a position of accessing
more structural holes (i.e., almost all observations of change in closure are negative); and (c)
the exogenous changes almost equally putting firms in positions of accessing more or fewer
structural holes (i.e., the distribution is centered close to zero).
**** INSERT FIGURE 3 ABOUT HERE ****
Effects of Endogenous vs. Exogenous Change in Network Constraint on Innovation
First-difference estimation. The structure of our data is not suited for a
conventional OLS regression with firm fixed effects because firms switch network change
categories frequently from year to year (see appendix A2). Recall that a typical fixed effects
specification subtracts the within-firm mean of each variable from each year’s observation.
When firms change categories over time, a traditional firm fixed-effect model is inappropriate
because the deviation from the within-firm “mean” makes little sense. There is no mean time
trend in the category of network change for any firm, and therefore the firm fixed-effect would
vary across the categories. Further, our tests require the use of interaction terms, and
conventional fixed-effect estimates capture between-firm variance (rather than within-firm
variance) when estimating interaction coefficients—undermining the very purpose of
employing a fixed-effect estimator (Shaver, 2019).

21
To get around these limitations, we build on the first-difference estimator we
introduced previously. The first-difference approach addresses the issue of firms switching
across conditions. Because it accounts for year-over-year differences, it does not require a
firm to continuously experience one type of “average” change category over the duration of
the panel (i.e. categories can be “turned on” or “turned off” from one year to the next). In
addition, the problem of the interaction term not strictly capturing within-firm variation is not a
concern with the first-difference specification, accurately allowing within-firm variation when
estimating interaction coefficients. And as already noted, the first-difference model has a
less restrictive assumption with respect to how unobservable effects might change over the
panel compared to the fixed-effect model.
Results. We now test our main proposition using the first-difference estimator. We
first isolate the effect of the observations with purely exogenous change by interacting
∆network constraint with the dummy variable only exogenous. This offers the best insight
into the causal effect of network constraint on innovation because it is unlikely to be
confounded with focal firm factors that initiate change. We then code a dummy variable
labeled “non-exogenous” to indicate all other quadrants in Table 3, and interact that with
∆network constraint to capture the effect of network change in all other conditions. This
coefficients cannot be interpreted as causal because of the potential for confounding
factors.5
**** INSERT TABLE 5 ABOUT HERE ****
Table 5 presents the results. Contrary to the findings reported in Table 2, the results
in Table 5 demonstrate that the effect of ∆network constraint for exogenously initiated
network changes does not test different from zero for either of the two innovation measures.
Moreover, the coefficient estimate is positive for patent count—contrary to the canonical
theoretical expectation.
5 This approach categorizes ∆network constraint into mutually exclusive and cumulatively exhaustive categories. As a result, the interaction is not a slope-shifter and does not require that we add the ‘main effect’ in the specification.

22
We find that ∆network constraint exhibits a negative and statistically significant effect
on innovation for the non-exogenous changes. A non-exogenous unit decline of network
constraint is associated with an increase of about 0.55 patents and 2.6 citation-weighted
patents. Thus, the results reported in Table 2 reflect the changes to network constraint
initiated by the focal firm. This suggest that the beneficial effect of structural holes on
innovation is not causal.
To further assess this result, Table 6 breaks down the non-exogenous change
category into its components. We examine the effect of ∆network constraint interacted with
only exogenous, only endogenous, and both exogenous and endogenous conditions.
Observations with no change in network constraint are dropped because there is no
variation in this group (i.e., all have zero values). The results in Table 6 are consistent with
those in Table 5. Exogenously initiated ∆network constraint does not test different from zero,
and the sign of the estimate is positive for patent count. ∆network constraint exhibits a
statistically significant negative effect on innovation under purely endogenous network
change: a unit decline of network constraint is associated with an increase of about 0.8
patents and 6.9 citation-weighted patents. The effect is also negative and significant when
network change is driven by both exogenous and endogenous actions: a unit decline of
network constraint in this condition is associated with an increase of about 0.54 patents (p <
0.01) and 2.1 citation-weighted patents (p < 0.05). These results reinforce the interpretation
that the effect of network change is not causal.
We also conduct a number of sensitivity analyses. First, we run the same models
including the firms that went through divestitures (recall that divested firms were previously
dropped in the main analysis; see Appendix A3-2). The results remain robust with the added
observations. Second, we use alternative windows of observation for the dependent
variables (see Appendix A3-3). Patent counts and citation-weighted patent counts are
aggregated during three- and four-year windows instead of five-year windows. The results
remain robust for ∆network constraint*only exogenous in both the four-year and three-year
windows.

23
INTERPRETATION AND IMPLICATIONS
Our findings show that exogenous change to a firm’s network does not affect patent
outcomes; therefore, we conclude that network position, per se, does not affect innovation.
Nevertheless, we replicate existing findings showing that network position correlates with
patent outcomes for the overall sample and for situations involving endogenous changes in
network position. Combining these sets of findings lead to two possible interpretations: (a)
network effects are spurious or (b) network effects exist, but only in concert with other
attributes or actions. After describing these interpretations, we discuss how they help shape
directions for future research.
Network effects are spurious
This interpretation reflects the possibility that network position captures the attributes
of firms or dyads in those positions, and these attributes—which are not fully controlled for in
empirical tests—affect innovation outcomes. In other words, the specification of empirical
tests in the literature is susceptible to omitted variable biases (e.g., Shaver, 1998), and the
body of findings reflect this bias.
This is a plausible explanation because extant research provides evidence that many
firm and dyad attributes correlate with innovation outcomes. Firm-level factors include
capabilities or resources that enable innovation (e.g. Rothaermel and Hess, 2007), which by
their nature are hard to measure (e.g. Godfrey and Hill, 1995). Dyadic factors include
partner-specific factors such as trust, absorptive capacity, or routines that play an important
role in the benefits that firms get out of alliances (e.g. Dyer and Singh, 1998; Dyer, Singh,
and Hesterly, 2018). Likewise, a growing stream of research considers alliances as a
matching process (e.g. Mindruta, 2013; Mindruta, Moeen, and Agarwal, 2016; Fudge Kamal,
Honore, and Nistor, 2020) and this implies that capabilities among alliance participants tend
to be complementary (e.g., Nakamura, Shaver, and Yeung, 1996). Therefore, the interaction
of alliance partner characteristics, which are difficult to isolate and measure, could be
important unobserved factors. Moreover, the set of factors we just listed is unlikely to be
exhaustive, suggesting that other attributes can also affect innovation.
24
Additional evidence that unmeasured effects play and important role for innovation
outcomes comes from current tests that employ panel data and firm fixed effects. In these
studies, the fixed effects often test significant, which indicates the presence of constant
unobserved firm attributes. When we relax the assumption that unobserved firm attributes
are constant over the panel in our study (i.e., when we move from the fixed effect
specification to first difference model), we find the magnitude of the network effect reduces
by 75% for patent count and 60% for citation-weighted patent count. This suggests that the
unobserved attributes that correlate with innovation change over time, and studies that
control for them with firm fixed effects do not fully capture these effects.
Network effects exist but only in concert with other attributes or actions
The other potential interpretation is that network position does affect innovation
outcomes; however, this effect only occurs in concert with specific firm or dyadic attributes or
requires particular firm actions. This is consistent with our interpretation that network
position, per se, does not affect innovative outcomes. But rather than concluding that
network effects do not exist at all, it suggests that network effects require some additional
factor in order to be activated (c.f. Smith, Menon, and Thompson, 2012). Although
functionally similar, we separate attributes from actions in the following discussion.
Attributes. This interpretation is that network position affects innovation outcomes
but only in combination with firm or dyad characteristics that are not measured in current
empirical analyses and that also influence network position. In other words, there is a
(theoretical) interaction between an empirically unobserved attribute that leads to network
position and network position.
For example, consider a firm on the verge of a technical breakthrough in drug
development. This firm might be more willing to engage in alliances to leverage this
emerging capability, and potential alliance partners could be more willing to ally with the firm
due to its emerging capability. Once allied, because of its that capability, the firm might be
better able to leverage its brokerage position so as to combine information from other firms’
innovation efforts with its emerging capability. This scenario, and other parallel scenarios,

25
would lead to the results that we demonstrate.
Because this is an emerging technology, it would not be possible to measure with
typical patent-based measures. Because it is a change in capability, it would not be
controlled for by a firm fixed effect. Because it leads to increased likelihood of alliances
(modifying the motivation of the focal firm and its attractiveness to potential partners), the
emerging capability would correlate with changes in alliance activity in such a way that our
first-difference approach would not condition-out. However, rather than just reflecting a
spurious effect, the emergent capability is what allows the firm to leverage its brokerage
position.
We recognize that the existing literature hypothesizes and tests firm contingencies
that enhance network positions, of which we highlight a few. One of those contingencies is
the firm’s absorptive capacity, which reflects underlying capabilities (Shipilov, 2009). Other
studies highlight the moderating effect of dyadic or relational attributes, such as relative
bargaining power (Bae and Gargiulo, 2004; Shipilov, 2009), relative knowledge composition
(Phelps, 2010; Ter Wal et al., 2016), and tie strength (Burt, 2000; Tiwana, 2008). Yet other
work focuses on macro-level factors, such as the institutions in which the actors are
embedded (Lin et al., 2009; Ma, Huang, and Shenkar, 2011; Vasudeva, Zaheer, and
Hernandez, 2013). Although the contingency approach to studying network effects is
conceptually similar to what we describe, findings from these studies do not necessarily
provide evidence for the joint effect of position and attribute. Their empirical approach is to
interact a firm attribute with network position. However, that approach can capture an
interaction between the measured attribute and an unobserved effect that leads to network
position, rather than an interaction between the firm attribute and network position. For
example, if firms with emerging capabilities are more likely to have favorable network
positions, then any of the aforementioned studies might demonstrate an interaction with
emerging capabilities rather than network position.
Actions. This interpretation is that, in addition to being in a favorable network
position, a firm must purposefully engage in certain actions to take advantage of that
26
position. In other words, there is an interaction between network position and unobserved
actions of firms required to leverage that position.
For example, in order to benefit from an advantageous brokerage position, a firm
must undertake a number of internal processes. It must move appropriate personnel into
positions where they can interact with alliance partners and leverage their expertise with the
novel information. It must provide these individuals time and resources to assess and
integrate into the firm the novel information that they are exposed to. And it must leverage an
organizational design that facilitates knowledge transfer and recombination within the firm.
Therefore, network position alone is not beneficial. It must be combined with managerial
actions and organizational processes within the firm.
This scenario, and other parallel scenarios, would lead to the result that we
demonstrate: that network effects are significant only in cases where firms self-initiate the
corporate actions that produce changes in the network structure. While difficult to observe,
firms that purposely put themselves into advantageous network positions are also likely
engage in these internal processes to leverage their network positions. In contrast, firms
exogenously thrust into advantageous network positions are unlikely to initiate the required
internal processes. Therefore, they do not benefit from these favorable network positions.
Some prior work provides hints about the importance of such internal processes and
tries to identify them. Tiwana (2008) finds that the effects of bridging and strong ties on
performance are mediated by the knowledge integration process, defined as "the process of
jointly applying specialized knowledge held by various alliance partners at the project level”
(Tiwana, 2008: 255). Studies on alliance management capability also hint at the value of
internal organizational design processes in realizing the advantage of network position. For
instance, Kale, Dyer, and Singh (2002) argue that a dedicated alliance function enhances a
firm’s ability to strategically capture alliance-related knowledge. Such work is useful in
suggesting processes that are measurable, though many of the underlying actions that help
activate network benefits are likely to be unobservable. We should note that, as with
measures for attributes, interacting measures of processes with network position might

27
capture interactions with the unobserved effects that lead to network positions.
Implications for advancing future research
Our findings cannot distinguish between the possibility that the effect of network
position on innovation is spurious or that network position aids innovation only in concert
with other attributes or actions. However, identifying these two possibilities has direct
implications for how to advance future research.
First, consider the interpretation that the effect is spurious. This conclusion is a null
hypotheses (i.e., network position does not lead to increased innovation); therefore, it would
not make sense to advance additional testing strategies for this interpretation. Nevertheless,
this interpretation points to benefits of further understanding and empirically identifying what
determines network structure. For scholars interested in innovation outcomes (or in the
outcomes of network position more generally), further theoretical and empirical efforts to
identify what are currently unobserved or unknown network antecedents is a fruitful line of
inquiry (Ahuja, Soda, and Zaheer, 2012). This is because identifying such factors allows us
to better understand the determinants of innovation outcomes. This knowledge can have
important implications for firm strategies and policy considerations.
Second, consider the interpretation that network position aids innovation only in
concert with other attributes or actions. To further investigate if this is the correct
interpretation requires refinements and advances in both theory and research design.
Turning first to theory, advancing this interpretation requires building theory that
logically derives what these attributes or actions might be. Moreover, such a theory would
specify that these attributes or actions are conceptually distinct from network position. This is
because the theoretical reasoning would have to advance why these attributes or actions
work in concert with network position. Inasmuch as extant network theories include attributes
or processes, they often argue that network positions embody these attributes or actions
(e.g., structural holes capture brokerage). This does not satisfy the nature of the theoretical
relationship our results suggest might exist.
While this point is more general, we return to the working example of the relationship

28
between structural holes and innovation to further highlight the issue. A careful reading of
Burt’s formulations of the theory (particularly the 1992 book and the 2004 study of “Structural
Holes and Good Ideas”) makes it clear that structural explanations are inseparably paired
with certain attributes of and actions by the individuals who end up in brokerage positions.
For example, Burt is explicit about brokers having a “tertius gaudens” behavioral orientation
that leads them to consciously seek for personal benefits from their position (1992: 30-32)
(Obstfeld, 2005 suggests the “tertius iungens” as a different behavioral orientation for
brokers). Moreover, Burt discusses “the issue of motivation” by arguing that at least some
brokerage benefits “require an active hand” and that “a player can respond in ways ranging
from fully developing the [brokerage] opportunity to ignoring it” (1992:34). Burt’s solution to
the issue is “to leap over the motivation issue by taking the network as simultaneously an
indicator of entrepreneurial opportunity and of motivation” (1992: 35). Years later,
commenting on the many empirical studies showing an association between brokerage and
performance benefits, Burt said that “evidence on the mechanism is not abundant” and,
intriguingly, suggested that “the association cannot be causal. Networks do not act, they are
context for action” (2004: 354, emphasis added). Burt then lays out his theory linking
structural holes to good ideas, which upon careful reading includes not just structural
mechanisms but also specifications of the attributes and behaviors of brokers.
Putting aside the issue of whether Burt’s motivational and behavioral assumptions
are correct, it should be evident that the original formulation of the theory of structural holes
is not purely structural. However, when imported to organizational-level contexts, the
emphasis of research on structural holes was initially almost exclusively on structural
explanations. Subsequently, scholars began probing certain contingencies or interaction
effects (as we noted above). But there is a difference between arguing for an interaction
effect, which keeps the structural theory intact, and incorporating a certain attribute or action
as a factor directly into the core theory relating structure to innovation. Therefore, scholars
need to be clearer about what attributes or processes (at the firm or dyadic level) are
necessary and sufficient for network position to affect firm-level outcomes. This has to do

29
with how we develop network theory.
Refining or advancing theory in this manner also has profound implications for
testing—especially research design requirements. A good test of a theory with this structure
requires that we (a) invoke variance in network position, (b) independently invoke variance in
the attribute or action, and (c) ensure that the ways in which we invoke variance does not
simultaneously invoke variance in other factors that might affect the innovation.
The approach we take in this paper identifies a way to invoke variance in network
position that is exogenous to the focal firm (a and c). Therefore, building from our approach
provides the foundation for good test. What is further required are ways to measure the
underlying attribute or action advanced by theory development; and finding a way to invoke
variance in the measure without invoking variance in network position (b and c). In other
words, if this measure and network position always move together, then it will be difficult to
test the interpretation that the outcomes of network position are activated when paired with
an attribute or action. Finally, it will be important to find ways to invoke variance in the
measure to mitigate the likelihood it captures other factors that affect innovation (i.e., the
standard endogeneity concern).
CONCLUSION
We assess if the relationship between network closure and innovation, documented
in many empirical studies, is causal. Building from the concept of alliance-network
externalities, we develop a research design to isolate instances of exogenous network
change. Although we replicate existing findings documenting the relationship between
network closure and innovation, that effect does not exist for exogenous network change.
Therefore, we cannot conclude that existing evidence demonstrates a causal effect of
network structure on firm innovation.
Reconciling this finding with previous findings suggests two possibilities. First,
demonstrated network effects are spurious and reflect factors that allow firms to obtain
desirable network positions. Second, network effects exist; however, they require a firm
attribute or action that is not measured in current empirical work in order to be activated.

30
Based on these interpretations, we suggest directions for future theoretical and empirical
work to advance the literature.
We recognize that the theoretical and testing requirements we present are
demanding. Nevertheless, the study of interorganizational networks has matured to a point
where advancing theory and testing in this manner is warranted. Moreover, advances in this
manner are consistent with recent trends of focusing on causal identification of theories
across social science disciplines.

31
REFERENCES
Ahuja, G. 2000a “Collaboration networks, structural holes, and innovation: A longitudinal study.” Administrative Science Quarterly, 45: 425-455. Ahuja, G. 2000b “The duality of collaboration: Inducements and opportunities in the formation of interfirm linkages.” Strategic Management Journal, 21: 317-343. Ahuja, G., G. Soda, and A. Zaheer. 2012 “The genesis and dynamics of organizational networks.” Organization Science, 23: 434-448. Alcacer, J., and J. Oxley 2014 “Learning by supplying.” Strategic Management Journal, 35: 204-223. Anand, B. N., and T. Khanna 2000 “Do firms learn to create value? The case of alliances.” Strategic Management Journal, 21: 295-315. Angrist, J, D., and J. S. Pischke 2008 Mostly Harmless Econometrics: An Empiricist’s Companion. Princeton, NJ: Princeton University Press. Aral, S., and M. Van Alstyne 2011 “The diversity-bandwidth trade-off.” American Journal of Sociology, 117: 90-171. Bae, J., and M. Gargiulo 2004 “Partner substitutability, alliance network structure, and firm profitability in the telecommunications industry.” Academy of Management Journal, 47: 843-859. Balachandran, S., and E. Hernandez 2018 “Networks and innovation: Accounting for structural and institutional sources of recombination in brokerage triads.” Organization Science, 29: 80-99. Baum, J. A., T. Calabrese, and B. S. Silverman 2000 “Don't go it alone: Alliance network composition and startups' performance in Canadian biotechnology.” Strategic Management Journal, 21: 267-294. Blau, P. M. 1977 Inequality and Heterogeneity: A Primitive Theory of Social Structure. New York, NY: Free Press. Burt, R. S. 1992 Structural Holes. Cambridge, MA: Harvard University Press. Burt, R. S. 2000 “The network structure of social capital.” Research in Organizational Behavior, 22: 345-423. Burt, R. S. 2004 “Structural holes and good ideas.” American Journal of Sociology, 110: 349-399. Burt, R. S.

32
2007 “Secondhand brokerage: Evidence on the importance of local structure for managers, bankers, and analysts.” Academy of Management Journal, 50: 119-148. Cohen, W. M., and D. A. Levinthal 1990 “Absorptive capacity: A new perspective on learning and innovation.” Administrative Science Quarterly, 35: 128–152. Dyer J. H., and H. Singh 1998 “The relational view: Cooperative strategy and sources of interorganizational competitive advantage.” Academy of Management Review, 23: 660-679. Dyer, J. H., H. Singh, and W. S. Hesterly 2018 “The relational view revisited: A dynamic perspective on value creation and value capture.” Strategic Management Journal, 39: 3140-3162. Eisenhardt, K. M., and C. B. Schoonhoven 1996 “Resource-based view of strategic alliance formation: Strategic and social effects in entrepreneurial firms.” Organization Science, 7: 136-150. Fleming, L. 2001 “Recombinant uncertainty in technological search.” Management Science, 47: 117-132. Fleming, L., C. King III, and A. I. Juda 2007 “Small worlds and regional innovation.” Organization Science, 18: 938-954. Fleming, L., S. Mingo, and D. Chen 2007 “Collaborative brokerage, generative creativity, and creative success.” Administrative Science Quarterly, 52: 443-475. Fudge Kamal, D., F. Honore, and C. Nistor 2020 “When the weak are mighty: A two-sided matching approach to alliance performance outcome.” Working paper. https://dx.doi.org/10.2139/ssrn.2826704. Funk, R. J. 2014 “Making the most of where you are: Geography, networks, and innovation in organizations.” Academy of Management Journal, 57: 193-222 Godfrey, P. C., and C. W. Hill 1995 “The problem of unobservables in strategic management research.” Strategic Management Journal, 16: 519-533. Gulati, R. 1995 “Social structure and alliance formation patterns: A longitudinal analysis.” Administrative Science Quarterly, 40: 619-652. Gulati, R. 1998 “Alliances and networks.” Strategic Management Journal, 19: 293-317. Guler, I., and A. Nerkar 2012 “The impact of global and local cohesion on innovation in the pharmaceutical industry.” Strategic Management Journal, 33: 535-549. Hernandez, E., and A. Menon

33
2018 “Acquisitions, node collapse, and network revolution.” Management Science, 64: 1652-1671. Hernandez, E., and A. Menon 2020 “Corporate strategy and network change.” Academy of Management Review (forthcoming), published online ahead of print. https://doi.org/10.5465/amr.2018.0013.
Hernandez, E., and J. M. Shaver 2019 “Network synergy.” Administrative Science Quarterly, 64: 171-202. Jaffe, A. B. 1986 “Technological opportunity and spillovers of R&D: Evidence from firms’ patents, profits, and market value.” American Economic Review, 76: 984–1001. Kale, P., J. H. Dyer, and H. Singh 2002 “Alliance capability, stock market response, and long‐term alliance success: the role of the alliance function.” Strategic Management Journal, 23: 747-767. Kumar, P., and A. Zaheer 2019 “Ego-network stability and innovation in alliances.” Academy of Management Journal, 62: 691-716. Lin, Z., M. W. Peng, H. Yang, and S. L. Sun 2009 “How do networks and learning drive M&As? An institutional comparison between China and the United States.” Strategic Management Journal, 30: 1113-1132. Ma, R., Y. C. Huang, and O. Shenkar 2011 “Social networks and opportunity recognition: A cultural comparison between Taiwan and the United States.” Strategic Management Journal, 32: 1183-1205. Mindruta, D. 2013 “Value creation in university‐firm research collaborations: A matching approach.” Strategic Management Journal, 34: 644-665. Mindruta, D., M. Moeen, and R. Agarwal 2016 “A two‐sided matching approach for partner selection and assessing complementarities in partners' attributes in inter‐firm alliances.” Strategic Management Journal, 37: 206-231. Nakamura, M., J. M. Shaver, and B. Yeung 1996 “An empirical investigation of joint venture dynamics: Evidence from US-Japan joint ventures.” International Journal of Industrial Organization, 14: 521-541. Obstfeld, D. 2005 “Social networks, the tertius iungens orientation, and involvement in innovation.” Administrative Science Quarterly, 50: 100-130. Pearl, J., and D. Mackenzie 2018 The Book of Why: The New Science of Cause and Effect. New York: Basic Books. Phelps, C. C. 2010 “A longitudinal study of the influence of alliance network structure and composition on firm exploratory innovation.” Academy of Management Journal, 53: 890-913. Phelps, C. C., R. Heidl, and A. Wadhwa

34
2012 “Knowledge, networks, and knowledge networks: A review and research agenda.” Journal of Management, 38: 1115-1166. Rothaermel, F. T, and A. M. Hess 2007 “Building dynamic capabilities: Innovation driven by individual-, firm-, and network-level effects.” Organization Science, 18: 898-921. Salancik, G. R. 1995 “Wanted: A good network theory of organization.” Administrative Science Quarterly, 40: 345–349. Sampson, R. C. 2007 “R&D alliances and firm performance: The impact of technological diversity and alliance organization on innovation.” Academy of Management Journal, 50: 364-386. Shaver, J. M. 1998 “Accounting for endogeneity when assessing strategy performance: Does entry mode choice affect FDI survival?” Management Science, 44: 571-585. Shaver, J. M. 2019 “Interpreting interactions in linear fixed-effect regression models: When fixed-effect estimates are no longer within-effects.” Strategy Science, 4: 25-40. Shaver, J. M. 2020 “Causal identification through a cumulative body of research in the study of strategy and organizations.” Journal of Management, 46: 1244-1256. Shipilov, A. V. 2009 “Firm scope experience, historic multimarket contact with partners, centrality, and the relationship between structural holes and performance.” Organization Science, 20: 85-106. Smith, E. B., T. Menon, and L. Thompson 2012 “Status differences in the cognitive activation of social networks.” Organization Science, 23: 67-82. Soda, G., A. Usai, and A. Zaheer 2004 “Network memory: The influence of past and current networks on performance.” Academy of Management Journal, 47: 893-906. Soh, P. H. 2010 “Network patterns and competitive advantage before the emergence of a dominant design.” Strategic Management Journal, 31: 438-461. Stuart, T. E. 2000 “Interorganizational alliances and the performance of firms: a study of growth and innovation rates in a high‐technology industry.” Strategic Management Journal, 21: 791-811. Sytch, M., and P. Bubenzer 2008 “Research on Strategic Alliances in Biotechnology: An Assessment and Review.” In H. Patzelt and D. T. Brenner (eds.), Handbook of Bioentrepreneurship, International Handbook Series on Entrepreneurship: 105–131. New York, NY: Springer. Tatarynowicz, A., M. Sytch, and R. Gulati

35
2016 “Environmental demands and the emergence of social structure: Technological dynamism and interorganizational network forms.” Administrative Science Quarterly, 61: 52-86. Ter Wal, A. L., O. Alexy, J. Block, and P.G. Sandner 2016 “The best of both worlds: The benefits of open-specialized and closed-diverse syndication networks for new ventures’ success.” Administrative Science Quarterly, 61: 393-432. Tiwana, A. 2008 “Do bridging ties complement strong ties? An empirical examination of alliance ambidexterity.” Strategic Management Journal, 29: 251-272. Vasudeva, G., A. Zaheer, and E. Hernandez 2013 “The embeddedness of networks: Institutions, structural holes, and innovativeness in the fuel cell industry.” Organization Science, 24: 645-663. Wang, C., S. Rodan, M. Fruin, and X. Xu 2014 “Knowledge networks, collaboration networks, and exploratory innovation.” Academy of Management Journal, 57: 484-514. Wooldridge, J. M. 2012 Introductory Econometrics: A Modern Approach. Boston, MA: Cengage Learning. Zaheer, A., and G. Soda 2009 “Network evolution: The origins of structural holes.” Administrative Science Quarterly, 54: 1-31.
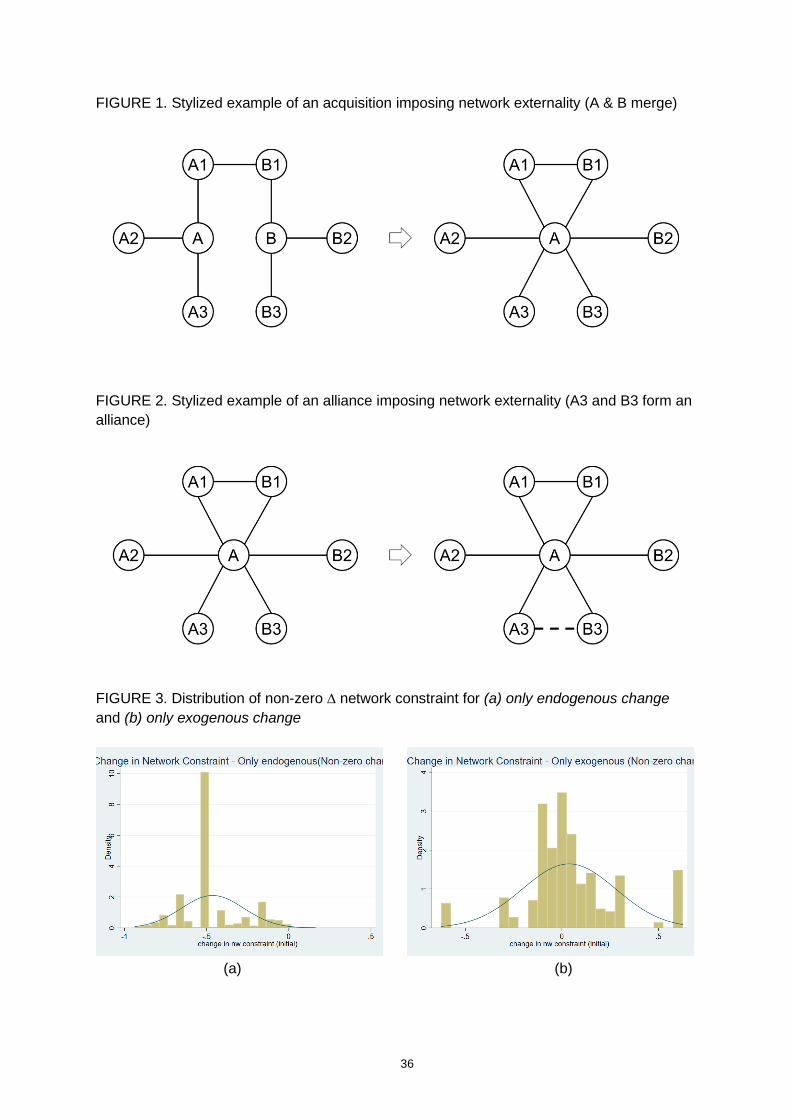
36
FIGURE 1. Stylized example of an acquisition imposing network externality (A & B merge)
FIGURE 2. Stylized example of an alliance imposing network externality (A3 and B3 form an
alliance)
FIGURE 3. Distribution of non-zero ∆ network constraint for (a) only endogenous change
and (b) only exogenous change
(a) (b)
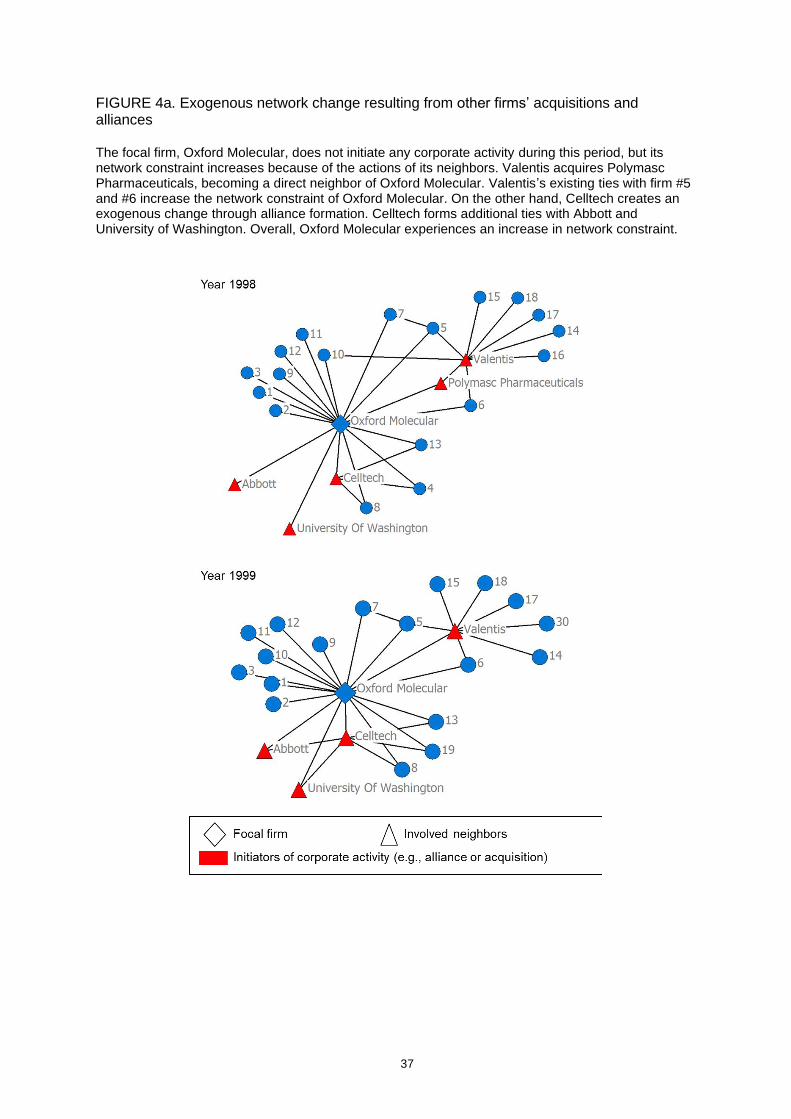
37
FIGURE 4a. Exogenous network change resulting from other firms’ acquisitions and alliances The focal firm, Oxford Molecular, does not initiate any corporate activity during this period, but its network constraint increases because of the actions of its neighbors. Valentis acquires Polymasc Pharmaceuticals, becoming a direct neighbor of Oxford Molecular. Valentis’s existing ties with firm #5 and #6 increase the network constraint of Oxford Molecular. On the other hand, Celltech creates an exogenous change through alliance formation. Celltech forms additional ties with Abbott and University of Washington. Overall, Oxford Molecular experiences an increase in network constraint.
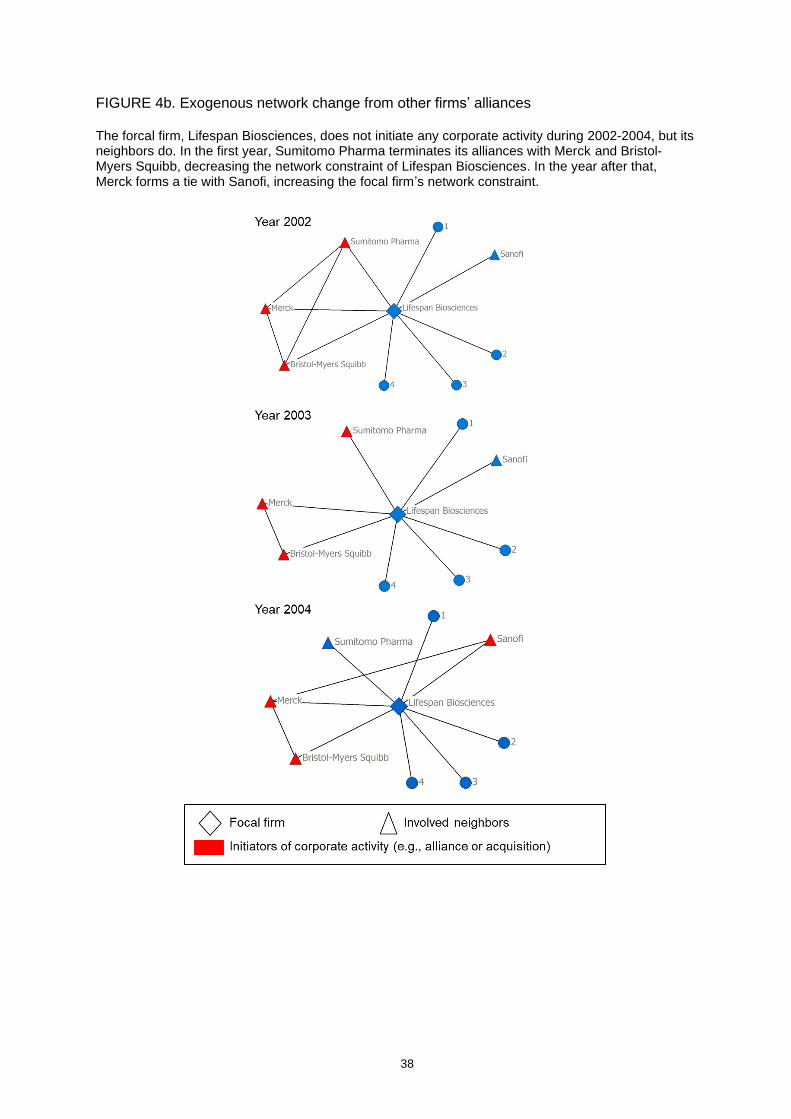
38
FIGURE 4b. Exogenous network change from other firms’ alliances The forcal firm, Lifespan Biosciences, does not initiate any corporate activity during 2002-2004, but its neighbors do. In the first year, Sumitomo Pharma terminates its alliances with Merck and Bristol-Myers Squibb, decreasing the network constraint of Lifespan Biosciences. In the year after that, Merck forms a tie with Sanofi, increasing the focal firm’s network constraint.
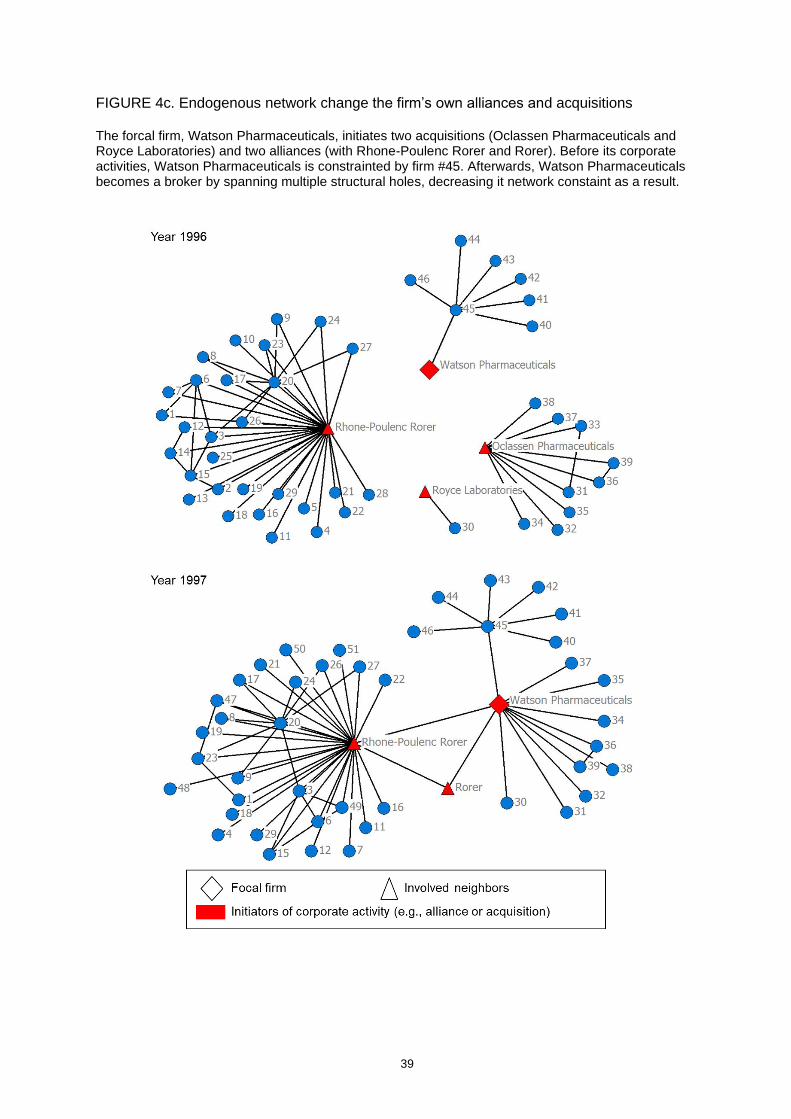
39
FIGURE 4c. Endogenous network change the firm’s own alliances and acquisitions The forcal firm, Watson Pharmaceuticals, initiates two acquisitions (Oclassen Pharmaceuticals and Royce Laboratories) and two alliances (with Rhone-Poulenc Rorer and Rorer). Before its corporate activities, Watson Pharmaceuticals is constrainted by firm #45. Afterwards, Watson Pharmaceuticals becomes a broker by spanning multiple structural holes, decreasing it network constaint as a result.

40
TABLE 1. Effect of structural holes on patent counts and citation-weighted patent counts. (a)
Alliance only (model 1 and 2) assumes an alliance network comprised of only alliance deals.
(b) M&A & Divestiture included (model 3 and 4) assumes an alliance network affected by
M&As and divestitures on top of the alliance deals.
(a) Alliance only (b) M&A & Divestiture included
(1) (2) (3) (4)
VARIABLES Patent count
Citation-
weighted Patent count
Citation-
weighted
Network constraint -2.746*** -8.091*** -2.629*** -6.866*
(0.554) (3.004) (0.894) (3.727)
Year fixed effects Y Y Y Y
Firm fixed effects Y Y Y Y
Observations 42,242 42,242 39,736 39,736
R-squared 0.014 0.033 0.006 0.022
Number of firms 7,910 7,910 7,784 7,784
Robust standard errors in parentheses
*** p<0.01, ** p<0.05, * p<0.1
TABLE 2. Comparison of first-difference (model 1 and 3) and fixed effects (model 2 and 4)
estimation of the effect of structural holes on patent counts and citation-weighted patent
counts.
Dependent variables: Patent count Citation-weighted count
(1) (2) (3) (4)
VARIABLES
First-
Difference Fixed effects
First-
Difference Fixed effects
∆ Patent
count Patent count
∆ Citation-
weighted
count
Citation-
weighted
count
∆ Network constraint -0.536*** -2.599***
(0.133) (0.897)
Network constraint -2.629*** -6.866*
(0.894) (3.727)
Year fixed effects Y Y Y Y
Firm fixed effects . Y . Y
Observations 31,548 39,736 31,548 39,736
R-squared 0.004 0.006 0.005 0.022
Number of firms 7,784 7,784
Robust standard errors in parentheses
*** p<0.01, ** p<0.05, * p<0.1
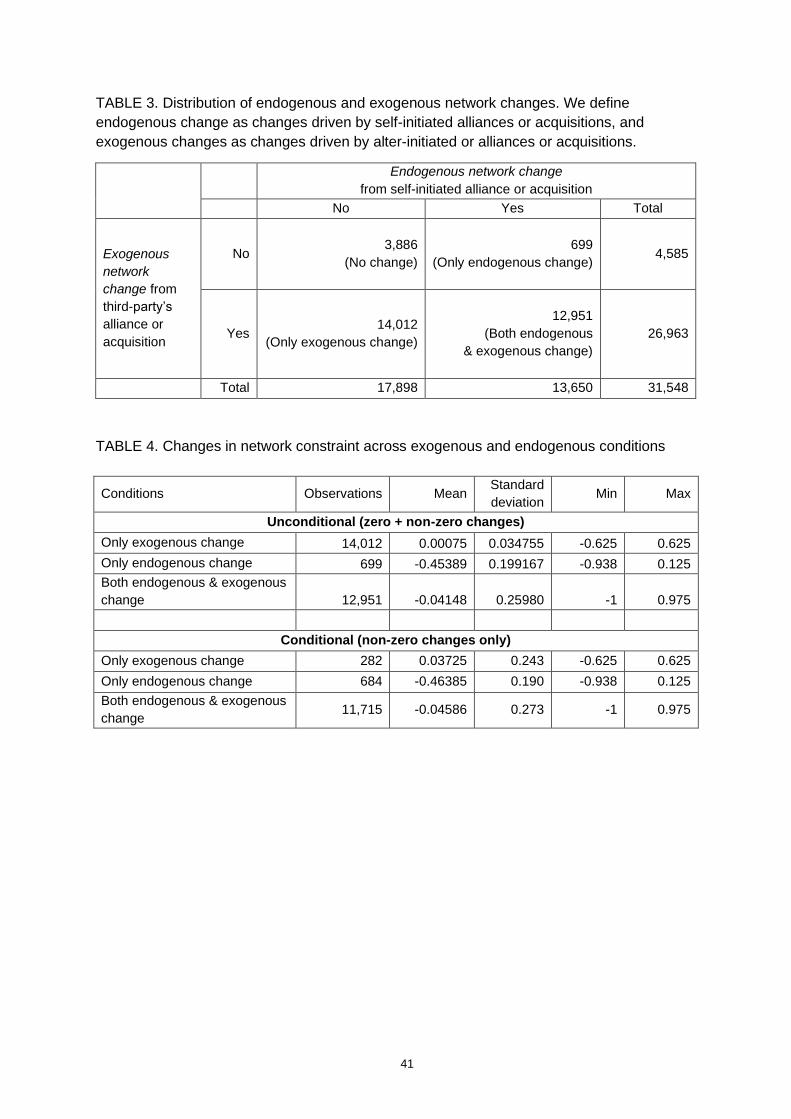
41
TABLE 3. Distribution of endogenous and exogenous network changes. We define
endogenous change as changes driven by self-initiated alliances or acquisitions, and
exogenous changes as changes driven by alter-initiated or alliances or acquisitions.
Endogenous network change
from self-initiated alliance or acquisition
No Yes Total
Exogenous
network
change from
third-party’s
alliance or
acquisition
No 3,886
(No change)
699
(Only endogenous change)
4,585
Yes 14,012
(Only exogenous change)
12,951
(Both endogenous
& exogenous change)
26,963
Total 17,898 13,650 31,548
TABLE 4. Changes in network constraint across exogenous and endogenous conditions
Conditions Observations Mean Standard
deviation Min Max
Unconditional (zero + non-zero changes)
Only exogenous change 14,012 0.00075 0.034755 -0.625 0.625
Only endogenous change 699 -0.45389 0.199167 -0.938 0.125
Both endogenous & exogenous
change 12,951 -0.04148 0.25980 -1 0.975
Conditional (non-zero changes only)
Only exogenous change 282 0.03725 0.243 -0.625 0.625
Only endogenous change 684 -0.46385 0.190 -0.938 0.125
Both endogenous & exogenous
change 11,715 -0.04586 0.273 -1 0.975
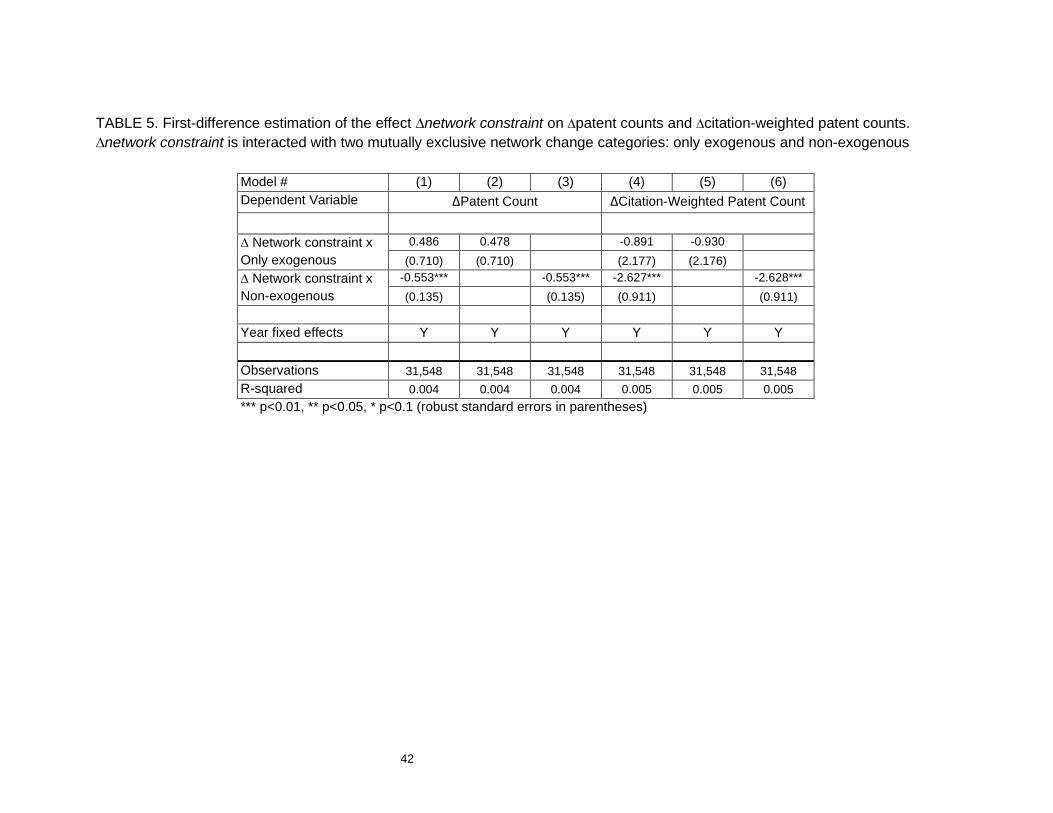
42
TABLE 5. First-difference estimation of the effect ∆network constraint on ∆patent counts and ∆citation-weighted patent counts.
∆network constraint is interacted with two mutually exclusive network change categories: only exogenous and non-exogenous
Model # (1) (2) (3) (4) (5) (6)
Dependent Variable ∆Patent Count ∆Citation-Weighted Patent Count
∆ Network constraint x
Only exogenous
0.486 0.478 -0.891 -0.930
(0.710) (0.710) (2.177) (2.176)
∆ Network constraint x
Non-exogenous
-0.553*** -0.553*** -2.627*** -2.628***
(0.135) (0.135) (0.911) (0.911)
Year fixed effects Y Y Y Y Y Y
Observations 31,548 31,548 31,548 31,548 31,548 31,548
R-squared 0.004 0.004 0.004 0.005 0.005 0.005
*** p<0.01, ** p<0.05, * p<0.1 (robust standard errors in parentheses)
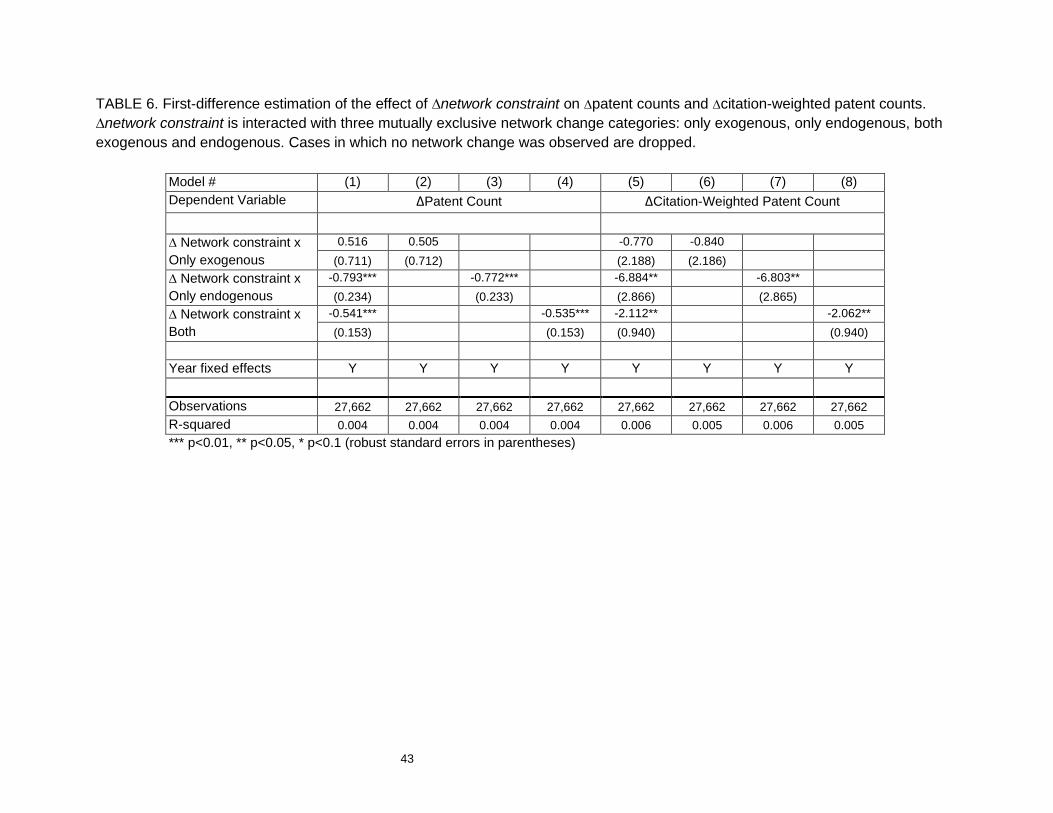
43
TABLE 6. First-difference estimation of the effect of ∆network constraint on ∆patent counts and ∆citation-weighted patent counts.
∆network constraint is interacted with three mutually exclusive network change categories: only exogenous, only endogenous, both
exogenous and endogenous. Cases in which no network change was observed are dropped.
Model # (1) (2) (3) (4) (5) (6) (7) (8)
Dependent Variable ∆Patent Count ∆Citation-Weighted Patent Count
∆ Network constraint x
Only exogenous
0.516 0.505 -0.770 -0.840
(0.711) (0.712) (2.188) (2.186)
∆ Network constraint x
Only endogenous
-0.793*** -0.772*** -6.884** -6.803**
(0.234) (0.233) (2.866) (2.865)
∆ Network constraint x
Both
-0.541*** -0.535*** -2.112** -2.062**
(0.153) (0.153) (0.940) (0.940)
Year fixed effects Y Y Y Y Y Y Y Y
Observations 27,662 27,662 27,662 27,662 27,662 27,662 27,662 27,662
R-squared 0.004 0.004 0.004 0.004 0.006 0.005 0.006 0.005
*** p<0.01, ** p<0.05, * p<0.1 (robust standard errors in parentheses)
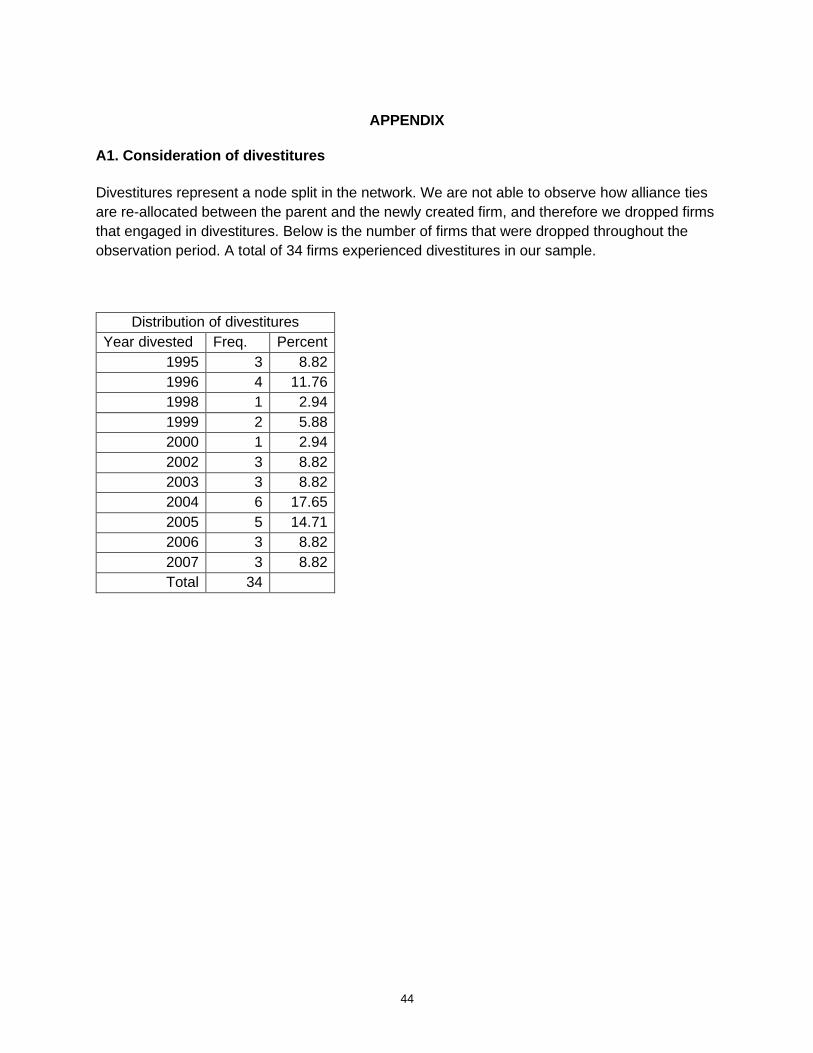
44
APPENDIX
A1. Consideration of divestitures
Divestitures represent a node split in the network. We are not able to observe how alliance ties
are re-allocated between the parent and the newly created firm, and therefore we dropped firms
that engaged in divestitures. Below is the number of firms that were dropped throughout the
observation period. A total of 34 firms experienced divestitures in our sample.
Distribution of divestitures
Year divested Freq. Percent
1995 3 8.82
1996 4 11.76
1998 1 2.94
1999 2 5.88
2000 1 2.94
2002 3 8.82
2003 3 8.82
2004 6 17.65
2005 5 14.71
2006 3 8.82
2007 3 8.82
Total 34
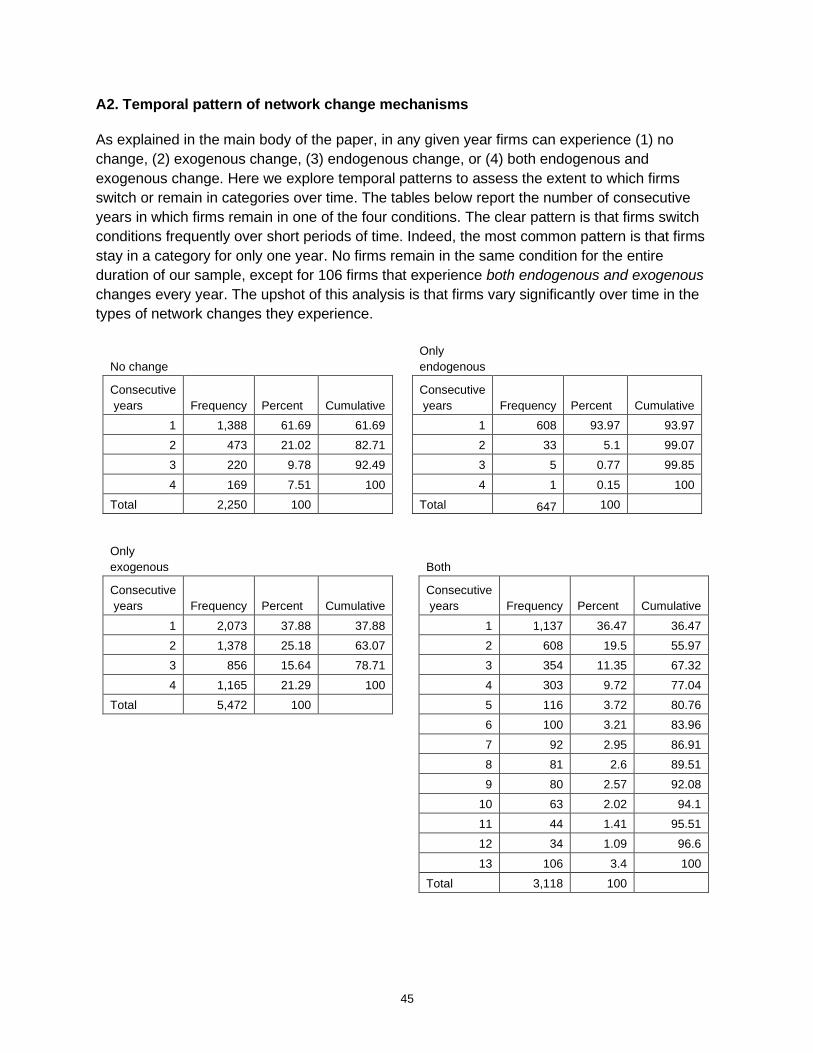
45
A2. Temporal pattern of network change mechanisms
As explained in the main body of the paper, in any given year firms can experience (1) no
change, (2) exogenous change, (3) endogenous change, or (4) both endogenous and
exogenous change. Here we explore temporal patterns to assess the extent to which firms
switch or remain in categories over time. The tables below report the number of consecutive
years in which firms remain in one of the four conditions. The clear pattern is that firms switch
conditions frequently over short periods of time. Indeed, the most common pattern is that firms
stay in a category for only one year. No firms remain in the same condition for the entire
duration of our sample, except for 106 firms that experience both endogenous and exogenous
changes every year. The upshot of this analysis is that firms vary significantly over time in the
types of network changes they experience.
No change
Only
endogenous
Consecutive
years Frequency Percent Cumulative
Consecutive
years Frequency Percent Cumulative
1 1,388 61.69 61.69 1 608 93.97 93.97
2 473 21.02 82.71 2 33 5.1 99.07
3 220 9.78 92.49 3 5 0.77 99.85
4 169 7.51 100 4 1 0.15 100
Total 2,250 100 Total 647 100
Only
exogenous Both
Consecutive
years Frequency Percent Cumulative
Consecutive
years Frequency Percent Cumulative
1 2,073 37.88 37.88 1 1,137 36.47 36.47
2 1,378 25.18 63.07 2 608 19.5 55.97
3 856 15.64 78.71 3 354 11.35 67.32
4 1,165 21.29 100 4 303 9.72 77.04
Total 5,472 100 5 116 3.72 80.76
6 100 3.21 83.96
7 92 2.95 86.91
8 81 2.6 89.51
9 80 2.57 92.08
10 63 2.02 94.1
11 44 1.41 95.51
12 34 1.09 96.6
13 106 3.4 100
Total 3,118 100

46
The next two tables provide a highly detailed illustration of the temporal patterns. A “1”
represents a firm being in a certain category in a given year and “*” represents a firm being
absent. For example, in the first row of the only exogenous condition, if the pattern is
“************1” it means that 547 firms are present in the last year of observation and not in any
other year. The clear conclusion is that there is no systematic or stable pattern.
Only exogenous Only endogenous
Frequency Percent Pattern Frequency Percent Pattern
547 10.0 ............1 82 12.67 ............1
275 5.03 ...........11 56 8.66 ...........1.
215 3.93 ..........111 49 7.57 ..........1..
194 3.55 ...........1. 49 7.57 ........1....
163 2.98 ......1111... 49 7.57 .......1.....
148 2.70 .......1111.. 47 7.26 .........1...
147 2.69 .........1111 42 6.49 ......1......
139 2.54 ........1111. 40 6.18 .....1.......
92 1.68 .....1111.... 37 5.72 ....1........
92 1.68 ....1111..... 36 5.56 .1...........
88 1.61 ..........1.. 32 4.95 ..1..........
88 1.61 .........1... 28 4.33 1............
87 1.59 1............ 20 3.09 ...1.........
79 1.44 ........111.. 6 0.93 ...........11
77 1.41 .......1..... 5 0.77 .........1.1.
76 1.39 ..........11. 4 0.62 .......11....
76 1.39 ...1111...... 3 0.46 ..........11.
69 1.26 ........1.... 3 0.46 .........11..
64 1.17 .........111. 3 0.46 .....11......
61 1.11 ..........1.1 3 0.46 ...1.1.......
61 1.11 .......111... 3 0.46 ..11.........
61 1.11 .1111........ 2 0.31 .......1..1..
61 1.11 1111......... 2 0.31 ......11.....
60 1.10 ..1111....... 2 0.31 .....1.1.....
59 1.08 ........11... 2 0.31 ....111......
57 1.04 .........11.. 2 0.31 ...11........
55 1.01 111.......... 2 0.31 .1.1.........
52 0.95 ....1........ 2 0.31 1........1...
52 0.95 .1........... 2 0.31 11...........
52 0.95 11........... 34 5.18 (other patterns)
51 0.93 ..1.......... Total: 647
49 0.90 ......1......
49 0.90 ...1.........
46 0.84 ......111....
45 0.82 ....111......
42 0.77 .......11....
40 0.73 .....111.....
39 0.71 ........1.1..
38 0.69 .........1.11
37 0.68 .....1.......
35 0.64 ..111........
1654 30.22 (other patterns)
Total: 5,472

47
No change Both
Frequency Percent Pattern Frequency Percent Pattern
315 14.00 ............1 277 8.88 ............1
129 5.73 .......1..... 153 4.91 ...........1.
113 5.02 ..........1.. 107 3.43 ...........11
111 4.93 ...........11 106 3.40 1111111111111
97 4.31 ...........1. 68 2.18 ..........1..
90 4.00 ........1.... 59 1.89 ..........111
77 3.42 1............ 55 1.76 ..........11.
71 3.16 .........1... 42 1.35 .........1111
64 2.84 ..........111 41 1.31 .........1...
62 2.76 .....1....... 36 1.15 ........11111
60 2.67 .......11.... 31 0.99 .......111111
55 2.44 ........11... 31 0.99 ......1111111
54 2.40 ...1......... 31 0.99 .....11111111
51 2.27 ....1........ 29 0.93 ..........1.1
51 2.27 ..1.......... 27 0.87 .........1..1
49 2.18 .1........... 27 0.87 .1...........
45 2.00 ......1...... 26 0.83 .........1.1.
40 1.78 .......1111.. 26 0.83 ........1....
26 1.16 .......111... 25 0.80 ....111111111
25 1.11 ..........11. 25 0.80 ..11111111111
25 1.11 ......1111... 25 0.80 1............
25 1.11 11........... 24 0.77 .........11..
22 0.98 .........11.. 24 0.77 ......1...1..
20 0.89 .......1.1... 23 0.74 .........1.11
20 0.89 ......11..... 23 0.74 ........1...1
19 0.84 .....1.1..... 22 0.71 .........11.1
17 0.76 ........111.. 22 0.71 ...1111111111
16 0.71 ..........1.1 22 0.71 ..1..........
16 0.71 ..111........ 20 0.64 .......1...1.
15 0.67 .........1111 20 0.64 ......1......
15 0.67 .111......... 20 0.64 0.111111111
14 0.62 ...111....... 19 0.61 .....1.......
13 0.58 ........1111. 19 0.61 ...1.........
13 0.58 ..11......... 18 0.58 1111.........
12 0.53 ........1.1.. 18 0.58 111111111....
12 0.53 ......111.... 17 0.55 ........1.111
12 0.53 ..1111....... 17 0.55 .......1.....
12 0.53 111.......... 16 0.51 ........111.1
12 0.53 1111......... 15 0.48 ....1...1....
11 0.49 .....11...... 15 0.48 .11..........
11 0.49 ....111...... 15 0.48 11...........
11 0.49 ....1111..... 14 0.45 ........1.1..
11 0.49 ...1111...... 14 0.45 1.11111E+11
10 0.44 .........111. 13 0.42 .......1..1..
10 0.44 .........111. 13 0.42 .......11..11
301 13.37 (other patterns) 1428 45.8 (other patterns)
Total: 2,250 Total: 3,118
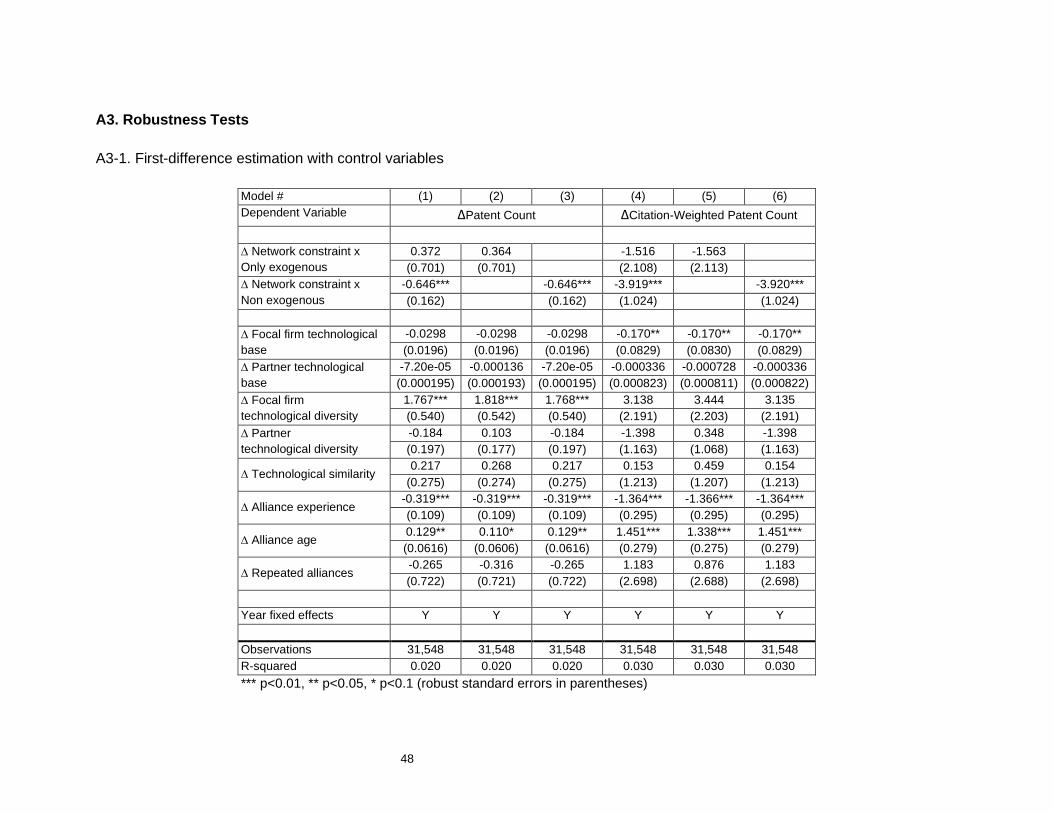
48
A3. Robustness Tests
A3-1. First-difference estimation with control variables
Model # (1) (2) (3) (4) (5) (6)
Dependent Variable ∆Patent Count ∆Citation-Weighted Patent Count
∆ Network constraint x
Only exogenous
0.372 0.364 -1.516 -1.563
(0.701) (0.701) (2.108) (2.113)
∆ Network constraint x
Non exogenous
-0.646*** -0.646*** -3.919*** -3.920***
(0.162) (0.162) (1.024) (1.024)
∆ Focal firm technological
base
-0.0298 -0.0298 -0.0298 -0.170** -0.170** -0.170**
(0.0196) (0.0196) (0.0196) (0.0829) (0.0830) (0.0829)
∆ Partner technological
base
-7.20e-05 -0.000136 -7.20e-05 -0.000336 -0.000728 -0.000336
(0.000195) (0.000193) (0.000195) (0.000823) (0.000811) (0.000822)
∆ Focal firm
technological diversity
1.767*** 1.818*** 1.768*** 3.138 3.444 3.135
(0.540) (0.542) (0.540) (2.191) (2.203) (2.191)
∆ Partner
technological diversity
-0.184 0.103 -0.184 -1.398 0.348 -1.398
(0.197) (0.177) (0.197) (1.163) (1.068) (1.163)
∆ Technological similarity 0.217 0.268 0.217 0.153 0.459 0.154
(0.275) (0.274) (0.275) (1.213) (1.207) (1.213)
∆ Alliance experience -0.319*** -0.319*** -0.319*** -1.364*** -1.366*** -1.364***
(0.109) (0.109) (0.109) (0.295) (0.295) (0.295)
∆ Alliance age 0.129** 0.110* 0.129** 1.451*** 1.338*** 1.451***
(0.0616) (0.0606) (0.0616) (0.279) (0.275) (0.279)
∆ Repeated alliances -0.265 -0.316 -0.265 1.183 0.876 1.183
(0.722) (0.721) (0.722) (2.698) (2.688) (2.698)
Year fixed effects Y Y Y Y Y Y
Observations 31,548 31,548 31,548 31,548 31,548 31,548
R-squared 0.020 0.020 0.020 0.030 0.030 0.030
*** p<0.01, ** p<0.05, * p<0.1 (robust standard errors in parentheses)
49
We control for various firm and the alliance-level factors commonly included in studies of alliance networks and innovation. The focal firm’s technological base, a proxy for absorptive capacity, is calculated as the cumulative number of patents up to the year of observation. Partner firms’ technological base is calculated in the same way but takes the mean of the portfolio of alliance partners. To account for the scope of the firm’s innovativeness, we calculate focal firm’s technological diversity. We use the formula 1- ∑ (𝑝𝑎𝑡𝑖/𝑁)2
𝑖 (Blau, 1977), where 𝑝𝑎𝑡𝑖 is the number of patents filed in class 𝑖 and 𝑁 is the total number of patent filed by the firm (Vasudeva, Zaheer, and Hernandez, 2013; Kumar and Zaheer, 2019). A perfect heterogeneity will result in a value of 1 and a perfect concentration will result in a value of 0. Partners’ technological diversity is calculated in the same way based on the patenting activity of all the partners in the portfolio. To capture the firm’s track record of alliance participation, alliance experience is calculated as the total number of alliances a firm has initiated up to the year of observation (Anand and Khanna, 2000). We also control for the age of the firm’s alliances using the average age of the alliances in the portfolio (Soda, Usai, and Zaheer, 2004). The ratio of repeated alliances was calculated as proportion of alliances that had been formed at least once before the focal year (Gulati 1995). Lastly, technological similarity among the focal firm and the alliance partners was calculated based on the cosine similarity of the patent classes filed. We construct a 𝑘-dimensional vector 𝑙 containing the percentage of patents filed in each class by the focal firm 𝑖 and
the partner portfolio j, then we calculate the cosine similarity using the formula 𝑐𝑜𝑠𝑖𝑗𝑡 = 𝑙𝑖𝑡𝑙′𝑗𝑡/√(𝑙𝑖𝑡𝑙′𝑖𝑡)(𝑙𝑗𝑡𝑙′𝑗𝑡) (Jaffe, 1986; Kumar
and Zaheer, 2019).
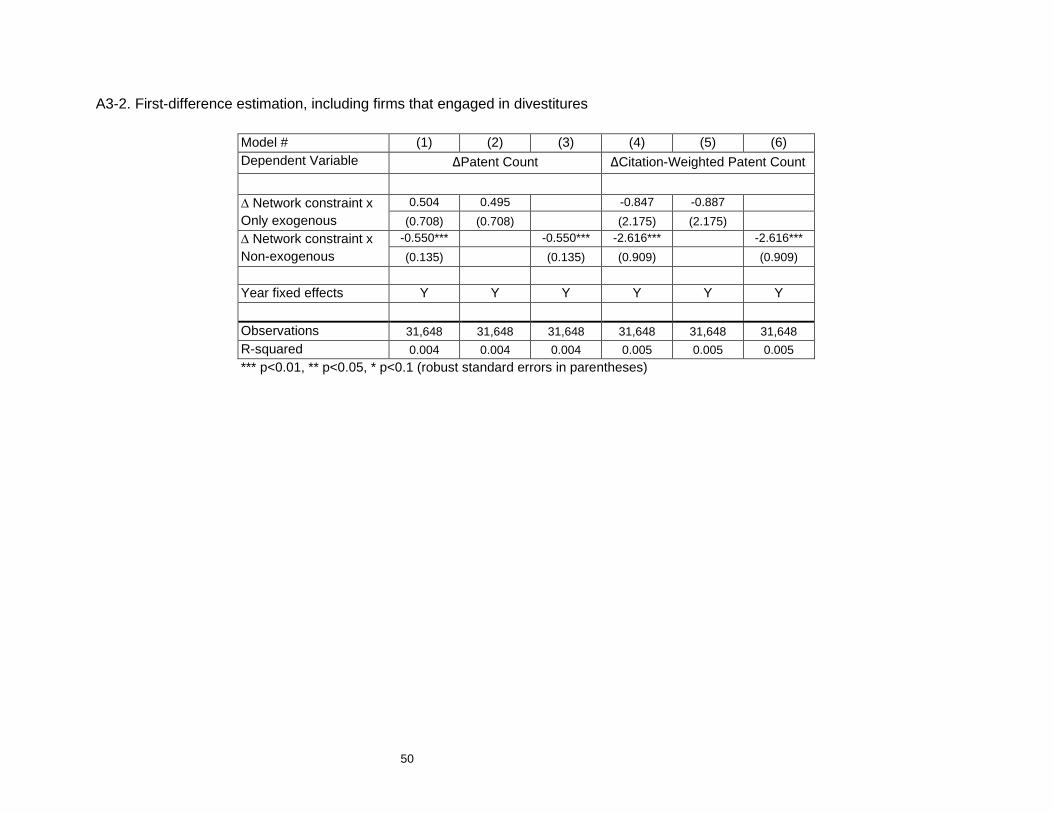
50
A3-2. First-difference estimation, including firms that engaged in divestitures
Model # (1) (2) (3) (4) (5) (6)
Dependent Variable ∆Patent Count ∆Citation-Weighted Patent Count
∆ Network constraint x
Only exogenous
0.504 0.495 -0.847 -0.887
(0.708) (0.708) (2.175) (2.175)
∆ Network constraint x
Non-exogenous
-0.550*** -0.550*** -2.616*** -2.616***
(0.135) (0.135) (0.909) (0.909)
Year fixed effects Y Y Y Y Y Y
Observations 31,648 31,648 31,648 31,648 31,648 31,648
R-squared 0.004 0.004 0.004 0.005 0.005 0.005
*** p<0.01, ** p<0.05, * p<0.1 (robust standard errors in parentheses)

51
A3-3. Robustness check with alternative dependent variable time windows
We used a five-year window for patent application in the main analysis. Below are the results for a (a) four-year window (T+1 to T+4)
and (b) three-year window (T+1 to T+3).
(a) Dependent variable: patent count and citation-weighted patent count during four-year window following the focal year
Model # (1) (2) (3) (4) (5) (6)
Dependent Variable ∆Patent Count ∆Citation-Weighted Patent Count
∆ Network constraint x
Only exogenous
0.852 0.845 -1.560 -1.590
(0.741) (0.741) (2.705) (2.704)
∆ Network constraint x
Non-exogenous
-0.447*** -0.447*** -2.033** -2.034**
(0.133) (0.133) (0.921) (0.921)
Year fixed effects Y Y Y Y Y Y
Observations 31,548 31,548 31,548 31,548 31,548 31,548
R-squared 0.005 0.005 0.005 0.005 0.005 0.005
*** p<0.01, ** p<0.05, * p<0.1 (robust standard errors in parentheses)
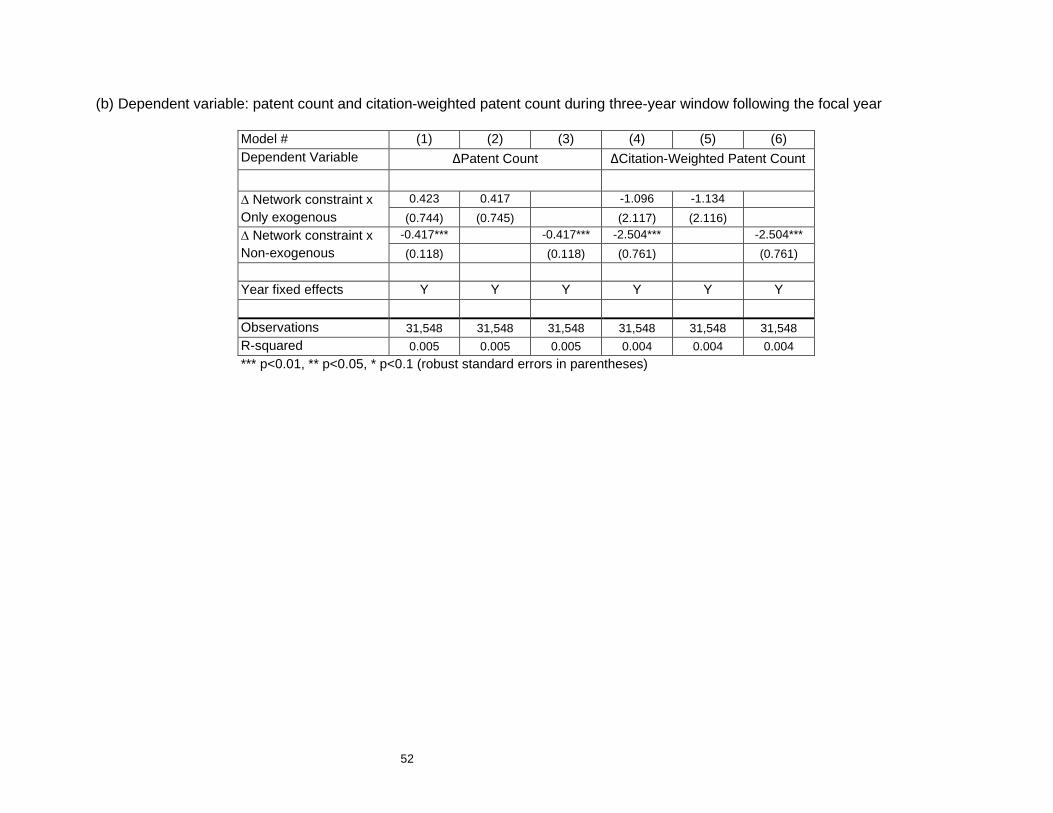
52
(b) Dependent variable: patent count and citation-weighted patent count during three-year window following the focal year
Model # (1) (2) (3) (4) (5) (6)
Dependent Variable ∆Patent Count ∆Citation-Weighted Patent Count
∆ Network constraint x
Only exogenous
0.423 0.417 -1.096 -1.134
(0.744) (0.745) (2.117) (2.116)
∆ Network constraint x
Non-exogenous
-0.417*** -0.417*** -2.504*** -2.504***
(0.118) (0.118) (0.761) (0.761)
Year fixed effects Y Y Y Y Y Y
Observations 31,548 31,548 31,548 31,548 31,548 31,548
R-squared 0.005 0.005 0.005 0.004 0.004 0.004
*** p<0.01, ** p<0.05, * p<0.1 (robust standard errors in parentheses)