Are nanostructured lipid carriers (NLCs) better than solid lipid nanoparticles (SLNs): Development,...
13
Are nanostructured lipid carriers (NLCs) better than solid lipid nanoparticles (SLNs): Development, characterizations and comparative evaluations of clotrimazole-loaded SLNs and NLCs? Surajit Das a,⇑ , Wai Kiong Ng a , Reginald B.H. Tan a,b,⇑ a Institute of Chemical and Engineering Sciences, A STAR (Agency for Science, Technology and Research), 1 Pesek Road, Jurong Island, Singapore 627833, Singapore b Department of Chemical and Biomolecular Engineering, National University of Singapore, 4 Engineering Drive 4, Singapore 117576, Singapore article info Article history: Received 13 January 2012 Received in revised form 2 May 2012 Accepted 23 May 2012 Available online 1 June 2012 Keywords: Solid lipid nanoparticle Nanostructured lipid carrier Clotrimazole Characterization Drug release Stability abstract In recent years, solid lipid nanoparticles (SLNs) and nanostructured lipid carriers (NLCs) are among the popular research topics for the delivery of lipophilic drugs. Although SLNs have demonstrated several beneficial properties as drug-carrier, limited drug-loading and expulsion of drug during storage led to the development of NLCs. However, the superiority of NLCs over SLNs has not been fully established yet due to the contradictory results. In this study, SLNs and NLCs were developed using clotrimazole as model drug. Size, polydispersity index (PI), zeta potential (ZP), drug-loading (L), drug encapsulation efficiency (EE), scanning electron microscopy (SEM), differential scanning calorimetry (DSC), X-ray dif- fractometry (XRD), drug release and stability of SLNs and NLCs were compared. Critical process param- eters exhibited significant impact on the nanoparticles’ properties. Size, PI, ZP and EE of the developed SLNs and NLCs were <100 nm, <0.17, <22 mV and >82%, respectively. SEM images of SLNs and NLCs revealed spherical shaped particles (100 nm). DSC and XRD studies indicated slight difference between SLNs and NLCs as well as disappearance of the crystalline peak(s) of the encapsulated drug. NLCs dem- onstrated faster drug release than SLNs at low drug-loading, whereas there was no significant difference in drug release from SLNs and NLCs at high drug-loading. However, sustained/prolonged drug release was observed from both formulations. Furthermore, this study suggests that the drug release experiment should be designed considering the final application (topical/oral/parenteral) of the product. Regarding stability, NLCs showed better stability (in terms of size, PI, EE and L) than SLNs at 25 °C. Moreover, there was no significant difference in drug release profile of NLCs after 3 months storage in compare to fresh NLCs, while significant change in drug release rate was observed in case of SLNs. Therefore, NLCs have an edge over SLNs. Ó 2012 Elsevier B.V. All rights reserved. 1. Introduction From the recent past, biocompatible lipids have been attracting the attention of the formulation scientists as carriers for the deliv- ery of poorly soluble drugs (Pouton, 2006). Among them, lipid nanoparticle formulations with solid matrix have gained huge pop- ularity. Generally, there are two types of lipid nanoparticles with solid matrix, solid lipid nanoparticles (SLNs) and nanostructured li- pid carriers (NLCs) (Das and Chaudhury, 2011). Theses nanoparti- cles can be widely applied to deliver drugs/actives through oral, parenteral and topical routes (Almeida and Souto, 2007; Das and Chaudhury, 2011; Hanafy et al., 2007; Muchow et al., 2008; Müller et al., 2007, 2002b; Schafer-Korting et al., 2007; Wissing et al., 2004; Wong et al., 2007). However, the current focus of the SLNs and NLCs research is more inclined towards topical (especially der- mal) application both in pharmaceutical and cosmetic purposes (Pardeike et al., 2009). SLNs are prepared using solid lipids (i.e., lipids that are solid at room temperature as well as at body temperature). Theses lipids are biocompatible and biodegradable with GRAS (Generally Recog- nized As Safe) status. SLNs are beneficial in many aspects (Das and Chaudhury, 2011; Gershkovich and Hoffman, 2007; Müller et al., 1996, 2000; Saupe et al., 2006), such as: (i) use of organic solvents can be avoided to produce SLNs, (ii) possess negligible toxicity, (iii) lipophilic compounds can be easily encapsulated, (iv) bioavailabil- ity of highly lipophilic molecules can be increased via lymphatic uptake, (v) degradation of chemical/moisture/light/oxidation sensitive molecules can be prevented by their incorporation in 0928-0987/$ - see front matter Ó 2012 Elsevier B.V. All rights reserved. http://dx.doi.org/10.1016/j.ejps.2012.05.010 ⇑ Corresponding authors. Address: Institute of Chemical and Engineering Sci- ences, A STAR (Agency for Science, Technology and Research), 1 Pesek Road, Jurong Island, Singapore 627833, Singapore. Tel.: +65 6796 3841; fax: +65 6316 6183. E-mail addresses: [email protected] (S. Das), [email protected]. edu.sg (R.B.H. Tan). European Journal of Pharmaceutical Sciences 47 (2012) 139–151 Contents lists available at SciVerse ScienceDirect European Journal of Pharmaceutical Sciences journal homepage: www.elsevier.com/locate/ejps
-
Upload
surajit-das -
Category
Documents
-
view
214 -
download
1
Transcript of Are nanostructured lipid carriers (NLCs) better than solid lipid nanoparticles (SLNs): Development,...

European Journal of Pharmaceutical Sciences 47 (2012) 139–151
Contents lists available at SciVerse ScienceDirect
European Journal of Pharmaceutical Sciences
journal homepage: www.elsevier .com/ locate/e jps
Are nanostructured lipid carriers (NLCs) better than solid lipid nanoparticles(SLNs): Development, characterizations and comparative evaluationsof clotrimazole-loaded SLNs and NLCs?
Surajit Das a,⇑, Wai Kiong Ng a, Reginald B.H. Tan a,b,⇑a Institute of Chemical and Engineering Sciences, A�STAR (Agency for Science, Technology and Research), 1 Pesek Road, Jurong Island, Singapore 627833, Singaporeb Department of Chemical and Biomolecular Engineering, National University of Singapore, 4 Engineering Drive 4, Singapore 117576, Singapore
a r t i c l e i n f o a b s t r a c t
Article history:Received 13 January 2012Received in revised form 2 May 2012Accepted 23 May 2012Available online 1 June 2012
Keywords:Solid lipid nanoparticleNanostructured lipid carrierClotrimazoleCharacterizationDrug releaseStability
0928-0987/$ - see front matter � 2012 Elsevier B.V. Ahttp://dx.doi.org/10.1016/j.ejps.2012.05.010
⇑ Corresponding authors. Address: Institute of Chences, A�STAR (Agency for Science, Technology and ReIsland, Singapore 627833, Singapore. Tel.: +65 6796 3
E-mail addresses: [email protected] (S. Dedu.sg (R.B.H. Tan).
In recent years, solid lipid nanoparticles (SLNs) and nanostructured lipid carriers (NLCs) are among thepopular research topics for the delivery of lipophilic drugs. Although SLNs have demonstrated severalbeneficial properties as drug-carrier, limited drug-loading and expulsion of drug during storage led tothe development of NLCs. However, the superiority of NLCs over SLNs has not been fully establishedyet due to the contradictory results. In this study, SLNs and NLCs were developed using clotrimazoleas model drug. Size, polydispersity index (PI), zeta potential (ZP), drug-loading (L), drug encapsulationefficiency (EE), scanning electron microscopy (SEM), differential scanning calorimetry (DSC), X-ray dif-fractometry (XRD), drug release and stability of SLNs and NLCs were compared. Critical process param-eters exhibited significant impact on the nanoparticles’ properties. Size, PI, ZP and EE of the developedSLNs and NLCs were <100 nm, <0.17, <�22 mV and >82%, respectively. SEM images of SLNs and NLCsrevealed spherical shaped particles (�100 nm). DSC and XRD studies indicated slight difference betweenSLNs and NLCs as well as disappearance of the crystalline peak(s) of the encapsulated drug. NLCs dem-onstrated faster drug release than SLNs at low drug-loading, whereas there was no significant differencein drug release from SLNs and NLCs at high drug-loading. However, sustained/prolonged drug release wasobserved from both formulations. Furthermore, this study suggests that the drug release experimentshould be designed considering the final application (topical/oral/parenteral) of the product. Regardingstability, NLCs showed better stability (in terms of size, PI, EE and L) than SLNs at 25 �C. Moreover, therewas no significant difference in drug release profile of NLCs after 3 months storage in compare to freshNLCs, while significant change in drug release rate was observed in case of SLNs. Therefore, NLCs havean edge over SLNs.
� 2012 Elsevier B.V. All rights reserved.
1. Introduction
From the recent past, biocompatible lipids have been attractingthe attention of the formulation scientists as carriers for the deliv-ery of poorly soluble drugs (Pouton, 2006). Among them, lipidnanoparticle formulations with solid matrix have gained huge pop-ularity. Generally, there are two types of lipid nanoparticles withsolid matrix, solid lipid nanoparticles (SLNs) and nanostructured li-pid carriers (NLCs) (Das and Chaudhury, 2011). Theses nanoparti-cles can be widely applied to deliver drugs/actives through oral,parenteral and topical routes (Almeida and Souto, 2007; Das and
ll rights reserved.
emical and Engineering Sci-search), 1 Pesek Road, Jurong841; fax: +65 6316 6183.as), [email protected].
Chaudhury, 2011; Hanafy et al., 2007; Muchow et al., 2008; Mülleret al., 2007, 2002b; Schafer-Korting et al., 2007; Wissing et al.,2004; Wong et al., 2007). However, the current focus of the SLNsand NLCs research is more inclined towards topical (especially der-mal) application both in pharmaceutical and cosmetic purposes(Pardeike et al., 2009).
SLNs are prepared using solid lipids (i.e., lipids that are solid atroom temperature as well as at body temperature). Theses lipidsare biocompatible and biodegradable with GRAS (Generally Recog-nized As Safe) status. SLNs are beneficial in many aspects (Das andChaudhury, 2011; Gershkovich and Hoffman, 2007; Müller et al.,1996, 2000; Saupe et al., 2006), such as: (i) use of organic solventscan be avoided to produce SLNs, (ii) possess negligible toxicity, (iii)lipophilic compounds can be easily encapsulated, (iv) bioavailabil-ity of highly lipophilic molecules can be increased via lymphaticuptake, (v) degradation of chemical/moisture/light/oxidationsensitive molecules can be prevented by their incorporation in

140 S. Das et al. / European Journal of Pharmaceutical Sciences 47 (2012) 139–151
the nanoparticle matrix, (vi) sustained drug release from the nano-particle matrix is possible due to solid nature of the matrix leadingto prolonged drug release and minimization of the adverse side ef-fects of the encapsulated drug molecule, (vii) penetration throughskin or mucus barrier is possible due to nano size. Nevertheless,polymorphic transitions of the lipid may occur with time due tothe crystalline structure of solid lipid (Müller et al., 2002a,b). Atnano-scale, crystallization behavior is different as the solidificationtemperature decreases in comparison with bulk lipid (Müller et al.,2002a). Formation of less ordered lipid modification is more pro-nounced compared with bulk lipid (Freitas and Müller, 1999). Lipidcrystallizes in high-energetic lipid modifications, a and b0, immedi-ately after preparation of SLNs. However, lipid may transform tolow-energetic modifications, bi and b, with time (Das and Chaudh-ury, 2011; Müller et al., 2002a,b). In general, drug molecules stay inbetween the fatty acid chains or as amorphous clusters in crystalimperfections within SLN matrix. But, when lipid transform tolow-energetic form, it form a perfect crystalline lattice that allowsvery small space for the drug molecules. Therefore, expulsion ofencapsulated drug molecules may be observed during storage,especially when SLN matrix is composed of a highly purified lipid,which leads to limited drug-loading capacity of SLNs (Das andChaudhury, 2011; Müller et al., 2002a,b; Westesen et al., 1997).Therefore, amount of encapsulated drug and drug release profileof SLNs may change with storage time.
In the process of further improvement and reduction of thesedrawbacks of SLNs, NLCs have been evolved as alternative drugcarrier systems. NLC matrix is composed of mixture of spatially dif-ferent lipid molecules, normally mixture of solid and liquid lipid,which makes more imperfection in the matrix to accommodatemore drug molecules than SLN. Despite the presence of liquid lipid,NLC matrix is solid at room/body temperature (Chen et al., 2010). Itis expected that the drug-loading capacity will be enhanced, drugexpulsion during storage will be minimized due to the imperfectcrystal lattice and drug release profile can be easily modulatedby varying the lipid matrix composition (Müller et al., 2002a; Rad-tke et al., 2005).
Although several research reports on SLNs and NLCs have al-ready been published, the advantages of NLCs over SLNs have notbeen fully established yet. In fact, there are several contradictoryfindings in the studies performed so far (Kovacevic et al., 2011;Souza et al., 2011; Tiwari and Pathak, 2011). There are various crit-ical questions required to be answered, such as: (i) Is there any dif-ference between SLNs and NLCs with respect to the drug releaseprofile and drug release kinetics? (ii) Do the drug release profileand drug release kinetics of SLNs and NLCs vary at differentdrug-loading? (iii) Is stability of NLCs better than SLNs at differentstorage conditions? (iv) Is stability of NLCs better than SLNs at dif-ferent level of drug loading? (v) Is there any change in drug releasepattern after storage? (vi) Is the drug release pattern significantlydifferent at topical and oral/parenteral environments? In thisstudy, different SLNs and NLCs were developed by varying the for-mulation conditions, such as, different lipids, surfactants, ultra-sonication time, surfactant concentration, drug concentration (ordrug to lipid ratio), lipid concentration, and solid lipid to liquid li-pid ratio. The effect of these formulation conditions on particlesize, polydispersity index, drug encapsulation efficiency of thenanoparticles, and zeta potential of the nanoparticle dispersionswere compared. Cryogenic field emission scanning electronmicroscopy (cryo-FESEM), differential scanning calorimetry (DSC)and X-ray diffractometry (XRD) experiments were performed todemonstrate and compare the physicochemical characteristics ofSLNs and NLCs. The drug release profile and drug release kineticsof SLNs and NLCs at different drug to lipid ratio was thoroughlyevaluated and compared. As the in vivo topical and oral/parenteraldrug release conditions are different, different drug release
experiments were conducted considering topical and oral/paren-teral applications and drug release profiles were compared. Thestability of SLNs and NLCs were evaluated at different storageconditions and compared. Finally, the drug release study of thestored SLNs and NLCs was conducted and compared.
Clotrimazole, 1-[(2-chlorophenyl)diphenylmethyl]-1H-imidaz-ole, is an imidazole type antifungal drug. It is highly lipophilic. Itis used to treat different skin and mucus diseases, such as tineapedis, tinea crusis, vaginal yeast infections, oral thrush or oral can-didiasis, ringworm, mycotic infections of the genitor-urinary tract,and also cancer and sickle cell anemia (Brugnara et al., 1995; Kastet al., 2002; Vazquez, 2000; Yong et al., 2007). Nevertheless, themain disadvantages for the clinical application of clotrimazoleare its poor aqueous solubility and side effects (Prabagar et al.,2007; Souto and Müller, 2007; Yong et al., 2007). In addition, oralbioavailability of clotrimazole is low (Prabagar et al., 2007; Yonget al., 2007). These disadvantages make clotrimazole a perfectchoice as model lipophilic drug for SLNs and NLCs. The develop-ment of SLNs/NLCs of clotrimazole might have significant advan-tage for its clinical use.
2. Materials and methods
2.1. Materials
Clotrimazole, Tween� 80 (polyoxyethylene (20) sorbitanmonooleate), Tween� 20 (polyoxyethylene (20) sorbitan monolau-rate), Pluronic� F68 (polyoxyethylene-polyoxypropylene (150:29)block copolymer) and dialysis tube were purchased from Sigma(USA). Chremophore� EL (polyethoxylated castor oil) was gift sam-ples from BASF (Germany). Compritol� 888 ATO (glycerol dibehe-nate/behenate), Precirol� ATO 5 (glycerol distearate), Geleol™(Glycerol monostearate), Suppocire� NC (semi-synthetic triglycer-ides of C10 to C18 saturated fatty acids) and Labrafac™ CC(Caprylic/Capric Triglyceride) were generous gift by Gattefossé(France). Dynasan� 114 (glycerol trimyristate) and Dynasan� 118(glycerol tristearate) and Imwitor� 900 K (glyceryl stearate) werekindly donated by Sasol (Germany). HPLC grade acetonitrile andmethanol were bought from Fisher Scientific (USA) and J.T. Baker(USA), respectively. Phosphoric acid was obtained from KantoChemical Co. Inc. (Japan). Purified water was collected from Milli-pore-Q� Gradient A10™ ultra-pure water system (Millipore,France) for the study.
2.2. Formulation technique
Emulsification-ultrasonication technique was used to prepareSLNs and NLCs (Chen et al., 2010; Das et al., 2011). In case of SLNs,solid lipid was weighed in an amber glass colored bottle andheated at 75 �C to melt the lipid. In case of NLCs, solid and liquidlipids were first put together in an amber colored glass bottleand then heated at 75 �C with continuous stirring to homoge-neously mix the lipids. The drug was added in the melted lipid(SLNs) or lipid mixture (NLCs) and mixed well to fully dissolvethe drug in lipid(s). In a separate container, surfactant was dis-solved in ultra-pure water and heated at 75 �C. Then this hot aque-ous surfactant solution (aqueous phase) was poured in the meltedlipid(s) containing drug (oil phase) and homogeneously dispersedusing a homogenizer (IKA� T-10 basic Ultra-Turrax�, Germany)at �14,000–15000 rpm, while maintaining the temperature at75 �C. This step produced coarse o/w emulsion, which was furthersonicated using a probe sonicator (Vibracell™ 700 W; Sonics, USA)at 75 �C. This step produced o/w nanoemulsion, which was imme-diately placed in a double walled plastic box filled with ice to coolit down rapidly. The liquid nano droplets of melted lipid trans-
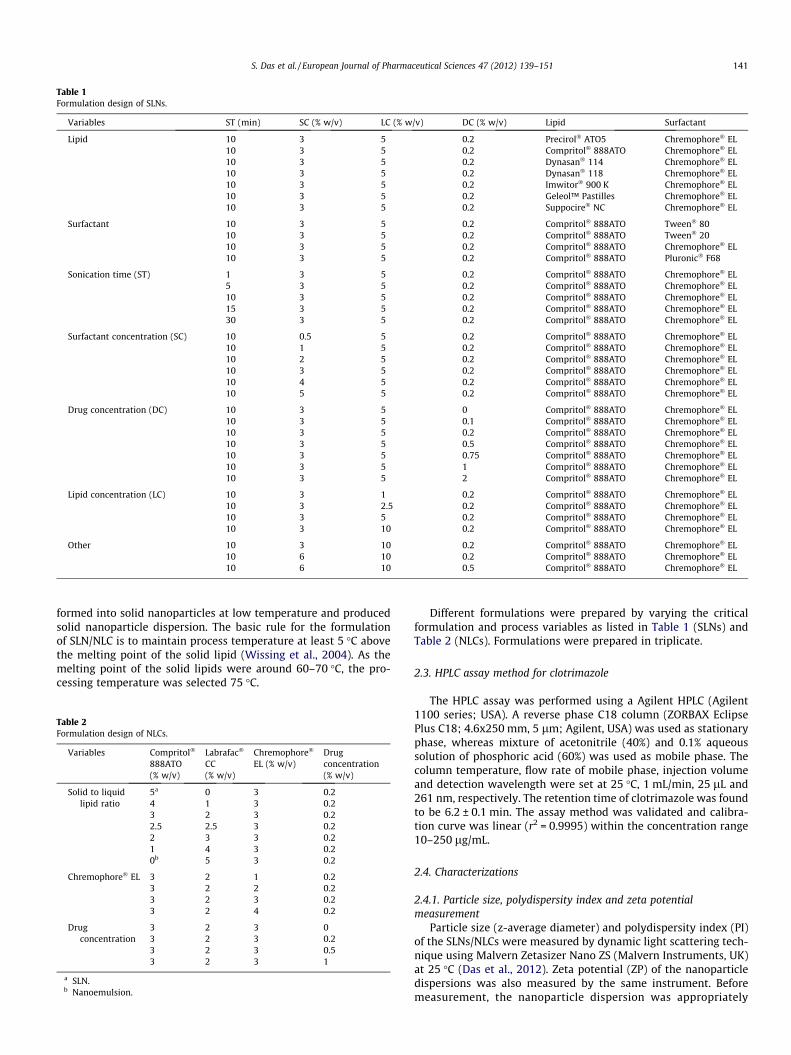
Table 1Formulation design of SLNs.
Variables ST (min) SC (% w/v) LC (% w/v) DC (% w/v) Lipid Surfactant
Lipid 10 3 5 0.2 Precirol� ATO5 Chremophore� EL10 3 5 0.2 Compritol� 888ATO Chremophore� EL10 3 5 0.2 Dynasan� 114 Chremophore� EL10 3 5 0.2 Dynasan� 118 Chremophore� EL10 3 5 0.2 Imwitor� 900 K Chremophore� EL10 3 5 0.2 Geleol™ Pastilles Chremophore� EL10 3 5 0.2 Suppocire� NC Chremophore� EL
Surfactant 10 3 5 0.2 Compritol� 888ATO Tween� 8010 3 5 0.2 Compritol� 888ATO Tween� 2010 3 5 0.2 Compritol� 888ATO Chremophore� EL10 3 5 0.2 Compritol� 888ATO Pluronic� F68
Sonication time (ST) 1 3 5 0.2 Compritol� 888ATO Chremophore� EL5 3 5 0.2 Compritol� 888ATO Chremophore� EL10 3 5 0.2 Compritol� 888ATO Chremophore� EL15 3 5 0.2 Compritol� 888ATO Chremophore� EL30 3 5 0.2 Compritol� 888ATO Chremophore� EL
Surfactant concentration (SC) 10 0.5 5 0.2 Compritol� 888ATO Chremophore� EL10 1 5 0.2 Compritol� 888ATO Chremophore� EL10 2 5 0.2 Compritol� 888ATO Chremophore� EL10 3 5 0.2 Compritol� 888ATO Chremophore� EL10 4 5 0.2 Compritol� 888ATO Chremophore� EL10 5 5 0.2 Compritol� 888ATO Chremophore� EL
Drug concentration (DC) 10 3 5 0 Compritol� 888ATO Chremophore� EL10 3 5 0.1 Compritol� 888ATO Chremophore� EL10 3 5 0.2 Compritol� 888ATO Chremophore� EL10 3 5 0.5 Compritol� 888ATO Chremophore� EL10 3 5 0.75 Compritol� 888ATO Chremophore� EL10 3 5 1 Compritol� 888ATO Chremophore� EL10 3 5 2 Compritol� 888ATO Chremophore� EL
Lipid concentration (LC) 10 3 1 0.2 Compritol� 888ATO Chremophore� EL10 3 2.5 0.2 Compritol� 888ATO Chremophore� EL10 3 5 0.2 Compritol� 888ATO Chremophore� EL10 3 10 0.2 Compritol� 888ATO Chremophore� EL
Other 10 3 10 0.2 Compritol� 888ATO Chremophore� EL10 6 10 0.2 Compritol� 888ATO Chremophore� EL10 6 10 0.5 Compritol� 888ATO Chremophore� EL
S. Das et al. / European Journal of Pharmaceutical Sciences 47 (2012) 139–151 141
formed into solid nanoparticles at low temperature and producedsolid nanoparticle dispersion. The basic rule for the formulationof SLN/NLC is to maintain process temperature at least 5 �C abovethe melting point of the solid lipid (Wissing et al., 2004). As themelting point of the solid lipids were around 60–70 �C, the pro-cessing temperature was selected 75 �C.
Table 2Formulation design of NLCs.
Variables Compritol�
888ATO(% w/v)
Labrafac�
CC(% w/v)
Chremophore�
EL (% w/v)Drugconcentration(% w/v)
Solid to liquidlipid ratio
5a 0 3 0.24 1 3 0.23 2 3 0.22.5 2.5 3 0.22 3 3 0.21 4 3 0.20b 5 3 0.2
Chremophore� EL 3 2 1 0.23 2 2 0.23 2 3 0.23 2 4 0.2
Drugconcentration
3 2 3 03 2 3 0.23 2 3 0.53 2 3 1
a SLN.b Nanoemulsion.
Different formulations were prepared by varying the criticalformulation and process variables as listed in Table 1 (SLNs) andTable 2 (NLCs). Formulations were prepared in triplicate.
2.3. HPLC assay method for clotrimazole
The HPLC assay was performed using a Agilent HPLC (Agilent1100 series; USA). A reverse phase C18 column (ZORBAX EclipsePlus C18; 4.6x250 mm, 5 lm; Agilent, USA) was used as stationaryphase, whereas mixture of acetonitrile (40%) and 0.1% aqueoussolution of phosphoric acid (60%) was used as mobile phase. Thecolumn temperature, flow rate of mobile phase, injection volumeand detection wavelength were set at 25 �C, 1 mL/min, 25 lL and261 nm, respectively. The retention time of clotrimazole was foundto be 6.2 ± 0.1 min. The assay method was validated and calibra-tion curve was linear (r2 = 0.9995) within the concentration range10–250 lg/mL.
2.4. Characterizations
2.4.1. Particle size, polydispersity index and zeta potentialmeasurement
Particle size (z-average diameter) and polydispersity index (PI)of the SLNs/NLCs were measured by dynamic light scattering tech-nique using Malvern Zetasizer Nano ZS (Malvern Instruments, UK)at 25 �C (Das et al., 2012). Zeta potential (ZP) of the nanoparticledispersions was also measured by the same instrument. Beforemeasurement, the nanoparticle dispersion was appropriately

142 S. Das et al. / European Journal of Pharmaceutical Sciences 47 (2012) 139–151
diluted to yield a suitable scattering intensity (particle count ratebetween 100 and 1000 s�1) with ultra-pure water. For particle sizeand polydispersity index measurements, the diluted nanoparticledispersion was poured into the disposable sizing cuvette whichwas then placed in the cuvette holder of the instrument andanalyzed using the zetasizer software (DTS v 6.12, Malvern Instru-ments, UK). For zeta potential measurement, disposable foldedcapillary cuvette was used. Air bubbles, if any, were removed fromthe capillary before measurement. All measurements were per-formed in triplicate.
2.4.2. Drug loading and encapsulation efficiency measurementDrug loading and encapsulation efficiency were determined by
measuring the amount of encapsulated drug within the nanoparti-cles (Das et al., 2011). Briefly, unencapsulated insoluble drug (ifany) were first filtered out by filtering the nanoparticle dispersionthrough 3 lm nitrocellulose membrane filter (Millipore, Ireland).Then, methanol (9.5 mL) was added in the filtered formulation(0.5 mL) and mixed well with the help of a cyclomixer. This helpedextraction of drug from lipid to methanol. The mixture was thencentrifuged for 15 min at 5000 rpm and supernatant was collected.The drug concentration in the supernatant was measured by HPLCassay (Section 2.3). In addition to unencapsulated undissolveddrug, some portion of the unencapsulated drug might be dissolvedin the aqueous phase. Therefore, amount of soluble unencapsu-lated drug was measured by ultrafiltration method using centrifu-gal filter tubes with 10 kDa molecular weight cut-off (Centricert 1;Sartorius, Germany). Briefly, nanoparticle dispersion was putinto the centrifugal filter tube and centrifuged for 30 min at5000 rpm. Then, the amount of drug in the aqueous phase wasdetermined by HPLC assay (Section 2.3). Drug encapsulation effi-ciency (EE) and drug loading (L) were calculated using the follow-ing equations:
EE ð%Þ ¼ actual amount of drug in the filtered formulation� soluble unencapsulated drugamount of drug added during formulation
� 100
L ð%Þ ¼ actual amount of encapsulated drugamount of lipid used to prepare the formulation
� 100
All measurements were performed in triplicate.As filtration may compromise the results, both filtered and
unfiltered formulations were analyzed during HPLC analysis toclarify this concern (data not shown). There was no significantdifference in drug content/encapsulation between filtered andunfiltered formulations except the nanoparticle dispersions con-taining unencapsulated drug crystals. For example, some amountof drug remained unencapsulated at 2% drug concentration. Theseunencapsulated drug crystals needed to be filtered to know the ac-tual drug encapsulation. Otherwise, the drug encapsulation calcu-lation will report false high value. Therefore, filtration is necessary.Filter paper with relatively higher pore-size (3 lm) was used tomake sure that only unencapsulated drug crystals were filteredout but not the nanoparticles. The cross-polarized light microscopystudy of SLN/NLC at high drug-loading showed unencapsulateddrug crystals of more than 3 lm size (data not shown), whichjustify the selection of 3 lm filter paper.
2.4.3. Scanning electron microscopy studyAlthough some researchers have used SEM for the morphology
of SLNs (Varshosaz et al., 2010), the nanoparticles may not main-tain their integrity and solid state during SEM analysis due to theincrease in energy during measurment. Therefore, cryogenic fieldemission scanning electron microscopy (cryo-FESEM) was usedto examine shape, size and surface morphology of the SLNs/NLCs.
Briefly, few drops of the nanoparticle dispersion were placed ona copper stub and frozen in nitrogen slush at �196 �C. The frozensample was then stored in liquid nitrogen and transferred intothe cryo preparation chamber (GATAN ALTO 2500, UK) attachedto a FESEM (JEOL JSM-6700F, Japan), where the frozen samplewas freeze-fractured, sublimed for 30 s at �95 �C and sputter-coated with platinum for 120 s. Then the coated sample was placedonto the specimen stage of the FESEM at �140 �C and analyzed atan excitation voltage of 5 kV. In addition, pure clotrimazole powderwas analyzed by FESEM. Briefly, clotrimazole powder was placedon a copper stub with the help of double-sided adhesive tapeand sputter-coated with gold for 120 s at 20 mA. Then the samplewas analyzed in FESEM (JEOL JSM-6700F, Japan) at 5 kV.
2.4.4. Differential scanning calorimetry analysisPrior to differential scanning calorimetry (DSC) analysis, SLN
and NLC dispersions were lyophilized (VirTis benchtop lyophilizer,USA). Lipid (compritol 888ATO), drug (clotrimazole), drug-freeSLN, drug-loaded SLN, drug-free NLC and drug-loaded NLC weresubjected to DSC (Perkin Elmer, USA) analysis. Briefly, samples(�4–5 mg) were kept in the standard aluminum pans and sealed.Then the pans were placed under isothermal condition at 25 �Cfor 10 min. DSC analysis was performed at 10 �C/min from 25 to290 �C under a inert environment. An empty sealed pan was usedas reference. The thermograms of the samples were recorded.
2.4.5. X-ray diffraction studySimilar to DSC analysis, SLN and NLC dispersions were lyophi-
lized. Powder X-ray diffraction (PXRD) analysis of Lipid (compritol888ATO), drug (clotrimazole), drug-free SLN, drug-loaded SLN,drug-free NLC and drug-loaded NLC were conducted by a powderX-ray diffractometer (D8-ADVANCE; Bruker, Germany), whereCuKa radiation was used as X-ray source. For the analysis, sampleswere placed in the glass sample holders and scanned from 2� to 80�with a scan angular speed (2h/min) of 2�/min at 35 kV operatingvoltage and 40 mA current. The diffraction spectra were recorded.
2.5. Drug release study
The dialysis bag method was followed for the drug release study(Das et al., 2011; Hu et al., 2004). The day before the drug releaseexperiment, dialysis tube (10 kDa molecular cut off) was treatedclosely following the protocol (Sigma) and soaked in the releasemedia overnight. Phosphate buffer (10 mM, pH 7.4) containing 2%Tween� 80 was used as drug release media. Accurately measured1 mL formulation was placed in the dialysis tube and both end ofthe tube was tightly tied to prevent any leakage. The tube contain-ing formulation was then kept in an amber colored glass bottle con-taining 10 mL release media. The bottle was kept on a horizontalrotary shaker (Sartorius, Germany) rotating at 100 rpm. Samples(5 mL release media) were withdrawn from the bottle at the prede-termined time intervals and replaced by 5 mL fresh release media.The samples were then analyzed by HPLC (Section 2.3) to determinethe amount of drug released from the formulation at different timepoints. The experiments were performed in triplicate.
2.6. Stability study
SLN and NLC formulations were stored in the sealed amber col-ored glass vials at 2–8 �C and 25 �C (room temperature) under darkenvironment. The formulations were analyzed with respect to par-ticle size, polydispersity index, zeta potential, drug encapsulationefficiency and drug loading after 1 and 3 months of storage andcompared with fresh formulations. In addition, the drug releasestudy of the SLNs and NLCs stored at 2–8 �C for 3 months were

S. Das et al. / European Journal of Pharmaceutical Sciences 47 (2012) 139–151 143
performed and compared with the fresh formulations. The experi-ments were performed in triplicate.
3. Results and discussion
3.1. Particle size
Particle size of the nanoparticles is presented as z-averagediameter, which is basically mean hydrodynamic diameter of theparticles (Figs. 1 and 2). Particle size measurement was requiredto confirm the production of the particles in nano-range. The re-sults indicate that particle size was significantly influenced bymost of the formulation and process variables. Among the differentlipid tested, SLNs prepared using Compritol� 888ATO were small-est and SLNs prepared using Dynasan� 118 were biggest(Fig. 1A). Particle size of the SLNs prepared using Precirol� ATO5was also relatively small. However, no relationship between chem-ical structure of the lipids and particle size was observed. Thismight be because of the complex structure of these lipids. Particlesize decreased as follows: Dynasan� 118 > Geleol™ > Dynasan�
114 > Imwitor� 900 K > Suppocire� NC > Precirol� ATO5 > Compri-tol� 888ATO. Among the 4 non-ionic surfactant tested, SLNs pre-pared using Chremophore� EL demonstrated lowest size,whereas SLNs prepared using Pluronic� F68 demonstrated largestsize (Fig. 1B). In general, trend was: Chromophore� EL < Tween�
20 < Tween� 80 < Pluronic� F68. Hydrophilic-lipophilic balance(HLB) value of 12–16 is considered to be ideal for the productionof stable o/w emulsion. The HLB values of Chromophore� EL (12–14), Tween� 20 (�16) and Tween� 80 (�15) are within this range.In contrast, HLB value of Pluronic� F68 is very high (>24). Thismight be the main reason of bigger particle size when Pluronic�
F68 was used. Particle size dramatically decreased with increasingsonication time (Fig. 1C) and surfactant concentration (Fig. 1D). Inthis formulation technique, sonication was used to breakdown thecoarse emulsion drops to nano-scale (nanoemulsion). Longer soni-cation time provides more energy to breakdown the particles.Therefore, it is logical that longer sonication time led to smallerparticles as the sonication step directly influenced the final particlesize of the dispersion. However, the size reduction was not hugeabove 10 min sonication time. On the other hand, higher amountof surfactant reduced the surface tension of the melted lipid drops,which helped the breakdown of the lipid drops into smaller size.Additionally, enough surfactant was present to cover the tiny lipiddroplets’ surface at higher surfactant concentration, which stabi-lized and prevented the coalescence of the nanoemulsion droplets.Other researchers also noticed the reduction in particle size athigher surfactant concentration (Hu et al., 2004; Liu et al., 2007).Generally, nanoparticles prepared at low surfactant concentrationform aggregates during storage due to insufficient repulsionamong particles. Therefore, certain amount of surfactant concen-tration is required to produce stable nanoemulsion. However, aftercertain amount of surfactant concentration particle size and stabil-ity did not improve (data not shown). Regarding different drugconcentration, particle size was not significantly different up to0.75% drug concentration but particle size dramatically increasedabove 1% drug concentration (Fig. 1E). Huge augmentation of par-ticle size at 2% drug concentration must be due to the presence oflarge amount of unencapsulated drug crystals. The presence ofdrug crystals in the aqueous phase was confirmed by cross-polar-ized light microscopy (data not shown). Particle size significantlyincreased with increasing lipid concentration (Fig. 1F). Huge aug-mentation of particle size was observed at 10% lipid concentration.This is because the sonication energy more efficiently distributedin the dilute dispersion (i.e., lower lipid concentration) than theconcentrated dispersion (i.e., higher lipid concentration), which
produced smaller particles at lower lipid concentration. However,when 6% surfactant concentration was used together with 10% li-pid concentration, particle size was equivalent to SLNs preparedwith 3% surfactant concentration and 5% lipid concentration(Fig. 1G). Therefore, the results indicate that the ratio of surfactantconcentration and lipid concentration was important to maintainsmall particle size at 10% lipid concentration. Additionally, therewas no significant difference in particle size among 0.2%, 0.5%and 1% drug concentration when 6% surfactant concentrationwas used with 10% lipid concentration. Although 1% drug concen-tration showed larger size at 5% lipid concentration, smaller size at10% lipid concentration might be due to the availability of higheramount of lipid to encapsulate higher amount of drug (i.e., lessunencapsulated drug).
In case of NLCs, particle size increased with increasing percent-age of liquid lipid (Fig. 2A). NLCs prepared at 4:1 solid to liquid li-pid ratio showed significantly lower particle size than othercombinations, even lower than SLNs (prepared with only solid li-pid). NLCs prepared at 2.5:2.5, 2:3 and 1:4 solid to liquid lipid ratioshowed significantly higher particle size than the SLNs. Surpris-ingly, nanoemulsion (prepared with only liquid lipid) showedhighest particle size. Similar to SLNs, particle size of the NLCs sig-nificantly decreased with increasing surfactant concentration(Fig. 2B). When SLNs and NLCs are compared, NLCs were smallerthan SLNs at 1–2% surfactant concentration. In contrary, NLCs werelarger than SLNs at 4% surfactant concentration. However, therewas no significant difference in size between SLNs and NLCs at3% surfactant concentration. The reasons for such observationsare unknown to us. Similar to SLNs, particle size showed increasingtrend with increasing drug concentration (Fig. 2C). However, parti-cle sizes of SLNs and NLCs at same drug concentration were notsignificantly different.
3.2. Polydispersity index
Polydispersity index (PI) indicates the width of the particle sizedistribution, which ranges from 0 to 1. Theoretically, monodispersepopulations indicates PI = 0. However, PI < 0.2 is considered as nar-row size distribution. Therefore, PI measurement was essential toconfirm the narrow size distribution of the particles. Among thelipids, Compritol� 888ATO produced SLNs with lowest PI and Gele-ol™ produced SLNs with highest PI (Fig. 1A). Although Precirol�
ATO5 produced SLNs with low particle size, PI was relatively high.PI decreased as follows: Geleol™ > Dynasan� 118 > Suppocire�
NC > Dynasan� 114 > Imwitor� 900 K > Precirol� ATO5 > Compri-tol� 888ATO. Among the surfactants Chremophore� EL producedSLNs with lowest PI and Pluronic� F68 produced SLNs with highestPI (Fig. 1B). Such high PI in case of Pluronic� F68 can probably beexplained by its high HLB value as discussed before (Section 3.1).In general, trend was: Chromophore� EL < Tween� 80 < Tween�
20 < Pluronic� F68. PI decreased with increasing sonication time(up to 15 min) and surfactant concentration (Fig. 1C and D, respec-tively). PI was very high at 1–5 min sonication time and 0.5–1%surfactant concentration. The reasons for these observations withsonication time and surfactant concentration are similar as ex-plained in the previous section (Section 3.1). However, minorincrement of PI was noticed at 30 min sonication time and 5% sur-factant concentration. Surprisingly, PI also decreased with increas-ing drug concentration (up to 0.75%; Fig. 1E) and lipidconcentration (up to 5%; Fig. 1F). Higher PI at lower lipid concen-tration might be due to higher drug to lipid ratio as drug concen-tration remained same. Nevertheless, significant increment wasnoticed above 0.75% drug concentration and 10% lipid concentra-tion. As explained earlier, high PI at high drug concentration mightbe due to presence of unencapsulated drug molecules. Addition-ally, higher PI at 10% lipid concentration should be due to the

Fig. 1. Effect of formulation conditions on particle size, polydispersity index (PI), zeta potential (ZP) and drug encapsulation efficiency (EE) of SLNs. Data represent mean ± SD(n = 3). In case of Fig. 1G, SLNs were prepared at 10% lipid concentration. Here, Pre = Precirol� ATO5, Com = Compritol� 888ATO, D114 = Dynasan� 114, D118 = Dynasan� 118,Imw = Imwitor� 900 K, Gel = Geleol™, Sup = Suppocire� NC, T80 = Tween� 80, T20 = Tween� 20, Chremo = Chremophore� EL, PF68 = Pluronic� F68, DC = drug concentration,SC = surfactant concentration.
144 S. Das et al. / European Journal of Pharmaceutical Sciences 47 (2012) 139–151
concentrated dispersion as discussed in the previous section.Although particle size of the SLNs prepared at 10% lipid concentra-tion reduced when 6% surfactant concentration was used instead of3% surfactant concentration, PI was not significantly different at 3%and 6% surfactant concentration (Fig. 1G). In addition, there was nosignificant difference in PI at 0.2, 0.5 and 1% drug concentration as
10% lipid concentration was enough to encapsulate 1% drugconcentration.
PI values of NLCs were not significantly different at differentsolid to liquid lipid ratio (Fig. 2A). Similar to SLNs, PI of NLCsdecreased with increasing surfactant concentration (Fig. 2B).However, PI of SLNs was always lower than NLCs at same surfactant

Fig. 2. Effect of formulation conditions on particle size, polydispersity index (PI), zeta potential (ZP) and drug encapsulation efficiency (EE) of NLCs. Data represent mean ± SD(n = 3). Here, C:L = Compritol� 888ATO:Labrafac™ CC.
S. Das et al. / European Journal of Pharmaceutical Sciences 47 (2012) 139–151 145
concentration (except 1% SC). PI also decreased with increasingdrug concentration (up to 0.5%; Fig. 2C). By contrast, PI wasnoticeably high at 1% drug concentration due to the presence ofunencapsulated drug. However, PI of SLNs and NLCs was not signif-icantly different at same drug concentration.
3.3. Zeta potential
Zeta potential (ZP) refers to the surface charge of the particles.ZP (±) indicates the degree of repulsion between close and simi-larly charged particles in the dispersion. This repulsion force pre-vents aggregation of the particles. Therefore, ZP is a usefulparameter to predict the physical stability of the SLN/NLC disper-sions (Das and Chaudhury, 2011; Freitas and Müller, 1998). The re-sults indicate that ZP values were less than -20 mV for all preparedSLNs and NLCs, except SLNs prepared at 1% lipid concentration,NLCs prepared at 4:1 solid to liquid lipid ratio and nanoemulsion(Figs. 1 and 2). ZP of the SLNs prepared with different lipids de-creased as follows: Precirol� ATO5 > Compritol� 888ATO > Suppoc-ire� NC > Geleol™ > Dynasan� 114 > Imwitor� 900 K > Dynasan�
118 (Fig. 1A). In case of surfactant, general trend of ZP was: Tween�
80 > Pluronic� F68 > Tween� 20 > Chromophore� EL (Fig. 1B). Nospecific correlation was found between ZP of SLNs and sonicationtime (Fig. 1C). ZP of SLNs decreased with increasing surfactant con-centration (Fig. 1D) and drug concentration (0.1–1%; Fig. 1E),whereas increased with increasing lipid concentration (up to 5%;Fig. 1F). The observations for surfactant concentration might bedue to the use of non-ionic surfactant (Chremophore� EL). How-ever, ZP insignificantly decreased when 6% surfactant concentra-tion was used instead of 3% surfactant concentration togetherwith 10% lipid concentration (Fig. 1G). Enhancement of drug load-ing further subdued ZP.
There was no specific correlation between ZP and solid to liquidlipid ratio in NLCs (Fig. 2A). Similarly, no specific correlation waswitnessed between ZP and surfactant concentration in NLCs(Fig. 2B). However, ZP decreased with increasing drug concentra-
tion (Fig. 2C). Interestingly, ZPs were higher in SLNs than NLCs atsame surfactant concentration and drug concentration (except at1% drug concentration). Generally, ZP value more than +20 or lessthan �20 mV predicts good physical stability of nanoparticle dis-persion. Therefore, most of the nanoparticle dispersions preparedis expected to be stable. However, this assumption is not alwaystrue. Therefore, actual stability of the optimized SLN and NLC dis-persions were checked by conducting stability experiments (seestability study).
3.4. Drug encapsulation efficiency
Drug encapsulation efficiency (EE) was highest and lowestwhen SLNs were prepared with Compritol� 888ATO (>87%) andDynasan� 118 (<76%) as lipid, respectively (Fig. 1A). SLNs preparedwith Precirol ATO5, Geleol™ and Imwitor� 900 K also exhibitedEE > 80%. SLNs prepared with other lipids showed significantlylower EE although EE was > 75% in all cases. EE decreased as fol-lows: Compritol� 888ATO > Precirol� ATO5 > Geleol™ > Imwitor�
900 K > Suppocire� NC > Dynasan� 114 > Dynasan� 118. SLNs pre-pared with Chromophore� EL as surfactant showed highest EE(>87%) (Fig. 1B). However, EE was > 79% when SLNs prepared withother surfactants too. General trend of EE was: Chromophore�
EL > Tween� 20 > Tween� 80 > Pluronic� F68. The results showedthat EE of SLNs was not dependant on sonication time (Fig. 1C).However, EE of SLNs significantly increased with increasing surfac-tant concentration (Fig. 1D). Similar trend was noticed by otherresearchers (Liu et al., 2007). This might be due to the efficientloading and retention of drug molecules within the nanoparticlematrix or nanoparticle surface at higher surfactant concentration.However, insignificant increase in EE was noticed above 2% surfac-tant concentration. Opposite trend was noticed in case of drug con-centration (Fig. 1E). It is plausible as drug to lipid ratio increasedwith increasing drug concentration. EE was very low at 2% drugconcentration. This is because of the amount of drug added was be-yond the encapsulation capacity of the amount of lipid used.

146 S. Das et al. / European Journal of Pharmaceutical Sciences 47 (2012) 139–151
Therefore, many drug molecules remained unencapsulated at 2%drug concentration. EE increased with increasing lipid concentra-tion (Fig. 1F). This is reasonable as higher amount of lipid wasavailable to encapsulate drug molecules at higher lipid concentra-tion. EE of 10% lipid concentration was very high (>92%). However,EE of SLNs prepared at 10% lipid concentration was not signifi-cantly different at 3% and 6% surfactant concentration (Fig. 1G).This might be due to the presence of enough lipid to encapsulatethe drug molecules (low drug to lipid ratio). Nevertheless, EE ofSLNs prepared at 10% lipid concentration decreased at higher drugconcentration as expected.
EE of NLCs prepared at different solid to liquid lipid was not sig-nificantly different (Fig. 2A). Similar to SLNs, EE of NLCs signifi-cantly increased with increasing surfactant concentration (up to
Fig. 3. SEM images of clotrimazole (A), solid lipid nanopar
Fig. 4. DSC analysis of drug (Clotrimazole), lipid (Compritol� 888ATO), drug-free SLN, druNLC).
3% surfactant concentration; no difference in EE at 3% and 4% sur-factant concentration; Fig. 2B) and decreased with increasing drugconcentration (Fig. 2C). However, EE of SLNs and NLCs were notsignificantly different at same surfactant concentration and drugconcentration.
3.5. Scanning electron microscopy
Fig. 3A represents the scanning electron microscopy (SEM)image of clotrimazole powder, which demonstrates crystallinestructure of clotrimazole. As particle size, shape and surface mor-phology of the nanoparticles in the dispersion might be properlyinvestigated by investigating the samples in frozen condition (thesamples are investigated close to their natural state), cryogenic
ticles (B and C) and nanostructured lipid carriers (D).
g-loaded SLN (Cotrimazole-SLN), drug-free NLC and drug-loaded NLC (Clotrimazole-

Fig. 5. XRD analysis of drug (Clotrimazole), lipid (Compritol� 888ATO), drug-free SLN, drug-loaded SLN (Clotrimazole-SLN), drug-free NLC and drug-loaded NLC(Clotrimazole-NLC): 2–80� (A), 2–6� (B) and 10–30� (C).
S. Das et al. / European Journal of Pharmaceutical Sciences 47 (2012) 139–151 147

148 S. Das et al. / European Journal of Pharmaceutical Sciences 47 (2012) 139–151
field emission scanning electron microscopy (cryo-FESEM) experi-ment was performed for the nanoparticle dispersions (Das andChaudhury, 2011). SLNs prepared at sonication time = 10 min,Compritol� 888ATO = 5%, Chremophore� EL = 3% and clotrima-zole = 0.2%, whereas NLCs prepared at sonication time = 10 min,Compritol� 888ATO = 3%, Labrafac� CC = 2%, Chremophore�
EL = 3% and clotrimazole = 0.2% were used for this study. TheseSLNs and NLCs were also used for differential scanning calorimetry(DSC) and X-ray diffraction (XRD) analysis. Fig. 3B and 3C depictSEM images of SLNs, while Fig. 3D depicts SEM image of NLCs.The images indicate that both SLNs and NLCs were spherical withsize between 50 and 150 nm. Although it was not common, someparticle agglomerates were observed (Fig. 3C). Otherwise, distinctparticles like Fig. 3B and D were observed for SLNs and NLCs,respectively. The particle aggregations might be due to sticky nat-ure of the lipid. Surface morphology of both SLNs and NLCs weresmooth and there is no visible difference between them (Fig. 3B–D). The crystalline structures of clotrimazole were absent in theSEM images of SLNs and NLCs, which suggests absence of unencap-sulated undissolved drug crystals in the dispersions.
3.6. Differential scanning calorimetry
Fig. 4 depicts the differential scanning calorimetry (DSC) profileof drug, lipid, drug-free SLNs, drug-loaded SLNs, drug-free NLCsand drug-loaded NLCs. The sharp peak at 145.4 �C corresponds tomelting peak of clotrimazole crystals, which is absent in the ther-mogram of clotrimazole-loaded SLNs and NLCs. This indicateseither complete solubilization of clotrimazole in the lipid matrixor transformation of clotrimazole crystal to amorphous form thathas been dispersed in the lipid matrix. The endothermic peak ofCompritol� 888ATO (74.7 �C) shifted to 71.0 �C and 70.5 �C in
Fig. 6. Drug release plots. Comparison of drug release from SLNs and NLCs at 4% (SLN-4media volume (10 mL versus 20 mL) on drug release from SLN-8% (B). Effect of dilution oold SLN-4% and NLC-4% stored at 2–8 �C (D). Data represent mean ± SD (n = 3).
drug-free SLNs and clotrimazole-loaded SLNs, respectively. Thisshift might be due to formation of nanoparticles with surfactant(drug-free SLNs) as well as presence of drug (clotrimazole-loadedSLNs). Reduced peak heights/areas probably indicate reduction oflipid crystallinity in the SLNs. The endothermic peak was furthershifted to, 67.3 and 66.9 �C in drug-free and drug-loaded NLCs,respectively. In case of NLC, the nanoparticle matrix was composedof mixture of lipids (solid and liquid lipids) instead of only solid li-pid of SLN matrix. Although the mixture of solid and liquid lipidswas solid at room temperature, obviously the chemical character-istics of the mixture were different from the solid lipid only. Eitherthe liquid lipid was molecularly dispersed in the solid lipid or thenanodroplets of the liquid lipid were dispersed in the solid lipid.Therefore, the shift of the peak should be due to the NLC matrixwhich is composed of the mixture of lipids and presence of drug(drug-loaded NLCs). The peak heights/areas were further reducedin case of NLCs. This probably indicates reduced crystallinity ofthe lipid matrix in NLCs, which should be due to the lipid mixture(less solid lipid crystals).
3.7. X-ray diffraction
Fig. 5 presents powder X-ray diffraction (PXRD) profiles of drug,lipid, drug-free SLNs, drug-loaded SLNs, drug-free NLCs and drug-loaded NLCs. The X-ray diffractogram of clotrimazole demon-strated crystalline peaks which indicate crystalline nature of clo-trimazole. Difractogram of drug-free SLNs was different thanlipid alone (Compritol� 888ATO). The intensity (or area) of thesharp peaks at 4.3� and 23.4� as well as the broad peak at 13.3� in-creased, while the intensity of the large peak at 21.2� decreased indrug-free SLN. In addition, an extra peak at 19.3� was observed.Therefore, the study demonstrates that the crystalline structure
% and NLC-4%) and 8% (SLN-8% and NLC-8%) drug to lipid ratio (A). Effect of releasef SLNs-4% on drug release (C). Comparison of drug release from fresh and 3 months

Fig. 7. Drug release kinetics of SLNs and NLCs at 4% (SLN-4% and NLC-4%) and 8% (SLN-8% and NLC-8%) drug to lipid ratio: Zero order (A) and Higuchi model (B).
Table 3Stability profile of SLNs and NLCs.
Samples 2–8 �C 25 �C
SLN-4% NLC-4% SLN-10% NLC-10% SLN-4% NLC-4% SLN-10% NLC-10%
Size (nm)Fresh 85.7 ± 3.0 84.6 ± 4.3 85.0 ± 1.1 90.7 ± 1.0 85.7 ± 3.0 84.6 ± 4.3 85.0 ± 1.1 90.7 ± 1.01 month 90.5 ± 1.3 89.2 ± 6.1 98.2 ± 5.4 95.4 ± 7.3 92.3 ± 4.8 91.5 ± 5.1 124.7 ± 7.9 116.4 ± 6.53 months 92.6 ± 7.1 91.4 ± 8.6 99.8 ± 5.2 97.1 ± 6.3 101.2 ± 7.2 98.3 ± 5.8 178.6 ± 9.1 156.1 ± 7.7
PIFresh 0.15 ± 0.03 0.17 ± 0.04 0.13 ± 0.01 0.16 ± 0.01 0.15 ± 0.03 0.17 ± 0.04 0.13 ± 0.01 0.16 ± 0.011 month 0.15 ± 0.02 0.17 ± 0.03 0.17 ± 0.02 0.17 ± 0.02 0.16 ± 0.02 0.18 ± 0.02 0.20 ± 0.03 0.20 ± 0.033 months 0.17 ± 0.03 0.18 ± 0.03 0.18 ± 0.03 0.19 ± 0.03 0.19 ± 0.03 0.18 ± 0.03 0.25 ± 0.03 0.23 ± 0.04
ZP (�mV)Fresh 29.5 ± 4.1 26.7 ± 2.6 24.5 ± 0.7 22.2 ± 0.4 29.5 ± 4.1 26.7 ± 2.6 24.5 ± 0.7 22.2 ± 0.41 month 28.8 ± 1.2 24.6 ± 3.8 23.2 ± 2.6 21.1 ± 3.0 28.5 ± 2.1 24.5 ± 2.7 22.9 ± 2.9 20.6 ± 1.83 months 25.8 ± 3.0 22.9 ± 2.6 20.5 ± 3.1 20.0 ± 2.4 24.9 ± 3.1 21.5 ± 2.4 17.2 ± 1.5 17.1 ± 2.1
EE (%)Fresh 87.5 ± 1.4 89.7 ± 4.5 82.8 ± 2.9 85.1 ± 2.4 87.5 ± 1.4 89.7 ± 4.5 82.8 ± 2.9 85.1 ± 2.41 month 86.1 ± 2.6 88.3 ± 3.3 81.7 ± 3.4 84.6 ± 3.3 85.8 ± 3.6 86.1 ± 5.4 77.6 ± 3.4 80.7 ± 3.83 months 84.7 ± 4.0 86.6 ± 2.2 75.7 ± 4.0 78.7 ± 3.8 81.5 ± 3.0 83.8 ± 2.8 66.9 ± 3.9 75.0 ± 3.9
L (%)Fresh 3.5 ± 0.1 3.6 ± 0.2 7.2 ± 1.0 7.4 ± 0.8 3.5 ± 0.1 3.6 ± 0.2 7.2 ± 1.0 7.4 ± 0.81 month 3.4 ± 0.1 3.5 ± 0.1 7.1 ± 0.7 7.3 ± 0.8 3.4 ± 0.1 3.4 ± 0.2 6.7 ± 0.6 7.0 ± 0.93 months 3.4 ± 0.2 3.5 ± 0.1 6.5 ± 0.7 6.8 ± 1.1 3.3 ± 0.1 3.4 ± 0.1 5.8 ± 1.1 6.5 ± 1.2
Here, PI = polydispersity index, ZP = zeta potential, EE = drug encapsulation efficiency, L = drug loading, SLN-4% = SLNs at 4% drug to lipid ratio, NLC-4% = NLCs at 4% drug tolipid ratio, SLN-10% = SLNs at 10% drug to lipid ratio, NLC-10% = NLCs at 10% drug to lipid ratio.
S. Das et al. / European Journal of Pharmaceutical Sciences 47 (2012) 139–151 149

150 S. Das et al. / European Journal of Pharmaceutical Sciences 47 (2012) 139–151
of the lipid slightly changed after formation of nanoparticles withsurfactant. Although the peaks of drug-free SLN at 21.2� and23.4� slightly shifted to 21.3� and 23.5� in drug-loaded SLN, thesedifferences are insignificant. This indicates that encapsulation ofclotrimazole in the lipid matrix of SLNs did not influence lipid ma-trix structure. The crystalline peaks of clotrimazole were absent inclotrimazole-loaded SLNs and NLCs. In addition, the mixtures ofthe components at the same ratio as used in the SLNs and NLCswere studied after applying the same temperature programs butwithout homogenization (data not shown). The crystalline peaksof clotrimazole disappeared in those cases too. As HPLC analysisduring drug encapsulation studies (by ultrafiltration method) indi-cated miceller solubilization of clotrimazole by surfactant in theaqueous phase was very low, this disappearance of crystallinepeaks of clotrimazole may signify different phenomena: either clo-trimazole was converted to amorphous form in the lipid matrix orclotrimazole was solubilized in the lipid matrix or clotrimazoleformed droplets of a liquid solution with surfactant and lipids.However, initial rapid drug release from SLNs and NLCs and en-hanced drug release rate of diluted SLN formulation (Section 3.8)probably indicate that some amount of clotrimazole was ad-sorbed/concentrated at the particles’ surface or outer layer withthe help of surfactant. Nevertheless, visible difference was ob-served between the diffractograms of SLNs and NLCs, which mightbe due to presence of lipid mixture (solid and liquid lipid) in NLCs..The peaks of SLN at 4.3� and 19.3� shifted to 4.5� and 19.4� in NLCand peak intensity/area increased. Although the position of thepeak at 21.3� remained same, peak intensity/area decreased. More-over, the peak at 23.5� became broad. Therefore, the study clearlyindicated the change in crystalline behavior of the NLC lipid ma-trix. Nevertheless, there was no difference in diffractograms be-tween drug-free and drug-loaded NLCs. Therefore, the resultssuggest successful incorporation of clotrimazole within SLN andNLC matrix as unencapsulated drug molecules would have con-verted to crystalline forms due to its poor aqueous solubility,which would have been detected in the diffractogram.
3.8. Drug release
SLNs prepared at sonication time = 10 min, Compritol�
888ATO = 5% and Chremophore� EL = 3%, whereas NLCs preparedat sonication time = 10 min, Compritol� 888ATO = 3%, Labrafac�
CC = 2% and Chremophore� EL = 3% were used for drug releasestudy. 4 types of SLNs and NLCs (2 SLNs and 2 NLCs) were selectedfor the study: (i) SLNs with 0.2% drug concentration or 4% drug tolipid ratio (SLN-4%), (ii) SLNs with 0.4% drug concentration or 8%drug to lipid ratio (SLN-8%), (iii) NLCs with 0.2% drug concentrationor 4% drug to lipid ratio (NLC-4%) and (iv) NLCs with 0.4% drug con-centration or 8% drug to lipid ratio (NLC-8%). Cumulative drug re-lease from the nanoparticle dispersions were plotted against time(Fig. 6). All the tested formulations demonstrated controlled drugrelease. SLNs and NLCs prepared at 4% drug to lipid ratio (i.e.,SLN-4% and NLC-4%) showed sustained and prolonged drug release(Fig. 6A). However, drug release rate of NLC-4% was significantlyfaster than SLN-4% (�56.6% versus �42.5% at 80 h). Surprisingly,both SLNs and NLCs prepared at 8% drug to lipid ratio (i.e., SLN-8% and NLC-8%) showed significantly slower drug release rate thantheir counterparts with 4% drug to lipid ratio. Nevertheless, therewas no significant difference in drug release profile or rate betweenSLN-8% and NLC-8% (�19.7% and 21.4% at 80 h, respectively).
Such lower drug release at 8% drug to lipid ratio than 4% drug tolipid ratio might be due to absence of proper sink condition duringdrug release study as drug amount was doubled but volume of re-lease media was same (10 mL). Therefore, another drug releaseexperiment was performed on SLNs prepared with 8% drug to lipidratio using 20 mL release media (Fig. 6B). The result indicates
slightly faster drug release when 20 mL release media was usedthan 10 mL release media (�26.8% versus �19.7% at 80 h). How-ever, the drug release was significantly lower than the SLNs pre-pared at 4% drug to lipid ratio. Therefore, the results suggest thataugmentation of drug loading led to slower drug release.
In another experiment, effect of dilution of formulation on drugrelease was investigated. The experiment was performed as formu-lation is diluted after oral ingestion (in gastric fluid) or intravenousinjection (in blood), whereas almost no dilution occur during top-ical application on skin. In this experiment, SLN dispersion was di-luted 5 times with ultrapure water and then release study wasperformed in 10 mL release media (Fig. 6C). The results showedhuge improvement in drug release rate after dilution (�42.5% be-fore dilution and �71.4% after dilution at 80 h). Therefore, the re-sults point out significant effect of dilution on drug release fromthe formulation. Therefore, the study suggests that the drug releaseexperiment should be properly designed depending on the purposeof use.
The drug release data were fitted with 2 common release kinet-ics model: (i) zero order model and (ii) Higuchi model. Cumula-tive% drug release versus time and cumulative% drug releaseversus square root of time were plotted for zero order (Fig. 7A)and Higuchi model (Fig. 7B), respectively. The plots indicate thatSLN-8%, NLC-8% and SLN-4% most appropriately fitted with zeroorder release kinetics when release study was performed in10 mL release media. In contrary, NLC-4% most appropriately fittedwith Higuchi release kinetics at the same release condition. Con-sidering the lipid nanoparticle matrix and aqueous release media,the drug release was most probably diffusion controlled release.However, relatively faster drug release from the formulations atinitial period might be from the outer layer or surface of the parti-cles and/or from the unencapsulated dissolved drug molecules(very low) in the aqueous phase of the nanoparticle dispersions.
3.9. Stability
The stability study was performed for 4 formulations: SLN-4%,NLC-4%, SLN-10%, and NLC-10% (Table 3). SLN-10% and NLC-10%indicate the SLNs and NLCs with 10% drug to lipid ratio (i.e., 0.5%drug concentration). Other formulation conditions were same asthe formulations prepared for drug release study. An increasingtrend of particle size and polydispersity index (PI), and decreasingtrend of zeta potential (ZP), drug encapsulation efficiency (EE) anddrug loading (L) were observed with storage time at 2-8 �C.However, the changes were not significant for the formulationsprepared at low drug concentration (SLN-4% and NLC-4%). Formu-lations prepared at high drug concentration (SLN-10% and NLC-10%) demonstrated noticeably larger particle size, lower EE andlower L. Nevertheless, significant augmentation of particle sizeand PI, and diminution of ZP, EE and L were observed when formu-lations were stored at 25 �C. The augmentation of particle size andPI, and diminution of ZP, EE and L were significantly higher whenhigher amount of drug was incorporated (SLN-10% and NLC-10%).Among the formulations, NLCs were more stable than SLNs. How-ever, this difference was mainly observed at high drug concentra-tion (SLN-10% and NLC-10%). The results suggest that formulationsshould be stored at 2-8 �C, especially when high amount of drugneeds to incorporate into the formulations. The formulations pre-pared at high drug loading (SLN-10% and NLC-10%) were unstableat 25 �C. The results also indicate relatively better stability of NLCsthan SLNs, especially at 25 �C at high drug loading.
To evaluate any changes of drug release profile during storage,drug release study of SLN-4% and NLC-4% stored at 2–8 �C for3 months were performed and compared with the fresh formula-tions (Fig. 6D). Although sustained and prolonged drug releasewas observed from both formulations after 3 months storage, drug

S. Das et al. / European Journal of Pharmaceutical Sciences 47 (2012) 139–151 151
release was relatively faster from SLNs stored for 3 months thanfresh SLNs. This faster drug release might be due to rearrangement(more ordered structure) of crystal lattice in the SLN lipid matrixover time, which forced some of the drug molecules to migrate to-wards nanoparticle surface. On the other hand, within the experi-mental error the drug release rate of 3 months old NLCs comparedto freshly prepared NLCs was the same.
4. Conclusion
In this study, SLNs and NLCs containing antifungal agent clo-trimazole were successfully prepared by emulsification-ultrasoni-cation method. The study suggests the importance of controllingthe critical formulation and process parameters during formulationas they greatly influenced the final product, such as particle size,polydispersity index, zeta potential, drug encapsulation efficiency.SEM images indicate nano-sized spherical particles with smoothsurface. Chemical characterizations (DSC and XRD) demonstratedslight difference in crystal structure between SLNs and NLCs,although crystalline peak(s) of clotrimazole disappeared in bothSLNs and NLCs. Sustained drug release was observed from SLNsand NLCs. In the comparative study, NLCs exhibited faster drug re-lease than SLNs at the low drug-loading. Both tested SLNs and NLCswere stable at 2–8 �C even at high drug-loading and also stable at25 �C at low-drug-loading. However, tested NLCs exhibited betterstability than tested SLNs at high drug-loading especially at25 �C. Drug release profile of tested SLNs changed during storage,whereas no significant change in drug release rate was observedfrom tested NLCs. However, different stabilizing routes may havedifferent stabilizing efficiency. Therefore, it will be appropriate toconclude that the tested NLCs showed better stability than testedSLNs when the same type and amount of stabilizing ingredientswere used. Although, both SLNs and NLCs can be used as effectivecarriers of lipophilic drugs depending on the desired drug releaseprofile, NLCs might be a better option than SLNs. Nevertheless, dif-ferent stabilizing routes need to be evaluated in future.
Acknowledgements
This work was supported by the grant ICES/10-125A01 (S. Das)provided by the Science and Engineering Research Council ofA⁄STAR (Agency for Science, Technology and Research), Singapore.We would like to thank Ms. Annie Wong (Research Engineer), Mr.How Jie Wei, Ms. Joo Wei Xin and Ms. Yi Ling (industrial attachmentstudents) for their assistance in the experiments. We are grateful toMr. Ng Jun Wei and Mr. Mark Ng for their technical assistance.
References
Almeida, A.J., Souto, E., 2007. Solid lipid nanoparticles as a drug delivery system forpeptides and proteins. Adv. Drug Deliv. Rev. 59, 478–490.
Brugnara, C., De Franceschi, L., Armsby, C.C., Saadane, N., Trudel, M., Beuzard, Y.,Rittenhouse, A., Rifai, N., Platt, O., Alper, S.L., 1995. A new therapeutic approachfor sickle cell disease. Blockade of the red cell Ca(2+)-activated K+ channel byclotrimazole. Ann. N. Y. Acad. Sci. 763, 262–271.
Chen, C.C., Tsai, T.H., Huang, Z.R., Fang, J.Y., 2010. Effects of lipophilic emulsifiers onthe oral administration of lovastatin from nanostructured lipid carriers:physicochemical characterization and pharmacokinetics. Eur. J. Pharm.Biopharm. 74, 474–482.
Das, S., Chaudhury, A., 2011. Recent advances in lipid nanoparticle formulationswith solid matrix for oral drug delivery. AAPS PharmSciTech 12, 62–76.
Das, S., Ng, W.K., Kanaujia, P., Kim, S., Tan, R.B.H., 2011. Formulation design,preparation and physicochemical characterizations of solid lipid nanoparticlescontaining a hydrophobic drug: effects of process variables. Colloids Surf. B:Biointerfaces 88, 483–489.
Das, S., Ng, W.K., Tan, R.B.H., 2012. Development and in vitro evaluations of a lipidnanoparticle formulation containing tretinoin. In: Tiddy, G., Tan, R.B.H. (Eds.),NanoFormulation. RSC Publishing, London, pp. 38–52.
Freitas, C., Müller, R.H., 1998. Effect of light and temperature on zeta potential andphysical stability in solid lipid nanoparticle (SLN�) dispersions. Int. J. Pharm.168, 221–229.
Freitas, C., Müller, R.H., 1999. Correlation between long-term stability of solid lipidnanoparticles (SLN(™)) and crystallinity of the lipid phase. Eur. J. Pharm.Biopharm. 47, 125–132.
Gershkovich, P., Hoffman, A., 2007. Effect of a high-fat meal on absorption anddisposition of lipophilic compounds: the importance of degree of associationwith triglyceride-rich lipoproteins. Eur. J. Pharm. Sci. 32, 24–32.
Hanafy, A., Spahn-Langguth, H., Vergnault, G., Grenier, P., Tubic Grozdanis, M.,Lenhardt, T., Langguth, P., 2007. Pharmacokinetic evaluation of oral fenofibratenanosuspensions and SLN in comparison to conventional suspensions ofmicronized drug. Adv. Drug Deliv. Rev. 59, 419–426.
Hu, L., Tang, X., Cui, F., 2004. Solid lipid nanoparticles (SLNs) to improve oralbioavailability of poorly soluble drugs. J. Pharm. Pharmacol. 56, 1527–1535.
Kast, C.E., Valenta, C., Leopold, M., Bernkop-Schnurch, A., 2002. Design and in vitroevaluation of a novel bioadhesive vaginal drug delivery system for clotrimazole.J. Control. Release 81, 347–354.
Kovacevic, A., Savic, S., Vuleta, G., Muller, R.H., Keck, C.M., 2011. Polyhydroxysurfactants for the formulation of lipid nanoparticles (SLN and NLC): effects onsize, physical stability and particle matrix structure. Int. J. Pharm. 406, 163–172.
Liu, J., Hu, W., Chen, H., Ni, Q., Xu, H., Yang, X., 2007. Isotretinoin-loaded solid lipidnanoparticles with skin targeting for topical delivery. Int. J. Pharm. 328, 191–195.
Muchow, M., Maincent, P., Muller, R.H., 2008. Lipid nanoparticles with a solidmatrix (SLN�, NLC�, LDC�) for oral drug delivery. Drug Dev. Ind. Pharm. 34,1394–1405.
Müller, R.H., Maassen, S., Weyhers, H., Mehnert, W., 1996. Phagocytic uptake andcytotoxicity of solid lipid nanoparticles (SLN) sterically stabilized withpoloxamine 908 and poloxamer 407. J. Drug Targeting 4, 161–170.
Müller, R.H., Mader, K., Gohla, S., 2000. Solid lipid nanoparticles (SLN) for controlleddrug delivery – a review of the state of the art. Eur. J. Pharm. Biopharm. 50, 161–177.
Müller, R.H., Radtke, M., Wissing, S.A., 2002a. Nanostructured lipid matrices forimproved microencapsulation of drugs. Int. J. Pharm. 242, 121–128.
Müller, R.H., Radtke, M., Wissing, S.A., 2002b. Solid lipid nanoparticles (SLN) andnanostructured lipid carriers (NLC) in cosmetic and dermatologicalpreparations. Adv. Drug Deliv. Rev. 54, S131–S155.
Müller, R.H., Petersen, R.D., Hommoss, A., Pardeike, J., 2007. Nanostructured lipidcarriers (NLC) in cosmetic dermal products. Adv. Drug Deliv. Rev. 59, 522–530.
Pardeike, J., Hommoss, A., Müller, R.H., 2009. Lipid nanoparticles (SLN, NLC) incosmetic and pharmaceutical dermal products. Int. J. Pharm. 366, 170–184.
Pouton, C.W., 2006. Formulation of poorly water-soluble drugs for oraladministration: physicochemical and physiological issues and the lipidformulation classification system. Eur. J. Pharm. Sci. 29, 278–287.
Prabagar, B., Yoo, B.K., Woo, J.S., Kim, J.A., Rhee, J.D., Piao, M.G., Choi, H.G., Yong, C.S.,2007. Enhanced bioavailability of poorly water-soluble clotrimazole byinclusion with beta-cyclodextrin. Arch. Pharm. Res. 30, 249–254.
Radtke, M., Souto, E.B., Müller, R.H., 2005. Nanostructured lipid carriers: a novelgeneration of solid lipid drug carriers. Pharm. Technol. Eur. 17, 45–50.
Saupe, A., Gordon, K.C., Rades, T., 2006. Structural investigations on nanoemulsions,solid lipid nanoparticles and nanostructured lipid carriers by cryo-fieldemission scanning electron microscopy and Raman spectroscopy. Int. J.Pharm. 314, 56–62.
Schafer-Korting, M., Mehnert, W., Korting, H.C., 2007. Lipid nanoparticles forimproved topical application of drugs for skin diseases. Adv. Drug Deliv. Rev. 59,427–443.
Souto, E.B., Müller, R.H., 2007. Rheological and in vitro release behaviour ofclotrimazole-containing aqueous SLN dispersions and commercial creams.Pharmazie 62, 505–509.
Souza, L.G., Silva, E.J., Martins, A.L., Mota, M.F., Braga, R.C., Lima, E.M., Valadares,M.C., Taveira, S.F., Marreto, R.N., 2011. Development of topotecan loaded lipidnanoparticles for chemical stabilization and prolonged release. Eur. J. Pharm.Biopharm. 79, 189–196.
Tiwari, R., Pathak, K., 2011. Nanostructured lipid carrier versus solid lipidnanoparticles of simvastatin: comparative analysis of characteristics,pharmacokinetics and tissue uptake. Int. J. Pharm. 415, 232–243.
Varshosaz, J., Minayian, M., Moazen, E., 2010. Enhancement of oral bioavailability ofpentoxifylline by solid lipid nanoparticles. J. Liposome Res. 20, 115–123.
Vazquez, J.A., 2000. Therapeutic options for the management of oropharyngeal andesophageal candidiasis in HIV/AIDS patients. HIV Clin. Trials 1, 47–59.
Westesen, K., Bunjes, H., Koch, M.H.J., 1997. Physicochemical characterization oflipid nanoparticles and evaluation of their drug loading capacity and sustainedrelease potential. J. Control. Release 48, 223–236.
Wissing, S.A., Kayser, O., Muller, R.H., 2004. Solid lipid nanoparticles for parenteraldrug delivery. Adv. Drug Deliv. Rev. 56, 1257–1272.
Wong, H.L., Bendayan, R., Rauth, A.M., Li, Y., Wu, X.Y., 2007. Chemotherapy withanticancer drugs encapsulated in solid lipid nanoparticles. Adv. Drug Deliv. Rev.59, 491–504.
Yong, C.S., Li, D.X., Prabagar, B., Park, B.C., Yi, S.J., Yoo, B.K., Lyoo, W.S., Woo, J.S.,Rhee, J.D., Kim, J.A., Choi, H.G., 2007. The effect of beta-cyclodextrincomplexation on the bioavailability and hepatotoxicity of clotrimazole.Pharmazie 62, 756–759.


![Solid Lipid Nanoparticles: A Modern Formulation Approach ...Nanostructured lipid carriers (NLC): NLC were introduced to overcome the potential difficulties with SLNs[7-9]. The goal](https://static.fdocuments.us/doc/165x107/5ed4ad27d18c7b5d8f4ba776/solid-lipid-nanoparticles-a-modern-formulation-approach-nanostructured-lipid.jpg)