Are long-term earnings targets forecasts? · Are long-term earnings targets forecasts? ... Focusing...
44
Are long-term earnings targets forecasts? Heidi A. Packard MIT Sloan School of Management [email protected] Current draft: November 8, 2017 Abstract This paper examines whether earnings targets used in long-term performance-based compensation plans predict future performance. Using a sample of targets from long-term grants made to CEOs from 2007 to 2011, I find that earnings targets predict earnings outcomes, suggesting that firms rely on their internal budgeting at the time of grant to set targets. Later, upon disclosure, long-term performance targets provide new information to outsiders about future cash flows. I further find analysts revise their forecasts according to the information disclosed in targets. These findings are robust to variation in cross-sectional factors such as monitoring, agency conflicts, financial reporting concerns, and the availability of traditional management forecasts. To my knowledge, this analysis is the first to document a forecasting role for the long-term targets used in earnings-based compensation plans. I am grateful to the members of my dissertation committee for their guidance and support: John Core (chair), Rodrigo Verdi, and Joe Weber. I also thank Inna Abramova, Natalie Berfeld, Valère Fourel, Jacquelyn Gillette, Bill Goulding, Daniel Green, Nat Gregory, Nick Guest, Michelle Hanlon, Scott Keating, Jinhwan Kim, SP Kothari, Chris Noe, Suzie Noh, Daniel Rock, Georg Rickmann, Delphine Samuels, Nemit Shroff, Eric So, Andrew Sutherland, Ben Yost, and seminar participants at MIT for helpful comments and assistance. I gratefully acknowledge financial support from MIT Sloan and the Deloitte Foundation.
-
Upload
phunghuong -
Category
Documents
-
view
222 -
download
3
Transcript of Are long-term earnings targets forecasts? · Are long-term earnings targets forecasts? ... Focusing...
Are long-term earnings targets forecasts?
Heidi A. Packard MIT Sloan School of Management
Current draft: November 8, 2017
Abstract
This paper examines whether earnings targets used in long-term performance-based compensation plans predict future performance. Using a sample of targets from long-term grants made to CEOs from 2007 to 2011, I find that earnings targets predict earnings outcomes, suggesting that firms rely on their internal budgeting at the time of grant to set targets. Later, upon disclosure, long-term performance targets provide new information to outsiders about future cash flows. I further find analysts revise their forecasts according to the information disclosed in targets. These findings are robust to variation in cross-sectional factors such as monitoring, agency conflicts, financial reporting concerns, and the availability of traditional management forecasts. To my knowledge, this analysis is the first to document a forecasting role for the long-term targets used in earnings-based compensation plans.
I am grateful to the members of my dissertation committee for their guidance and support: John Core (chair), Rodrigo Verdi, and Joe Weber. I also thank Inna Abramova, Natalie Berfeld, Valère Fourel, Jacquelyn Gillette, Bill Goulding, Daniel Green, Nat Gregory, Nick Guest, Michelle Hanlon, Scott Keating, Jinhwan Kim, SP Kothari, Chris Noe, Suzie Noh, Daniel Rock, Georg Rickmann, Delphine Samuels, Nemit Shroff, Eric So, Andrew Sutherland, Ben Yost, and seminar participants at MIT for helpful comments and assistance. I gratefully acknowledge financial support from MIT Sloan and the Deloitte Foundation.
1
1. Introduction
This paper examines whether earnings targets used in long-term performance-based
compensation plans predict future performance. Before FAS 123R required options expensing,
time-vesting restricted stock and options dominated executive pay packages. Both the value of
these awards at grant date and their ultimate payouts were based on objective, market-based
measures of price performance. Now, long-term pay is increasingly in the form of accounting-
based performance awards (Li and Wang, 2016; Bettis et al, 2016; Core and Packard, 2017). These
awards pay according to internally-generated earnings or other accounting benchmarks rather than
market expectations of price. To the extent that long-term accounting targets reflect a firm’s
internal budgeting, I predict they can be informative about long-term future performance.
The goal-setting literature (e.g., Locke, et al., 1981; Merchant and Manzoni, 1989), along
with conventional wisdom, suggests targets must be achievable in order to provide incentives. The
range of achievability is best known to the firm, as it depends on projections of revenue growth,
expenses, and planned investments. Murphy (2000) suggests targets are equivalent to firm
expectations; i.e. they are designed to be achieved with 50 percent probability. Indeed, firms
amortize compensation expense for long-term accounting-based awards at target payout levels,
suggesting target-level performance is the firm’s best expectation of actual performance.
Still, plenty of evidence suggests targets do not reflect internal forecasting so directly.
Research argues for targets that are expected to be achieved with probabilities both well below and
well above 50 percent. Some argue that more difficult targets lead to higher performance outcomes
(Stedry and Kay, 1966; Locke, 1968), while other research suggests easier targets provide benefits
such as improved reporting and resource allocation (Merchant and Manzoni, 1989). Furthermore,
firms use a variety of bases, including past performance and external benchmarks such as analyst
2
forecasts, to set targets (Murphy, 2000; Martin et al., 2017). These benchmarks may only be
weakly related to private, forward-looking budgeting. Alternatively, compensation targets may not
be used to incentivize performance at all. Section 162(m) of the tax code, which limits deductibility
of non-performance-based pay, provides a tax incentive to condition awards to top executives on
performance targets. “Easy” targets used to disguise cash or other lower-risk compensation are not
likely to be related to firms’ internal projections. Taken together, the arguments for and against
targets’ ability to forecast performance amount to an empirical question that I investigate in this
paper.
An important feature of my analysis is that I focus on long-term targets. Previous studies
on compensation targets almost exclusively consider annual incentive, i.e. bonus, plans. I argue
that long-term targets provide a better setting to analyze the role of internal forecasting in
determining targets. Conceptually, in the long term there is a wider disparity between what the
firm expects and what outsiders can feasibly forecast. The firm has information about the nature
and timing of its future investments, personnel decisions, or other strategic actions that determine
performance in the long run, but may not be public. As a result, management’s long-term
projections are especially valued by outsiders. More practically, while both long- and short-term
targets are disclosed in the annual proxy, the timing of the proxy disclosure (3-4 months following
fiscal year-end) means short-term targets are disclosed ex post, or after the fiscal year performance
period has concluded. The performance period is still ongoing when long-term targets are made
public. Thus, the information in long-term targets is potentially useful to outsiders as a forecast
once the proxy is filed.
A second purpose of this paper is to determine whether firms, in effect, provide long-term
guidance to market participants when they disclose long-term targets in the annual proxy. While

3
they may both contain forecasting information, long-term performance targets are distinct from
traditional guidance in several ways. First is the horizon. While guidance usually projects out to
one or two quarters, long-term compensation targets refer to performance years into the future.
Second, compensation benchmarks have direct contractual and accounting consequences, in the
form of executive compensation payouts and estimated expenses, which other guidance
disclosures do not carry. Last, while targets are typically set in the first months of a fiscal year,
they are not usually disclosed until much later, when the proxy pertaining to that fiscal year is
filed. For outsiders hoping for a glimpse into the firm’s internal projections, the target is somewhat
stale. Even if firms set targets to perfectly correspond to expectations of future performance at the
time of grant, by the time of disclosure the information could be irrelevant to outsiders.
Focusing on long-term performance plans, I test a) whether targets are a function of internal
budgeting at the time they are set and b) whether they provide forward-looking projections to
outsiders upon disclosure. My analysis uses target-level data from ISS Incentive Lab. The targets
in my sample are granted to CEOs as part of long-term performance-vesting cash, restricted stock,
and option awards over the years 2007-2011. I focus my sample on earnings-based targets (e.g.
EPS, ROA) because they are both ubiquitous (relative to other types of benchmarks) and relevant
to predicting future cash flows. I further focus on targets that pertain to the third year of a multi-
year plan. I use third-year targets because three years is the most common performance horizon in
my sample. Also, when three-year targets are disclosed, the performance period end date is still
almost two years away.
In my setting, I do not observe the internal budgeting process or the process used to set
targets. I therefore analyze the relation between long-term targets and internal forecasts by
examining the relation between targets and external, e.g. analyst, forecasts. Absent any forward-

4
looking information, targets will be unrelated to consensus analyst forecasts. Absent any private
forward-looking information, differences between targets and analyst forecasts will be unrelated
to future performance outcomes. Instead, I find that, as of the award grant date, targets and
consensus analyst forecasts are significantly correlated and that a one standard deviation positive
difference between targets and the analyst consensus predicts a mean 0.11 standard deviation
positive earnings surprise. By showing long-term targets predict future performance, these results
suggest firms rely on their internal budgeting processes to set long-term targets.
To examine whether targets actually convey relevant forecasting information to outsiders,
I compare the target to the analyst expectation at the time of the proxy filing, as opposed to the
time of grant. Over the more than year-long period between grant date and disclosure in the annual
proxy, any private information contained in targets when they were set may have already been
released through guidance or other disclosures. I rely on the updated consensus analyst forecast to
capture information from prior disclosures. If all of the private information contained in targets is
public as of the proxy filing, I expect differences between targets and updated analyst forecasts
will be unrelated to the earnings surprises that occur two years post-disclosure. Consistent with
some but not all of the private information having been disclosed, I find that targets continue to
predict future earnings surprises at the time of disclosure with a reduced magnitude. A one standard
deviation positive difference between targets and the updated analyst consensus predicts a mean
0.06 standard deviation positive earnings surprise. Even a year after they are set, targets provide
new information to outsiders about future earnings.
Having established that targets predict performance, I next examine whether analysts adjust
their forecasts according to target disclosures. I find that they do. From the month preceding to the
month following the proxy disclosure, the consensus analyst forecast adjusts by a 0.04 standard

5
deviation for a one standard deviation difference between the target and analyst forecast at the time
of disclosure. These results not only support the role of long-term targets as forecasts, but also
suggest analysts use compensation disclosures to make their projections.
Finally, for robustness, I examine whether my main results, showing the predictive nature
of targets at the time of grant, hold when I control for potentially confounding cross-sectional
factors. The factors I consider may relate to either the forecast content of targets, or my ability to
measure such content, and to future earnings surprises. These include agency conflicts, monitoring,
financial reporting concerns, and long-range guidance practices. My results are robust to including
proxies for these characteristics as controls, and I find no significant interactive effect between
their proxies and the relation between targets and future earnings.
This research is important to a broad class of researchers in accounting and finance. As
long-term earnings-based plans have become more prevalent, compensation research has
progressed with little knowledge of how long-term targets are designed or how they differ from
short-term targets. Prior research finds short-term targets are set according to factors such as short-
term analyst projections (Martin et al., 2017) and recent performance (Indjejikian et al., 2014). In
contrast, by considering long-term targets I find evidence that targets are predictive of future
performance, consistent with targets reflecting a firm’s internal budgeting. This finding also
suggests that long-term targets provide actual incentives, rather than mere window dressing.
A second contribution is that my findings show long-term targets are, in essence, a two- to
three-year-ahead forecast, whereas management forecasts typically forecast only a few quarters
ahead. These long-range forecasts can be used to estimate measures that rely on accurate long-
term projections, such as cost of capital or target prices. As a measure of budgeting quality, long-

6
term targets can help researchers to assess more accurately cross-sectional characteristics such as
investment efficiency or internal information flows.
This paper further highlights the joint nature of compensation design and voluntary
disclosure (see Core, 2001). An important implication of long-term targets as forecasts is that
targets have the potential to either align or conflict with other forward-looking disclosures. In
related work (Packard, 2017), I show that traditional disclosure costs determine whether firms
disclose long-term targets in a forward-looking manner. Given that targets are disclosed well
before most firms issue guidance for the same period, it raises the question of whether targets
determine the availability or content of future guidance. Likewise, assuming firms are aware that
they disclose forecasts with their long-term targets, the target’s expectation signal may directly
affect the terms and the disclosure of the incentive contract. All in all, the findings in these two
papers suggest that disclosure and compensation decisions are comingled; specifically, that the
design and disclosure of long-term accounting-based plans are a part of the firm’s overall
disclosure policy.
The remainder of this paper proceeds as follows. Section 2 provides background
information and a review of the relevant literature. Section 3 develops and presents my hypotheses.
Section 4 details my research design and Section 5 the data and sample selection. Section 6
presents the results of my primary analysis and Section 7 has results of robustness tests. Section 8
concludes.
2. Background and Literature Review
In late 2005, FAS 123R eliminated the zero-expense accounting advantage of executive
stock options. Subsequently, the majority of firms reduced their use of time-vesting stock options
7
(Hayes et al., 2012) and increasingly granted cash, restricted stock, or options with performance
conditions attached (Li and Wang, 2016; Bettis et al, 2016; Core and Packard, 2017). By 2012,
according to Bettis et al. (2016), a majority of firms were conditioning grants to executives on
performance objectives. Concurrently, in 2006 the Securities and Exchange Commission updated
its compensation disclosure requirements with the aim of increasing transparency of executive pay
for performance. The new rules required a Compensation Discussion and Analysis (“CD&A”)
section, in which firms were to include specific performance target levels used to arrive at payout
amounts. Thus, at the same time that more firms began to use earnings or other accounting-based
targets in their long-term incentive plans, they were required to disclose much more about them.
Despite the CD&A objectives, not all firms disclose performance targets. As stated in
Instruction 4 to Item 402(b) of Regulation S-K, registrants are not required to provide “specific
quantitative or qualitative performance-related factors… involving confidential trade secrets or
confidential commercial or financial information, the disclosure of which would result in
competitive harm for the registrant.” Presumably due to such competitive harm, almost half (or
44%) of targets are not disclosed. In addition to the choice of whether to disclose targets, firms
also exhibit discretion regarding when to disclose them. While most firms choose to disclose
targets in the proxy following the year in which the performance target was decided, but before
the end of the performance period, some firms (around 20%) choose to wait until after the multi-
year performance period is over (Packard, 2017).
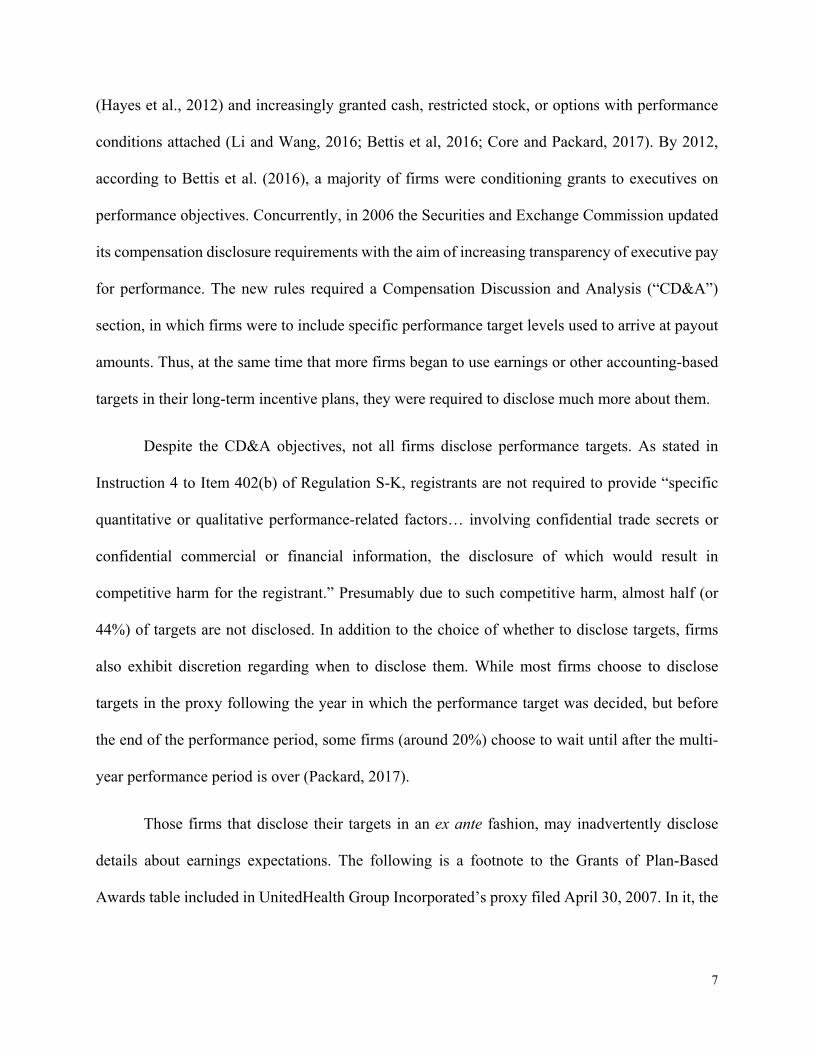
Those firms that disclose their targets in an ex ante fashion, may inadvertently disclose
details about earnings expectations. The following is a footnote to the Grants of Plan-Based
Awards table included in UnitedHealth Group Incorporated’s proxy filed April 30, 2007. In it, the
8
company states that it has set a 15% EPS growth target for the second and third years of its three-
year plan.
In 2006, upon recommendation by management, the Compensation Committee approved a minimum EPS goal of $8.57 for the 2006-2008 performance period that must be achieved before the target amount shown above becomes earned and payable. The $8.57 EPS goal was 85% of the sum of the EPS guidance we provided to investors for the first year of the performance period and EPS figures for the second and third years of the performance period that represent target annual EPS growth of 15%. In 2009, the Committee will determine whether or not the performance goal has been achieved.
Similarly, Nu Skin Enterprises, Inc., in its proxy filing dated June 24, 2014 describes the payout
policy for one of its 2013 executive grants using specific performance targets.
Two equal tranches become eligible for vesting based on the achievement of earnings per share performance levels, measured in terms of diluted earnings per share excluding certain predetermined items. The portion of the first tranche that becomes eligible for vesting is determined by earnings per share achieved in 2013, ranging from 100% for earnings per share of $3.95 to 50% for earnings per share of $3.70. The portion of the second tranche that becomes eligible for vesting is determined by earnings per share achieved in 2014, ranging from 100% for earnings per share of $4.50 to 50% for earnings per share of $4.15.
Some firms acknowledge the forecasting nature of target disclosures. PVH Corp., in its May 16,
2014 proxy, provides a disclaimer after explicitly providing threshold, target, and maximum EPS
targets: “These goals are presented solely for the purpose of describing our compensation
program. They are not management’s estimates of results or other guidance. Investors should not
apply these goals to other contexts.” This research, in part, asks whether it is valuable for outsiders
to use these targets, beyond the compensation context, to make their performance projections.
My paper relates to previous research on the determinants of performance targets. Past
research has long thought of optimal budgets in terms of difficulty, or achievability. While the
management accounting literature had for years recommended more difficult targets as optimal for
performance outcomes, Merchant and Manzoni (1989) find managers prefer to set targets at more
9
achievable levels. In their field study, 89 percent of surveyed managers said they hoped their
targets would be met with 75 percent or more probability. Managers cite more consistent
performance, better reporting, and efficient resource allocation as reasons to use achievable targets.
As Murphy (2000) describes in his sample of annual bonus plans, both budgeting and past
performance represent the most common bases for setting target levels. Past performance as a basis
in the short-term budgeting or compensation context has been examined quite extensively (e.g.
Leone and Rock, 2002; Bouens and Kroos, 2011; Indjejikian et al., 2014; Aranda et al., 2014).
Some fairly recent empirical papers have looked at the role of external forecasts or benchmarks in
setting annual targets. Kim and Yang (2014) analyze short-term EPS targets vis-à-vis analyst
forecasts and show that bonus targets are typically set below analyst forecasts. Armstrong et al.
(2017) show firms are more likely to consistently meet external analyst forecasts than their internal
annual bonus targets. Martin et al. (2017) examine a scenario where compensation committees set
targets based on analyst forecasts. They show that managers, in order to obtain lower targets, use
guidance to walk down analyst projections in advance of the compensation committee meetings
where performance targets are determined.
Since internal budgets are largely private, we know relatively little about how they get
incorporated into CEO and other executive compensation targets. Bouwens and Kroos (2016) find
in their analysis of a large retailer that when forward-looking non-financial information is used to
set targets, performance improves and targets are more accurate. In terms of long-term financial
projections such as earnings forecasts, I know of no study that examines how they are used to set
targets.
Due in part to data availability, the bulk of past research on target setting has been
conducted on annual bonus plans, i.e. short-term targets. I argue that long-term targets provide a
10
better setting for understanding the role budgets play in determining performance standards. First,
there is a greater disparity between the market’s and the firm’s information over a longer term.
Firms are less likely to rely solely on public expectations such as analyst forecasts to set targets
because they are not as accurate. Likewise, given changing environmental factors and long-term
investment decisions by the firm, recent performance by itself is a less efficient proxy for future
expected outcomes in the long term than it is in the short term.
Second, incentive environments differ with horizon. Theoretical distinctions between
short- versus long-term incentives show that perverse intertemporal incentives are mitigated in the
long term with committed contracts (Laffont and Tirole, 1993). In practice, the majority of long-
term awards pay in restricted stock and have much larger payouts than short-term awards, which
pay in cash. Given these incentive differences alone, researchers should not assume the same
ingredients used to set short-term targets are used for long-term.
Last, long-term targets are better for analyzing long-term budgeting expectations because,
when disclosed, they potentially convey these expectations to outsiders. Unlike short-term targets,
the majority of disclosed long-term targets are made public before the performance period has
passed. Any budgeting information they contain has the potential to provide valuable forecasting
information to market participants. Beyond the target setting literature, my paper relates to the
literature on the information content of management forecasts. Despite their endogenous origins,
previous research suggests management forecasts are as accurate as audited statements (Pownall
and Waymire, 1989) and perhaps more accurate than analysts’ forecasts (Hassell and Jennings,
1986; Waymire, 1986) in predicting performance. While there is evidence that markets respond to
management forecast disclosures (Foster, 1973; Patell, 1976), Ng, et al. (2013) find markets tend
to underreact to their cash flow news. In general, the valuation role for accounting information
11
(Beaver, 1968; Ball and Brown, 1968) is well-documented, as is a sometimes tendency for that
information to be incorporated by markets and analysts with a lag (Bernard and Thomas, 1989;
Sloan, 1996; Bradshaw, Richardson, and Sloan, 2001). All told, previous research suggests a
precedent for analyst and/or investor reaction to forecasts in the form of performance target
disclosure, even if it is not timely or full.
This research would not be possible absent the SEC’s enhanced disclosure requirements of
2006. Beyond initial compliance (Robinson et al., 2011), a few recent papers have researched
contracting and capital market effects following this disclosure change. Gipper (2016) exploits the
rules’ staggered introduction to find that executive compensation levels rise following disclosure.
Bloomfield (2017) finds that firms, under the mandatory CD&A regime, use revenue targets to
further their competitive product market strategies. One paper close to my study is Ferri et al.
(2017), who find the required increase in compensation disclosure enhances investors’ ability to
interpret financial statements. They argue that knowing how managers are compensated lends
credibility to subsequent earnings reports. In contrast, I suggest a predictive, and also more direct,
role between compensation disclosures and earnings performance news. That is, whereas Ferri et
al. (2017) find that knowing the type of contract (e.g. earnings-based or non-earnings-based) is
useful for interpreting subsequent earnings reports, I argue the performance target itself is useful
for predicting performance. To my knowledge, my paper is the first to show that compensation
target disclosure can provide investors with a primary source of information about future earnings.
3. Hypothesis Development
3.1 Internal forecast content of targets
In my primary analysis, I examine whether firms base targets on internal performance
projections. In standard agency models (Holmstrom, 1979; Grossman and Hart, 1983; Holmstrom
12
& Milgrom, 1987), performance payouts are determined based on the statistical properties of
output. As Murphy (2000) describes, devising an optimal target under this framework amounts to
predicting outcomes for the factors that determine future performance.
Standard agency predictions relate to the entire contract. In my setting, performance targets
only refer to a portion of a CEO’s overall incentives. A long history of field and empirical studies
in the accounting literature, however, provide a basis for thinking of targets in terms of
expectations. The concept of target difficulty, or achievability, relates a target to a benchmark
known to the firm (e.g. Merchant and Manzoni, 1989). Empirical papers (e.g. Kim and Yang, 2014;
Martin et al., 2017; Armstrong et al., 2017) compare EPS targets directly to analyst and/or
management forecasts for the same period.
Bettis et al. (2016) consider both long- and short-term performance targets as they measure,
using simulations, the average ex ante probability of an accounting target being achieved at 51%
They also find that, ex post, targets are achieved with a frequency of 48.4%. Given the proximity
of these figures to 50%, and the theoretical relation between forecasts and targets, I predict:
Hypothesis 1: Firms set long-term performance targets according to their expectations of
future performance.
Of course, there are reasons long-term targets may not be based on internal forecasts. First,
some firms may not budget so far in the future, so there may not be internal forecasting information
on which to base targets. Second, long-term targets may be used for non-incentive reasons. For
instance they may be used to meet tax deductibility requirements. Perhaps due to idiosyncrasies of
stakeholder pressure, firms may not desire to incentivize a performance expectation until closer to
the date, and so save their more efficient incentives for shorter-term targets.
13
Even where long-term targets are based on internal expectations, it may be difficult to
document the relation. If targets deviate substantially from other forecasts, it is impossible to know
if the deviations are due to private information regarding performance expectations, which is
unobservable, or other factors. For instance, firms with high agency conflicts may set artificially
easy targets. Alternatively, targets that are based on internal forecasts at the time may not predict
eventual performance realizations ex post. The long horizon allows time for unforeseen events to
distort or add noise to the relation. Such factors will inhibit my ability to find support for H1.
3.2 Information value of targets at the time of disclosure
Assuming H1 holds, I next consider whether targets, at the time of disclosure, can inform
outsiders about those expectations. Since long-term management forecasts are relatively rare, I
expect the information provided by targets about performance over a year into the future will be
valuable to outsiders. Furthermore, long-term forecasts are even more sensitive than short-term
forecasts to the investment, personnel, or other decisions that firms may not immediately publicize.
Given their long-term nature and forecast basis, I expect these targets to be valuable predictors of
future outcomes at the time that they are disclosed. That is, I predict:
Hypothesis 2: At the time of disclosure, long-term performance targets provide information
about firms’ expectations of future performance.
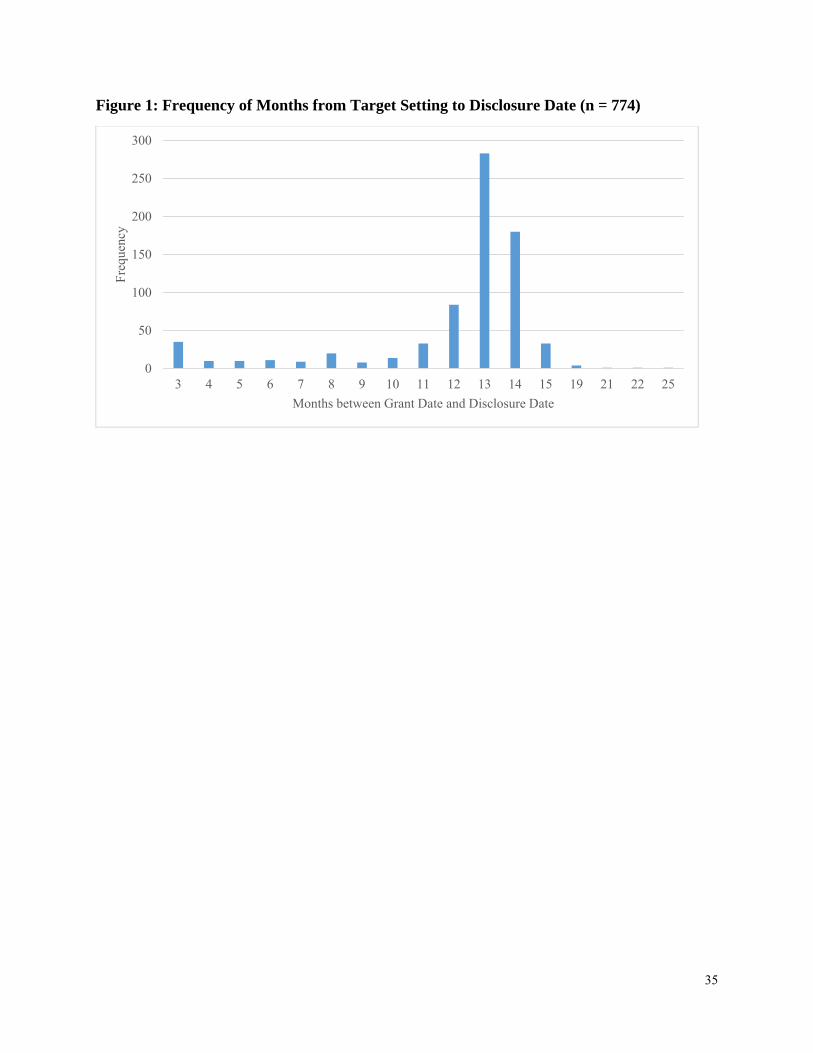
There are reasons targets, even if they are predictive at the time they are set, may not be
valuable to those outside the firm upon disclosure. Chiefly, targets are generally set at the
beginning of a fiscal period and not disclosed until the proxy is filed in the beginning of the next
fiscal period. Figure 1 charts the distribution of months between grant and disclosure dates. The
most common length of time is 13 months. Over that time, the target may become stale or
irrelevant. Alternatively, the firm may make the information known in other ways, through
14
management forecasts or other public disclosures. Under such circumstances, I would not find
support for H2.
4. Research Design
I focus on earnings targets in this analysis because earnings targets represent a substantial
portion of the targets used in long-term compensation plans. Of my sample of targets granted to
CEOs over the period 2007-2011, 64.6% of all long-term targets disclosed on Incentive Lab are
earnings-based.
Even firms that use earnings targets in their long-term compensation plans use different
earnings measures, in different types of plans, over different horizons. While some long-term plans
pay according to a cumulative, multi-year performance measures, several plans pay according to
distinct annual measures over several years. Others base payouts according to performance for a
single fiscal year at the end of the performance period, perhaps three to four years in the future.
Appendix A outlines the types of long-term plans these targets belong to in more detail. To
standardize the analysis, I focus on targets for performance in the third year of a multi-year plan.
Three years is by far the most common performance horizon for long-term incentive plans, and
third-year measures encompass both cumulative and last-year only performance horizons.
Firms also use different scalars (e.g., assets, equity, investment) and adjustments (e.g.
taxes, depreciation) to determine earnings-based targets. I address this by converting all targets
into a measure of net income. In Appendix B, I describe this conversion process in more detail. In
general, I make adjustments for items such as depreciation or interest expense based on values in
the most recent fiscal year, prior to the grant date of the target-based award. Once I have a measure
of net income, I scale by total assets recorded at the beginning of the year the award is granted.
15
The purpose of the temporal and adjustment-based conversion process is to reduce the
noise introduced by heterogeneity in types of earnings-based performance plans. This process is
imperfect and my sample of targets will likely still be measured with error. I expect the primary
effect of this error will be attenuation bias, which will make any relation between targets and
performance outcomes harder to document. In supplemental analysis I address the possibility that
the error is correlated with other factors, by examining how a variety of cross-sectional
characteristics affect my main analysis.
Using my measure of the target-implied expected earnings for the third year (Y3 Target), I
test my first hypothesis, that the target is based on the firm’s internal forecast for income in the
third year of the plan. I use both an ex ante and ex post approach to test the relation between targets
and income expectations. In the ex ante approach, I test whether targets are related to outsider
expectations. I proxy for outsider expectations (E0[Y3]) using the consensus analyst forecast for
the third year of the plan as of the award grant date, denoted with subscript t = 0. I use analyst
consensus EPS forecasts, converted to ROA using share and asset data at the time of consensus.
Since three-year annual EPS forecasts are relatively rare, I impute the forecast where necessary
using a two- or one-year EPS forecast and the analyst consensus long-term growth forecast. A
significant positive correlation between Y3 Target and E0[Y3] suggests the earnings performance
target is based on expectations as of grant date.
The drawback of the ex ante approach is it only assesses the forecast content of targets
insofar as the firm’s forecast corresponds to the analysts’ consensus. It does not capture private
forecasting information on which firms may base targets. To capture this, I measure the forecasting
content of targets using an ex post approach. Under the ex post approach, I measure whether targets
16
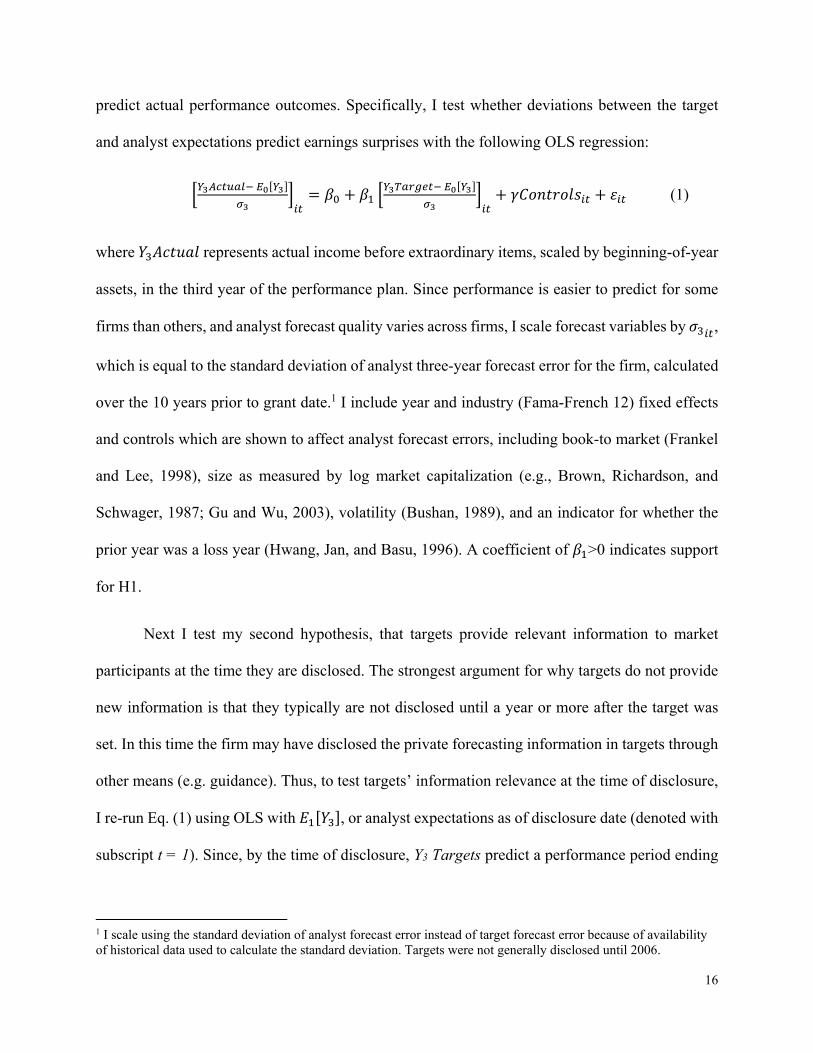
predict actual performance outcomes. Specifically, I test whether deviations between the target
and analyst expectations predict earnings surprises with the following OLS regression:
(1)
where represents actual income before extraordinary items, scaled by beginning-of-year
assets, in the third year of the performance plan. Since performance is easier to predict for some
firms than others, and analyst forecast quality varies across firms, I scale forecast variables by ,
which is equal to the standard deviation of analyst three-year forecast error for the firm, calculated
over the 10 years prior to grant date.1 I include year and industry (Fama-French 12) fixed effects
and controls which are shown to affect analyst forecast errors, including book-to market (Frankel
and Lee, 1998), size as measured by log market capitalization (e.g., Brown, Richardson, and
Schwager, 1987; Gu and Wu, 2003), volatility (Bushan, 1989), and an indicator for whether the
prior year was a loss year (Hwang, Jan, and Basu, 1996). A coefficient of >0 indicates support
for H1.
Next I test my second hypothesis, that targets provide relevant information to market
participants at the time they are disclosed. The strongest argument for why targets do not provide
new information is that they typically are not disclosed until a year or more after the target was
set. In this time the firm may have disclosed the private forecasting information in targets through
other means (e.g. guidance). Thus, to test targets’ information relevance at the time of disclosure,
I re-run Eq. (1) using OLS with , or analyst expectations as of disclosure date (denoted with
subscript t = 1). Since, by the time of disclosure, Y3 Targets predict a performance period ending
1 I scale using the standard deviation of analyst forecast error instead of target forecast error because of availability of historical data used to calculate the standard deviation. Targets were not generally disclosed until 2006.
17
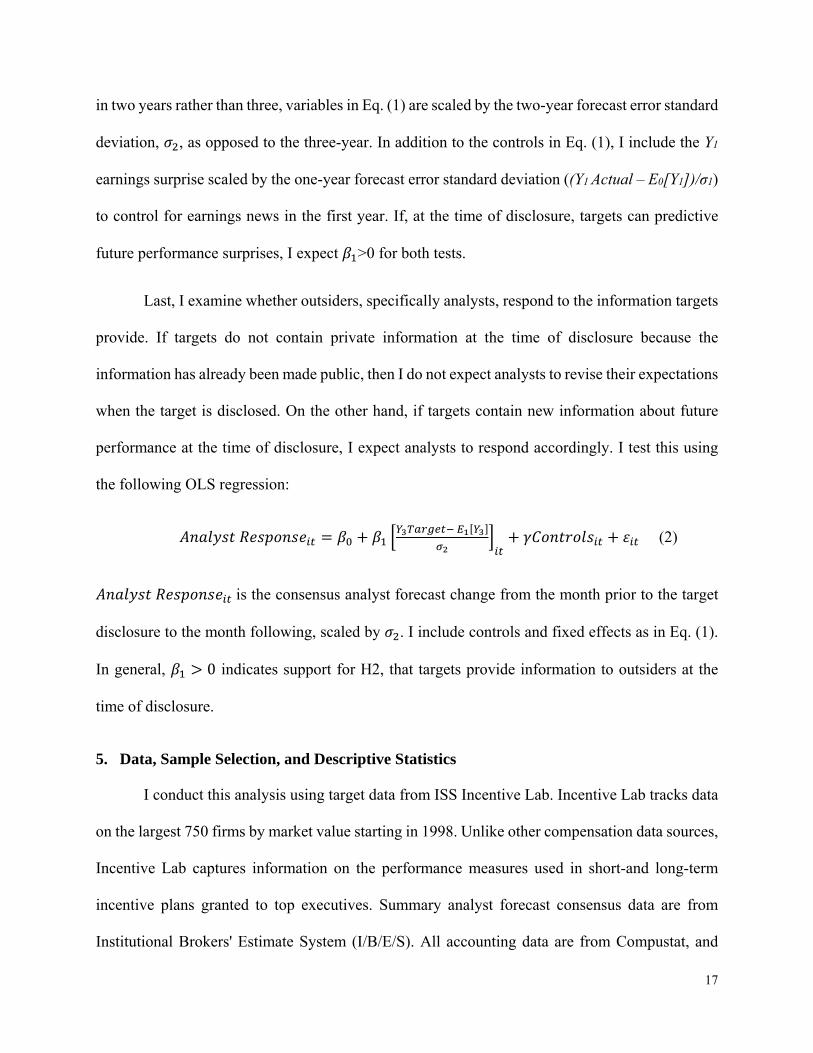
in two years rather than three, variables in Eq. (1) are scaled by the two-year forecast error standard
deviation, , as opposed to the three-year. In addition to the controls in Eq. (1), I include the Y1
earnings surprise scaled by the one-year forecast error standard deviation ((Y1 Actual – E0[Y1])/σ1)
to control for earnings news in the first year. If, at the time of disclosure, targets can predictive
future performance surprises, I expect >0 for both tests.
Last, I examine whether outsiders, specifically analysts, respond to the information targets
provide. If targets do not contain private information at the time of disclosure because the
information has already been made public, then I do not expect analysts to revise their expectations
when the target is disclosed. On the other hand, if targets contain new information about future
performance at the time of disclosure, I expect analysts to respond accordingly. I test this using
the following OLS regression:
(2)
is the consensus analyst forecast change from the month prior to the target
disclosure to the month following, scaled by . I include controls and fixed effects as in Eq. (1).
In general, 0 indicates support for H2, that targets provide information to outsiders at the
time of disclosure.
5. Data, Sample Selection, and Descriptive Statistics
I conduct this analysis using target data from ISS Incentive Lab. Incentive Lab tracks data
on the largest 750 firms by market value starting in 1998. Unlike other compensation data sources,
Incentive Lab captures information on the performance measures used in short-and long-term
incentive plans granted to top executives. Summary analyst forecast consensus data are from
Institutional Brokers' Estimate System (I/B/E/S). All accounting data are from Compustat, and
18
price and return data from the Center for Research in Security Prices (CRSP). While earnings
announcement and proxy filing dates are available on Compustat and Incentive Lab, respectively,
Incentive Lab does not track disclosure dates for specific targets. Not all firms disclose targets
before the conclusion of the performance period. To verify disclosures are made at a time when
they still have predictive potential, I use hand-collected disclosure dates for the individual earnings
targets in my sample from Packard (2017).
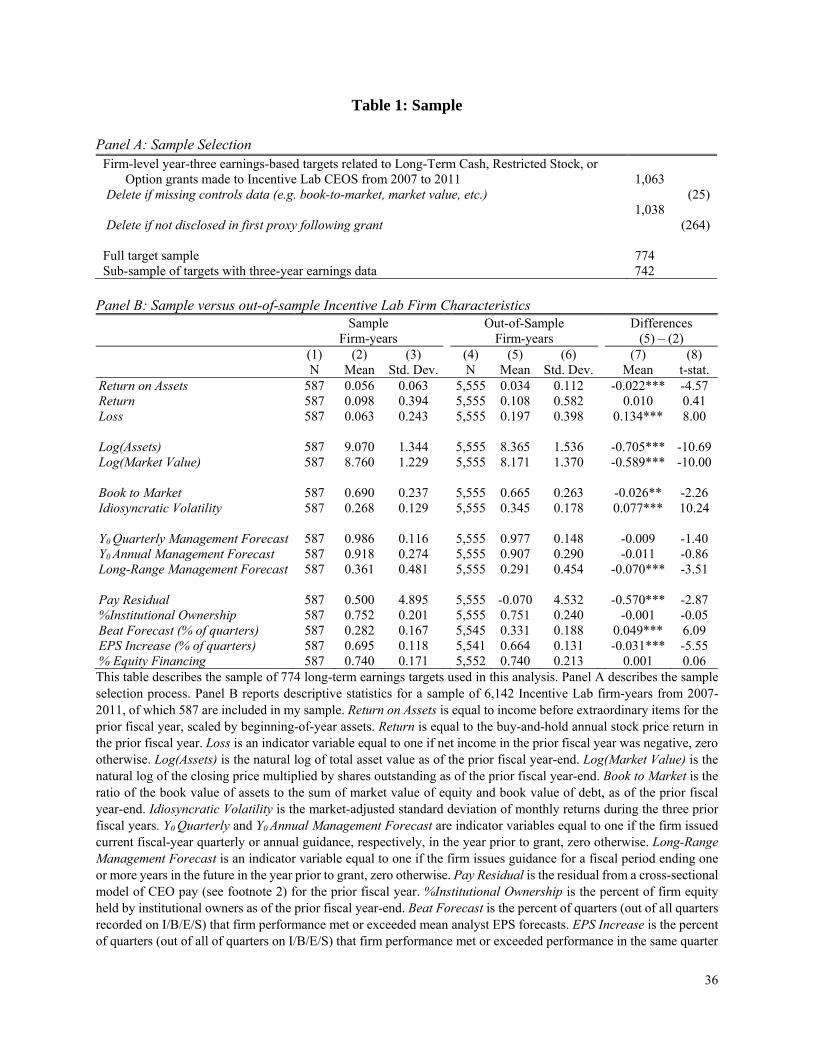
Table 1 describes the sample used in this analysis. I begin my sample in 2007, the first year
in which all firms were required by the SEC to disclose performance targets in their annual proxy.
As Panel A outlines, from the years 2007-2011, I calculate 1,063 firm-level (i.e. not business or
geographic unit) earnings-based targets used to assess performance in the third year of long-term
performance plans granted to CEOs. I am unable to calculate market and book values, or other
controls, for 25 of these. A further 264 are not disclosed in the proxy corresponding to the first
year of the performance plan period. This leaves 774 targets. Of these, 32 do not have third-year
income data on Compustat. Thus, ex post tests are limited to the 742 targets that have income data
for year three of the plan.
Panel B compares sample firm characteristics to characteristics of other Incentive Lab
firms. The average log of market capitalization for sample firms is 8.8, and the average firm is
75% owned by institutional investors. On average, firms in my sample are larger and more
profitable, with lower growth opportunities and lower price return volatility. In general, far fewer
sample and out-of-sample firms issued long-term, as opposed to short-term, guidance in the prior
year; however, sample firms are more likely to have done so. Thirty-six percent of sample firms
gave long-range forecasts in the previous year, as opposed to 29% of out-of-sample firms. These
statistics indicate that my sample contains more stable, easier-to-forecast firms. While such firms
19
seem more likely to produce and use reliable budgeting information to set targets, the same
information is potentially less valuable to outsiders.
Table 2 reports descriptive statistics for target characteristics. The mean Y3 Target, in terms
of ROA, is about 5.6%. This is one full standard deviation below the mean consensus analyst
forecasts of 8.6%. Note that analyst forecasts are more optimistic and less precise in the three-year
horizon. Thus, some of the negative difference between targets and forecasts is driven by analyst
over-optimism.
6. Results
Table 3 presents results of tests of H1, that long-term targets are based on the firm’s
forecasted earnings. In Panel A are the results from the univariate ex ante test. The panel shows
that the Y3 Target is highly correlated with the prevailing analyst expectation for the same period.
The Pearson correlation coefficient is 0.426, with a p-value < 0.00001, and the Spearman
coefficient is 0.523. This supports H1, that in general targets contain forecast content.
Next I test for long-term targets’ forecast content in an ex post fashion, by estimating their
ability to predict earnings. Panel B shows OLS results from regressing the measure of unexpected
earnings, (Y3 Actual – E0[Y3]) / σ3, on the target deviation, or (Y3 Target – E0[Y3]) / σ3. Consistent
with the results in Panel A, deviations between Y3 Targets and relative analyst consensus predict
earnings surprises. A one standard deviation difference between targets and analyst forecasts
results in a 0.11 standard deviation positive earnings surprise, or around a one-half percentage
point increase in ROA. Columns 2 and 3 show this result is robust to including controls for analyst
forecast accuracy and fixed effects. Taken together, the results in Panels A and B, that performance
20
targets are ex ante correlated with analyst expectations and positively predict ex post earnings
surprises, support H1.
Table 4 presents results from H2, that targets provide information to market participants
upon disclosure. The regressions in Panel A are similar to those in Panel B of Table 3. Importantly,
I update the earnings surprise and target variable to reflect the analyst forecast consensus just prior
to target disclosure. I expect analysts expectation as of the disclosure date of the target, E1[Y3],
will reflect information that has been previously made public. If targets contain no new information
because the information is already public, (Y3 Target – E1[Y3]) / σ2, will not predict future earnings
surprises. In line with my hypothesis, the results in Panel A show targets as of disclosure are
informative, and positively predict future earnings surprises. As one would expect, the effect
compared with Table 3, Panel B is lessened. As of disclosure, a target set one standard deviation
above the consensus forecast results in a 0.06 positive standard deviation earnings surprise, or a
one-tenth percentage point increase in ROA. This result is robust to the inclusion of analyst
forecast error controls and year and industry fixed effects.
Next I test H2 by analyzing whether analysts respond to targets. Panel B has results from
this test. In Column 1 the coefficient on the difference between targets and analyst expectations
((Y3 Target – E1[Y3]) / σ2) is positive and significant at the 1% level, and is robust to the inclusion
of year and industry fixed effects (Column 2). Columns 3 and 4 examine whether analysts react
differently when firms give guidance for a similar performance period. That is, I interact (Y3 Target
– E1[Y3]) / σ2 with an indicator variable (Y3 Management Forecast) equal to 1 if the firm provided
a forecast for the Y3 performance period prior to target disclosure, 0 otherwise. The coefficient on
the interaction is not significant. Thus I find no significant difference between the analyst reaction
21
for those firms that provide forecasts versus those that do not. Together these results support H2,
that targets provide information to outsiders about future performance.
7. Robustness Tests
To provide robustness, I consider other factors that may affect targets or the way forecast
information is used in setting them. To the extent such factors are correlated with the target vis-à-
vis prevailing analyst expectations and future earnings surprises, their omission could bias my
results. The factors I consider include: 1) agency conflicts, 2) monitoring, 3) financial reporting
concerns, and 4) long-range guidance.
Firms that use targets under weak governance or monitoring may do so for window-
dressing purposes rather than to incentivize performance. If these targets are set low in relation to
market expectations and these firms also perform below expectations, then the factor could drive
my previous results. Firms that have high earnings or financial reporting concerns have incentives
to beat analyst expectations. If targets are meant to incentivize earnings in a particular direction
vis-à-vis the analyst consensus for such firms, this motivation, rather than the pure expectation,
may drive my results. Last, the predictive nature of target may only be present for those firms that
give long-range guidance. In this case, the forecast information of targets would be less useful,
since the firm regularly provides the long-term forecast information through other means.
I use the residual for a cross-sectional model of CEO pay (Pay Residual) to proxy for
agency conflicts.2 I use the percent of equity held by institutional investors (%Institutional
2 Per prior research (e.g., Smith and Watts, 1992; Core, Holthausen, and Larcker, 1999; Murphy, 1999), I measure excess compensation as the residual from the following cross-sectional CEO pay regression:
log , log , , ,
, , ,
22
Ownership) to proxy for enhanced monitoring. Following Carter et al. (2007), I proxy for earnings,
or financial reporting, concerns using a composite of three variables a) the extent to which firms
meet or beat quarterly analyst EPS forecasts (Beat Forecast), b) the extent to which firms meet or
beat last year’s quarterly EPS performance (EPS Increase), and c) the percent of long-term
financing in the form of equity (% Equity Financing). Financial Reporting Concerns is equal to
the firm mean of the standardized values of these three variables. Last, I proxy for forecast behavior
with an indicator variable equal to one if the firm issued a forecast in the previous fiscal year for a
performance period ending one year or more in the future, zero otherwise.
I control for these cross-sectional factors in two ways. First, I re-run the specification in
Table 3, Panel B, Column 3 and include proxies for these four variables. Results in Table 5, Panel
A show results from this test. The inclusion of these variables, separately (Columns 1-4) or
together (Column 5) does not affect the coefficient on (Y3 Target – E0[Y3]) / σ3. Second, I test for
an interactive effect between these variables and targets in predicting earnings surprises. To test
the interaction, I create an indicator variable (Cross-Sectional Indicator) equal to +0.5 if it is above
the median for a given fiscal year, -0.5 otherwise, and add both the indicator and the indicator
interacted with (Y3 Target – E0[Y3]) / σ3 to the main specification. I set the indicator variable equal
to +/- 0.5 in order to attain an effect on (Y3 Target – E0[Y3]) / σ3 that is comparable in interpretation
to that in Table 2. As shown in Panel B, the main inference regarding (Y3 Target – E0[Y3]) / σ3 is
unchanged. Coefficients and t-statistics are not substantively different, regardless of the cross-
where it is the amount of total compensation reported in the summary compensation table for the CEO of firm i in year t. Tenureit is the number of years from the CEO’s start date to the fiscal year end date. Salesi,t-1 is total sales of firm i during the previous fiscal year. ROA i,t is net income divided by the average of the beginning and ending total assets and Book-to-Marketi,t-1 is the book value of assets divided by the sum of book value of debt and market value of equity at the end of the previous fiscal year. RET is the annual buy-and-hold return of the stock of firm i during the year. Year and industry indicators (based on the Fama-French 48) are also included.
23
sectional variable considered. Moreover, in no case is either the main effect on the cross-sectional
indicator or the cross-sectional indicator interacted with (Y3 Target – E0[Y3]) / σ3 significant.
Finally, in untabulated analysis I repeat the main analysis while including the consensus
forecast (either E0[Y3] / σ3 or E1[Y3] / σ2, depending on the specification) as an additional control.3
I find the main results are substantively unchanged.
8. Conclusion
This paper analyzes the internal forecasting content of the earnings targets used in long-
term executive compensation plans. I find that long-term targets contain forecasting information,
and that this information is useful to outsiders upon disclosure. These results suggest firms rely on
their internal budgeting to set earnings targets for long-term performance awards. I further find
that, upon disclosure, long-term targets provide information about cash flow projections to
outsiders. Indeed, analyst forecast revisions around disclosure align with target content. For
robustness, I show the target forecast content result is unaffected by cross-sectional variation in
agency conflicts, monitoring, financial reporting concerns, or long-range guidance behavior.
This work has the potential to influence many streams of accounting and finance research.
I contribute to the compensation literature by establishing a basis for considering firms’
idiosyncratic beliefs about future earnings with regard to performance awards. To the extent
researchers value compensation awards ex ante based on the target vis-à-vis external benchmarks,
3 Prior specifications using the deviation between targets and analyst forecasts as a main explanatory variable implicitly restricts the relation between targets, analyst forecasts, and future performance. Suppose a model where a target predicts actual earnings with a coefficient . That is:
. Expressing in terms of deviations from the analyst consensus yields:
1 Thus, belongs in the model as long as 1.
24
without considering that the firm’s information may be superior to the external expectation, values
are measured with error.
Given that firms have discretion over whether to disclose targets, the predictions targets
contain may be a factor in the disclosure decision (see Packard, 2017). Similarly, targets, once
given, may influence the content and frequency of future firm disclosures. Another important
finding is that analysts update their forecasts according to target disclosures. This raises the
question of whether analysts’ forecast characteristics are affected by target disclosure practices. In
general, the findings in this paper justify further research into the intricacies of how forecasting,
disclosure, and compensation relate to one another.
Finally, this paper has opened a window into understanding the firm’s budgeting process.
Previous research has relied on measures such as guidance accuracy to proxy for internal forecast
quality (e.g. Goodman et al., 2013). Given their long-term horizon, targets are potentially a better
proxy.
This research is not complete, and I have several improvements to make and extensions to
include in future iterations. For instance, I have yet to exploit the potential expectation information
contained in the difference between and payouts associated with “threshold,” “target”, and
“maximum” performance levels. The combination of payout and performance level information
provides outsiders with a better sense of the distribution of expected performance than a simple
mean provides. Future iterations of this paper will almost certainly examine whether this
information enhances forecasting or affects outsiders’ interpretation of target forecasts.
Although it requires hand-collection of disclosure dates, my analysis would benefit from a
sample that stretches past 2011. Beyond adding power, these additional years would allow me to

25
exploit within-firm time-series variation in targets. This variation is potentially correlated with
changes in internal beliefs about future performance.
26
Appendix A: Timing of Plan Design and Disclosure, by Type of Long-term Performance Plan
A.1 Cumulative or Total Average plan
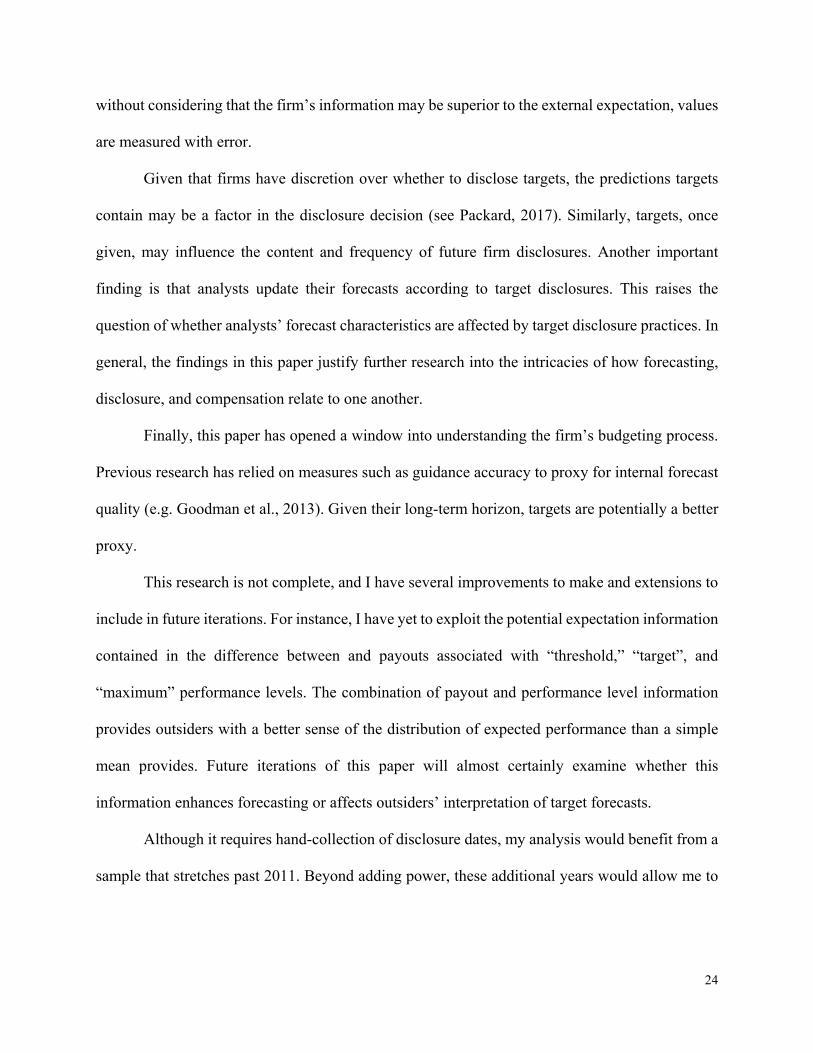
With this type of plan, performance targets are set at the beginning of the three-year period, and payouts are based on aggregate performance over several years (see Figure A1). There is usually a single performance target for the entire period, e.g. aggregate income per share over three years or average ROA over 5 years. Disclosure typically occurs after the first-year of performance is realized (ex ante disclosure) or after the vesting is determined at the end of the last year (ex post disclosure). Since only ex ante disclosures serve as forecasts to outsiders, only ex ante targets are included in my sample.
Incentive Lab will record the vesting period for the particular target. The vesting period by and large corresponds to the performance period the target speaks to. That is, if the vesting period (“VESTLOW” to “VESTHIGH”) associated with a particular target is for the entire 36 months of a three-year plan, then the relevant performance period is over the whole 36 months, indicating a cumulative or total average target. Occasionally Incentive Lab will additionally note in the comments (“METRICOTHER”) that the target is cumulative or average; however, when I spot-checked proxies for 118 multi-year absolute EPS targets that did not have such a comment, I found that 75% were in fact cumulative targets.
For these plans, I scale the given target by the number of months in the vesting period, divided by 12, to arrive at an annual target. I apply this average to the second year of the performance plan. To arrive at the first and third year targets, I apply the constant annual growth rate calculated using the difference between actual earnings in the year prior to the grant, and estimated Year 2 target.
Figure A1: 3-year Cumulative Performance Plan Timeline
BoYt: Within 3
months, firm sets Y1-Y3
performance
EoY1: Y1 performance
realized
EoY2: Y1&Y2
performance realized
EoY3: Y1-Y3
performance realized, vesting
determined
Y3 proxy filed: ex post
disclosure date
Y1 proxy filed: ex ante
disclosure date
Y1-Y3 Performance period measurement
27
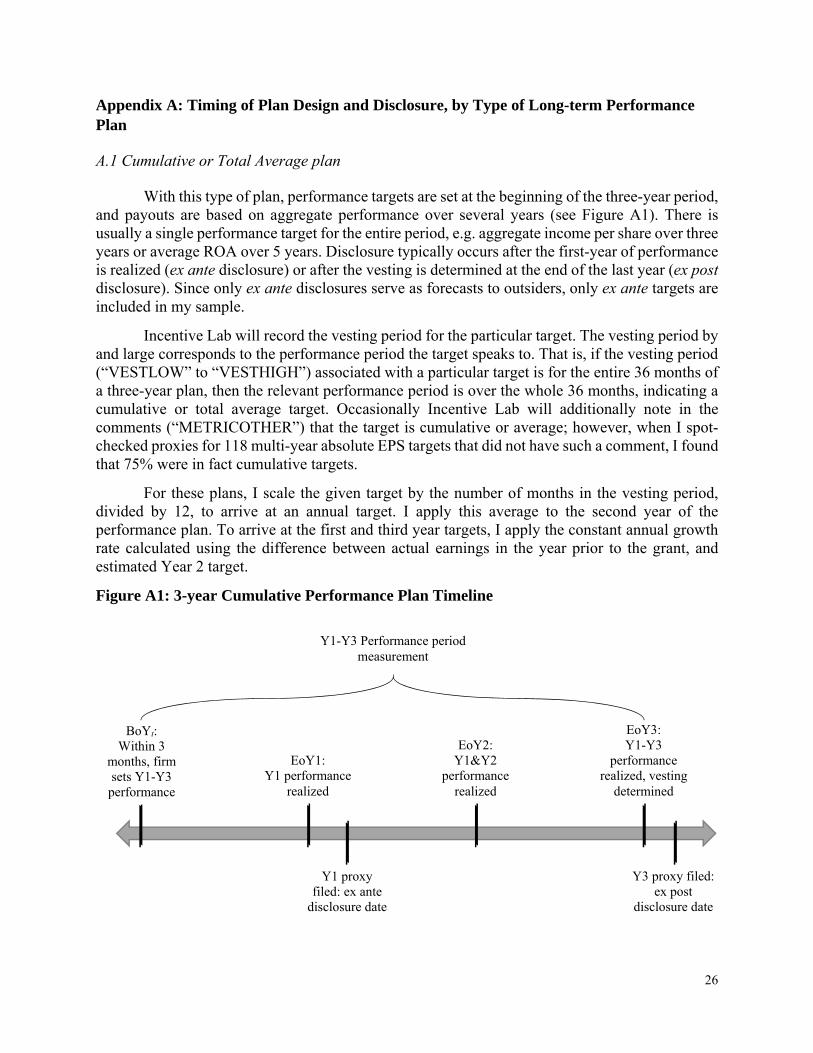
A.2 Consecutive Annual plans
Under this type of plan, the firm sets unique performance goals for each year (or quarter) in the multi-year plan. If the firm also has an annual cash incentive plan, often the targets are identical. In this case, the firm sets a unique target at the beginning of each fiscal year, and discloses after the single-year performance period has ended. All of the targets in this case are disclosed ex post (see Figure A2). Vesting terms vary. In some cases, a certain proportion of the grant vests according to each performance period (ratable vesting). For instance, 33% of shares will vest if target performance is achieved in the first year. In other cases, vesting is determined at the end based on whether targets are met in some proportion or all of the annual performance periods (cliff vesting).
The targets in these plans are associated with vesting terms that are 12 months or shorter. Moreover, the disclosure dates for each target in the same plan are different: disclosure is in the proxy corresponding to the respective performance period.
Since these targets are not made while considering long-term (i.e. greater than one year) performance, I do not included these targets in my sample.
Figure A2: 3-year Consecutive Annual Plans Timeline
BoY1: Within 3
months, firm sets Y1
performance goal
EoY1: Y1 performance realized; within 3 months, firm sets Y2 performance
goal
EoY2: Y1&Y2
performance realized; within 3 months, firm sets Y3 performance
goal
EoY3: Y1-Y3
performance realized, vesting
determined
Y3 proxy filed: Disclose Y3
performance goal (ex post)
Y1 proxy filed: Disclose Y1
performance goal (ex post)
Y2 proxy filed: Disclose Y2
performance goal (ex post)
Y1 Performance period measurement
Y2 Performance period measurement
Y3 Performance period measurement
28
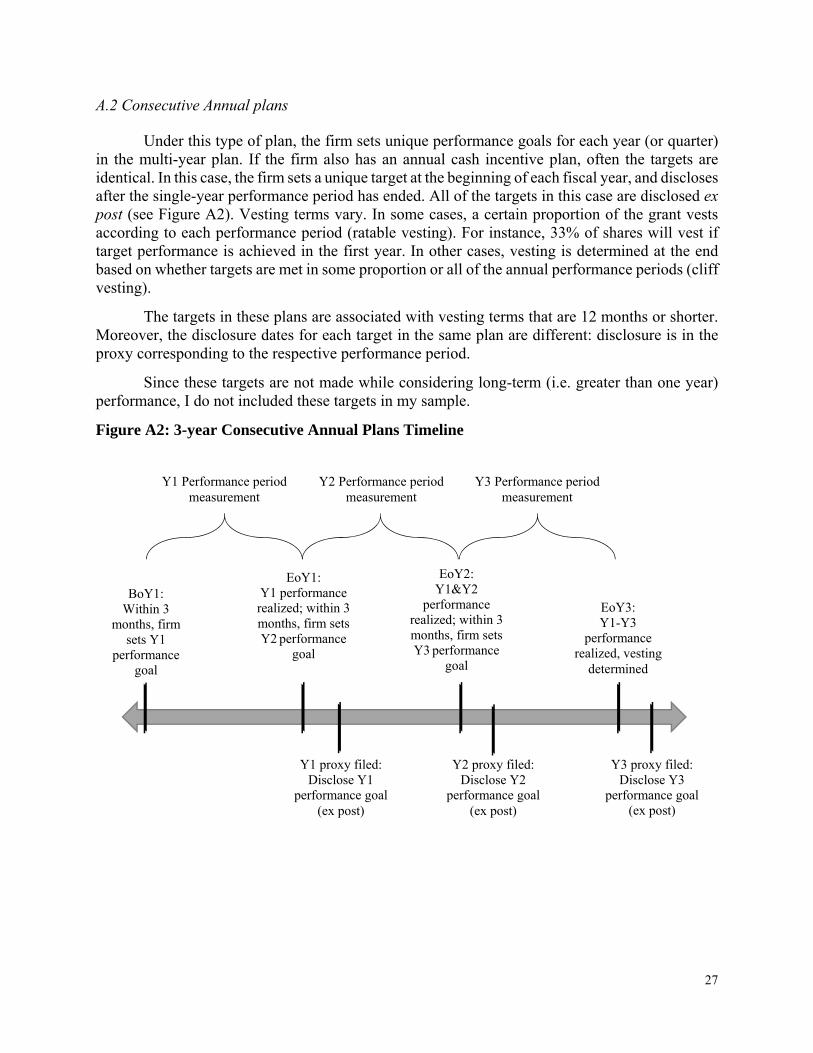
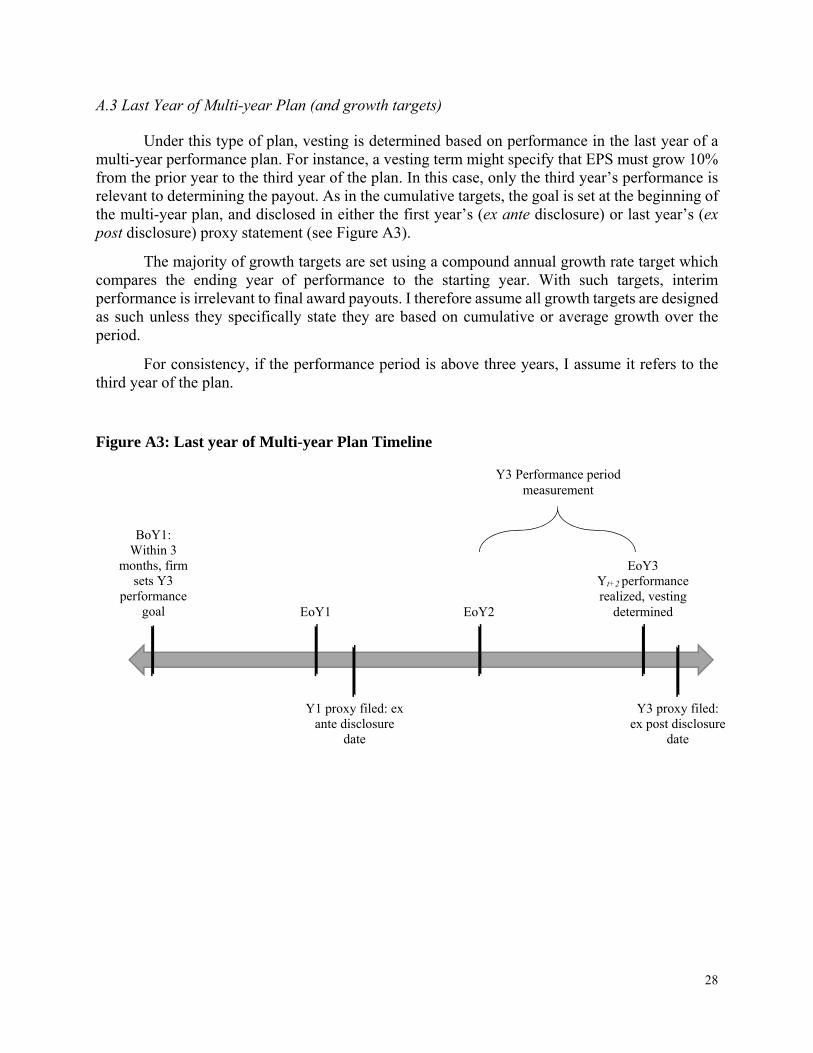
A.3 Last Year of Multi-year Plan (and growth targets)
Under this type of plan, vesting is determined based on performance in the last year of a multi-year performance plan. For instance, a vesting term might specify that EPS must grow 10% from the prior year to the third year of the plan. In this case, only the third year’s performance is relevant to determining the payout. As in the cumulative targets, the goal is set at the beginning of the multi-year plan, and disclosed in either the first year’s (ex ante disclosure) or last year’s (ex post disclosure) proxy statement (see Figure A3).
The majority of growth targets are set using a compound annual growth rate target which compares the ending year of performance to the starting year. With such targets, interim performance is irrelevant to final award payouts. I therefore assume all growth targets are designed as such unless they specifically state they are based on cumulative or average growth over the period.
For consistency, if the performance period is above three years, I assume it refers to the third year of the plan.
Figure A3: Last year of Multi-year Plan Timeline
BoY1: Within 3
months, firm sets Y3
performance goal EoY1 EoY2
EoY3 Yt+2 performance realized, vesting
determined
Y3 proxy filed: ex post disclosure
date
Y1 proxy filed: ex ante disclosure
date
Y3 Performance period measurement
29
Appendix B: Conversion of Heterogeneous Earnings-based Targets to Estimates of Net Income
A major challenge to my study stems from the heterogeneity of the types of plans and how performance targets are set and used to determine payouts. For instance, plans can use any combination of threshold, target, and maximum performance benchmarks. They may interpolate between these levels of performance, or not. Moreover, as in Appendix A, targets can speak to any performance horizon, be of a “one-time hit” nature or require sustained levels of performance. Finally, targets can be based on any number of income-based metric (e.g. EBITDA, EBIT, ROA, ROE, etc.). These differences serve to complicate any cross-firm analysis.
The following is a step-by-step summary of how I convert heterogeneous earnings-based targets into estimates of net income in the third-year following the grant.
B.1 Assigning “Target Performance”
I start by assigning a “target” performance benchmark to each award. If the firm sets threshold, target, and maximum performance goals, I simply use the target goal; likewise if Incentive Lab reports a performance goal only at the target level. If the firm only gives a threshold (or maximum) goal, I use it as the target goal. If the firm uses threshold and maximum goals, but no target, then I set target performance as the simple average of threshold and maximum performance.
B.2 Temporal Adjustments
In order to properly adjust targets into a value of net income, it is necessary that I know whether multi-year targets refer to cumulative or average performance. Spot checking about 100 EPS value (i.e. not growth) targets, I find that the majority (around 80%) referred to cumulative achievement. Therefore, I assume all value targets with vesting periods that span multiple years refer to cumulative performance. In addition, I search the METRICOTHER field for the words “average”, “cumulative”, or “improvement” in order to a) designate average (i.e. per year) targets, b) reaffirm the cumulative designation, or c) identify improvement targets (where the target refers to a value increase above current income).
Where the target is cumulative, I divide by the number of years in the vesting term and use this as the target for the second year in the plan. If the target is average, I use the average as the second-year target. To arrive at first- and third- targets, I apply the compound average growth rate implied by comparing the second-year target to the level of net income before extraordinary items achieved in the year prior to grant. That is, if income in the year before the grant was 1.2 million, and the second year target is 1.4 million, the implied compound annual growth rate is 8%, and the first- and third-year targets would be 1.29 and 1.51 million, respectively.
When I spot checked a similar number of growth EPS targets, I found that the majority referred to compound annual growth targets. Therefore, for all growth targets, I assume they refer to a compound annual growth target (measured by comparing the last year’s performance to starting performance) unless searches for “average”, “cumulative”, or “improvement” suggest otherwise.
30
From there, I separately analyze performance value targets versus performance growth targets. The goal is to adjust each target so that it may be expressed in terms of net income.
B.3 Targets based on performance value
Adjustments based on Metric Type
For targets which are based on an absolute, stated level of achievement, I use the metric type given (Incentive Lab variable METRIC) to determine whether to adjust for scalars. For instance, if the metric recorded by Incentive Lab is Profit Margin, I multiply the target performance level by total sales at the end of the most recently-ended fiscal year. If it is ROA, I multiply the target performance level by total assets. I adjust similarly for EPS (shares outstanding), ROE (book value of equity), ROI or ROIC (invested capital4).
Next, I adjust for expenses according to the metric type. For instance, if the metric type is Cashflow or EBITDA, then I subtract depreciation expense, based on depreciation expense in the most recently-ended fiscal year. If the metric type is EBITDA, EBIT, or Operating Income, then I subtract interest expense, based on interest expense in the most recently-ended fiscal year. If the metric type is EBITDA, EBIT, Operating Income, or EBT, then I adjust for taxes. I calculate the effective tax rate as 1 minus the last fiscal year’s net income divided by the last fiscal year’s pre-tax income (1-NI/EBT). If this calculation yields a negative tax rate, I set the tax rate at zero. If it yields a tax rate above 35%, then I use 35%. Lastly, for metrics based on Economic Value Added (EVA), I subtract 10% of total asset values to proxy for cost of capital.
Adjustments based on Metric comments
Incentive Lab data includes another variable (METRICOTHER) that contains comments related to the metric type and how the metric is calculated. This is relevant, because often the necessary adjustments are not fully expressed by the metric type designation. For instance, if a performance target is based on EBT over Assets, Incentive Lab might designate the metric type as ROA, but note that it is based on pre-tax income in the comments section. In this case, it would be necessary to both adjust for the scalar (multiply by total assets) and deduct tax expense to arrive at a net income target. If I only look at the metric type (ROA) I would fail to make the necessary adjustment for taxes.
To account for this, I search for common adjustments in the METRICOTHER field in order make the requisite adjustments. Search terms include:
“pre” or “before” along with “tax” for pre-tax income “after” along with “tax” for after-tax income “EBIT” for earnings before interest and taxes “EBT” for earnings before taxes “Operating” for operating income “net of debt” for earnings after interest
4 I use the Compustat variable ICAPT, which is defined as the sum of: Long-term Debt (total), Preferred Stock (Carrying Value), Minority Interest (Balance Sheet), and Common Equity (total).

31
“free” (for cash flow targets) for free cash flow
I subsequently adjust income targets according to the results of these searches. For free cash flow targets I adjust for cost of capital using 10% of asset value.
B.4 Targets based on growth
When targets are expressed in terms of growth benchmarks (e.g. 10% over 3 years), I apply the relevant growth target to the most recent year’s income before extraordinary items, regardless of the metric specified.

32
References
Aranda, C, J. Arellano, and A. Davila. 2014. Ratcheting and the role of relative target setting. The Accounting Review 89 (4): 1197-1226.
Armstrong, C, J. Chau, C. D. Ittner, and J. J. Xiao 2017. Internal Versus External Earnings per Share Goals and CEO Incentives. Working paper, Chinese University of Hong Kong, University of Pennsylvania, and University of Rochester.
Ball, R., and P. Brown. 1968. An empirical evaluation of accounting income numbers. Journal of Accounting Research 6 (2): 159-178.
Beaver, W. H. 1968. The information content of annual earnings announcements. Journal of Accounting Research 6: 67-92.
Bernard, V. L., and J. K. Thomas. 1989. Post-earnings-announcement drift: delayed price response or risk premium? Journal of Accounting Research 27: 1-36.
Bettis, J.C., J. M. Bizjak, J. L. Coles, and S. L. Kalpathy. 2016. Performance-vesting provisions in executive compensation. Working paper, Arizona State University, Texas Christian University, and University of Utah.
Bloomfield, M. J. 2017. Product Market Competition, Disclosure and Strategic Delegation: Evidence from Revenue-Based Compensation. Working paper, University of Chicago.
Bouwens, J., and P. Kroos. 2011. Target ratcheting and effort reduction. Journal of Accounting and Economics 51 (1): 171-185.
Bouwens, J., and Peter K. 2016. The Interplay between Forward-Looking Measures and Target Setting. Management Science 63 (9): 2868 - 2884.
Bradshaw, M. T., S. A. Richardson, and R. G. Sloan. 2001. Do analysts and auditors use information in accruals? Journal of Accounting Research 39 (1): 45-74.
Brown, L. D., G. D. Richardson, and S. J. Schwager. 1987. An information interpretation of financial analyst superiority in forecasting earnings. Journal of Accounting Research 25 (1): 49-67.
Bhushan, R. 1989. Firm characteristics and analyst following. Journal of Accounting and Economics 11 (2): 255-274.
Carter, M. E., L. J. Lynch, and I. Tuna. 2007. The role of accounting in the design of CEO equity compensation. The Accounting Review 82 (2): 327-357.
Core, J. E. 2001. A review of the empirical disclosure literature: discussion. Journal of Accounting and Economics 31(1): 441-456.
Core, J. E., R. W. Holthausen, and D. F. Larcker. 1999. Corporate governance, chief executive officer compensation, and firm performance. Journal of Financial Economics 51 (3): 371-406.
Core, J. E., and H. A. Packard. 2017. Non-Price and Price Performance Vesting Provisions and Executive Incentives. Working paper, Massachusetts Institute of Technology.
33
Ferri, F., R. Zheng, and Y. Zou. 2017. Uncertainty in managers’ reporting objectives and investors’ response to earnings reports: Evidence from the 2006 executive compensation disclosures. Working paper, Columbia University and University of Texas.
Foster, G. 1973. Stock market reaction to estimates of earnings per share by company officials. Journal of Accounting Research 11 (1): 25-37.
Frankel, R., and C. MC Lee. 1998. Accounting valuation, market expectation, and cross-sectional stock returns. Journal of Accounting and Economics 25 (3): 283-319.
Gipper, B. 2016. “The Economic Effects of Mandating Expanded Compensation Disclosures.” Working paper, University of Chicago.
Goodman, T. H., M. Neamtiu, N. Shroff, and H. D. White. 2013. Management forecast quality and capital investment decisions. The Accounting Review 89 (1): 331-365.
Grossman, S. J., and O. D. Hart. 1983. An analysis of the principal-agent problem. Econometrica: Journal of the Econometric Society 51 (1): 7-45.
Gu, Z., and J. S. Wu. 2003. Earnings skewness and analyst forecast bias. Journal of Accounting and Economics 35 (1): 5-29.
Hassell, J. M., and R. H. Jennings. 1986. Relative forecast accuracy and the timing of earnings forecast announcements. Accounting Review 61 (1): 58-75.
Hayes, R. M., M. Lemmon, and M. Qiu. 2012. Stock options and managerial incentives for risk taking: Evidence from FAS 123R. Journal of Financial Economics 105 (1): 174-190.
Holmström, B. 1979. Moral hazard and observability. The Bell Journal of Economics 10 (1): 74-91.
Holmström, B., and P. Milgrom. 1987. Aggregation and linearity in the provision of intertemporal incentives. Econometrica: Journal of the Econometric Society 55 (2): 303-328.
Hwang, L.S., C.L. Jan, and S. Basu. 1996. Loss firms and analysts' earnings forecast errors. Journal of Financial Statement Analysis 1 (2): 18–30.
Indjejikian, R. J., M. Matějka, K. A. Merchant, and W. A. Van der Stede. 2014. Earnings targets and annual bonus incentives. The Accounting Review 89 (4): 1227-1258.
Indjejikian, R. J., M. Matějka, and J. D. Schloetzer. 2014. Target ratcheting and incentives: Theory, evidence, and new opportunities. The Accounting Review 89 (4): 1259-1267.
Kim, D. S., and J. Yang. 2014. Beating the target: Performance management around the annual incentive target. Working paper, Indiana University.
Laffont, J., and J. Tirole. 1993. A theory of incentives in procurement and regulation. MIT Press.
Li, Z., and L. Wang. 2016. Executive compensation incentives contingent on long-term accounting performance. The Review of Financial Studies 29 (6): 1586-1633.
Leone, A. J., and S. Rock. 2002. Empirical tests of budget ratcheting and its effect on managers’ discretionary accrual choices. Journal of Accounting and Economics 33 (1): 43-67.
34
Locke, E. A. 1968. Toward a theory of task motivation and incentives. Organizational Behavior and Human Performance 3 (2): 157-189.
Locke, E. A., K. N. Shaw, L. M. Saari, and G. P. Latham. 1981. Goal setting and task performance: 1969–1980. Psychological Bulletin 90 (1): 125.
Martin, X., H. Seo, and J. Yang. 2017. Pessimistic Earnings Guidance before Annual Incentive Plan Approval. Working paper, Indiana University, National University of Singapore, and Washington University in Saint Louis.
Merchant, K. A., and J. Manzoni. 1989. The Achievability of Budget Targets in Profit Centers: A Field Study. The Accounting Review 64 (3): 539.
Murphy, K. J. 1999. Executive compensation. Handbook of Labor Economics 3: 2485-2563.
Murphy, K. J. 2000. Performance standards in incentive contracts. Journal of Accounting and Economics 30 (3): 245-278.
Ng, J., I. Tuna, and R. Verdi. 2013. Management forecast credibility and underreaction to news. Review of Accounting Studies 18 (4): 956-986.
Packard, H. A. 2017. Why do firms disclose performance compensation targets? Working paper, Massachusetts Institute of Technology.
Patell, J. M. 1976. Corporate forecasts of earnings per share and stock price behavior: Empirical test. Journal of Accounting Research 14 (2): 246-276.
Pownall, G., and G. Waymire. 1989. Voluntary disclosure credibility and securities prices: Evidence from management earnings forecasts, 1969-73. Journal of Accounting Research 27 (2): 227-245.
Robinson, J. R., Y. Xue, and Y. Yu. 2011. Determinants of disclosure noncompliance and the effect of the SEC review: Evidence from the 2006 mandated compensation disclosure regulations. The Accounting Review 86 (4): 1415-1444.
Sloan, R. G., 1996. Do Stock Prices Reflect Information in Accruals and Cash Flows About Future Earnings? The Accounting Review 71 (3): 289-315.
Smith Jr, C. W., and R. L. Watts. 1992. The investment opportunity set and corporate financing, dividend, and compensation policies. Journal of Financial Economics 32 (3): 263-292.
Stedry, A. C., and E. Kay. 1966. The effects of goal difficulty on performance: A field experiment. Systems Research and Behavioral Science 11 (6): 459-470.
Waymire, G. 1986. Additional evidence on the accuracy of analyst forecasts before and after voluntary management earnings forecasts. The Accounting Review 61 (1): 129-142.
Weitzman, M. L. 1980. The “ratchet principle” and performance incentives. The Bell Journal of Economics 11 (1): 302-308.
35
Figure 1: Frequency of Months from Target Setting to Disclosure Date (n = 774)
0
50
100
150
200
250
300
3 4 5 6 7 8 9 10 11 12 13 14 15 19 21 22 25
Fre
quen
cy
Months between Grant Date and Disclosure Date
36
Table 1: Sample
Panel A: Sample Selection Firm-level year-three earnings-based targets related to Long-Term Cash, Restricted Stock, or
Option grants made to Incentive Lab CEOS from 2007 to 2011 1,063 Delete if missing controls data (e.g. book-to-market, market value, etc.) (25) 1,038 Delete if not disclosed in first proxy following grant (264) Full target sample 774 Sub-sample of targets with three-year earnings data 742
Panel B: Sample versus out-of-sample Incentive Lab Firm Characteristics
Sample
Firm-years Out-of-Sample
Firm-years Differences
(5) – (2) (1) (2) (3) (4) (5) (6) (7) (8) N Mean Std. Dev. N Mean Std. Dev. Mean t-stat.
Return on Assets 587 0.056 0.063 5,555 0.034 0.112 -0.022*** -4.57 Return 587 0.098 0.394 5,555 0.108 0.582 0.010 0.41 Loss 587 0.063 0.243 5,555 0.197 0.398 0.134*** 8.00 Log(Assets) 587 9.070 1.344 5,555 8.365 1.536 -0.705*** -10.69Log(Market Value) 587 8.760 1.229 5,555 8.171 1.370 -0.589*** -10.00 Book to Market 587 0.690 0.237 5,555 0.665 0.263 -0.026** -2.26 Idiosyncratic Volatility 587 0.268 0.129 5,555 0.345 0.178 0.077*** 10.24 Y0 Quarterly Management Forecast 587 0.986 0.116 5,555 0.977 0.148 -0.009 -1.40 Y0 Annual Management Forecast 587 0.918 0.274 5,555 0.907 0.290 -0.011 -0.86 Long-Range Management Forecast 587 0.361 0.481 5,555 0.291 0.454 -0.070*** -3.51 Pay Residual 587 0.500 4.895 5,555 -0.070 4.532 -0.570*** -2.87 %Institutional Ownership 587 0.752 0.201 5,555 0.751 0.240 -0.001 -0.05 Beat Forecast (% of quarters) 587 0.282 0.167 5,545 0.331 0.188 0.049*** 6.09 EPS Increase (% of quarters) 587 0.695 0.118 5,541 0.664 0.131 -0.031*** -5.55 % Equity Financing 587 0.740 0.171 5,552 0.740 0.213 0.001 0.06 This table describes the sample of 774 long-term earnings targets used in this analysis. Panel A describes the sample selection process. Panel B reports descriptive statistics for a sample of 6,142 Incentive Lab firm-years from 2007-2011, of which 587 are included in my sample. Return on Assets is equal to income before extraordinary items for the prior fiscal year, scaled by beginning-of-year assets. Return is equal to the buy-and-hold annual stock price return in the prior fiscal year. Loss is an indicator variable equal to one if net income in the prior fiscal year was negative, zero otherwise. Log(Assets) is the natural log of total asset value as of the prior fiscal year-end. Log(Market Value) is the natural log of the closing price multiplied by shares outstanding as of the prior fiscal year-end. Book to Market is the ratio of the book value of assets to the sum of market value of equity and book value of debt, as of the prior fiscal year-end. Idiosyncratic Volatility is the market-adjusted standard deviation of monthly returns during the three prior fiscal years. Y0 Quarterly and Y0 Annual Management Forecast are indicator variables equal to one if the firm issued current fiscal-year quarterly or annual guidance, respectively, in the year prior to grant, zero otherwise. Long-Range Management Forecast is an indicator variable equal to one if the firm issues guidance for a fiscal period ending one or more years in the future in the year prior to grant, zero otherwise. Pay Residual is the residual from a cross-sectional model of CEO pay (see footnote 2) for the prior fiscal year. %Institutional Ownership is the percent of firm equity held by institutional owners as of the prior fiscal year-end. Beat Forecast is the percent of quarters (out of all quarters recorded on I/B/E/S) that firm performance met or exceeded mean analyst EPS forecasts. EPS Increase is the percent of quarters (out of all of quarters on I/B/E/S) that firm performance met or exceeded performance in the same quarter

37
of the previous year. % Equity Financing is 1 minus the ratio of total debt to asset value as of the prior fiscal year-end. Columns (1) to (3) present statistics for those firm-years that have sample earnings targets. Columns (4) to (6) present statistics for the other Incentive Lab firm-years. Column (7) reports the mean difference between sample and out-of-sample firm-years. Column (8) reports corresponding t-statistics.
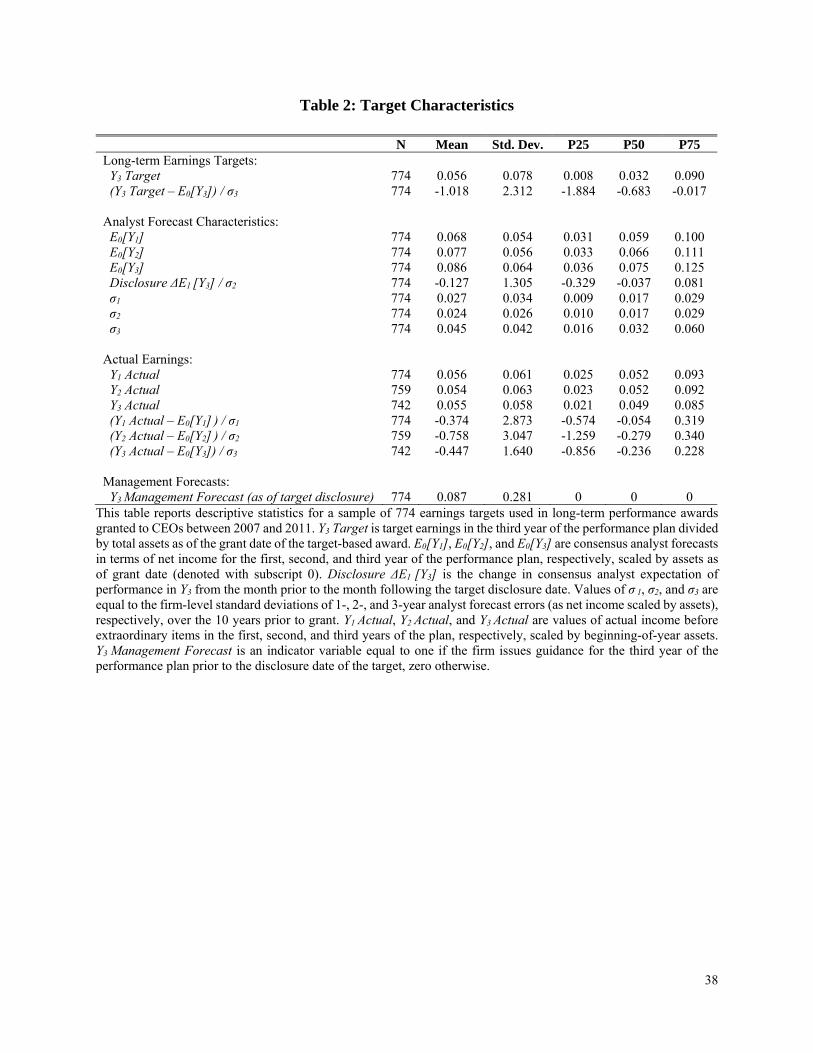
38
Table 2: Target Characteristics
N Mean Std. Dev. P25 P50 P75 Long-term Earnings Targets: Y3 Target 774 0.056 0.078 0.008 0.032 0.090 (Y3 Target – E0[Y3]) / σ3 774 -1.018 2.312 -1.884 -0.683 -0.017 Analyst Forecast Characteristics: E0[Y1] 774 0.068 0.054 0.031 0.059 0.100 E0[Y2] 774 0.077 0.056 0.033 0.066 0.111 E0[Y3] 774 0.086 0.064 0.036 0.075 0.125 Disclosure ΔE1 [Y3] / σ2 774 -0.127 1.305 -0.329 -0.037 0.081 σ1 774 0.027 0.034 0.009 0.017 0.029 σ2 774 0.024 0.026 0.010 0.017 0.029 σ3 774 0.045 0.042 0.016 0.032 0.060 Actual Earnings: Y1 Actual 774 0.056 0.061 0.025 0.052 0.093 Y2 Actual 759 0.054 0.063 0.023 0.052 0.092 Y3 Actual 742 0.055 0.058 0.021 0.049 0.085 (Y1 Actual – E0[Y1] ) / σ1 774 -0.374 2.873 -0.574 -0.054 0.319 (Y2 Actual – E0[Y2] ) / σ2 759 -0.758 3.047 -1.259 -0.279 0.340 (Y3 Actual – E0[Y3]) / σ3 742 -0.447 1.640 -0.856 -0.236 0.228 Management Forecasts: Y3 Management Forecast (as of target disclosure) 774 0.087 0.281 0 0 0
This table reports descriptive statistics for a sample of 774 earnings targets used in long-term performance awards granted to CEOs between 2007 and 2011. Y3 Target is target earnings in the third year of the performance plan divided by total assets as of the grant date of the target-based award. E0[Y1], E0[Y2], and E0[Y3] are consensus analyst forecasts in terms of net income for the first, second, and third year of the performance plan, respectively, scaled by assets as of grant date (denoted with subscript 0). Disclosure ΔE1 [Y3] is the change in consensus analyst expectation of performance in Y3 from the month prior to the month following the target disclosure date. Values of σ 1, σ2, and σ3 are equal to the firm-level standard deviations of 1-, 2-, and 3-year analyst forecast errors (as net income scaled by assets), respectively, over the 10 years prior to grant. Y1 Actual, Y2 Actual, and Y3 Actual are values of actual income before extraordinary items in the first, second, and third years of the plan, respectively, scaled by beginning-of-year assets. Y3 Management Forecast is an indicator variable equal to one if the firm issues guidance for the third year of the performance plan prior to the disclosure date of the target, zero otherwise.
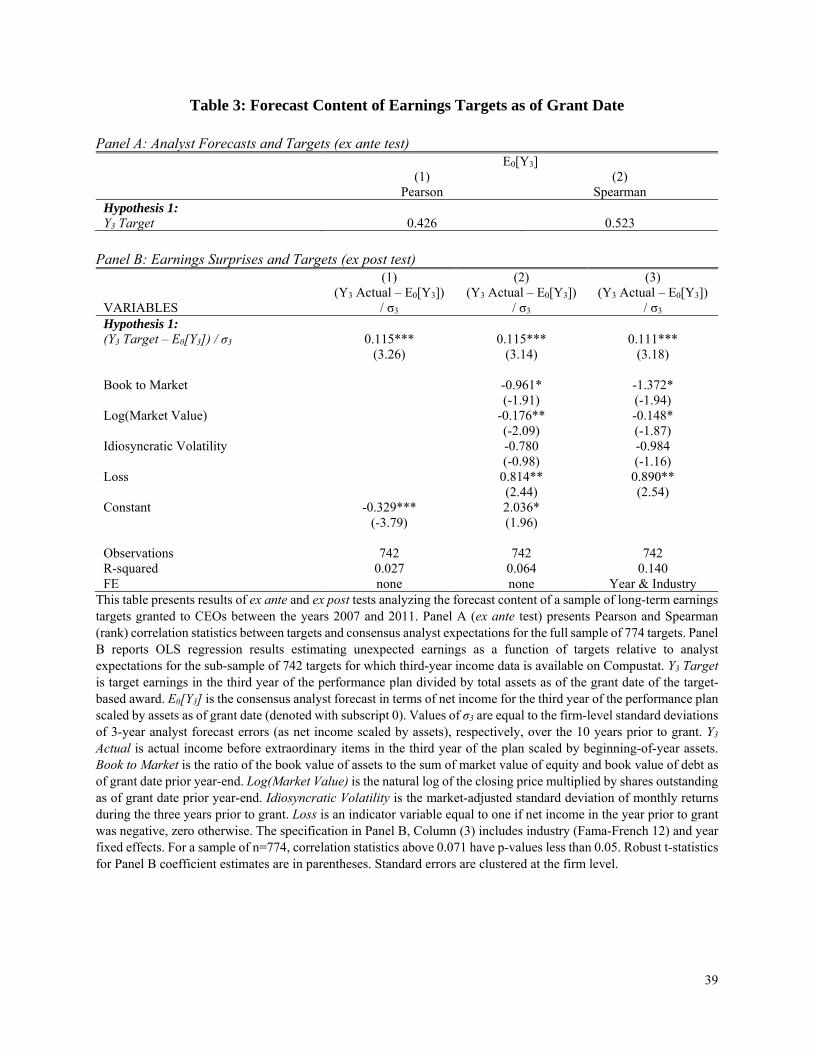
39
Table 3: Forecast Content of Earnings Targets as of Grant Date
Panel A: Analyst Forecasts and Targets (ex ante test)
E0[Y3] (1) (2) Pearson Spearman Hypothesis 1: Y3 Target 0.426 0.523
Panel B: Earnings Surprises and Targets (ex post test) (1) (2) (3)
VARIABLES (Y3 Actual – E0[Y3])
/ σ3 (Y3 Actual – E0[Y3])
/ σ3 (Y3 Actual – E0[Y3])
/ σ3 Hypothesis 1: (Y3 Target – E0[Y3]) / σ3 0.115*** 0.115*** 0.111***
(3.26) (3.14) (3.18)
Book to Market -0.961* -1.372* (-1.91) (-1.94)
Log(Market Value) -0.176** -0.148* (-2.09) (-1.87)
Idiosyncratic Volatility -0.780 -0.984 (-0.98) (-1.16)
Loss 0.814** 0.890** (2.44) (2.54)
Constant -0.329*** 2.036* (-3.79) (1.96)
Observations 742 742 742 R-squared 0.027 0.064 0.140 FE none none Year & Industry
This table presents results of ex ante and ex post tests analyzing the forecast content of a sample of long-term earnings targets granted to CEOs between the years 2007 and 2011. Panel A (ex ante test) presents Pearson and Spearman (rank) correlation statistics between targets and consensus analyst expectations for the full sample of 774 targets. Panel B reports OLS regression results estimating unexpected earnings as a function of targets relative to analyst expectations for the sub-sample of 742 targets for which third-year income data is available on Compustat. Y3 Target is target earnings in the third year of the performance plan divided by total assets as of the grant date of the target-based award. E0[Y3] is the consensus analyst forecast in terms of net income for the third year of the performance plan scaled by assets as of grant date (denoted with subscript 0). Values of σ3 are equal to the firm-level standard deviations of 3-year analyst forecast errors (as net income scaled by assets), respectively, over the 10 years prior to grant. Y3
Actual is actual income before extraordinary items in the third year of the plan scaled by beginning-of-year assets. Book to Market is the ratio of the book value of assets to the sum of market value of equity and book value of debt as of grant date prior year-end. Log(Market Value) is the natural log of the closing price multiplied by shares outstanding as of grant date prior year-end. Idiosyncratic Volatility is the market-adjusted standard deviation of monthly returns during the three years prior to grant. Loss is an indicator variable equal to one if net income in the year prior to grant was negative, zero otherwise. The specification in Panel B, Column (3) includes industry (Fama-French 12) and year fixed effects. For a sample of n=774, correlation statistics above 0.071 have p-values less than 0.05. Robust t-statistics for Panel B coefficient estimates are in parentheses. Standard errors are clustered at the firm level.
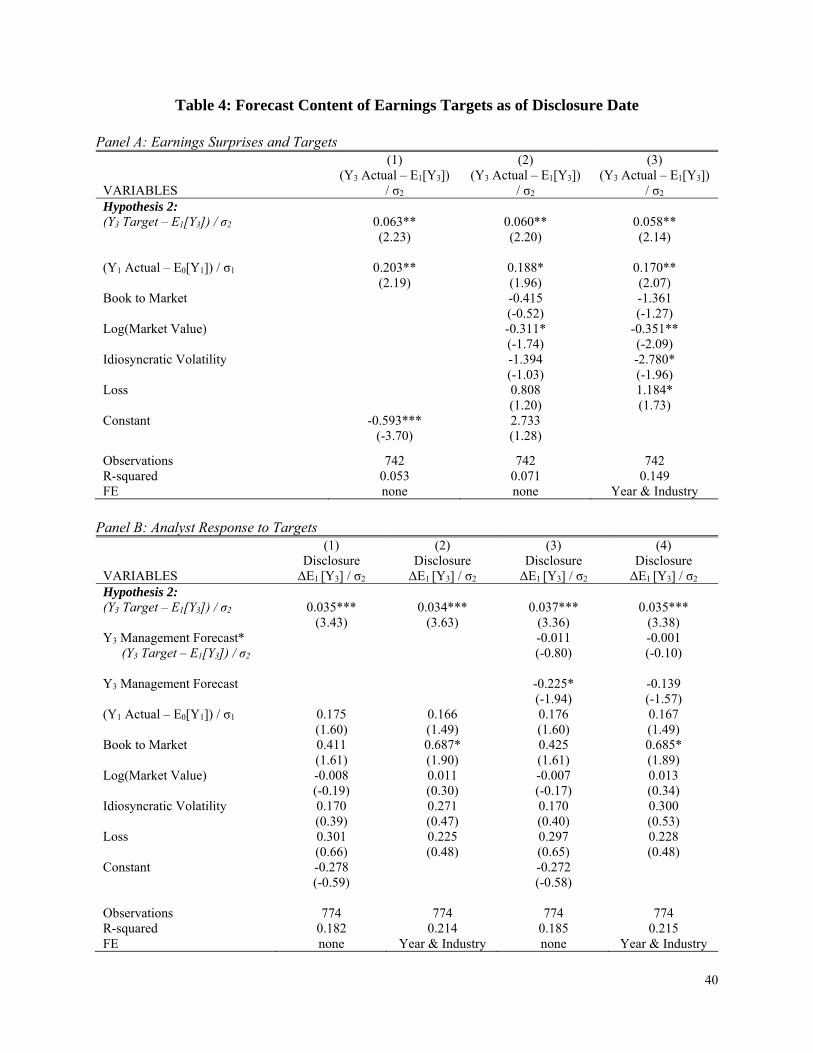
40
Table 4: Forecast Content of Earnings Targets as of Disclosure Date
Panel A: Earnings Surprises and Targets (1) (2) (3)
VARIABLES (Y3 Actual – E1[Y3])
/ σ2 (Y3 Actual – E1[Y3])
/ σ2 (Y3 Actual – E1[Y3])
/ σ2 Hypothesis 2: (Y3 Target – E1[Y3]) / σ2 0.063** 0.060** 0.058**
(2.23) (2.20) (2.14)
(Y1 Actual – E0[Y1]) / σ1 0.203** 0.188* 0.170** (2.19) (1.96) (2.07)
Book to Market -0.415 -1.361 (-0.52) (-1.27)
Log(Market Value) -0.311* -0.351** (-1.74) (-2.09)
Idiosyncratic Volatility -1.394 -2.780* (-1.03) (-1.96)
Loss 0.808 1.184* (1.20) (1.73)
Constant -0.593*** 2.733 (-3.70) (1.28)
Observations 742 742 742 R-squared 0.053 0.071 0.149 FE none none Year & Industry
Panel B: Analyst Response to Targets (1) (2) (3) (4)
VARIABLES Disclosure ΔE1 [Y3] / σ2
Disclosure ΔE1 [Y3] / σ2
Disclosure ΔE1 [Y3] / σ2
Disclosure ΔE1 [Y3] / σ2
Hypothesis 2: (Y3 Target – E1[Y3]) / σ2 0.035*** 0.034*** 0.037*** 0.035***
(3.43) (3.63) (3.36) (3.38) Y3 Management Forecast* -0.011 -0.001
(Y3 Target – E1[Y3]) / σ2 (-0.80) (-0.10)
Y3 Management Forecast -0.225* -0.139 (-1.94) (-1.57)
(Y1 Actual – E0[Y1]) / σ1 0.175 0.166 0.176 0.167 (1.60) (1.49) (1.60) (1.49)
Book to Market 0.411 0.687* 0.425 0.685* (1.61) (1.90) (1.61) (1.89)
Log(Market Value) -0.008 0.011 -0.007 0.013 (-0.19) (0.30) (-0.17) (0.34)
Idiosyncratic Volatility 0.170 0.271 0.170 0.300 (0.39) (0.47) (0.40) (0.53)
Loss 0.301 0.225 0.297 0.228 (0.66) (0.48) (0.65) (0.48)
Constant -0.278 -0.272 (-0.59) (-0.58)
Observations 774 774 774 774 R-squared 0.182 0.214 0.185 0.215 FE none Year & Industry none Year & Industry

41
The table reports OLS regression results estimating unexpected earnings as a function of Y3 performance targets relative to analyst expectations as of disclosure date for a sample of long-term targets granted to CEOs between the years 2007 and 2011. Panel A analyzes the sub-sample of 742 targets for which third-year income data is available on Compustat. Panel B uses the full sample of 774 targets. Y3 Target is target earnings in the third year of the performance plan divided by total assets as of the grant date of the target-based award. E1[Y3] is the consensus analyst forecast in terms of net income for the third year of the performance plan scaled by assets as of disclosure date (denoted with subscript 1). Disclosure ΔE1 [Y3] is the change in consensus analyst expectation of performance in Y3 from the month prior to the month following the target disclosure date. E0[Y1] is the consensus analyst forecast in terms of net income as grant date (denoted with subscript 0) for the first year of the performance plan scaled by the most recent reported assets. Y1 Actual and Y3 Actual are values of actual income before extraordinary items in the first and third years of the plan, respectively, scaled by beginning-of-year assets. Values of σ 1 and σ2 are equal to the firm-level standard deviations of 1- and 2-year analyst forecast errors (as net income scaled by assets), respectively, over the 10 years prior to grant. Y3 Management Forecast is an indicator variable equal to one if the firm issues guidance for the third year of the performance plan prior to the disclosure date of the target, zero otherwise. Book to Market is the ratio of the book value of assets to the sum of market value of equity and book value of debt as of grant date prior year-end. Log(Market Value) is the natural log of the closing price multiplied by shares outstanding as of grant date prior year-end. Idiosyncratic Volatility is the market-adjusted standard deviation of monthly returns during the three years prior to grant. Loss is an indicator variable equal to one if net income in the year prior to grant was negative, zero otherwise. The specifications in Panel A, Column (3) and Panel B, Columns (2) and (4) include industry (Fama-French 12) and year fixed effects. Robust t-statistics are in parentheses. Standard errors are clustered at the firm level.
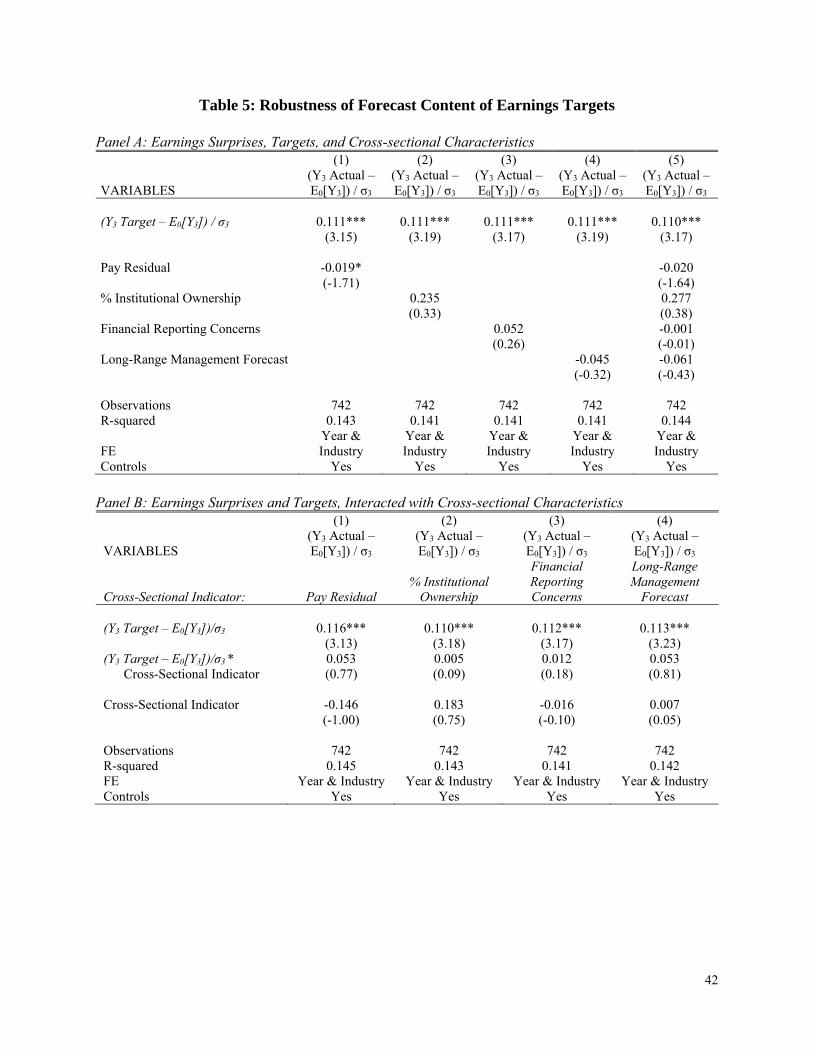
42
Table 5: Robustness of Forecast Content of Earnings Targets
Panel A: Earnings Surprises, Targets, and Cross-sectional Characteristics (1) (2) (3) (4) (5)
VARIABLES (Y3 Actual – E0[Y3]) / σ3
(Y3 Actual – E0[Y3]) / σ3
(Y3 Actual – E0[Y3]) / σ3
(Y3 Actual – E0[Y3]) / σ3
(Y3 Actual – E0[Y3]) / σ3
(Y3 Target – E0[Y3]) / σ3 0.111*** 0.111*** 0.111*** 0.111*** 0.110***
(3.15) (3.19) (3.17) (3.19) (3.17)
Pay Residual -0.019* -0.020 (-1.71) (-1.64) % Institutional Ownership 0.235 0.277 (0.33) (0.38) Financial Reporting Concerns 0.052 -0.001 (0.26) (-0.01) Long-Range Management Forecast -0.045 -0.061 (-0.32) (-0.43)
Observations 742 742 742 742 742 R-squared 0.143 0.141 0.141 0.141 0.144
FE Year & Industry
Year & Industry
Year & Industry
Year & Industry
Year & Industry
Controls Yes Yes Yes Yes Yes
Panel B: Earnings Surprises and Targets, Interacted with Cross-sectional Characteristics (1) (2) (3) (4)
VARIABLES (Y3 Actual – E0[Y3]) / σ3
(Y3 Actual – E0[Y3]) / σ3
(Y3 Actual – E0[Y3]) / σ3
(Y3 Actual – E0[Y3]) / σ3
Cross-Sectional Indicator: Pay Residual % Institutional
Ownership
Financial Reporting Concerns
Long-Range Management
Forecast (Y3 Target – E0[Y3])/σ3 0.116*** 0.110*** 0.112*** 0.113***
(3.13) (3.18) (3.17) (3.23) (Y3 Target – E0[Y3])/σ3 * 0.053 0.005 0.012 0.053
Cross-Sectional Indicator (0.77) (0.09) (0.18) (0.81)
Cross-Sectional Indicator -0.146 0.183 -0.016 0.007 (-1.00) (0.75) (-0.10) (0.05)
Observations 742 742 742 742 R-squared 0.145 0.143 0.141 0.142 FE Year & Industry Year & Industry Year & Industry Year & Industry Controls Yes Yes Yes Yes

43
This table analyzes the robustness of the forecast content of a sub-sample of 742 earnings targets granted to CEOs between the years 2007 and 2011 for which third-year income data is available on Compustat. OLS regression results are reported in Panels A and B. Y3 Target is target earnings in the third year of the performance plan divided by total assets as of the grant date of the target-based award. E0[Y3] is the consensus analyst forecast in terms of net income for the third year of the performance plan scaled by assets as of grant date (denoted with subscript 0). Values of σ3 are equal to the firm-level standard deviations of 3-year analyst forecast errors (as net income scaled by assets), respectively, over the 10 years prior to grant. Y3 Actual is actual income before extraordinary items in the third years of the plan scaled by beginning-of-year assets. Pay Residual is the residual from a cross-sectional model of CEO pay (see footnote 2) for the fiscal year prior to grant. %Institutional Ownership is the percent of firm equity held by institutional owners as of the fiscal year-end prior to grant. Financial Reporting Concerns is equal to the mean of the standardized values of the following: 1) the percent of quarters (out of all of those recorded on I/B/E/S) that firm performance met or exceeded mean analyst EPS forecasts (Beat Forecast), 2) the percent of quarters (out of all of those recorded on I/B/E/S) that firm performance met or exceeded performance in the same quarter of the previous year (EPS Increase), and 3) 1 minus the ratio of total debt to asset value as of the end of the fiscal year prior to grant (% Equity Financing). Cross-Sectional Indicator is equal to 0.5 if the cross-sectional variable listed in each of Columns (1) to (4) in Panel B is above the median value for the given fiscal year, -0.5 otherwise. All specifications in Panels A and B include year and (Fama-French 12) industry fixed effects, along with the following controls: Book to Market is the ratio of the book value of assets to the sum of market value of equity and book value of debt as of grant date prior year-end. Log(Market Value) is the natural log of the closing price multiplied by shares outstanding as of grant date prior year-end. Idiosyncratic Volatility is the market-adjusted standard deviation of monthly returns during the three years prior to grant. Loss is an indicator variable equal to one if net income in the year prior to grant was negative, zero otherwise. Robust t-statistics are in parentheses. Standard errors are clustered at the firm level.
![GROUP VOLUNTARY LONG-TERM DISABILITY INSURANCE …...Insured’s monthly [Pre-Disability Earnings/Basic Monthly Pay] $3,000 Long term disability benefits percentage x 60% Unreduced](https://static.fdocuments.us/doc/165x107/5f7560dbe22a2c37c74352aa/group-voluntary-long-term-disability-insurance-insuredas-monthly-pre-disability.jpg)