Are Immigrants Graded Worse in Primary and Secondary ... · Are Immigrants Graded Worse in Primary...
31
RUHR ECONOMIC PAPERS Are Immigrants Graded Worse in Primary and Secondary Education? Evidence for German Schools #223 David Kiss
Transcript of Are Immigrants Graded Worse in Primary and Secondary ... · Are Immigrants Graded Worse in Primary...

RUHRECONOMIC PAPERS
Are Immigrants Graded Worsein Primary and Secondary Education?Evidence for German Schools
#223
David Kiss
Imprint
Ruhr Economic Papers
Published by
Ruhr-Universität Bochum (RUB), Department of EconomicsUniversitätsstr. 150, 44801 Bochum, Germany
Technische Universität Dortmund, Department of Economic and Social SciencesVogelpothsweg 87, 44227 Dortmund, Germany
Universität Duisburg-Essen, Department of EconomicsUniversitätsstr. 12, 45117 Essen, Germany
Rheinisch-Westfälisches Institut für Wirtschaftsforschung (RWI)Hohenzollernstr. 1-3, 45128 Essen, Germany
Editors
Prof. Dr. Thomas K. BauerRUB, Department of Economics, Empirical EconomicsPhone: +49 (0) 234/3 22 83 41, e-mail: [email protected]
Prof. Dr. Wolfgang LeiningerTechnische Universität Dortmund, Department of Economic and Social SciencesEconomics – MicroeconomicsPhone: +49 (0) 231/7 55-3297, email: [email protected]
Prof. Dr. Volker ClausenUniversity of Duisburg-Essen, Department of EconomicsInternational EconomicsPhone: +49 (0) 201/1 83-3655, e-mail: [email protected]
Prof. Dr. Christoph M. SchmidtRWI, Phone: +49 (0) 201/81 49-227, e-mail: [email protected]
Editorial Offi ce
Joachim SchmidtRWI, Phone: +49 (0) 201/81 49-292, e-mail: [email protected]
Ruhr Economic Papers #223
Responsible Editor: Christoph M. Schmidt
All rights reserved. Bochum, Dortmund, Duisburg, Essen, Germany, 2010
ISSN 1864-4872 (online) – ISBN 978-3-86788-255-2
The working papers published in the Series constitute work in progress circulated to stimulate discussion and critical comments. Views expressed represent exclusively the authors’ own opinions and do not necessarily refl ect those of the editors.

Ruhr Economic Papers #223
David Kiss
Are Immigrants Graded Worse in Primary and Secondary Education?
Evidence for German Schools

Bibliografi sche Informationen der Deutschen Nationalbibliothek
Die Deutsche Bibliothek verzeichnet diese Publikation in der deutschen National-bibliografi e; detaillierte bibliografi sche Daten sind im Internet über: http//dnb.ddb.de abrufb ar.
ISSN 1864-4872 (online)ISBN 978-3-86788-255-2

David Kiss1
Are Immigrants Graded Worse in Primary and Secondary Education? – Evidence for German schools
AbstractUsing PIRLS 2001 and PISA 2003 data for Germany, this paper examines whether immigrants attending primary and secondary school are graded worse in math than comparable natives. Controlling for diff erences in math skills, class fi xed eff ects regressions and results of a matching approach suggest that immigrants have grade disadvantages in primary education. In Germany, track choice after primary education is mainly determined by the average of grades obtained in math and German. Hence, grade disadvantages could lead to lower level track choice. Immigrants who attend the most common secondary school tracks are not graded diff erently from natives.
JEL Classifi cation: C40, I21, J15
Keywords: Grading; educational system; migration background; matching
November 2010
1 University of Erlangen-Nuremberg, former affi liation: RWI. – I am grateful to Guido Schwerdt for motivating my research on educational outcomes of immigrants. I also thank Leilanie Basilio, Thomas K. Bauer, Alfredo R. Paloyo, Regina T. Riphahn, Marcus Tamm and participants of the international workshop on applied economics of education (IWAEE 2010) for helpful comments and suggestions. Financial support by the WGL (“Initiative for Research”, Project leader: Andrea Weber) is gratefully acknowledged. The data were produced by IFS Dortmund (IGLU/PIRLS 2001) and provided to me by the research data center (FDZ) at IQB Berlin, whose staff I thank for their help and support. All remaining errors are my own. – All correspondence to David Kiss, University of Erlangen-Nuremberg, Lange Gasse 20, 90403 Nuremberg, Germany, E-Mail: [email protected].

4
1. Introduction
In Germany, about 30% of pupils have a migration background (Census Bureau 2009). Ri-
phan (2001) and Schnepf (2007) found that immigrants perform worse than natives in educa-
tional achievement surveys. As a consequence, immigrants are more likely to attend lower
level tracks. However, immigrants should not be graded differently from natives with similar
skills, as measured by test scores. Using two representative cross-sectional surveys for Ger-
many, "Progress in International Reading Literacy Study 2001" (PIRLS 2001) and "Pro-
gramme for International Student Assessment 2003" (PISA 2003), this paper examines
whether immigrant children are graded worse in math at the primary and secondary schooling
levels after accounting for differences in math test scores.
Track choice after primary education is mainly determined by the average of grades obtained
in math and German. The final degree from secondary school largely determines future labor
market outcomes like income or the probability of becoming unemployed (Dustmann 2004).
Hence, grade disadvantages at the end of primary education could have serious long-term
effects on a pupil's economic situation.
Only a small number of studies examined for Germany whether immigrant pupils are graded
worse than natives once differences in skills are controlled for. Kristen (2006) finds no evi-
dence as to whether immigrant children have a grade disadvantage in math or German at the
end of primary education. In Ditton (2005), immigrants are somewhat graded worse in the
third grade. However, both studies are not representative for Germany, since the analyzed
data have been collected for single federal states.1 The paper that is closest to this analysis is
Lüdemann & Schwerdt (2010) who primarily focus on track choice and potential earnings
profiles of immigrants. Using PIRLS 2001 data, which were restricted to Western Germany,
they find that second generation immigrants are graded worse in Math at the end of their pri-
mary education, although differences in cognitive abilities are additionally taken into account.
The setting in Sprietsma (2009) is somewhat different: Using identical sets of essays written
by fourth-graders from German schools, she randomly assigns typical German and Turkish
names to test the effect of teacher expectations regarding immigrant background on grades.
She finds that essays bearing Turkish names are significantly graded worse.
1 The data in Kristen (2006) were collected for the city Mannheim, which is located in Baden-Württemberg. The data in Ditton (2005) are representative for the fedral state Bavaria.

5
The analysis of the data leads to three main findings: (i) Class fixed effects estimates and re-
sults of a matching approach suggest that second generation immigrants attending primary
school are graded worse than comparable natives. (ii) Regarding first generation immigrants
in primary education, empirical evidence is not clear. Depending on the chosen specification,
evidence for the existence as well as the non-existence of grade disadvantages can be given.
(iii) After track choice, immigrants are not graded differently from comparable natives.
This study contributes to the literature in several ways: (i) The focus on math grades is moti-
vated by the assumption that grading-relevant characteristics are sufficiently captured by math
test scores.2 The problem of biased estimates due to omitted variables is broadly discussed
here. (ii) Regarding Germany, other studies solely focused on primary education. This study
also evaluates the impact of immigrant background on grades at the most common secondary
school tracks. (iii) Results of a non-parametric matching approach from the labor market lite-
rature allow a more precise interpretation of class fixed effects estimates.
The paper is organized as follows. Section 2 briefly describes the data and derives the estima-
tion strategy. In section 3, the main results are presented and potential omitted variable biases
are discussed. Section 4 concludes.
2. Empirical strategy
2.1 PIRLS 2001 and PISA 2003
Two educational achievement surveys are used in this study: PIRLS 2001 focuses on pupils at
the end of their primary education while PISA 2003 covers ninth-graders in secondary
school.3 Primary education generally ends after the fourth grade when children are 10 years
old. The most common tracks in secondary education are Gymnasium (which is seen as the
highest track), Realschule (intermediate) and Hauptschule (lowest secondary track level).4
Math tests used multiple choice and open-ended questions. Figure 1a and Figure 1b show
some example exercises from PIRLS and PISA, respectively. These exercises also control for
2 For instance, the data do not contain an objective measure for spoken language skills. Thus, estimating the impact of migration background on grades in German is potentially biased if only differences in reading skills are controlled for. 3 PISA 2003 consists of three parts: PISA-international (PISA-I) is the smallest data set. It were collected for international comparisons. In Germany, this data set has been extended twice: PISA-I-PLUS (which is used here) and PISA-E. 4 There exist additional secondary school forms, like comprehensive schools (Gesamtschulen). These are left out from the analysis, since the final degree obtained from these schools cannot be clearly ranked with degrees from Gymnasium, Realschule or Hauptschule. In PISA, 20% of the pupils attend alternative secondary school tracks.

6
language skills, since pupils with a bad command of the German language may not fully un-
derstand the exercises which would result to lower test scores.
Apart from test scores, additional data were collected from questionnaires completed by stu-
dents, parents, teachers and principals. Most information about the pupil, namely its math
grades in the last school report and its migration background are obtained from the student
questionnaire.5 In both surveys, schools are the primary sampling unit. Within each school,
classes have been randomly chosen. All pupils attending a drawn class participated in the tests
on a voluntary basis.
2.2 Class fixed effects model
The impact of immigrant background on math grades is estimated with the following model:
��� � � � ����� � ������� � ������
� � �� � ���. (1)
��� is the self-reported math grade of student � attending class �. �� is the test score in
math. Within a schooling level or track, �� has mean 0 and standard deviation 1. � con-
trols for class fixed effects, while errors � are clustered on class level. Migration background
is captured by the dummy variables ���� and ����, where the superscript distinguishes be-
tween first and second generation immigrants. A pupil is a first generation immigrant if it was
born abroad. Second (or higher) generation immigrants are born in Germany and satisfy at
least one of the following conditions: (i) at least one parent was born abroad or (ii) languages
other than German are (also) spoken at home. A child is treated as a native, if it is born in
Germany, as well as its parents, and German is the only language spoken at home.
In Germany, one subject is usually taught by the same teacher during the whole school year.
Hence, class fixed effects � control for the average teacher effect on math grades. Grading
practices usually differ among teachers. For instance, they can be influenced by average skills
on class level (Himmler & Schwager 2007 and Dardanoni, Modica & Pennsi 2009), the (con-
troversial) impact of class size and its determinants on student's performance (Angrist & Lavy
1999 and Wößmann & West 2006) or the teacher's aspiration level (Iacus & Porro 2008).6
5 PIRLS took place in May 2001 while PISA was conducted from March to August 2003. Pupils receive their half-yearly school reports by the end of February. 6 The usage of class fixed effects (instead of teacher fixed effects) makes sense even if two classes are taught by the same teacher because these classes could be different e.g. in terms of shares of skilled pupils or in the progress in the syllabus, which could lead to differences in applied grading practices in those classes.

7
Summing up, � captures the impact of grading-relevant characteristics, while � and � are
expected to be estimated insignificantly. Calculations are carried out separately on the four
subsamples primary school, Gymnasium, Realschule and Hauptschule.7
In Germany, 1 is the best grade and 6 the worst. For the purpose of this study, math grades
have been recoded to range from 0 (fail) to 5 (very good). As shown in Table 1, natives in
primary school and Gymnasium obtain better grades than immigrants. Differences in mean
grades are relatively small in secondary education. First generation immigrants are graded
best in Realschule and Hauptschule.
The higher a pupil's math test score the higher its math proficiency. Mean math test scores are
similarly distributed within each schooling level and track: natives perform best, as followed
by second generation immigrants who perform better than first generation immigrants. Immi-
grants are more likely to attend classes with low levels of average math proficiency since,
compared to natives, average math test scores on class level are significantly lower in classes
that are attended by immigrants.
2.3 Matching approach
The matching approach originates from the labor market literature. In Ñopo (2008), a non-
parametric alternative to the classical Blinder-Oaxaca decomposition (see Blinder 1973) is
used to estimate gender wage gaps.8 It depends on matching men and women that are similar
in terms of relevant labor market characteristics like education or potential work experience
and calculating the wage differentials of matched individuals. For the purpose of this study,
the wage gap between men and women can be transformed into a math grade gap between
natives and immigrants with same math test scores.
The approach depends on constructing "statistical twin couples" which always consist of an
immigrant and a native sibling. The grade difference between siblings is the variable of inter-
est. The procedure can be split up into two steps: First, each immigrant attending a class � is
matched on a native child with similar math test score ���. Therefore, immigrants are left out
if no suitable native child attends the same class. However, sometimes an immigrant child can
be matched on more than one native from the same class. In these cases, � � � clones of the
immigrant child are created which are indexed by �. In the second step, the grade difference of
7 Lüdemann & Schwerdt (2010) also report results of a similar regression. They additionally control for cognitive abilities and a broad set of individual and socio-economic background variables. 8 Ñopo (2008) is mainly motivated by Barsky et al. 2002 who analyzed the black-white wealth gap in the United States.

8
each statistical twin couple is calculated and weighted by ���, the inverse of the number of
suitable native siblings. Grade gaps are denoted by ������ .9 By definition, positive values of �����
�
imply a grade advantage for immigrants and vice versa. Consequently, ������ � � means that
the immigrant and native sibling are not graded differently. The approach is derived in more
detail in the appendix.
Compared to OLS, matching has two advantages: (i) For each class, OLS assumes the same
linear relationship between grades and test scores. The matching approach, however, requires
no assumption regarding the functional relationship between grades and relevant characteris-
tics. Hence, matching allows for differences in applied grading practices. (ii) Grade differen-
tials obtained by matching solely depend on pupils that are comparable in terms of relevant
characteristics. In OLS, immigrants and natives that remain unmatched also contribute to the
estimation of the parameters.
However, matching makes sense only for groups which do not differ too much in relevant
characteristics. Figure 2 illustrates the distributions of math test scores of immigrants and na-
tives. In most cases, the common area between the distributions of second generation immi-
grants and natives is larger than the common area between first generation immigrants and
natives. Thus, a larger share of second generation immigrants can be matched on natives.
3. Results and discussion
3.1 Main results
Table 2 contains class fixed effects estimates of migration background on math grades. As
expected, the highly significant estimates for math test scores imply that high test scores are
correlated with better grades. Compared to natives, first and second generation immigrants
attending primary school are graded worse 0.23 grades on average. Figure 3a depicts the dis-
tribution of grade gaps ������ of matched first generation immigrants attending primary school.
380 first generation immigrants from 199 classes were matched on 540 natives.10 For test
scores between -2 and 2, the 90% confidence band of the smoothed regression line runs below
the zero-grade-gap line. Therefore, Figure 3a confirms the findings in Table 2.
9 As already mentioned, � is the index of the class, while � (with � � � ! "�) is the index of matching variable that constitutes a statistical twin couple in that class. � is the index of the (cloned) immigrant for matching variable ���. 10 Since the number of grade gaps (540) exceeds the number of first generation immigrants (380), some of them have been "cloned".
9
Figure 3b plots the smoothed regression line for second generation immigrants attending pri-
mary school. Here, 297 immigrants have been matched on 429 natives. For test scores smaller
than zero, the 90% confidence band of the smoothed regression line overlaps with the zero-
grade-gap line. This implies that second generation immigrants with a test score smaller than
zero are not graded differently from natives. Compared to natives, however, second genera-
tion immigrants with test scores above zero are graded worse since the confidence band of the
smoothed regression line runs below the zero-grade-gap line. The results from the matching
approach suggest that the negative estimate for second generation immigrant status in Table 2
is caused by well-performing second generation immigrants.
Regarding Gymnasium, class fixed effects estimates imply that immigrants and natives are
graded the same way. The matching approach confirms this finding since the smoothed re-
gression lines in Figure 4a and Figure 4b do not significantly deviate from the zero-grade-gap
line. For Realschule, it can be inferred from Figure 5a that the positive estimate for first gen-
eration immigrant status in Table 2 is caused by first generation immigrants with test scores
below zero. The insignificant estimate for second generation immigrant status is consistent
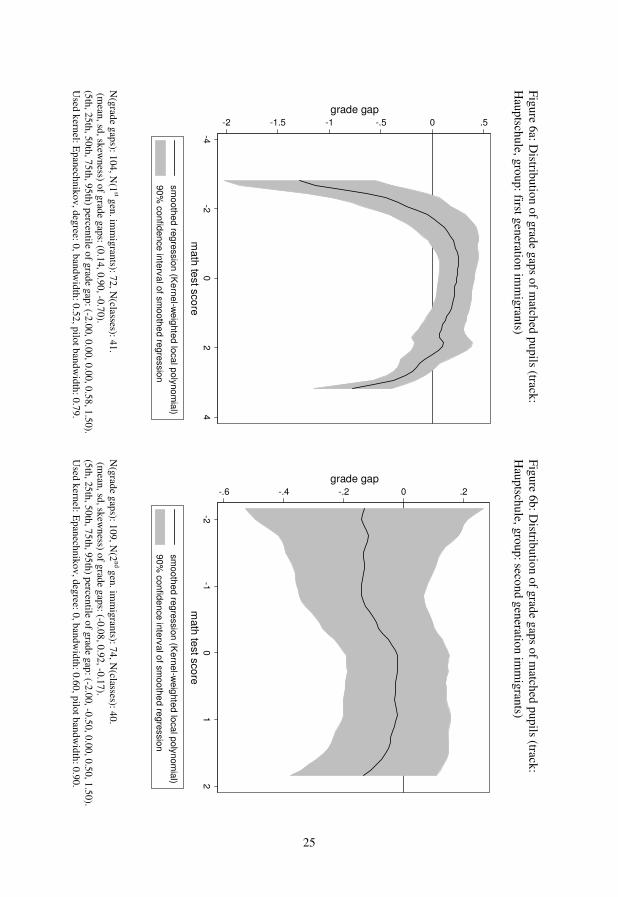
with the related smoothed regression in Figure 5b. Regarding Hauptschule, class fixed effects
estimates suggest that first generation immigrants have a grade advantage. More precisely,
first generation immigrants with test scores between −1 and 1 are graded better as shown in
Figure 6a. Second generation immigrants attending Hauptschule are not graded differently
from natives as indicated by the related estimate and Figure 6b.
3.2 Omitted variable bias?
Only in primary education, first and second immigrants are systematically graded worse. On
the other hand, first generation immigrants attending Realschule or Hauptschule are graded
better than comparable natives. Second generation immigrants in secondary education are not
graded differently from natives.
However, results in Table 2 could be biased due to unobserved heterogeneity for at least three
reasons. (i) Documents from the German educational ministry state that grading should solely
depend on the student's performance in written exams and its oral participation (KMK 2009:
130). It is likely that math skills and oral participation in math are strongly correlated. How-
ever, differences in oral participation are not taken into account in Table 2. (ii) Although es-
timates of test scores are highly significant, there is a possibility that math proficiency is in-
sufficiently captured by math test scores. (iii) Other pupil characteristics, like sex or educa-

10
tional background of parents, could additionally affect grading although math skills are con-
trolled for.
In Table 3, different sets of controls are taken into account: In the first columns math skills
are considered as the only grading-relevant characteristic. Consequently, these estimates are
identical to those in Table 2. In the second columns of Table 3, differences in self-reported
oral participation in math are additionally controlled for. In both surveys, pupils were asked to
which extent they agree with the statement "I frequently participate in math". The four possi-
ble outcomes of that variable have been decomposed into four dummy variables.
Comparing columns (1) and (2) in Table 3 shows that oral participation is strongly correlated
with math grades. Regarding the impact of immigrant background on grades, however, esti-
mates for immigrant status remain almost unaffected in primary education and Gymnasium.
In Realschule and Hauptschule, estimates for first generation immigrant status become insig-
nificant. Thus one could draw the conclusion that first generation immigrants attending Real-
schule are not graded differently from natives if differences in math skills and oral participa-
tion are controlled for. From that point of view, the positive grade gaps in Figure 5a and Fig-
ure 6a are caused by higher participation rates of (a sufficiently large share of) first generation
immigrants.
Instead of oral participation, reading skills are additionally controlled for in the third columns
of Table 3. Comparing columns (3) with columns (1) for all secondary school tracks, the
point-estimate for reading skills is close to zero and insignificant. Estimates for the impact of
immigrant background on math grades are almost identical in columns (3) and (1). In primary
education, however, controlling additionally for reading skills yields insignificant point esti-
mates for first generation immigrant status. Second generation immigrants in primary educa-
tion are still graded worse but the absolute value of the estimate decreases by about 50%.
Depending on the schooling level, once differences in oral participation or reading skills are
controlled for, estimates for the impact of immigrant status remain almost unchanged if oral
participation and reading skills (columns 4) as well as other pupil characteristics (column 5)
are additionally taken into account. Regarding columns (5), it is noteworthy that controlling
amongst others for the highest educational background of parents does not change the coeffi-
cients for immigrant status. On average, immigrants' parents hold lower level school degrees.

11
However, differences in grading practices applied on immigrants and natives are driven by
differences in socio-economic background variables.11
3.3 Do first generation immigrants in primary education suffer from grade disadvantages?
It can be inferred from Table 3 that immigrants in secondary school are not graded differently
from natives. Regarding primary education, no clear answer can be given to the question
whether column (1) or (3) should be considered as relevant for the research question.
One should rely on the results in column (3) if grading-relevant characteristics are additional-
ly captured by reading skills. Hence, one must try to explain why reading skills have a large
impact in primary education but are irrelevant in secondary education at the same time. There
are at least three explanations for this pattern: (i) Math skills could be insufficiently measured
in PIRLS since the math test took 20 minutes (Bos et al. 2003: 196). In PISA, pupils were
tested for a total of 210 minutes (Baumert et al. 2004: 29). From that point of view, one
should rely more on estimates in column (3). On the other hand, 20 minutes should be enough
to evaluate basic math skills of fourth graders. Furthermore, math tests in PIRLS are mainly in
accordance with the German curriculum (Bos et al. 2003: 193). (ii) Main subjects in primary
school, namely math and German, are usually taught by the same teacher. Subject teachers are
common in secondary school. If teachers in primary education do not clearly distinguish be-
tween a student's performance in math and German when grading, math grades could be cor-
related with skills that are relevant for German. This reasoning would be consistent with the
finding that reading skills have no impact on math grades in secondary education once math
skills are controlled for. If this is the case, reading skills may not be considered as grading-
relevant for math. (iii) Depending on the schooling level and age of a child, reading skills
could capture different aspects of proficiency: In primary education, reading skills could
measure grading-relevant characteristics like the scope of vocabulary or capability of under-
standing spoken German. In PISA, pupils are five years older than in PIRLS. Consequently,
the scope of vocabulary as well as the capability of understanding could have strongly im-
proved meanwhile. Hence, one should rely on the results in column (3). On the other hand,
math tests in PIRLS control indirectly for differences in basic language skills since most exer-
cises consist of short texts (see Figure 1a).
11 The only exception are first generation immigrants in Hauptschule. The related estimate becomes insignificant only in column (5).

12
Regarding primary education, there are convincing arguments which support and refute the
hypothesis that reading skills do additionally capture grading-relevant characteristics in math
once differences in math skills are taken into account. Hence, the scope of the grade disadvan-
tage in primary education ranges from zero (insignificancy) to 0.23 for first generation immi-
grants and 0.12 to 0.23 for second generation immigrants.
4. Conclusion
Assuming that math test scores, as measured in PIRLS and PISA, sufficiently capture all
grading-relevant characteristics in the subject math, this paper examined whether immigrants
are graded worse in primary and secondary school if differences in math skills are controlled
for. Class fixed effects regressions and results from a non-parametric matching approach sug-
gest that immigrants attending the most common secondary school tracks are not graded diffe-
rently from natives.
Regarding primary school, there is robust empirical evidence that second generation immi-
grants are graded worse than natives although differences in math skills are taken into ac-
count. More precisely, the related matching estimates imply that second generation immi-
grants who performed above-average in the PIRLS math tests are the group which suffers
from grade disadvantages. Only if math and reading skills are considered as grading-relevant,
first generation immigrants attending primary school are graded like natives.
In Germany, track choice after primary education mainly depends on the average of grades
obtained in math and German. Consequently, grade disadvantages for immigrants in primary
education could result to biased track choice which is supported by the results of Lüdemann
and Schwerdt (2010) who find an educational disadvantage for second-generation immigrants
at the transition to secondary schools.12 This is a serious problem since (i) immigrants already
account for 30% of the student body in primary education and (ii) track choice has a lifelong
impact on the future economic situation of a pupil.
12 Most students do not change tracks after their initial choice, although it is generally possible (Schnepf 2002).

13
Appendix
Derivation and properties of the matching approach
Let #�$ be the set of observed math test scores of group % (% � & �) in class �. % distinguish-
es between natives & and immigrants �. In the following, the subscript � in #�$ will be omit-
ted, since the results of the theoretical concept are the same for any class. #$ consists of two
subsets:
#$ � '($ ) '$, (2)
with
'($ � #$ * ++ #�$ and '$ � #$ , #�$, where - % � � if % � & and vice versa.
'$ is the subset of #$ which overlaps with #�$, so '$ � '�$. '($ is the subset of #$ with
'($ , #�$ � .+/.
Let �01�2 � 31�4& �2 and �51�2 � 31�4� �2 be the expected values of math grades �,
conditional on migration background and test scores � 6 #$. �$1�2 may be considered as the
grading practices applied on pupils with identical test scores and migration background. The
difference in mean grades � can be expressed as
� � 31�4&2 � 31�4�2 � 7 �01�2801�29�:; � 7 �51�2851�29�:< , (3)
where 8$1�2 are the corresponding probability densities. Using equation (2) yields
� � =7 �01�2801�29�>(; � 7 �01�2801�29�>; ? � =7 �51�2851�29�>< � 7 �51�2851�29�>(< ?. (4)
Since #$ , #�$ � '0 � '5, (4) can be rewritten as
� � 7 �01�2801�29�>(; � 7 �51�2851�29�>(< � �@ � �A � �@, (5)
with
�@ � 7 �01�2801�29�:B , :CB � 7 �51�2851�29�:B , :CB . (6)

14
�@ measures the part of the grade gap � that is caused by matched natives and immigrants.
Adding � � 7 �01�2851�29�:B , :CB � 7 �01�2851�29�:B , :CB results in
�@ � 7 �01�2D801�2 � 851�2E9� �:B , :CB 7 851�2D�01�2 � �51�2E9�:B , :CB � �F � ��. (7)
Substituting (7) into (5) yields
� � �A � �F � ��. (8)
� can be decomposed into 3 components: �A is the part of the grade gap which is caused by
unmatched pupils. Hence, �A disappears if there are no immigrants with characteristics that
remain unmatched by natives. �@ consists of two parts: �F � 7 �01�2D801�2 � 851�2E9�
explains the gap in mean grades due to differences in the distributions of test scores (of
matched individuals). The second part,
�� � 7 851�2D�01�2 � �51�2E9�:B , :CB , (9)
is the "unexplained component" of the grade gap.13 Since �� can be derived for any class �,
��� � 7 8�51�2D��01�2 � ��51�2E9�:GB , :GCB .
(10)
Fair grading practices imply ��01�2 � ��51�2 for any level of �, since migration background
should not be relevant for grading. It is noteworthy that equation (10) has a great flexibility
because different grading practices may be applied in different classes since equation (10)
allows ��$1�2 H ���$ 1�2 if � H ��. Moreover, ��$1�2 does not require any assumptions re-
garding the functional relationship between � and �.14
In this study, the following estimator of ��� is proposed and implemented:
�I�� � "��� J ����� J ��0K���
� �L � ��5K���� �LMNG
�O�PG�O� � "��� J J ����
�������MNG
�O�PG�O� . (11)
13 In the classical Blinder-Oaxaca setup, �01�0 � �52 is the counterpart of �F, while �51�0 � �52 is the equivalent of the unexplained component ��. 14 For instance, the Blinder-Oaxaca approach assumes a linear relationship between � and �.

15
"� is the number of suitable matching variables ��� in class �. Within each class a twin couple
is constituted, if ���� � � ���
� �, where � � � ! ��� is the index of the twin couple which has
been constituted on ���. The first sibling is always the immigrant child which is denoted by
the superscript �. In some classes an immigrant child with test score ��� can be matched on
more than one native sibling. In these cases 1��� � �2 "clones" of the first sibling are created
which are indexed by �. Hence �� is the index of the common matching variable and ��� is the
number of twin couples that are constituted on ���. The inverse of ��� serves as a weight.
��51���� �2 and ��01���
� �2 is the math grade of the first and second sibling, respectively. The dif-
ference
����� � ��5K���
� �L � ��0K���� �L
is the grade gap of the twin couple �, clone � in class �. Positive values of ����� indicate that the
immigrant child has an advantage relatively to its native statistical sibling, while negative
values imply a grade disadvantage.
However, there is still a high probability of observing ��$1��2 � ��$1��2 even if the teacher is
fair and �� � ��. For instance, this problem arises when clones of an immigrant child are
matched on several natives that are identical in terms of test scores but are graded differently.
Apart from measurement errors there are at least two unobserved variables, which are relevant
for grading: former oral participation and former math skills. In PIRLS and PISA students
have been asked to report the math grade in their last school report. That grade cannot depend
on test scores which have been obtained few months later. Although one can assume that for-
mer and present math skills are highly correlated, no information about the frequency and
quality of former oral participation is available. Thus, one must rewrite equation (11):
�I�� � "��� J ������ J Q��5K���
� �L � ��0K���� �L � ����RMNG
�O�PG�O� � "��� J J ����
��������MNG
�O�PG�O� . (12)
with ������ � ����
� � ���� and ���� � ���� � � ���
� �. ����� is the variable of interest, but we can only
obtain ������ from the data. Only if ���
� � � ���� � � � for all �, � and �, then nonzero values of �����
�
are solely caused by different grading practices that are applied to children in with identical
test scores, but different migration backgrounds. Since identical pupils (in terms of test
scores) might differ in other grading-relevant characteristics, like (former) oral participation,
it is more realistic to assume ���� � H ���
� � H �. Therefore ������ consists of two "legitimate" parts

16
���� � and ���
� �, which are caused by grading-relevant but unobserved characteristics of matched
pupils, and the "causeless" part ����� , which measures discrimination. The smoothed regres-
sions in Figure 3a to Figure 6b are unbiased if 3K����L � � and non-autocorrelation of resi-
duals is assumed.
������ is calculated as follows: Since the matching variable math test scores is continuous, one
must allow for matching on "similar" test scores. For the purpose of this study an immigrant
child with test score � becomes the first sibling of a twin couple if:
�I S T���� � � ���
� �T U �V�W,
where �� is the value of the matching variable �� of the immigrant child, clone � in class � and
�� the related value of the potential native sibling. �I is the estimate of a class fixed effects
regression of test scores on math grades.15 Therefore �I4�� � ��4 is the absolute predicted
grade deviation of the second sibling from the first. Since math grades range from 0 to 5, the
relative magnitude of a grade deviation of 0.05 is 1%. Note that 1% is the maximum possible
value of the relative magnitude, since the difference in test scores must imply a predicted
grade deviation smaller or equal 0.05. Using the absolute value of the predicted grade
deviation allows for matching immigrant children on natives, which perform slightly better or
worse in the math test of PISA and PIRLS respectively.
15 �I is calculated separately for every schooling level and track. In addition, each subsample has been restricted to natives in order to obtain estimates for (relatively) homogenous groups.

17
References
Angrist, J. D. & Lavy, V. (1999). Using Maimonides’ Rule to Estimate the Effect of Class Size on Scholastic Achievement. Quarterly Journal of Economics 114(2), pp. 533-575.
Barsky, R. ; Bound, J. ; Charles, K. ; Lupton, J. (2002). Accounting for the Black-White Wealth Gap: A Nonparametric Approach. Journal of the American Statistical Association 97, pp. 663–673.
Baumert, J. et al. (Eds.) (2004): "PISA 2003. Der Bildungsstand der Jugendlichen in Deutschland. Ergebnisse des zweiten internationalen Vergleichs, Opladen.
Blinder, A. S. (1973). Wage Discrimination. Reduced Form and Structural Estimates, Journal of Human Resources 8(4), pp. 436-455.
Bos, W. er al. (Eds.) (2003). Erste Ergebnisse aus IGLU. Schülerleistungen am Ende der vierten Jahrgangsstufe im internationalen Vergleich. Münster.
Census Bureau. (2009). Bevölkerung mit Migrationshintergrund. Ergebnisse des Mikrozensus 2007. Wiesbaden: korrigiert am 26. März 2009.
Dardanoni, V., Modica, S., & Pennsi, A. (2009). Grading Across Schools. The B.E. Journal of Economic Analysis & Policy 9(1) . Article 16.
Ditton, H. e. (2005). Bildungsungleichheit. Der Beitrag von Familie und Schule. Zeitschrift für Erziehungswissenschaft 8(2) , pp. 285-304.
Dustmann, C. (2004). Parental Background, Secondary School Track Choice, and Wages. Oxford Economic Papers 56 , pp. 209–230.
Himmler, O., & Schwager, R. (2007). Double Standards in Educational Standards ? Are Disadvantaged Students Being Graded More Leniently? ZEW Discussion Papers 7(16).
Iacus, S., & Porro, G. (2008). School Grades and Students' Achievement: How to Identify Grading Standards and Measure their Effects. UNIMI - Research Papers in Economics, Business, and Statistics no. 1061 .
KMK (Kultusministerkonferenz) (2009). Das Bildungswesen in der Bundesrepublik Deutschland 2008. Darstellung der Kompetenzen, Strukturen und bildungspolitischen Entwicklungen für den Informationsaustausch in Europa. Bonn.
Kristen, C. (2006). Ethnische Diskriminierung in der Grundschule? Die Vergabe von Noten und Bildungsempfehlungen. Kölner Zeitschrift für Soziologie und Sozialpsychologie 58(1) , pp. 79–97.
Lüdemann, E. & Schwerdt, G. (2010). Migration Background and School Tracking: Is there a Double Disadvantage for Second-Generation Immigrants? CESifo Working Paper.
Ñopo, H. (2008). Matching as a Tool to Decompose Wage Gaps. Review of Economics and Statistics 90(2) , pp. 290-299.
Riphahn, R. (2001). Dissimilation? The Educational Attainment of Second Generation Immigrants. CEPR Discussion Paper 2903.
Schnepf, S. (2002). A Sorting that never fails? The Transition from Primary to Secondary School in Germany. Innocenti Working Papers 92.
Schnepf, S. (2007). Immigrants' Educational Disadvantage: An Examination across Ten Countries and Three Surveys. Journal of Population Economics 20(3), pp. 527-545.
Sprietsma, Maresa (2009). Discrimination in Grading? Experimental Evidence from Primary School, ZEW Discussion Papers 9(74).
Wößmann, L., & West, M. R. (2006). Class-Size Effects in School Systems Around the World: Evidence from between-Grade Variation in TIMSS. European Economic Review 50(3), pp. 695-736.

18
Figure 1a: Exam
ple excercises from PIR
LS 2001
Tables and figures
Source: Bos et al. (2003: 200f.). T
he more difficult the exercise, the higher test
score which is m
easured by the scale on the left side

19
Figure 1b: Exam
ple exercise from PISA
2003
Source: http://pisa.ipn.uni-kiel.de/Aufgaben_M
athe_neu3.pdf.

20
0 .1 .2 .3 .4
Density
-4-2
02
4test score in
math (sta
ndardized)
natives1st g
en. imm
igra
nts2
nd gen. imm
igrants
Realschule
Primary E
ducation
Figure 2: Distribution and com
mon support in m
ath test scores of natives and imm
igrants (different schooling levels and tracks)
Hauptschule
Gym
nasium
0 .1 .2 .3 .4
Density
-6-4
-20
24
test score in m
ath (standardized)
native
s1st g
en. imm
igrants2nd gen
. imm
igra
nts
0 .1 .2 .3 .4
Density
-4-2
02
4test score in
math (sta
ndardized)
natives
1st g
en. im
mig
rants
2nd gen. im
migra
nts
0 .1 .2 .3 .4Density
-4-2
02
4test score in
math (sta
ndardized)
native
s1
st gen. imm
igrants2nd g
en. imm
igra
nts

21
N(grade gaps): 540, N
(1st gen. im
migrants): 380, N
(classes): 199. (m
ean, sd, skewness) of grade gaps: (-0.12, 0.92, -0.06).
(5th, 25th, 50th, 75th, 95th) percentile of grade gap: (-2.00, -0.50, 0.00, 0.33, 1.00). U
sed kernel: Epanechnikov, degree: 0, bandw
idth: 0.59, pilot bandwidth: 0.88.
Figure 3a: Distribution of grade gaps of m
atched pupils (schooling level: prim
ary education, group: first generation imm
igrants)
This is an enlarged section of Figure 3a. For reasons of clarity, the scatter plot has
been omitted.
-4 -2 0 2 4grade gap
-4-2
02
4m
ath test score
Grade differential of tw
in couple ij in class c
smoothed regression (K
ernel-weighted local polynom
ial)
90% confidence interval of sm
oothed regression
-.5 0 .5 1 1.5grade gap
-4-2
02
4m
ath test score
smoothed regression (K
ernel-weighted local polynom
ial)
90% confidence interval of sm
oothed regression

22
N(grade gaps): 429, N
(2nd gen. im
migrants): 297, N
(classes): 172. (m
ean, sd, skewness) of grade gaps: (-0.07, 0.88, -0.40).
(5th, 25th, 50th, 75th, 95th) percentile of grade gap: (-1.80, -0.50, 0.00, 0.33, 1.00). U
sed kernel: Epanechnikov, degree: 0, bandw
idth: 0.76, pilot bandwidth: 1.14.
Figure 3b: Distribution of grade gaps of m
atched pupils (schooling level: prim
ary education, group: second generation imm
igrants)
This is an enlarged section of Figure 3b. For reasons of clarity, the scatter plot has
been omitted.
-4 -2 0 2 4grade gap
-4-2
02
4m
ath test score
Grade differential of tw
in couple ij in class c
smoothed regression (K
ernel-weighted local polynom
ial)
90% confidence interval of sm
oothed regression
-.5 0 .5 1grade gap
-4-2
02
4m
ath test score
smoothed regression (K
ernel-weighted local polynom
ial)
90% confidence interval of sm
oothed regression

23
N(grade gaps): 176, N
(1st gen. im
migrants): 104, N
(classes): 67. (m
ean, sd, skewness) of grade gaps: (0.06, 0.87, -0.76).
(5th, 25th, 50th, 75th, 95th) percentile of grade gap: (-1.00, -0.33, 0.00, 0.50, 1.50). U
sed kernel: Epanechnikov, degree: 0, bandw
idth: 0.55, pilot bandwidth: 0.82.
Figure 4a: Distribution of grade gaps of m
atched pupils (track: G
ymnasium
, group: first generation imm
igrants)
N(grade gaps): 257, N
(2nd gen. im
migrants): 141, N
(classes): 71. (m
ean, sd, skewness) of grade gaps: (0.03, 0.75, -0.11).
(5th, 25th, 50th, 75th, 95th) percentile of grade gap: (-1.00, -0.33, 0.00, 0.50, 1.00). U
sed kernel: Epanechnikov, degree: 0, bandw
idth: 0.60, pilot bandwidth: 0.89.
Figure 4b: Distribution of grade gaps of m
atched pupils (track: G
ymnasium
, group: second generation imm
igrants)
-1 -.5 0 .5 1grade gap
-4-2
02
4m
ath test score
smoothed regression (K
ernel-weighted local polynom
ial)
90% confidence interval of sm
oothed regression
-1 0 1 2grade gap
-4-2
02
math test score
smoothed regression (K
ernel-weighted local polynom
ial)
90% confidence interval of sm
oothed regression

24
N(grade gaps): 267, N
(1st gen. im
migrants): 135, N
(classes): 64. (m
ean, sd, skewness) of grade gaps: (0.16, 0.77, 0.97).
(5th, 25th, 50th, 75th, 95th) percentile of grade gap: (-1.00, -0.33, 0.00, 0.50, 1.50). U
sed kernel: Epanechnikov, degree: 0, bandw
idth: 0.68, pilot bandwidth: 1.03.
Figure 5a: Distribution of grade gaps of m
atched pupils (track: R
ealschule, group: first generation imm
igrants)
N(grade gaps): 256, N
(2nd gen. im
migrants): 151, N
(classes): 62. (m
ean, sd, skewness) of grade gaps: (0.00, 0.94, 0.06).
(5th, 25th, 50th, 75th, 95th) percentile of grade gap: (-1.00, -0.50, 0.00, 0.50, 2.00). U
sed kernel: Epanechnikov, degree: 0, bandw
idth: 0.56, pilot bandwidth: 0.84.
Figure 5b: Distribution of grade gaps of m
atched pupils (track: R
ealschule, group: second generation imm
igrants)
-.2 0 .2 .4 .6 .8grade gap
-2-1
01
2m
ath test score
smoothed regression (K
ernel-weighted local polynom
ial)
90% confidence interval of sm
oothed regression
-.6 -.4 -.2 0 .2 .4grade gap
-2-1
01
23
math test score
smoothed regression (K
ernel-weighted local polynom
ial)
90% confidence interval of sm
oothed regression
25
N(grade gaps): 104, N
(1st gen. im
migrants): 72, N
(classes): 41. (m
ean, sd, skewness) of grade gaps: (0.14, 0.90, -0.70).
(5th, 25th, 50th, 75th, 95th) percentile of grade gap: (-2.00, 0.00, 0.00, 0.58, 1.50). U
sed kernel: Epanechnikov, degree: 0, bandw
idth: 0.52, pilot bandwidth: 0.79.
Figure 6a: Distribution of grade gaps of m
atched pupils (track: H
auptschule, group: first generation imm
igrants)
N(grade gaps): 109, N
(2nd gen. im
migrants): 74, N
(classes): 40. (m
ean, sd, skewness) of grade gaps: (-0.08, 0.92, -0.17).
(5th, 25th, 50th, 75th, 95th) percentile of grade gap: (-2.00, -0.50, 0.00, 0.50, 1.50). U
sed kernel: Epanechnikov, degree: 0, bandw
idth: 0.60, pilot bandwidth: 0.90.
Figure 6b: Distribution of grade gaps of m
atched pupils (track: H
auptschule, group: second generation imm
igrants)
-2 -1.5 -1 -.5 0 .5grade gap
-4-2
02
4m
ath test score
smoothed regression (K
ernel-weighted local polynom
ial)
90% confidence interval of sm
oothed regression
-.6 -.4 -.2 0 .2grade gap
-2-1
01
2m
ath test score
smoothed regression (K
ernel-weighted local polynom
ial)
90% confidence interval of sm
oothed regression

26
* indicates whether m
ean grades or test scores of natives significantly (at least 5% confidence level) differ from
mean grades or test scores of first or second generation
imm
igrants attending the same schooling level or track. U
sed data sets: PIRL
S 2001 for primary school, PISA
2003 (subsampled by school track) for the secondary schooling
level. Gym
nasium is the highest secondary school track , H
auptschule the lowest. M
ath grades range from 0 (fail) to 5 (very good). T
he higher a pupil's math test score the
higher its math proficiency. W
ithin a schooling level or track, math test scores have m
ean 0 and standard deviation 1. The variable m
ath test scores (class level) captures the average test score of the class that is attended by a pupil. A
pupil is a first generation imm
igrant if it was born abroad. Second (or higher) generation im
migrants are born in
Germ
any and satisfy at least one of the following conditions: (i) at least one parent w
as born abroad or (ii) languages other than Germ
an are (also) spoken at home. A
child is treated as a native, if it is born in G
ermany, as w
ell as its parents, and Germ
an is the only language spoken at home.
N(schools)
N(classes)
N(pupils)
standard deviation
Mean
Math test scores (classes)
standard deviation
Mean
Math test scores
standard deviation
Mean
Math grades
Migration background
Track
Schooling level
Table 1: M
ath grades and test scores of natives and imm
igrants (descriptive statistics), separated by schooling level and track
259
259
2852
0.43
0.07
0.92
0.25
0.89
3.50
Native
Primary education (PIR
LS
)
253
253
1006
0.54
-0.14*
0.93
-0.55*
0.98
2.90*
1st gen.
imm
igr.
230
230
762
0.52
-0.10*
1.03
-0.21*
0.98
3.06*
2nd gen.
imm
igr.
61
120
2358
0.40
0.01
0.98
0.06
0.98
3.01
Native
Gym
nasium
Secondary education (PISA
)
51
82
175
0.43
-0.07*
1.13
-0.45*
1.00
2.87
1st gen.
imm
igr.
51
88
216
0.40
-0.09*
1.00
-0.24*
1.14
2.95
2nd gen.
imm
igr.
50
99
1774
0.43
0.07
0.96
0.11
1.00
2.91
Native
Realschule 46
74
227
0.69
-0.29*
1.12
-0.44*
1.07
3.10*
1st gen.
imm
igr.
43
73
264
0.49
-0.21*
0.98
-0.38*
1.03
2.81
2nd gen.
imm
igr.
43
80
666
0.60
0.11
0.95
0.23
1.03
2.93
Native
Hau ptschule
41
64
223
0.56
-0.15*
0.98
-0.33*
0.97
2.95
1st gen.
imm
igr.
39
68
244
0.57
-0.17*
0.96
-0.33*
1.00
2.78*
2nd gen.
imm
igr.

27
Table 2: Class fixed effects estimates of migration background on math grades, separated by schooling level and tracks
Schooling level Primary Secondary Track GY RS HS First generation immigrant -0.232*** 0.054 0.214* 0.238** (reference group: natives) (-6.35) (0.62) (2.56) (3.12) Second generation immigrant -0.235*** 0.022 0.006 0.040
(-6.24) (0.30) (0.08) (0.49) Math test scores 0.536*** 0.453*** 0.398*** 0.398***
(36.09) (22.26) (16.12) (8.91) N(pupils) 4613 2749 2265 1133 N(first generation immigrants) 1004 175 227 223 N(second generation immigrants) 761 216 264 244 N(classes) 262 120 101 81 R2 (adjusted) 0.31 0.18 0.13 0.12
Dependent variable: math grades. Significance levels: * 5%, ** 1%, *** 0.1%, depending on clustered (on class level) standard errors. Used data sets: PIRLS 2001 for primary education, PISA 2003 (subsampled by school tracks) for the secondary schooling level. GY means "Gymnasium", RS "Realschule", HS "Hauptschule". Gymnasium is the highest secondary school track, Hauptschule the lowest. Math grades range from 0 (fail) to 5 (very good). The higher a pupil's math test score the higher its math proficiency. Within a schooling level or track, math test scores have mean 0 and standard deviation 1. A pupil is a first generation immigrant if it was born abroad. Second (or higher) generation immigrants are born in Germany and satisfy at least one of the following conditions: (i) at least one parent was born abroad or (ii) languages other than German are (also) spoken at home. A child is treated as a native, if it is born in Germany, as well as its parents, and German is the only language spoken at home. All regressions include a constant (results not reported).

28
(continued)
R2 (adjusted)
N(classes)
N(pupils)
Other pupil characteristics:
High oral participation
Low
oral participation
(reference category: very high oral participation)
Very low
oral participation
Reading test scores
Math test scores
Second generation imm
igrant
(reference group: natives)
First generation imm
igrant
Colum
n
Track
Schooling level
Table 3: C
lass fixed effects estimates of m
igration background on math grades (separated by schooling level, tracks and grading-relevant characteristics)
0.31 262
4613
no
(36.09)
0.536‡
(-6.24)
-0.235‡
(-6.35)
-0.232‡
(1)
Prim
ary education
0.33 262
4613
no
(-5.63)
-0.242‡
(-9.43)
-0.508‡
(-2.18)
-0.271*
(34.14)
0.518‡
(-6.09)
-0.224‡
(-6.55)
-0.237‡
(2)
0.37 262
4613
no
(18.62)
0.309‡
(22.36)
0.384‡
(-3.62)
-0.134‡
(-1.79)
-0.067
(3)
0.39 262
4613
no
(-5.85)
-0.237‡
(-9.22)
-0.487‡
(-2.06)
-0.252*
(18.64)
0.306‡
(21.64)
0.368‡
(-3.46)
-0.125‡
(-1.99)
-0.073*
(4)
0.41 262
4613
yes‡
(-5.61)
-0.224‡
(-9.26)
-0.476‡
(-2.23)
-0.269*
(17.05)
0.279‡
(20.26)
0.353‡
(-3.24)
-0.117†
(-1.33)
-0.048
(5)
0.18 120
2749
no
(22.26)
0.453‡
(0.30)
0.022
(0.62)
0.054
(1)
Gym
nasium
Secondary education
0.28 120
2749
no
(-4.26)
-0.315‡
(-11.07)
-0.728‡
(-14.46)
-1.070‡
(19.94)
0.376‡
(0.82)
0.053
(0.70)
0.058
(2)
0.19 120
2749
no
(2.53)
0.050*
(20.63)
0.429‡
(0.36)
0.026
(0.85)
0.075
(3)
0.28 120
2749
no
(-4.34)
-0.317‡
(-11.28)
-0.734‡
(-14.81)
-1.074‡
(3.19)
0.059†
(18.26)
0.348‡
(0.90)
0.058
(0.97)
0.082
(4)
0.31 120
2749
yes‡
(-4.49)
-0.334‡
(-11.35)
-0.745‡
(-14.92)
-1.082‡
(1.25)
0.024
(17.55)
0.359‡
(0.63)
0.041
(0.99)
0.090
(5)

29
Dependent variable: m
ath grades. Significance levels: * 5%
, † 1%, ‡ 0.1%
, depending on clustered (on class level) standard errors. Used data sets: PIR
LS
2001 for primary education, PIS
A 2003
(subsampled by school tracks) for the secondary schooling level. G
ymnasium
is the highest secondary school track, Hauptschule the low
est. Math grades range from
0 (fail) to 5 (very good). The
higher a pupil's math test score the higher its m
ath proficiency. Within a schooling level or track, m
ath test scores have mean 0 and standard deviation 1. A
pupil is a first generation imm
igrant if it w
as born abroad. Second (or higher) generation im
migrants are born in G
ermany and satisfy at least one of the follow
ing conditions: (i) at least one parent was born abroad or (ii) languages other than
Germ
an are (also) spoken at home. A
child is treated as a native, if it is born in Germ
any, as well as its parents, and G
erman is the only language spoken at hom
e. Regarding their oral participation,
pupils were asked to w
hich extent they agree with the statem
ent "I frequently participate in math". T
his categorical variable has the four outcomes "I com
pletely disagree", "I somew
hat disagree", "I som
ewhat agree" and "I com
pletely agree". It is decomposed into four dum
my variables. In the fifth colum
ns, other pupil characteristics (age, sex, preschool attendance and parental education) are additionally taken into account. A
ll regressions include a constant and control for missing values in reading skills, oral participation and other pupil characteristics (results not reported).
R2 (adjusted)
N(classes)
N(pupils)
Other pupil characteristics:
High oral participation
Low
oral participation
(reference category: very high oral participation)
Very low
oral participation
Reading test scores
Math test scores
Second generation imm
igrant
(reference group: natives)
First generation imm
igrant
Colum
n
Track
Schooling level
Table 3 (continued)
0.13 101
2265
no
(16.12)
0.398‡
(0.08)
0.006
(2.56)
0.214*
(1)
Realschule
Secondary education
0.25 101
2265
no
(-4.56)
-0.286‡
(-10.94)
-0.713‡
(-13.99)
-1.103‡
(13.02)
0.319‡
(-0.32)
-0.023
(1.59)
0.125
(2)
0.13 101
2265
no
(0.12)
0.003
(15.01)
0.396‡
(0.09)
0.007
(2.57)
0.215*
(3)
0.25 101
2265
no
(-4.65)
-0.291‡
(-10.95)
-0.721‡
(-14.08)
-1.110‡
(1.51)
0.035
(11.71)
0.304‡
(-0.17)
-0.012
(1.67)
0.132
(4)
0.26 101
2265
yes*
(-4.59)
-0.287‡
(-10.98)
-0.717‡
(-14.02)
-1.098‡
(1.24)
0.031
(11.64)
0.312‡
(-0.79)
-0.063
(0.83)
0.072
(5)
0.12 81
1133
no
(8.91)
0.398‡
(0.49)
0.040
(3.12)
0.238†
(1)
Hauptschule
0.20 81
1133
no
(-2.06)
-0.174*
(-7.34)
-0.608‡
(-7.78)
-0.772‡
(8.24)
0.332‡
(0.40)
0.031
(2.10)
0.163*
(2)
0.12 81
1133
no
(-0.52)
-0.022
(7.98)
0.408‡
(0.46)
0.038
(2.91)
0.229†
(3)
0.20 81
1133
no
(-2.07)
-0.175*
(-7.25)
-0.612‡
(-7.55)
-0.779‡
(0.66)
0.026
(6.70)
0.321‡
(0.44)
0.034
(2.20)
0.173*
(4)
0.21 81
1133
yes*
(-1.96)
-0.165
(-6.88)
-0.579‡
(-7.40)
-0.752‡
(1.00)
0.039
(5.72)
0.283‡
(-0.42)
-0.032
(1.48)
0.133
(5)