Are Emily and Greg More Employable Than Lakisha and Jamal? A Field
30
Are Emily and Greg More Employable Than Lakisha and Jamal? A Field Experiment on Labor Market Discrimination By MARIANNE BERTRAND AND SENDHIL MULLAINATHAN* We study race in the labor market by sending fictitious resumes to help-wanted ads in Boston and Chicago newspapers. To manipulate perceived race, resumes are randomly assigned African-American- or White-sounding names. White names receive 50 percent more callbacks for interviews. Callbacks are also more respon- sive to resume quality for White names than for African-American ones. The racial gap is uniform across occupation, industry, and employer size. We also find little evidence that employers are inferring social class from the names. Differential treatment by race still appears to still be prominent in the U.S. labor market. (JEL J71, J64). Every measure of economic success reveals significant racial inequality in the U.S. labor market. Compared to Whites, African-Ameri- cans are twice as likely to be unemployed and earn nearly 25 percent less when they are em- ployed (Council of Economic Advisers, 1998). This inequality has sparked a debate as to whether employers treat members of different races differentially. When faced with observ- ably similar African-American and White ap- plicants, do they favor the White one? Some argue yes, citing either employer prejudice or employer perception that race signals lower pro- ductivity. Others argue that differential treat- ment by race is a relic of the past, eliminated by some combination of employer enlightenment, affirmative action programs and the profit- maximization motive. In fact, many in this latter camp even feel that stringent enforcement of affirmative action programs has produced an environment of reverse discrimination. They would argue that faced with identical candi- dates, employers might favor the African- American one. 1 Data limitations make it difficult to empirically test these views. Since researchers possess far less data than employers do, White and African-American workers that appear similar to researchers may look very different to employers. So any racial difference in labor market outcomes could just as easily be attributed to differences that are observable to employers but unobservable to researchers. To circumvent this difficulty, we conduct a field experiment that builds on the correspon- dence testing methodology that has been pri- marily used in the past to study minority outcomes in the United Kingdom. 2 We send resumes in response to help-wanted ads in Chi- cago and Boston newspapers and measure call- back for interview for each sent resume. We * Bertrand: Graduate School of Business, University of Chicago, 1101 E. 58th Street, R0 229D, Chicago, IL 60637, NBER, and CEPR (e-mail: marianne.bertrand@gsb. uchicago.edu); Mullainathan: Department of Economics, Massachusetts Institute of Technology, 50 Memorial Drive, E52-380a, Cambridge, MA 02142, and NBER (e-mail: [email protected]). David Abrams, Victoria Bede, Simone Berkowitz, Hong Chung, Almudena Fernandez, Mary Anne Guediguian, Christine Jaw, Richa Maheswari, Beverley Martis, Alison Tisza, Grant Whitehorn, and Christine Yee provided excellent research assistance. We are also grateful to numerous colleagues and seminar participants for very helpful comments. 1 This camp often explains the poor performance of African-Americans in terms of supply factors. If African- Americans lack many basic skills entering the labor market, then they will perform worse, even with parity or favoritism in hiring. 2 See Roger Jowell and Patricia Prescott-Clarke (1970), Jim Hubbuck and Simon Carter (1980), Colin Brown and Pat Gay (1985), and Peter A. Riach and Judith Rich (1991). One caveat is that some of these studies fail to fully match skills between minority and nonminority resumes. For ex- ample some impose differential education background by racial origin. Doris Weichselbaumer (2003, 2004) studies the impact of sex-stereotypes and sexual orientation. Rich- ard E. Nisbett and Dov Cohen (1996) perform a related field experiment to study how employers’ response to a criminal past varies between the North and the South in the United States. 991
Transcript of Are Emily and Greg More Employable Than Lakisha and Jamal? A Field

Are Emily and Greg More Employable Than Lakisha andJamal? A Field Experiment on Labor Market Discrimination
By MARIANNE BERTRAND AND SENDHIL MULLAINATHAN*
We study race in the labor market by sending fictitious resumes to help-wanted adsin Boston and Chicago newspapers. To manipulate perceived race, resumes arerandomly assigned African-American- or White-sounding names. White namesreceive 50 percent more callbacks for interviews. Callbacks are also more respon-sive to resume quality for White names than for African-American ones. The racialgap is uniform across occupation, industry, and employer size. We also find littleevidence that employers are inferring social class from the names. Differentialtreatment by race still appears to still be prominent in the U.S. labor market. (JELJ71, J64).
Every measure of economic success revealssignificant racial inequality in the U.S. labormarket. Compared to Whites, African-Ameri-cans are twice as likely to be unemployed andearn nearly 25 percent less when they are em-ployed (Council of Economic Advisers, 1998).This inequality has sparked a debate as towhether employers treat members of differentraces differentially. When faced with observ-ably similar African-American and White ap-plicants, do they favor the White one? Someargue yes, citing either employer prejudice oremployer perception that race signals lower pro-ductivity. Others argue that differential treat-ment by race is a relic of the past, eliminated bysome combination of employer enlightenment,affirmative action programs and the profit-maximization motive. In fact, many in this lattercamp even feel that stringent enforcement ofaffirmative action programs has produced anenvironment of reverse discrimination. Theywould argue that faced with identical candi-
dates, employers might favor the African-American one.1 Data limitations make itdifficult to empirically test these views. Sinceresearchers possess far less data than employersdo, White and African-American workers thatappear similar to researchers may look verydifferent to employers. So any racial differencein labor market outcomes could just as easily beattributed to differences that are observable toemployers but unobservable to researchers.
To circumvent this difficulty, we conduct afield experiment that builds on the correspon-dence testing methodology that has been pri-marily used in the past to study minorityoutcomes in the United Kingdom.2 We sendresumes in response to help-wanted ads in Chi-cago and Boston newspapers and measure call-back for interview for each sent resume. We
* Bertrand: Graduate School of Business, University ofChicago, 1101 E. 58th Street, R0 229D, Chicago, IL 60637,NBER, and CEPR (e-mail: [email protected]); Mullainathan: Department of Economics,Massachusetts Institute of Technology, 50 Memorial Drive,E52-380a, Cambridge, MA 02142, and NBER (e-mail:[email protected]). David Abrams, Victoria Bede, SimoneBerkowitz, Hong Chung, Almudena Fernandez, Mary AnneGuediguian, Christine Jaw, Richa Maheswari, BeverleyMartis, Alison Tisza, Grant Whitehorn, and Christine Yeeprovided excellent research assistance. We are also gratefulto numerous colleagues and seminar participants for veryhelpful comments.
1 This camp often explains the poor performance ofAfrican-Americans in terms of supply factors. If African-Americans lack many basic skills entering the labor market,then they will perform worse, even with parity or favoritismin hiring.
2 See Roger Jowell and Patricia Prescott-Clarke (1970),Jim Hubbuck and Simon Carter (1980), Colin Brown andPat Gay (1985), and Peter A. Riach and Judith Rich (1991).One caveat is that some of these studies fail to fully matchskills between minority and nonminority resumes. For ex-ample some impose differential education background byracial origin. Doris Weichselbaumer (2003, 2004) studiesthe impact of sex-stereotypes and sexual orientation. Rich-ard E. Nisbett and Dov Cohen (1996) perform a related fieldexperiment to study how employers’ response to a criminalpast varies between the North and the South in the UnitedStates.
991

experimentally manipulate perception of racevia the name of the fictitious job applicant. Werandomly assign very White-sounding names(such as Emily Walsh or Greg Baker) to half theresumes and very African-American-soundingnames (such as Lakisha Washington or JamalJones) to the other half. Because we are alsointerested in how credentials affect the racialgap in callback, we experimentally vary thequality of the resumes used in response to agiven ad. Higher-quality applicants have on av-erage a little more labor market experience andfewer holes in their employment history; theyare also more likely to have an e-mail address,have completed some certification degree, pos-sess foreign language skills, or have beenawarded some honors.3 In practice, we typicallysend four resumes in response to each ad: twohigher-quality and two lower-quality ones.We randomly assign to one of the higher- andone of the lower-quality resumes an African-American-sounding name. In total, we respondto over 1,300 employment ads in the sales,administrative support, clerical, and customerservices job categories and send nearly 5,000resumes. The ads we respond to cover a largespectrum of job quality, from cashier work atretail establishments and clerical work in a mailroom, to office and sales management positions.
We find large racial differences in callbackrates.4 Applicants with White names need tosend about 10 resumes to get one callbackwhereas applicants with African-Americannames need to send about 15 resumes. This50-percent gap in callback is statistically signif-icant. A White name yields as many more call-backs as an additional eight years of experienceon a resume. Since applicants’ names are ran-domly assigned, this gap can only be attributedto the name manipulation.
Race also affects the reward to having a bet-ter resume. Whites with higher-quality resumesreceive nearly 30-percent more callbacks than
Whites with lower-quality resumes. On theother hand, having a higher-quality resume hasa smaller effect for African-Americans. In otherwords, the gap between Whites and African-Americans widens with resume quality. Whileone may have expected improved credentials toalleviate employers’ fear that African-Americanapplicants are deficient in some unobservableskills, this is not the case in our data.5
The experiment also reveals several otheraspects of the differential treatment by race.First, since we randomly assign applicants’postal addresses to the resumes, we can studythe effect of neighborhood of residence on thelikelihood of callback. We find that living in awealthier (or more educated or Whiter) neigh-borhood increases callback rates. But, interest-ingly, African-Americans are not helped morethan Whites by living in a “better” neighbor-hood. Second, the racial gap we measure indifferent industries does not appear correlated toCensus-based measures of the racial gap inwages. The same is true for the racial gap wemeasure in different occupations. In fact, wefind that the racial gaps in callback are statisti-cally indistinguishable across all the occupationand industry categories covered in the experi-ment. Federal contractors, who are thought to bemore severely constrained by affirmative actionlaws, do not treat the African-American re-sumes more preferentially; neither do larger em-ployers or employers who explicitly state thatthey are “Equal Opportunity Employers.” InChicago, we find a slightly smaller racial gapwhen employers are located in more African-American neighborhoods.
The rest of the paper is organized as follows.Section I compares this experiment to earlierwork on racial discrimination, and most nota-bly to the labor market audit studies. Wedescribe the experimental design in SectionII and present the results in Section III, subsec-tion A. In Section IV, we discuss possible in-terpretations of our results, focusing especiallyon two issues. First, we examine whether the
3 In creating the higher-quality resumes, we deliberatelymake small changes in credentials so as to minimize the riskof overqualification.
4 For ease of exposition, we refer to the effects uncov-ered in this experiment as racial differences. Technically,however, these effects are about the racial soundingness ofnames. We briefly discuss below the potential confoundsbetween name and race. A more extensive discussion isoffered in Section IV, subsection B.
5 These results contrast with the view, mostly based onnonexperimental evidence, that African-Americans receivehigher returns to skills. For example, estimating earningsregressions on several decades of Census data, JamesJ. Heckman et al. (2001) show that African-Americansexperience higher returns to a high school degree thanWhites do.
992 THE AMERICAN ECONOMIC REVIEW SEPTEMBER 2004
race-specific names we have chosen might alsoproxy for social class above and beyond the raceof the applicant. Using birth certificate data onmother’s education for the different first namesused in our sample, we find little relationshipbetween social background and the name-specific callback rates.6 Second, we discuss howour results map back to the different models ofdiscrimination proposed in the economics liter-ature. In doing so, we focus on two importantresults: the lower returns to credentials forAfrican-Americans and the relative homogene-ity of the racial gap across occupations andindustries. We conclude that existing models doa poor job of explaining the full set of findings.Section V concludes.
I. Previous Research
With conventional labor force and householdsurveys, it is difficult to study whether differ-ential treatment occurs in the labor market.7
Armed only with survey data, researchers usu-ally measure differential treatment by compar-ing the labor market performance of Whites andAfrican-Americans (or men and women) forwhich they observe similar sets of skills. Butsuch comparisons can be quite misleading.Standard labor force surveys do not contain allthe characteristics that employers observe whenhiring, promoting, or setting wages. So one cannever be sure that the minority and nonminorityworkers being compared are truly similar fromthe employers’ perspective. As a consequence,any measured differences in outcomes could beattributed to these unobserved (to the re-searcher) factors.
This difficulty with conventional data hasled some authors to instead rely on pseudo-experiments.8 Claudia Goldin and Cecilia
Rouse (2000), for example, examine the effectof blind auditioning on the hiring process oforchestras. By observing the treatment of fe-male candidates before and after the introduc-tion of blind auditions, they try to measure theamount of sex discrimination. When such pseu-do-experiments can be found, the resultingstudy can be very informative; but finding suchexperiments has proven to be extremelychallenging.
A different set of studies, known as auditstudies, attempts to place comparable minorityand White actors into actual social and eco-nomic settings and measure how each groupfares in these settings.9 Labor market auditstudies send comparable minority (African-American or Hispanic) and White auditors infor interviews and measure whether one is morelikely to get the job than the other.10 While theresults vary somewhat across studies, minorityauditors tend to perform worse on average: theyare less likely to get called back for a secondinterview and, conditional on getting calledback, less likely to get hired.
These audit studies provide some of thecleanest nonlaboratory evidence of differentialtreatment by race. But they also have weak-nesses, most of which have been highlighted inHeckman and Siegelman (1992) and Heckman(1998). First, these studies require that bothmembers of the auditor pair are identical in alldimensions that might affect productivity inemployers’ eyes, except for race. To accomplishthis, researchers typically match auditors onseveral characteristics (height, weight, age, di-alect, dressing style, hairdo) and train them forseveral days to coordinate interviewing styles.Yet, critics note that this is unlikely to erase thenumerous differences that exist between the au-ditors in a pair.
Another weakness of the audit studies is thatthey are not double-blind. Auditors know thepurpose of the study. As Turner et al. (1991)6 We also argue that a social class interpretation would
find it hard to explain some of our findings, such as whyliving in a better neighborhood does not increase callback ratesmore for African-American names than for White names.
7 See Joseph G. Altonji and Rebecca M. Blank (1999)for a detailed review of the existing literature on racialdiscrimination in the labor market.
8 William A. Darity, Jr. and Patrick L. Mason (1998)describe an interesting nonexperimental study. Prior to theCivil Rights Act of 1964, employment ads would explicitlystate racial biases, providing a direct measure of differentialtreatment. Of course, as Arrow (1998) mentions, discrimi-nation was at that time “a fact too evident for detection.”
9 Michael Fix and Marjery A. Turner (1998) provide asurvey of many such audit studies.
10 Earlier hiring audit studies include Jerry M. Newman(1978) and Shelby J. McIntyre et al. (1980). Three morerecent studies are Harry Cross et al. (1990), Franklin Jamesand Steve W. DelCastillo (1991), and Turner et al. (1991).Heckman and Peter Siegelman (1992), Heckman (1998),and Altonji and Blank (1999) summarize these studies. Seealso David Neumark (1996) for a labor market audit studyon gender discrimination.
993VOL. 94 NO. 4 BERTRAND AND MULLAINATHAN: RACE IN THE LABOR MARKET

note: “The first day of training also included anintroduction to employment discrimination,equal employment opportunity, and a review ofproject design and methodology.” This maygenerate conscious or subconscious motivesamong auditors to generate data consistent orinconsistent with their beliefs about race issuesin America. As psychologists know very well,these demand effects can be quite strong. It isvery difficult to insure that auditors will notwant to do “a good job.” Since they know thegoal of the experiment, they can alter theirbehavior in front of employers to express (indi-rectly) their own views. Even a small belief byauditors that employers treat minorities differ-ently can result in measured differences in treat-ment. This effect is further magnified by the factthat auditors are not in fact seeking jobs and aretherefore more free to let their beliefs affect theinterview process.
Finally, audit studies are extremely expen-sive, making it difficult to generate largeenough samples to understand nuances and pos-sible mitigating factors. Also, these budgetaryconstraints worsen the problem of mismatchedauditor pairs. Cost considerations force the useof a limited number of pairs of auditors, mean-ing that any one mismatched pair can easilydrive the results. In fact, these studies generallytend to find significant differences in outcomesacross pairs.
Our study circumvents these problems. First,because we only rely on resumes and not peo-ple, we can be sure to generate comparabilityacross race. In fact, since race is randomly as-signed to each resume, the same resume willsometimes be associated with an African-American name and sometimes with a Whitename. This guarantees that any differences wefind are caused solely by the race manipulation.Second, the use of paper resumes insulates usfrom demand effects. While the research assis-tants know the purpose of the study, our proto-col allows little room for conscious orsubconscious deviations from the set proce-dures. Moreover, we can objectively measurewhether the randomization occurred as ex-pected. This kind of objective measurement isimpossible in the case of the previous auditstudies. Finally, because of relatively low mar-ginal cost, we can send out a large number ofresumes. Besides giving us more precise esti-mates, this larger sample size also allows us to
examine the nature of the differential treatmentfrom many more angles.
II. Experimental Design
A. Creating a Bank of Resumes
The first step of the experimental design is togenerate templates for the resumes to be sent.The challenge is to produce a set of realistic andrepresentative resumes without using resumesthat belong to actual job seekers. To achievethis goal, we start with resumes of actual jobsearchers but alter them sufficiently to createdistinct resumes. The alterations maintain thestructure and realism of the initial resumes with-out compromising their owners.
We begin with resumes posted on two jobsearch Web sites as the basis for our artificialresumes.11 While the resumes posted on theseWeb sites may not be completely representativeof the average job seeker, they provide a prac-tical approximation.12 We restrict ourselves topeople seeking employment in our experimentalcities (Boston and Chicago). We also restrictourselves to four occupational categories: sales,administrative support, clerical services, andcustomer services. Finally, we further restrictourselves to resumes posted more than sixmonths prior to the start of the experiment. Wepurge the selected resumes of the person’s nameand contact information.
During this process, we classify the resumeswithin each detailed occupational category intotwo groups: high and low quality. In judgingresume quality, we use criteria such as labormarket experience, career profile, existence ofgaps in employment, and skills listed. Such aclassification is admittedly subjective but it ismade independently of any race assignment onthe resumes (which occurs later in the experi-mental design). To further reinforce the qualitygap between the two sets of resumes, we add toeach high-quality resume a subset of the follow-ing features: summer or while-at-school em-ployment experience, volunteering experience,extra computer skills, certification degrees, for-eign language skills, honors, or some military
11 The sites are www.careerbuilder.com and www.americasjobbank.com.
12 In practice, we found large variation in skill levelsamong people posting their resumes on these sites.
994 THE AMERICAN ECONOMIC REVIEW SEPTEMBER 2004

experience. This resume quality manipulationneeds to be somewhat subtle to avoid making ahigher-quality job applicant overqualified for agiven job. We try to avoid this problem bymaking sure that the features listed above arenot all added at once to a given resume. Thisleaves us with a high-quality and a low-qualitypool of resumes.13
To minimize similarity to actual job seekers,we use resumes from Boston job seekers toform templates for the resumes to be sent out inChicago and use resumes from Chicago jobseekers to form templates for the resumes to besent out in Boston. To implement this migra-tion, we alter the names of the schools andprevious employers on the resumes. More spe-cifically, for each Boston resume, we use theChicago resumes to replace a Boston schoolwith a Chicago school.14 We also use the Chi-cago resumes to replace a Boston employer witha Chicago employer in the same industry. Weuse a similar procedure to migrate Chicago re-sumes to Boston.15 This produces distinct butrealistic looking resumes, similar in their edu-cation and career profiles to this subpopulationof job searchers.16
B. Identities of Fictitious Applicants
The next step is to generate identities for thefictitious job applicants: names, telephone num-bers, postal addresses, and (possibly) e-mailaddresses. The choice of names is crucial to ourexperiment.17 To decide on which names areuniquely African-American and which areuniquely White, we use name frequency datacalculated from birth certificates of all babiesborn in Massachusetts between 1974 and 1979.We tabulate these data by race to determine
which names are distinctively White and whichare distinctively African-American. Distinctivenames are those that have the highest ratio offrequency in one racial group to frequency inthe other racial group.
As a check of distinctiveness, we conducted asurvey in various public areas in Chicago. Eachrespondent was asked to assess features of aperson with a particular name, one of which israce. For each name, 30 respondents were askedto identify the name as either “White,” “African-American,” “Other,” or “Cannot Tell.” In gen-eral, the names led respondents to readilyattribute the expected race for the person butthere were a few exceptions and these nameswere disregarded.18
The final list of first names used for this studyis shown in Appendix Table A1. The tablereports the relative likelihood of the names forthe Whites and African-Americans in the Mas-sachusetts birth certificates data as well asthe recognition rate in the field survey.19 AsAppendix Table A1 indicates, the African-American first names used in the experiment arequite common in the population. This suggeststhat by using these names as an indicator ofrace, we are actually covering a rather largesegment of the African-American population.20
Applicants in each race/sex/city/resume qual-ity cell are allocated the same phone number.This guarantees that we can precisely track em-ployer callbacks in each of these cells. Thephone lines we use are virtual ones with only avoice mailbox attached to them. A similar out-going message is recorded on each of the voicemailboxes but each message is recorded bysomeone of the appropriate race and gender.
13 In Section III, subsection B, and Table 3, we providea detailed summary of resume characteristics by qualitylevel.
14 We try as much as possible to match high schools andcolleges on quality and demographic characteristics.
15 Note that for applicants with schooling or work expe-rience outside of the Boston or Chicago areas, we leave theschool or employer name unchanged.
16 We also generate a set of different fonts, layouts, andcover letters to further differentiate the resumes. These areapplied at the time the resumes are sent out.
17 We chose name over other potential manipulations ofrace, such as affiliation with a minority group, because wefelt such affiliations may especially convey more than race.
18 For example, Maurice and Jerome are distinctivelyAfrican-American names in a frequency sense yet are notperceived as such by many people.
19 So many of names show a likelihood ratio of � be-cause there is censoring of the data at five births. If there arefewer than five babies in any race/name cell, it is censored(and we do not know whether a cell has zero or wascensored). This is primarily a problem for the computationof how many African-American babies have “White”names.
20 We also tried to use more White-sounding last namesfor White applicants and more African-American-soundinglast names for African-American applicants. The last namesused for White applicants are: Baker, Kelly, McCarthy,Murphy, Murray, O’Brien, Ryan, Sullivan, and Walsh. Thelast names used for African-American applicants are: Jack-son, Jones, Robinson, Washington, and Williams.
995VOL. 94 NO. 4 BERTRAND AND MULLAINATHAN: RACE IN THE LABOR MARKET

Since we allocate the same phone number forapplicants with different names, we cannot usea person name in the outgoing message.
While we do not expect positive feedbackfrom an employer to take place via postal mail,resumes still need postal addresses. We there-fore construct fictitious addresses based on realstreets in Boston and Chicago using the WhitePages. We select up to three addresses in each5-digit zip code in Boston and Chicago. Withincities, we randomly assign addresses across allresumes. We also create eight e-mail addresses,four for Chicago and four for Boston.21 Thesee-mail addresses are neutral with respect to bothrace and sex. Not all applicants are given ane-mail address. The e-mail addresses are usedalmost exclusively for the higher-quality re-sumes. This procedure leaves us with a bank ofnames, phone numbers, addresses, and e-mailaddresses that we can assign to the templateresumes when responding to the employmentads.
C. Responding to Ads
The experiment was carried out between July2001 and January 2002 in Boston and betweenJuly 2001 and May 2002 in Chicago.22 Overthat period, we surveyed all employment ads inthe Sunday editions of The Boston Globe andThe Chicago Tribune in the sales, administra-tive support, and clerical and customer servicessections. We eliminate any ad where applicantswere asked to call or appear in person. In fact,most of the ads we surveyed in these job cate-gories ask for applicants to fax in or (morerarely) mail in their resume. We log the name(when available) and contact information foreach employer, along with any information onthe position advertised and specific require-ments (such as education, experience, or com-puter skills). We also record whether or not thead explicitly states that the employer is an equalopportunity employer.
For each ad, we use the bank of resumes to
sample four resumes (two high-quality and twolow-quality) that fit the job description and re-quirements as closely as possible.23 In somecases, we slightly alter the resumes to improvethe quality of the match, such as by adding theknowledge of a specific software program.
One of the high- and one of the low-qualityresumes selected are then drawn at random toreceive African-American names, the otherhigh- and low-quality resumes receive Whitenames.24 We use male and female names forsales jobs, whereas we use nearly exclusivelyfemale names for administrative and clericaljobs to increase callback rates.25 Based on sex,race, city, and resume quality, we assign a re-sume the appropriate phone number. We alsoselect at random a postal address. Finally, e-mail addresses are added to most of the high-quality resumes.26 The final resumes areformatted, with fonts, layout, and cover letterstyle chosen at random. The resumes are thenfaxed (or in a few cases mailed) to the em-ployer. All in all, we respond to more than1,300 employment ads over the entire sampleperiod and send close to 5,000 resumes.
D. Measuring Responses
We measure whether a given resume elicits acallback or e-mail back for an interview. Foreach phone or e-mail response, we use the con-tent of the message left by the employer (nameof the applicant, company name, telephonenumber for contact) to match the response to thecorresponding resume-ad pair.27 Any attemptby employers to contact applicants via postalmail cannot be measured in our experimentsince the addresses are fictitious. Several hu-man resource managers confirmed to us that
21 The e-mail addresses are registered on Yahoo.com,Angelfire.com, or Hotmail.com.
22 This period spans tighter and slacker labor markets. Inour data, this is apparent as callback rates (and number ofnew ads) dropped after September 11, 2001. Interestingly,however, the racial gap we measure is the same across thesetwo periods.
23 In some instances, our resume bank does not have fourresumes that are appropriate matches for a given ad. In suchinstances, we send only two resumes.
24 Though the same names are repeatedly used in ourexperiment, we guarantee that no given ad receives multipleresumes with the same name.
25 Male names were used for a few administrative jobs inthe first month of the experiment.
26 In the first month of the experiment, a few high-quality resumes were sent without e-mail addresses and afew low-quality resumes were given e-mail addresses. SeeTable 3 for details.
27 Very few employers used e-mail to contact an appli-cant back.
996 THE AMERICAN ECONOMIC REVIEW SEPTEMBER 2004

employers rarely, if ever, contact applicants viapostal mail to set up interviews.
E. Weaknesses of the Experiment
We have already highlighted the strengths ofthis experiment relative to previous audit stud-ies. We now discuss its weaknesses. First, ouroutcome measure is crude, even relative to theprevious audit studies. Ultimately, one caresabout whether an applicant gets the job andabout the wage offered conditional on gettingthe job. Our procedure, however, simply mea-sures callbacks for interviews. To the extent thatthe search process has even moderate frictions,one would expect that reduced interview rateswould translate into reduced job offers. How-ever, we are not able to translate our results intogaps in hiring rates or gaps in earnings.
Another weakness is that the resumes do notdirectly report race but instead suggest racethrough personal names. This leads to varioussources of concern. First, while the names arechosen to make race salient, some employersmay simply not notice the names or not recog-nize their racial content. On a related note,because we are not assigning race but onlyrace-specific names, our results are not repre-sentative of the average African-American(who may not have such a racially distinct
name).28 We return to this issue in Section IV,subsection B.
Finally, and this is an issue pervasive in bothour study and the pair-matching audit studies,newspaper ads represent only one channel forjob search. As is well known from previouswork, social networks are another commonmeans through which people find jobs and onethat clearly cannot be studied here. This omis-sion could qualitatively affect our results ifAfrican-Americans use social networks more orif employers who rely more on networks differ-entiate less by race.29
III. Results
A. Is There a Racial Gap in Callback?
Table 1 tabulates average callback rates byracial soundingness of names. Included inbrackets under each rate is the number of re-sumes sent in that cell. Row 1 presents ourresults for the full data set. Resumes with White
28 As Appendix Table A1 indicates, the African-American names we use are, however, quite commonamong African-Americans, making this less of a concern.
29 In fact, there is some evidence that African-Americansmay rely less on social networks for their job search (HarryJ. Holzer, 1987).
TABLE 1—MEAN CALLBACK RATES BY RACIAL SOUNDINGNESS OF NAMES
Percent callbackfor White names
Percent callback forAfrican-American names Ratio
Percent difference(p-value)
Sample:All sent resumes 9.65 6.45 1.50 3.20
[2,435] [2,435] (0.0000)Chicago 8.06 5.40 1.49 2.66
[1,352] [1,352] (0.0057)Boston 11.63 7.76 1.50 4.05
[1,083] [1,083] (0.0023)Females 9.89 6.63 1.49 3.26
[1,860] [1,886] (0.0003)Females in administrative jobs 10.46 6.55 1.60 3.91
[1,358] [1,359] (0.0003)Females in sales jobs 8.37 6.83 1.22 1.54
[502] [527] (0.3523)Males 8.87 5.83 1.52 3.04
[575] [549] (0.0513)
Notes: The table reports, for the entire sample and different subsamples of sent resumes, the callback rates for applicants witha White-sounding name (column 1) an an African-American-sounding name (column 2), as well as the ratio (column 3) anddifference (column 4) of these callback rates. In brackets in each cell is the number of resumes sent in that cell. Column 4also reports the p-value for a test of proportion testing the null hypothesis that the callback rates are equal across racial groups.
997VOL. 94 NO. 4 BERTRAND AND MULLAINATHAN: RACE IN THE LABOR MARKET

names have a 9.65 percent chance of receivinga callback. Equivalent resumes with African-American names have a 6.45 percent chance ofbeing called back. This represents a differencein callback rates of 3.20 percentage points, or 50percent, that can solely be attributed to the namemanipulation. Column 4 shows that this differ-ence is statistically significant.30 Put in otherwords, these results imply that a White appli-cant should expect on average one callback forevery 10 ads she or he applies to; on the otherhand, an African-American applicant wouldneed to apply to about 15 different ads toachieve the same result.31
How large are these effects? While the cost ofsending additional resumes might not be largeper se, this 50-percent gap could be quite sub-stantial when compared to the rate of arrival ofnew job openings. In our own study, the biggestconstraining factor in sending more resumeswas the limited number of new job openingseach week. Another way to benchmark the mea-sured return to a White name is to compare it tothe returns to other resume characteristics. Forexample, in Table 5, we will show that, at theaverage number of years of experience in oursample, an extra year of experience increasesthe likelihood of a callback by a 0.4 percentagepoint. Based on this point estimate, the return toa White name is equivalent to about eight ad-ditional years of experience.
Rows 2 and 3 break down the full sample ofsent resumes into the Boston and Chicago mar-kets. About 20 percent more resumes were sentin Chicago than in Boston. The average call-back rate (across races) is lower in Chicago thanin Boston. This might reflect differences in la-bor market conditions across the two cities overthe experimental period or maybe differences inthe ability of the MIT and Chicago teams ofresearch assistants in selecting resumes thatwere good matches for a given help-wanted ad.The percentage difference in callback rates is,however, strikingly similar across both cities.White applicants are 49 percent more likely
than African-American applicants to receive acallback in Chicago and 50 percent more likelyin Boston. These racial differences are statisti-cally significant in both cities.
Finally, rows 4 to 7 break down the fullsample into female and male applicants. Row 4displays the average results for all female nameswhile rows 5 and 6 break the female sample intoadministrative (row 5) and sales jobs (row 6);row 7 displays the average results for all malenames. As noted earlier, female names wereused in both sales and administrative job open-ings whereas male names were used close toexclusively for sales openings.32 Lookingacross occupations, we find a significant racialgap in callbacks for both males (52 percent) andfemales (49 percent). Comparing males to fe-males in sales occupations, we find a largerracial gap among males (52 percent versus 22percent). Interestingly, females in sales jobs ap-pear to receive more callbacks than males; how-ever, this (reverse) gender gap is statisticallyinsignificant and economically much smallerthan any of the racial gaps discussed above.
Rather than studying the distribution of call-backs at the applicant level, one can also tabu-late the distribution of callbacks at theemployment-ad level. In Table 2, we computethe fraction of employers that treat White andAfrican-American applicants equally, the frac-tion of employers that favor White appli-cants and the fraction of employers that favorAfrican-American applicants. Because we sendup to four resumes in response to each sampledad, the three categories above can each takethree different forms. Equal treatment occurswhen either no applicant gets called back, oneWhite and one African-American get calledback or two Whites and two African-Americansget called back. Whites are favored when eitheronly one White gets called back, two Whitesand no African-American get called back or twoWhites and one African-American get calledback. African-Americans are favored in allother cases.
As Table 2 indicates, equal treatment occursfor about 88 percent of the help-wanted ads. Asexpected, the major source of equal treatmentcomes from the high fraction of ads for which
30 These statistical tests assume independence of call-backs. We have, however, verified that the results staysignificant when we assume that the callbacks are correlatedeither at the employer or first-name level.
31 This obviously assumes that African-American appli-cants cannot assess a priori which firms are more likely totreat them more or less favorably.
32 Only about 6 percent of all male resumes were sent inresponse to an administrative job opening.
998 THE AMERICAN ECONOMIC REVIEW SEPTEMBER 2004

no callbacks are recorded (83 percent of theads). Whites are favored by nearly 8.4 percentof the employers, with a majority of these em-ployers contacting exactly one White applicant.African-Americans, on the other hand, are fa-vored by only about 3.5 percent of employers.We formally test whether there is symmetry inthe favoring of Whites over African-Americansand African-Americans over Whites. We findthat the difference between the fraction of em-ployers favoring Whites and the fraction ofemployers favoring African-Americans is sta-tistically very significant (p � 0.0000).
B. Do African-Americans Receive DifferentReturns to Resume Quality?
Our results so far demonstrate a substantialgap in callback based on applicants’ names.Next, we would like to learn more about thefactors that may influence this gap. More spe-cifically, we ask how employers respond to im-provements in African-American applicants’credentials. To answer this question, we exam-ine how the racial gap in callback varies byresume quality.
As we explained in Section II, for most of the
employment ads we respond to, we send fourdifferent resumes: two higher-quality and twolower-quality ones. Table 3 gives a better senseof which factors enter into this subjective clas-sification. Table 3 displays means and standarddeviations of the most relevant resume charac-teristics for the full sample (column 1), as wellas broken down by race (columns 2 and 3) andresume quality (columns 4 and 5). Since appli-cants’ names are randomized, there is no differ-ence in resume characteristics by race. Columns4 and 5 document the objective differences be-tween resumes subjectively classified as highand low quality. Higher-quality applicants haveon average close to an extra year of labor mar-ket experience, fewer employment holes (wherean employment hole is defined as a period of atleast six months without a reported job), aremore likely to have worked while at school,and to report some military experience. Also,higher-quality applicants are more likely tohave an e-mail address, to have received somehonors, and to list some computer skills andother special skills (such as a certificationdegree or foreign language skills) on their re-sume. Note that the higher- and lower-qualityresumes do not differ on average with regard to
TABLE 2—DISTRIBUTION OF CALLBACKS BY EMPLOYMENT AD
Equal Treatment: No Callback 1W � 1B 2W � 2B88.13 percent 83.37 3.48 1.28[1,166] [1,103] [46] [17]Whites Favored (WF): 1W � 0B 2W � 0B 2W � 1B8.39 percent 5.59 1.44 1.36[111] [74] [19] [18]African-Americans Favored (BF): 1B � 0W 2B � 0W 2B � 1W3.48 percent 2.49 0.45 0.53[46] [33] [6] [7]Ho: WF � BFp � 0.0000
Notes: This table documents the distribution of callbacks at the employment-ad level. “No Callback” is the percent of ads forwhich none of the fictitious applicants received a callback. “1W � 1B” is the percent of ads for which exactly one White andone African-American applicant received a callback. “2W � 2B” is the percent of ads for which exactly two White applicantsand two African-American applicants received a callback. “Equal Treatment” is defined as the sum of “No Callback,” “1W �1B,” and “2W � 2B.” “1W � 0B” is the percent of ads for which exactly one White applicant and no African-Americanapplicant received a call back. “2W � 0B” is the percent of ads for which excatly two White applicants and noAfrican-American applicant received a callback. “2W � 1B” is the percent of ads for which exactly two White applicants andone African-American applicant received a callback. “Whites Favored” is defined as the sum of “1W � 0B,” “2W � 0B,”and “2W � 1B.” “1B � 0W” is the percent of ads for which exactly one African-American applicant and no White applicantreceived a callback. “2B � 0W” is the percent of ads for which exactly two African-American applicants and no Whiteapplicant received a callback. “2B � 1W” is the percent of ads for which exactly two African-American applicants and oneWhite applicant received a callback. “African-Americans Favored” is defined as the sum of “1B � 0W,” “2B � 0W,” and“2B � 1W.” In brackets in each cell is the number of employment ads in that cell. “Ho: WF � WB” reports the p-value fora test of symmetry between the proportion of employers that favor White names and the proportion of employers that favorAfrican-American names.
999VOL. 94 NO. 4 BERTRAND AND MULLAINATHAN: RACE IN THE LABOR MARKET

applicants’ education level. This reflects the factthat all sent resumes, whether high or low qual-ity, are chosen to be good matches for a givenjob opening. About 70 percent of the sent re-sumes report a college degree.33
The last five rows of Table 3 show summarycharacteristics of the applicants’ zip code ad-dress. Using 1990 Census data, we compute thefraction of high school dropouts, fraction ofcollege educated or more, fraction of Whites,fraction of African-Americans and log(medianper capital income) for each zip code used in the
experiment. Since addresses are randomizedwithin cities, these neighborhood quality mea-sures are uncorrelated with race or resumequality.
The differences in callback rates betweenhigh- and low-quality resumes are presented inPanel A of Table 4. The first thing to note is thatthe resume quality manipulation works: higher-quality resumes receive more callbacks. As row1 indicates, we record a callback rate of close to11 percent for White applicants with a higher-quality resume, compared to 8.5 percent forWhite applicants with lower-quality resumes.This is a statistically significant difference of2.29 percentage points, or 27 percent (p �0.0557). Most strikingly, African-Americansexperience much less of an increase in callback
33 This varies from about 50 percent for the clerical andadministrative support positions to more than 80 percentfor the executive, managerial, and sales representativespositions.
TABLE 3—RESUME CHARACTERISTICS: SUMMARY STATISTICS
Sample: All resumes White namesAfrican-
American Higher quality Lower quality
Characteristic:College degree 0.72 0.72 0.72 0.72 0.71(Y � 1) (0.45) (0.45) (0.45) (0.45) (0.45)Years of experience 7.84 7.86 7.83 8.29 7.39
(5.04) (5.07) (5.01) (5.29) (4.75)Volunteering experience? 0.41 0.41 0.41 0.79 0.03(Y � 1) (0.49) (0.49) (0.49) (0.41) (0.16)Military experience? 0.10 0.09 0.10 0.19 0.00(Y � 1) (0.30) (0.29) (0.30) (0.39) (0.06)E-mail address? 0.48 0.48 0.48 0.92 0.03(Y � 1) (0.50) (0.50) (0.50) (0.27) (0.17)Employment holes? 0.45 0.45 0.45 0.34 0.56(Y � 1) (0.50) (0.50) (0.50) (0.47) (0.50)Work in school? 0.56 0.56 0.56 0.72 0.40(Y � 1) (0.50) (0.50) (0.50) (0.45) (0.49)Honors? 0.05 0.05 0.05 0.07 0.03(Y � 1) (0.22) (0.23) (0.22) (0.25) (0.18)Computer skills? 0.82 0.81 0.83 0.91 0.73(Y � 1) (0.38) (0.39) (0.37) (0.29) (0.44)Special skills? 0.33 0.33 0.33 0.36 0.30(Y � 1) (0.47) (0.47) (0.47) (0.48) (0.46)Fraction high school dropouts in
applicant’s zip code0.19 0.19 0.19 0.19 0.18
(0.08) (0.08) (0.08) (0.08) (0.08)Fraction college or more in
applicant’s zip code0.21 0.21 0.21 0.21 0.22
(0.17) (0.17) (0.17) (0.17) (0.17)Fraction Whites in applicant’s zip
code0.54 0.55 0.54 0.53 0.55
(0.33) (0.33) (0.33) (0.33) (0.33)Fraction African-Americans in
applicant’s zip code0.31 0.31 0.31 0.32 0.31
(0.33) (0.33) (0.33) (0.33) (0.33)Log(median per capital income)
in applicant’s zip code9.55 9.55 9.55 9.54 9.56
(0.56) (0.56) (0.55) (0.54) (0.57)
Sample size 4,870 2,435 2,435 2,446 2,424
Notes: The table reports means and standard deviations for the resume characteristics as listed on the left. Column 1 refersto all resumes sent; column 2 refers to resumes with White names; column 3 refers to resumes with African-American names;column 4 refers to higher-quality resumes; column 5 refers to lower-quality resumes. See text for details.
1000 THE AMERICAN ECONOMIC REVIEW SEPTEMBER 2004
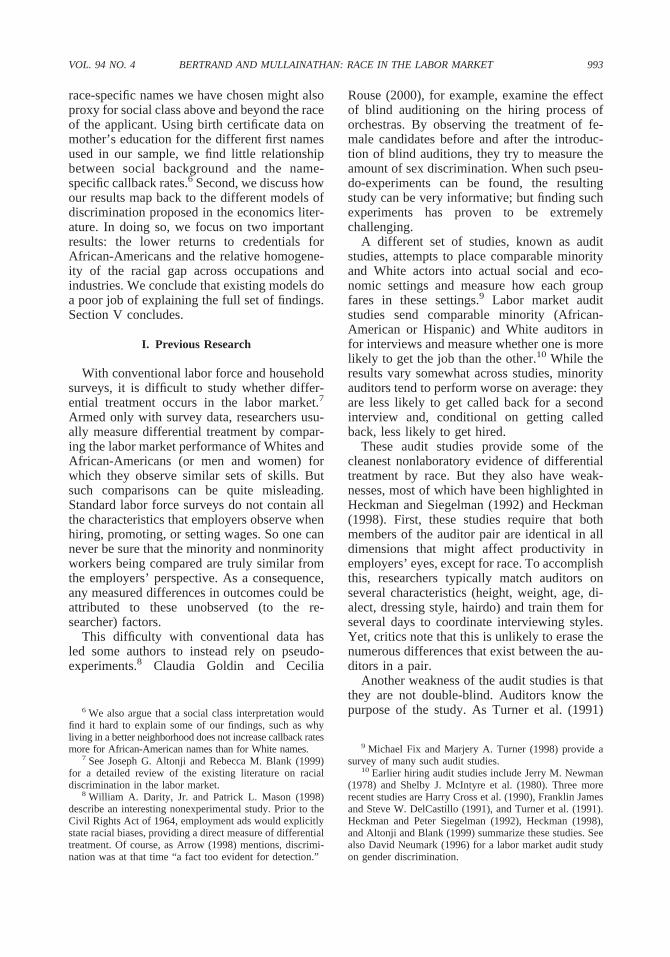
rate for similar improvements in their creden-tials. African-Americans with higher-quality re-sumes receive a callback 6.7 percent of the time,compared to 6.2 percent for African-Americanswith lower quality resumes. This is only a 0.51-percentage-point, or 8-percent, difference andthis difference is not statistically significant(p � 0.6084).
Instead of relying on the subjective qualityclassification, Panel B directly uses resumecharacteristics to classify the resumes. Morespecifically, we use a random subsample ofone-third of the resumes to estimate a probitregression of the callback dummy on the resumecharacteristics listed in Table 3. We further con-trol for a sex dummy, a city dummy, six occu-pation dummies, and a vector of jobrequirements as listed in the employment ads.34
We then use the estimated coefficients on theresume characteristics to rank the remainingtwo-thirds of the resumes by predicted callback.In Panel B, we classify as “high” those resumesthat have above-median-predicted callback;similarly, we classify as “low” those resumes
that have below-median-predicted callback. Asone can see from Panel B, qualitatively similarresults emerge from this analysis. While African-Americans do appear to significantly benefitfrom higher-quality resumes under this alterna-tive classification, they benefit less than Whites.The ratio of callback rates for high- versuslow-quality resumes is 1.60 for African Amer-icans, compared to 1.89 for Whites.
In Table 5, we directly report the results ofrace-specific probit regressions of the callbackdummy on resume characteristics. We, how-ever, start in column 1 with results for the fullsample of sent resumes. As one can see, manyof the resume characteristics have the expectedeffect on the likelihood of a callback. The ad-dition of an e-mail address, honors, and specialskills all have a positive and significant effecton the likelihood of a callback.35 Also, moreexperienced applicants are more likely to getcalled back: at the average number of years ofexperience in our sample (eight years), each
34 See Section III, subsection D, for more details on theseoccupation categories and job requirements.
35 Note that the e-mail address dummy, because it isclose to perfectly correlated with the subjective resume-quality variable, may in part capture some other unmeasuredresume characteristics that may have led us to categorize agiven resume as higher quality.
TABLE 4—AVERAGE CALLBACK RATES BY RACIAL SOUNDINGNESS OF NAMES AND RESUME QUALITY
Panel A: Subjective Measure of Quality(Percent Callback)
Low High Ratio Difference (p-value)White names 8.50 10.79 1.27 2.29
[1,212] [1,223] (0.0557)African-American names 6.19 6.70 1.08 0.51
[1,212] [1,223] (0.6084)
Panel B: Predicted Measure of Quality(Percent Callback)
Low High Ratio Difference (p- value)White names 7.18 13.60 1.89 6.42
[822] [816] (0.0000)African-American names 5.37 8.60 1.60 3.23
[819] [814] (0.0104)
Notes: Panel A reports the mean callback percents for applicant with a White name (row 1) and African-American name (row 2)depending on whether the resume was subjectively qualified as a lower quality or higher quality. In brackets is the number ofresumes sent for each race/quality group. The last column reports the p-value of a test of proportion testing the null hypothesis thatthe callback rates are equal across quality groups within each racial group. For Panel B, we use a third of the sample to estimatea probit regression of the callback dummy on the set of resume characteristics as displayed in Table 3. We further control for a sexdummy, a city dummy, six occupation dummies, and a vector of dummy variables for job requirements as listed in the employmentad (see Section III, subsection D, for details). We then use the estimated coefficients on the set of resume characteristics to estimatea predicted callback for the remaining resumes (two-thirds of the sample). We call “high-quality” resumes the resumes that rankabove the median predicted callback and “low-quality” resumes the resumes that rank below the median predicted callback. Inbrackets is the number of resumes sent for each race/quality group. The last column reports the p-value of a test of proportion testingthe null hypothesis that the callback percents are equal across quality groups within each racial group.
1001VOL. 94 NO. 4 BERTRAND AND MULLAINATHAN: RACE IN THE LABOR MARKET

extra year of experience increases the likelihoodof a callback by about a 0.4 percentage point.The most counterintuitive effects come fromcomputer skills, which appear to negatively pre-dict callback, and employment holes, which ap-pear to positively predict callback.
The same qualitative patterns hold in column2 where we focus on White applicants. Moreimportantly, the estimated returns to an e-mailaddress, additional work experience, honors,and special skills appear economically strongerfor that racial group. For example, at the aver-age number of years of experience in our sam-ple, each extra year of experience increases thelikelihood of a callback by about a 0.7 percent-age point.
As might have been expected from the two
previous columns, we find that the estimatedreturns on these resume characteristics are alleconomically and statistically weaker forAfrican-American applicants (column 3). Infact, all the estimated effects for African-Americans are statistically insignificant, exceptfor the return to special skills. Resume charac-teristics thus appear less predictive of callbackrates for African-Americans than they are forWhites. To illustrate this more saliently, wepredict callback rates using either regressionestimates in column 2 or regression estimates incolumn 3. The standard deviation of the pre-dicted callback from column 2 is 0.062, whereasit is only 0.037 from column 3. In summary,employers simply seem to pay less attention ordiscount more the characteristics listed on the
TABLE 5—EFFECT OF RESUME CHARACTERISTICS ON LIKELIHOOD OF CALLBACK
Dependent Variable: Callback DummySample: All resumes White names African-American names
Years of experience (*10) 0.07 0.13 0.02(0.03) (0.04) (0.03)
Years of experience2 (*100) �0.02 �0.04 �0.00(0.01) (0.01) (0.01)
Volunteering? (Y � 1) �0.01 �0.01 0.01(0.01) (0.01) (0.01)
Military experience? (Y � 1) �0.00 0.02 �0.01(0.01) (0.03) (0.02)
E-mail? (Y � 1) 0.02 0.03 �0.00(0.01) (0.01) (0.01)
Employment holes? (Y � 1) 0.02 0.03 0.01(0.01) (0.02) (0.01)
Work in school? (Y � 1) 0.01 0.02 �0.00(0.01) (0.01) (0.01)
Honors? (Y � 1) 0.05 0.06 0.03(0.02) (0.03) (0.02)
Computer skills? (Y � 1) �0.02 �0.04 �0.00(0.01) (0.02) (0.01)
Special skills? (Y � 1) 0.05 0.06 0.04(0.01) (0.02) (0.01)
Ho: Resume characteristics effects are allzero (p-value)
54.50 57.59 23.85(0.0000) (0.0000) (0.0080)
Standard deviation of predicted callback 0.047 0.062 0.037
Sample size 4,870 2,435 2,435
Notes: Each column gives the results of a probit regression where the dependent variable is the callback dummy. Reportedin the table are estimated marginal changes in probability for the continuous variables and estimated discrete changes for thedummy variables. Also included in each regression are a city dummy, a sex dummy, six occupation dummies, and a vectorof dummy variables for job requirements as listed in the employment ad (see Section III, subsection D, for details). Samplein column 1 is the entire set of sent resumes; sample in column 2 is the set of resumes with White names; sample in column3 is the set of resumes with African-American names. Standard errors are corrected for clustering of the observations at theemployment-ad level. Reported in the second to last row are the p-values for a �2 testing that the effects on the resumecharacteristics are all zero. Reported in the second to last row is the standard deviation of the predicted callback rate.
1002 THE AMERICAN ECONOMIC REVIEW SEPTEMBER 2004

resumes with African-American-sounding names.Taken at face value, these results suggest thatAfrican-Americans may face relatively lowerindividual incentives to invest in higher skills.36
C. Applicants’ Address
An incidental feature of our experimental de-sign is the random assignment of addresses tothe resumes. This allows us to examine whetherand how an applicant’s residential address, allelse equal, affects the likelihood of a callback.In addition, and most importantly for our pur-pose, we can also ask whether African-Ameri-can applicants are helped relatively more byresiding in more affluent neighborhoods.
We perform this analysis in Table 6. We start(columns 1, 3, and 5) by discussing the effect ofneighborhood of residence across all applicants.Each of these columns reports the results of aprobit regression of the callback dummy on aspecific zip code characteristic and a citydummy. Standard errors are corrected for clus-tering of the observations at the employment-adlevel. We find a positive and significant effectof neighborhood quality on the likelihood of acallback. Applicants living in Whiter (column1), more educated (column 3), or higher-income(column 5) neighborhoods have a higher prob-ability of receiving a callback. For example, a10-percentage-point increase in the fraction ofcollege-educated in zip code of residence in-
creases the likelihood of a callback by a 0.54percentage point (column 3).
In columns 2, 4, and 6, we further interact thezip code characteristic with a dummy variablefor whether the applicant is African-Americanor not. Each of the probit regressions in thesecolumns also includes an African-Americandummy, a city dummy, and an interaction of thecity dummy with the African-Americandummy. There is no evidence that African-Americans benefit any more than Whites fromliving in a Whiter, more educated zip code. Theestimated interactions between fraction Whiteand fraction college educated with the African-American dummy are economically very smalland statistically insignificant. We do find aneconomically more meaningful effect of zipcode median income level on the racial gap incallback; this effect, however, is statisticallyinsignificant.
In summary, while neighborhood quality af-fects callbacks, African-Americans do not ben-efit more than Whites from living in betterneighborhoods. If ghettos and bad neighbor-hoods are particularly stigmatizing for African-Americans, one might have expected African-Americans to be helped more by having a“better” address. Our results do not support thishypothesis.
D. Job and Employer Characteristics
Table 7 studies how various job requirements(as listed in the employment ads) and employercharacteristics correlate with the racial gap incallback. Each row of Table 7 focuses on aspecific job or employer characteristic, with
36 This of course assumes that the changes in job andwage offers associated with higher skills are the same acrossraces, or at least not systematically larger for African-Americans.
TABLE 6—EFFECT OF APPLICANT’S ADDRESS ON LIKELIHOOD OF CALLBACK
Dependent Variable: Callback Dummy
Zip code characteristic: Fraction WhitesFraction college or
more Log(per capital income)
Zip code characteristic 0.020 0.020 0.054 0.053 0.018 0.014(0.012) (0.016) (0.022) (0.031) (0.007) (0.010)
Zip code characteristic*African-American name
— �0.000 — �0.002 — 0.008(0.024) (0.048) (0.015)
African-American name — �0.031 — �0.031 — �0.112(0.015) (0.013) (0.152)
Notes: Each column gives the results of a probit regression where the dependent variable is the callback dummy. Reportedin the table is the estimated marginal change in probability. Also included in columns 1, 3, and 5 is a city dummy; alsoincluded in columns 2, 4, and 6 is a city dummy and a city dummy interacted with a race dummy. Standard errors are correctedfor clustering of the observations at the employment-ad level.
1003VOL. 94 NO. 4 BERTRAND AND MULLAINATHAN: RACE IN THE LABOR MARKET

summary statistics in column 2. Column 3shows the results of various probit regressions.Each entry in this column is the marginal effectof the specific characteristic listed in that row onthe racial gap in callback. More specifically,each entry is from a separate probit regressionof a callback dummy on an African-Americandummy, the characteristic listed in that row andthe interaction of that characteristic with the
African-American dummy. The reported coef-ficient is that on the interaction term.
We start with job requirements. About 80percent of the ads state some form of require-ment. About 44 percent of the ads require someminimum experience, of which roughly 50 per-cent simply ask for “some experience,” 24 per-cent less than two years, and 26 percent at leastthree years of experience. About 44 percent of
TABLE 7—EFFECT OF JOB REQUIREMENT AND EMPLOYER CHARACTERISTICS ON RACIAL DIFFERENCES IN CALLBACKS
Job requirement:Sample mean
(standard deviation)Marginal effect on callbacksfor African-American names
Any requirement? (Y � 1) 0.79 0.023(0.41) (0.015)
Experience? (Y � 1) 0.44 0.011(0.49) (0.013)
Computer skills? (Y � 1) 0.44 0.000(0.50) (0.013)
Communication skills? (Y � 1) 0.12 �0.000(0.33) (0.015)
Organization skills? (Y � 1) 0.07 0.028(0.26) (0.029)
Education? (Y � 1) 0.11 �0.031(0.31) (0.017)
Total number of requirements 1.18 0.002(0.93) (0.006)
Employer characteristic:Sample mean
(standard deviation)Marginal effect on callbacksfor African-American names
Equal opportunity employer? (Y � 1) 0.29 �0.013(0.45) (0.012)
Federal contractor? (Y � 1) 0.11 �0.035(N � 3,102) (0.32) (0.016)Log(employment) 5.74 �0.001(N � 1,690) (1.74) (0.005)Ownership status:(N � 2,878)Privately held 0.74 0.011
(0.019)Publicly traded 0.15 �0.025
(0.015)Not-for-profit 0.11 0.025
(0.042)Fraction African-Americans in employer’s zip code
(N � 1,918)0.08 0.117
(0.15) (0.062)
Notes: Sample is all sent resumes (N � 4,870) unless otherwise specified in column 1. Column 2 reports means and standarddeviations (in parentheses) for the job requirement or employer characteristic. For ads listing an experience requirement, 50.1percent listed “some,” 24.0 percent listed “two years or less,” and 25.9 percent listed “three years or more.” For ads listingan education requirement, 8.8 percent listed a high school degree, 48.5 percent listed some college, and 42.7 percent listedat least a four-year college degree. Column 3 reports the marginal effect of the job requirement or employer characteristiclisted in that row on differential treatment. Specifically, each cell in column 3 corresponds to a different probit regression ofthe callback dummy on an African-American name dummy, a dummy for the requirement or characteristic listed in that rowand the interaction of the requirement or characteristic dummy with the African-American name dummy. Reported in eachcell is the estimated change in probability for the interaction term. Standard errors are corrected for clustering of theobservations at the employment-ad level.
1004 THE AMERICAN ECONOMIC REVIEW SEPTEMBER 2004

ads mention some computer knowledge require-ment, which can range from Excel or Word tomore esoteric software programs. Good com-munication skills are explicitly required inabout 12 percent of the ads. Organization skillsare mentioned 7 percent of the time. Finally,only about 11 percent of the ads list an expliciteducation requirement. Of these, 8.8 percentrequire a high school degree, 48.5 percent somecollege (such as an associate degree), and therest at least a four-year college degree.37
Despite this variability, we find little system-atic relationship between any of the require-ments and the racial gap in callback. The pointestimates in column 3 show no consistent eco-nomic pattern and are all statistically weak.Measures of job quality, such as experience orcomputer skills requirements, do not predict theextent of the racial gap. Communication orother interpersonal skill requirements have noeffect on the racial gap either.38
We also study employer characteristics. Col-lecting such information is a more difficult tasksince it is not readily available from the em-ployment ads we respond to. The only piece ofemployer information we can directly collectfrom the employment ad is whether or not theemployer explicitly states being an “Equal Op-portunity Employer.” In several cases, the nameof the employer is not even mentioned in the adand the only piece of information we can rely onis the fax number which applications must besubmitted to. We therefore have to turn to sup-plemental data sources. For employment adsthat do not list a specific employer, we first usethe fax number to try to identify the companyname via Web reverse-lookup services. Basedon company names, we use three different datasources (Onesource Business Browser, ThomasRegister, and Dun and Bradstreet Million Dol-lar Directory, 2001) to track company informa-tion such as total employment, industry, andownership status. Using this same set of data
sources, we also try to identify the specific zipcode of the company (or company branch) thatresumes are to be sent to. Finally, we use theFederal Procurement and Data Center Web siteto find a list of companies that have federalcontracts.39 The racial difference in callbackrates for the subsamples where employer char-acteristics could be determined is very similar inmagnitude to that in the full sample.
Employer characteristics differ significantlyacross ads. Twenty-nine percent of all employ-ers explicitly state that they are “Equal Oppor-tunity Employers.” Eleven percent are federalcontractors and, therefore, might face greaterscrutiny under affirmative action laws. The av-erage company size is around 2,000 employeesbut there is a lot of variation across firms. Fi-nally, 74 percent of the firms are privately held,15 percent are publicly traded, and 11 percentare not-for-profit organizations.
Neither “Equal Opportunity Employers” norfederal contractors appear to treat African-Americans more favorably. In fact, each ofthese employer characteristics is associatedwith a larger racial gap in callback (and thiseffect is marginally significant for federal con-tractors). Differential treatment does not varywith employer size.40 Point estimates indicateless differential treatment in the not-for-profitsector; however, this effect is very noisilyestimated.41
In an unpublished Appendix (available fromthe authors upon request), we also study howthe racial gap in callback varies by occupationand industry. Based on the employment ad list-ings, we classify the job openings into six oc-cupation categories: executives and managers;administrative supervisors; sales representa-tives; sales workers; secretaries and legal assis-tants; clerical workers. We also, when possible,
37 Other requirements sometimes mentioned include typ-ing skills for secretaries (with specific words-per-minuteminimum thresholds), and, more rarely, foreign languageskills.
38 Other ways of estimating these effects produce a sim-ilar nonresult. Among other things, we considered includinga city dummy or estimating the effects separately by city;we also estimated one single probit regression including allrequirements at once.
39 This Web site (www.fpdc.gov) is accurate up to andincluding March 21, 2000.
40 Similar results hold when we measure employer sizeusing a total sales measure rather than an employmentmeasure.
41 Our measurement of the racial gap by firm or em-ployer type may not be a good indicator of the fraction ofAfrican-Americans actually employed in these firms. Forexample, “Equal Opportunity Employers” may receive ahigher fraction of African-American resumes. Their actualhiring may therefore look different from that of non “EqualOpportunity Employers” when one considers the full set ofresumes they receive.
1005VOL. 94 NO. 4 BERTRAND AND MULLAINATHAN: RACE IN THE LABOR MARKET

classify employers into six industry categories:manufacturing; transportation and communica-tion; wholesale and retail trade; finance, insur-ance, and real estate; business and personalservices; health, educational, and social services.We then compute occupation and industry-specific racial gaps in callback and relate thesegaps to 1990 Census-based measures of oc-cupation and industry earnings, as well as Census-based measures of the White/African-Americanwage gap in these occupations and industries.
We find a positive White/African-Americangap in callbacks in all occupation and industrycategories (except for transportation and com-munication). While average earnings vary a lotacross the occupations covered in the experi-ment, we find no systematic relationship be-tween occupation earnings and the racial gap incallback. Similarly, the industry-specific gaps incallback do not relate well to a measure ofinter-industry wage differentials. In fact, whilethe racial gap in callback rates varies somewhatacross occupations and industries, we cannotreject the null hypothesis that the gap is thesame across all these categories.
The last row of Table 7 focuses on the mar-ginal effect of employer location on the racialgap in callback.42 We use as a measure ofemployer location the zip code of the company(or company branch) resumes were to be sentto. More specifically, we ask whether differen-tial treatment by race varies with the fraction ofAfrican-Americans in the employer’s zip code.We find a marginally significant positive effectof employer location on African-American call-backs but this effect is extremely small. In re-gressions not reported here (but available fromthe authors upon request), we reestimate thiseffect separately by city. While the point esti-mates are positive for both cities, the effect isonly statistically significant for Chicago.
IV. Interpretation
Three main sets of questions arise when in-terpreting the results above. First, does a highercallback rate for White applicants imply thatemployers are discriminating against African-
Americans? Second, does our design only iso-late the effect of race or is the namemanipulation conveying some other factors thanrace? Third, how do our results relate to differ-ent models of racial discrimination?
A. Interpreting Callback Rates
Our results indicate that for two identicalindividuals engaging in an identical job search,the one with an African-American name wouldreceive fewer interviews. Does differentialtreatment within our experiment imply that em-ployers are discriminating against African-Americans (whether it is rational, prejudice-based, or other form of discrimination)? In otherwords, could the lower callback rate we recordfor African-American resumes within our ex-periment be consistent with a racially neutralreview of the entire pool of resumes the sur-veyed employers receive?
In a racially neutral review process, employ-ers would rank order resumes based on theirquality and call back all applicants that areabove a certain threshold. Because names arerandomized, the White and African-Americanresumes we send should rank similarly on av-erage. So, irrespective of the skill and racialcomposition of the applicant pool, a race-blindselection rule would generate equal treatment ofWhites and African-Americans. So our resultsmust imply that employers use race as a factorwhen reviewing resumes, which matches thelegal definition of discrimination.
But even rules where employers are not try-ing to interview as few African-American ap-plicants as possible may generate observeddifferential treatment in our experiment. Onesuch hiring rule would be employers trying tointerview a target level of African-Americancandidates. For example, perhaps the averagefirm in our experiment aims to produce an in-terview pool that matches the population baserate. This rule could produce the observed dif-ferential treatment if the average firm receives ahigher proportion of African-American resumesthan the population base rate because African-Americans disproportionately apply to the jobsand industries in our sample.43
42 For previous work on the effect of employer locationon labor market discrimination, see, for example, StevenRaphael et al. (2000).
43 Another variant of this argument is that the (up to) twoAfrican-American resumes we sent are enough to signifi-
1006 THE AMERICAN ECONOMIC REVIEW SEPTEMBER 2004

Some of our other findings may be consistentwith such a rule. For example, the fact that“Equal Opportunity Employers” or federal con-tractors do not appear to discriminate any lessmay reflect the fact that such employers receivemore applications from African-Americans. Onthe other hand, other key findings run counter tothis rule. As we discuss above, we find nosystematic difference in the racial gap in call-back across occupational or industry categories,despite the large variation in the fraction ofAfrican-Americans looking for work in thosecategories. African-Americans are underrepre-sented in managerial occupations, for example.If employers matched base rates in the popula-tion, the few African-Americans who apply tothese jobs should receive a higher callback ratethan Whites. Yet, we find that the racial gap inmanagerial occupations is the same as in all theother job categories. This rule also runs counterto our findings on returns to skill. Suppose firmsare struggling to find White applicants but over-whelmed with African-American ones. Thenthey should be less sensitive to the quality ofWhite applicants (as they are trying to fill intheir hiring quota for Whites) and much moresensitive to the quality of Black applicants(when they have so many to pick from). Thus, it
is unlikely that the differential treatment weobserve is generated by hiring rules such as these.
B. Potential Confounds
While the names we have used in this exper-iment strongly signal racial origin, they mayalso signal some other personal trait. More spe-cifically, one might be concerned that employ-ers are inferring social background from thepersonal name. When employers read a namelike “Tyrone” or “Latoya,” they may assumethat the person comes from a disadvantagedbackground.44 In the extreme form of this socialbackground interpretation, employers do notcare at all about race but are discriminating onlyagainst the social background conveyed by thenames we have chosen.45
While plausible, we feel that some of ourearlier results are hard to reconcile with thisinterpretation. For example, in Table 6, wefound that while employers value “better” ad-dresses, African-Americans are not helped morethan Whites by living in Whiter or more edu-cated neighborhoods. If the African-Americannames we have chosen mainly signal negativesocial background, one might have expected theestimated name gap to be lower for better ad-dresses. Also, if the names mainly signal socialbackground, one might have expected the namegap to be higher for jobs that rely more on softskills or require more interpersonal interactions.We found no such evidence in Table 7.
We, however, directly address this alternativeinterpretation by examining the average socialbackground of babies born with the names usedin the experiment. We were able to obtain birthcertificate data on mother’s education (less thanhigh school, high school or more) for babiesborn in Massachusetts between 1970 and
cantly distort the racial composition of the entire applicantpool. This is unlikely for two reasons. First, anecdotalevidence and the empirically low callback rates we recordsuggest that firms typically receive many hundreds of re-sumes in response to each ad they post. Hence, the (up to)four resumes we send out are unlikely to influence the racialcomposition of the pool. Second, the similar racial gap incallback we observe across the two cities goes counter tothis interpretation since the racial composition base ratesdiffer quite a lot across these two cities. Another variant ofthis argument is that, for some reason, the average firm inour sample receives a lot of high-quality resumes fromAfrican-American applicants and much fewer high-qualityresumes from White applicants. Hypothetically, this mightoccur if high-quality African-Americans are much morelikely to use help-wanted ads rather than other job searchchannels. If employers perform within-race comparisonsand again want to target a certain racial mix in their inter-viewing and hiring, our African-American resumes maynaturally receive lower callbacks as they are competing withmany more high-quality applicants. This specific argumentwould be especially relevant in a case where the averagesampled employer is “known” to be good to African-Americans. But our selection procedure for the employmentads did not allow for such screening: we simply respondedto as many ads as possible in the targeted occupationalcategories.
44 Roland Fryer and Steven Levitt (2003) provide a re-cent analysis of social background and naming conventionsamongst African-Americans.
45 African-Americans as a whole come from more dis-advantaged backgrounds than Whites. For this social classeffect to be something of independent interest, one mustassert that African-Americans with the African-Americannames we have selected are from a lower social backgroundthan the average African-American and/or that Whites withthe White names we have selected are from a higher socialbackground than the average White. We come back to thispoint below.
1007VOL. 94 NO. 4 BERTRAND AND MULLAINATHAN: RACE IN THE LABOR MARKET

1986.46 For each first name in our experiment,we compute the fraction of babies with that
name and, in that gender-race cell, whose moth-ers have at least completed a high schooldegree.
In Table 8, we display the average callbackrate for each first name along with this proxy forsocial background. Within each race-gendergroup, the names are ranked by increasing call-back rate. Interestingly, there is significant
46 This longer time span (compared to that used to assessname frequencies) was imposed on us for confidentialityreasons. When fewer than 10 births with education dataavailable are recorded in a particular education-name cell,the exact number of births in that cell is not reported and weimpute five births. Our results are not sensitive to thisimputation. One African-American female name (Latonya)and two male names (Rasheed and Hakim) were imputed inthis way. One African-American male name (Tremayne)had too few births with available education data and wastherefore dropped from this analysis. Our results are quali-
tatively similar when we use a larger data set of Californiabirths for the years 1989 to 2000 (kindly provided to us bySteven Levitt).
TABLE 8—CALLBACK RATE AND MOTHER’S EDUCATION BY FIRST NAME
White female African-American female
Name Percent callback Mother education Name Percent callback Mother education
Emily 7.9 96.6 Aisha 2.2 77.2Anne 8.3 93.1 Keisha 3.8 68.8Jill 8.4 92.3 Tamika 5.5 61.5Allison 9.5 95.7 Lakisha 5.5 55.6Laurie 9.7 93.4 Tanisha 5.8 64.0Sarah 9.8 97.9 Latoya 8.4 55.5Meredith 10.2 81.8 Kenya 8.7 70.2Carrie 13.1 80.7 Latonya 9.1 31.3Kristen 13.1 93.4 Ebony 9.6 65.6
Average 91.7 Average 61.0Overall 83.9 Overall 70.2
Correlation �0.318 (p � 0.404) Correlation �0.383 (p � 0.309)
White male African-American male
Name Percent callback Mother education Name Percent callback Mother education
Todd 5.9 87.7 Rasheed 3.0 77.3Neil 6.6 85.7 Tremayne 4.3 —Geoffrey 6.8 96.0 Kareem 4.7 67.4Brett 6.8 93.9 Darnell 4.8 66.1Brendan 7.7 96.7 Tyrone 5.3 64.0Greg 7.8 88.3 Hakim 5.5 73.7Matthew 9.0 93.1 Jamal 6.6 73.9Jay 13.4 85.4 Leroy 9.4 53.3Brad 15.9 90.5 Jermaine 9.6 57.5
Average 91.7 Average 66.7Overall 83.5 Overall 68.9
Correlation �0.0251 (p � 0.949) Correlation �0.595 (p � 0.120)
Notes: This table reports, for each first name used in the experiment, callback rate and average mother education. Mothereducation for a given first name is defined as the percent of babies born with that name in Massachusetts between 1970 and1986 whose mother had at least completed a high school degree (see text for details). Within each sex/race group, first namesare ranked by increasing callback rate. “Average” reports, within each race-gender group, the average mother education forall the babies born with one of the names used in the experiment. “Overall” reports, within each race-gender group, averagemother education for all babies born in Massachusetts between 1970 and 1986 in that race-gender group. “Correlation” reportsthe Spearman rank order correlation between callback rate and mother education within each race-gender group as well as thep-value for the test of independence.
1008 THE AMERICAN ECONOMIC REVIEW SEPTEMBER 2004

variation in callback rates by name. Of course,chance alone could produce such variation be-cause of the rather small number of observa-tions in each cell (about 200 for the femalenames and 70 for the male names).47
The row labeled “Average” reports the aver-age fraction of mothers that have at least com-pleted high school for the set of names listed inthat gender-race group. The row labeled “Over-all” reports the average fraction of mothers thathave at least completed high school for the fullsample of births in that gender-race group. Forexample, 83.9 percent of White female babiesborn between 1970 and 1986 have mothers withat least a high school degree; 91.7 percent of theWhite female babies with one of the names usedin the experiment have mothers with at least ahigh school degree.
Consistent with a social background interpre-tation, the African-American names we havechosen fall below the African-American aver-age. For African-American male names, how-ever, the gap between the experimental namesand the population average is negligible. ForWhite names, both the male and female namesare above the population average.
But, more interestingly to us, there is substan-tial between-name heterogeneity in social back-ground. African-American babies named Kenyaor Jamal are affiliated with much higher moth-ers’ education than African-American babiesnamed Latonya or Leroy. Conversely, Whitebabies named Carrie or Neil have lower socialbackground than those named Emily orGeoffrey. This allows for a direct test of thesocial background hypothesis within our sam-ple: are names associated with a worse socialbackground discriminated against more? In thelast row in each gender-race group, we reportthe rank-order correlation between callbackrates and mother’s education. The social back-ground hypothesis predicts a positive correla-tion. Yet, for all four categories, we find the
exact opposite. The p-values indicate that wecannot reject independence at standard signifi-cance levels except in the case of African-American males where we can almost reject it atthe 10-percent level (p � 0.120). In summary,this test suggests little evidence that social back-ground drives the measured race gap.
Names might also influence our resultsthrough familiarity. One could argue that theAfrican-American names used in the experi-ment simply appear odd to human resourcemanagers and that any odd name is discrimi-nated against. But as noted earlier, the nameswe have selected are not particularly uncommonamong African-Americans (see Appendix TableA1). We have also performed a similar exerciseto that of Table 8 and measured the rank-ordercorrelation between name-specific callbackrates and name frequency within each gender-race group. We found no systematic positivecorrelation.
There is one final potential confound to ourresults. Perhaps what appears as a bias againstAfrican-Americans is actually the result of re-verse discrimination. If qualified African-Americans are thought to be in high demand,then employers with average quality jobs mightfeel that an equally talented African-Americanwould never accept an offer from them andthereby never call her or him in for an inter-view. Such an argument might also explain whyAfrican-Americans do not receive as strong areturn as Whites to better resumes, since higherqualification only strengthens this argument.But this interpretation would suggest thatamong the better jobs, we ought to see evidenceof reverse discrimination, or at least a smallerracial gap. However, as we discussed in SectionIII, subsection D, we do not find any suchevidence. The racial gap does not vary acrossjobs with different skill requirements, nor doesit vary across occupation categories. Evenamong the better jobs in our sample, we findthat employers significantly favor applicantswith White names.48
47 We formally tested whether this variation was signif-icant by estimating a probit regression of the callbackdummy on all the personal first names, allowing for clus-tering of the observations at the employment-ad level. Forall but African-American females, we cannot reject the nullhypothesis that all the first name effects in the same race-gender group are the same. Of course, a lack of a rejectiondoes not mean there is no underlying pattern in the between-name variation in callbacks that might have been detectablewith larger sample sizes.
48 One might argue that employers who reverse-discrim-inate hire through less formal channels than help-wantedads. But this would imply that African-Americans are lesslikely to find jobs through formal channels. The evidence onexit out of unemployment does not paint a clear picture inthis direction (Holzer, 1987).
1009VOL. 94 NO. 4 BERTRAND AND MULLAINATHAN: RACE IN THE LABOR MARKET

C. Relation to Existing Theories
What do these results imply for existing mod-els of discrimination? Economic theories of dis-crimination can be classified into two maincategories: taste-based and statistical discrimi-nation models.49 Both sets of models can obvi-ously “explain” our average racial gap incallbacks. But can these models explain ourother findings? More specifically, we discussthe relevance of these models with a focus ontwo of the facts that have been uncovered in thispaper: (i) the lower returns to credentials forAfrican-Americans; (ii) the relative uniformityof the race gap across occupations, job require-ments and, to a lesser extent, employer charac-teristics and industries.
Taste-based models (Gary S. Becker, 1961)differ in whose prejudiced “tastes” they empha-size: customers, coworkers, or employers. Cus-tomer and co-worker discrimination modelsseem at odds with the lack of significant varia-tion of the racial gap by occupation and industrycategories, as the amount of customer contactand the fraction of White employees vary quitea lot across these categories. We do not find alarger racial gap among jobs that explicitly re-quire “communication skills” and jobs forwhich we expect either customer or coworkercontacts to be higher (retail sales for example).
Because we do not know what drives employertastes, employer discrimination models could beconsistent with the lack of occupation and indus-try variation. Employer discrimination alsomatches the finding that employers located inmore African-American neighborhoods appear todiscriminate somewhat less. However, employerdiscrimination models would struggle to explainwhy African-Americans get relatively lower re-turns to their credentials. Indeed, the cost of in-dulging the discrimination taste should increase asthe minority applicants’ credentials increase.50
Statistical discrimination models are theprominent alternative to the taste-based models
in the economics literature. In one class of sta-tistical discrimination models, employers use(observable) race to proxy for unobservableskills (e.g., Edmund S. Phelps, 1972; Kenneth J.Arrow, 1973). This class of models struggle toexplain the credentials effect as well. Indeed,the added credentials should lead to a largerupdate for African-Americans and hence greaterreturns to skills for that group.
A second class of statistical discriminationmodels “emphasize the precision of the infor-mation that employers have about individualproductivity” (Altonji and Blank, 1999). Spe-cifically, in these models, employers believethat the same observable signal is more precisefor Whites than for African-Americans (DennisJ. Aigner and Glenn G. Cain, 1977; Shelly J.Lundberg and Richard Startz, 1983; BradfordCornell and Ivo Welch, 1996). Under such mod-els, African-Americans receive lower returns toobservable skills because employers place lessweight on these skills. However, how reason-able is this interpretation for our experiment?First, it is important to note that we are using thesame set of resume characteristics for both ra-cial groups. So the lower precision of informa-tion for African-Americans cannot be that, forexample, an employer does not know what ahigh school degree from a very African-Americanneighborhood means (as in Aigner and Cain,1977). Second, many of the credentials on theresumes are in fact externally and easily verifiable,such as a certification for a specific software.
An alternative version of these models wouldrely on bias in the observable signal rather thandifferential variance or noise of these signals byrace. Perhaps the skills of African-Americansare discounted because affirmative actionmakes it easier for African-Americans to getthese skills. While this is plausible for creden-tials such as an employee-of-the-month honor,it is unclear why this would apply to moreverifiable and harder skills. It is equally unclearwhy work experience would be less rewardedsince our study suggests that getting a job ismore, not less, difficult for African-Americans.
The uniformity of the racial gap across occu-pations is also troubling for a statistical discrim-ination interpretation. Numerous factors thatshould affect the level of statistical discrimina-tion, such as the importance of unobservableskills, the observability of qualifications, theprecision of observable skills and the ease of
49 Darity and Mason (1998) provide a more thoroughreview of a variety of economic theories of discrimination.
50 One could, however, assume that employer tastes dif-fer not just by race but also by race and skill, so thatemployers have greater prejudice against minority workerswith better credentials. But the opposite preferences, em-ployers having a particular distaste for low-skilled African-Americans, also seem reasonable.
1010 THE AMERICAN ECONOMIC REVIEW SEPTEMBER 2004

performance measurement, may vary quite a lotacross occupations.
This discussion suggests that perhaps othermodels may do a better job at explaining ourfindings. One simple alternative model is lexi-cographic search by employers. Employers re-ceive so many resumes that they may use quickheuristics in reading these resumes. One suchheuristic could be to simply read no furtherwhen they see an African-American name. Thusthey may never see the skills of African-American candidates and this could explainwhy these skills are not rewarded. This mightalso to some extent explain the uniformity of therace gap since the screening process (i.e., look-ing through a large set of resumes) may be quitesimilar across the variety of jobs we study.51
V. Conclusion
This paper suggests that African-Americansface differential treatment when searching forjobs and this may still be a factor in why they dopoorly in the labor market. Job applicants withAfrican-American names get far fewer call-backs for each resume they send out. Equallyimportantly, applicants with African-Americannames find it hard to overcome this hurdle incallbacks by improving their observable skillsor credentials.
Taken at face value, our results on differen-tial returns to skill have possibly important pol-icy implications. They suggest that trainingprograms alone may not be enough to alleviatethe racial gap in labor market outcomes. Fortraining to work, some general-equilibriumforce outside the context of our experimentwould have to be at play. In fact, if African-Americans recognize how employers rewardtheir skills, they may rationally be less willingthan Whites to even participate in theseprograms.
51 Another explanation could be based on employer ste-reotyping or categorizing. If employers have coarser stereo-types for African-Americans, many of our results wouldfollow. See Melinda Jones (2002) for the relevant psychol-ogy and Mullainathan (2003) for a formalization of thecategorization concept.
1011VOL. 94 NO. 4 BERTRAND AND MULLAINATHAN: RACE IN THE LABOR MARKET

REFERENCES
Aigner, Dennis J. and Cain. Glenn G. “StatisticalTheories of Discrimination in Labor Mar-kets.” Industrial and Labor Relations Re-view, January 1977, 30(1), pp. 175–87.
Altonji, Joseph G. and Blank, Rebecca M. “Raceand Gender in the Labor Markey,” in OrleyAshenfelter and David Card, eds., Handbookof labor economics, Vol. 30. Amsterdam:North-Holland, 1999, pp. 3143–259.
Arrow, Kenneth, J. “The Theory of Discrimina-tion,” in Orley Ashenfelter and Albert Rees,eds., Discrimination in labor markets.Princeton, NJ: Princeton University Press,1973, pp. 3–33.
. “What Has Economics to Say aboutRacial Discrimination?” Journal of EconomicPerspectives, Spring 1998, 12(2), pp. 91–100.
Becker, Gary S. The economics of discrimina-tion, 2nd Ed. Chicago: University of ChicagoPress, 1961.
Brown, Colin and Gay, Pat. Racial discrimina-tion 17 years after the act. London: PolicyStudies Institute, 1985.
Cornell, Bradford and Welch, Ivo. “Culture, In-formation, and Screening Discrimination.”Journal of Political Economy, June 1996,104(3), pp. 542–71.
Council of Economic Advisers. Changing America:Indicators of social and economic well-beingby race and Hispanic origin. September 1998,http://w3.access.gpo.gov/eop/ca/pdfs/ca.pdf.
Cross, Harry; Kenney, Genevieve; Mell, Jane andZimmerman, Wendy. Employer hiring prac-tices: Differential treatment of Hispanic andAnglo job applicants. Washington, DC: Ur-ban Institute Press, 1990.
TABLE A1—FIRST NAMES USED IN EXPERIMENT
White femalePerception White
African-American femalePerception BlackName L(W)/L(B) Name L(B)/L(W)
Allison � 0.926 Aisha 209 0.97Anne � 0.962 Ebony � 0.9Carrie � 0.923 Keisha 116 0.93Emily � 0.925 Kenya � 0.967Jill � 0.889 Lakisha � 0.967Laurie � 0.963 Latonya � 1Kristen � 0.963 Latoya � 1Meredith � 0.926 Tamika 284 1Sarah � 0.852 Tanisha � 1
Fraction of all births: Fraction of all births:
3.8 percent 7.1 percent
White malePerception White
African-American malePerception BlackName L(W)/L(B) Name L(B)/L(W)
Brad � 1 Darnell � 0.967Brendan � 0.667 Hakim 0.933Geoffrey � 0.731 Jamal 257 0.967Greg � 1 Jermaine 90.5 1Brett � 0.923 Kareem � 0.967Jay � 0.926 Leroy 44.5 0.933Matthew � 0.888 Rasheed � 0.931Neil � 0.654 Tremayne � 0.897Todd � 0.926 Tyrone 62.5 0.900
Fraction of all births: Fraction of all births:
1.7 percent 3.1 percent
Notes: This table tabulates the different first names used in the experiment and their identifiability. The first column reportsthe likelihood that a baby born with that name (in Massachusetts between 1974 and 1979) is White (or African-American)relative to the likelihood that it is African-American (White). The second column reports the probability that the name waspicked as White (or African-American) in an independent field survey of people. The last row for each group of names showsthe proportion of all births in that race group that these names account for.
1012 THE AMERICAN ECONOMIC REVIEW SEPTEMBER 2004

Darity, William A., Jr. and Mason, Patrick L.“Evidence on Discrimination in Employ-ment: Codes of Color, Codes of Gender.”Journal of Economic Perspectives, Spring1998, 12(2), pp. 63–90.
Fix, Michael and Turner, Margery A., eds. Anational report card on discrimination inAmerica: The role of testing. Washington,DC: Urban Institute Press, 1998.
Fryer, Roland and Levitt, Steven. “The Causesand Consequences of Distinctively BlackNames.” Mimeo, University of Chicago,2003.
Goldin, Claudia and Rouse, Cecilia. “Orchestrat-ing Impartiality: The Impact of Blind Audi-tions on Female Musicians.” AmericanEconomic Review, September 2000, 90(4),pp. 715–41.
Heckman, James J. “Detecting Discrimination.”Journal of Economic Perspectives, Spring1998, 12(2), pp. 101–16.
Heckman, James J.; Lochner, Lance J., and Todd,Petra E. “Fifty Years of Mincer Earnings Re-gressions.” Mimeo, University of Chicago,2001.
Heckman, James J. and Siegelman, Peter. “TheUrban Institute Audit Studies: Their Methodsand Findings,” in Michael Fix and RaymondJ. Struyk, eds., Clear and convincing evi-dence: Measurement of discrimination inAmerica. Lanham, MD: Urban InstitutePress, 1992, pp. 187–258.
Holzer, Harry J. “Informal Job Search and BlackYouth Unemployment.” American EconomicReview, June 1987, 77(3), pp. 446–52.
Hubbuck, Jim and Carter, Simon. Half achance? A report on job discriminationagainst young blacks in Nottingham. London:Commission for Racial Equality, 1980.
James, Franklin and DelCastillo, Steve W. “Mea-suring Job Discrimination by Private Em-ployers Against Young Black and HispanicSeeking Entry Level Work in the DenverMetropolitan Area.” Mimeo, University ofColorado-Denver, 1991.
Jones, Melinda. Social psychology of prejudice.Saddle River, NJ: Pearson Education, 2002.
Jowell, Roger and Prescott-Clark, Patricia. “Ra-cial Discrimination and White-Collar Work-
ers in Britain.” Race, November 1970, 11(4),pp. 397–417.
Lundberg, Shelly J. and Starz, Richard. “PrivateDiscrimination and Social Intervention inCompetitive Labor Market.” American Eco-nomic Review, June 1983, 73(3), pp. 340–47.
McIntyre, Shelby J.; Moberg, Dennis J. and Pos-ner, Barry Z. “Discrimination in Recruitment:An Empirical Analysis: Comment.” Indus-trial and Labor Relations Review, July 1980,33(4), pp. 543–47.
Mullainathan, Sendhil. “Thinking Through Cat-egories.” Mimeo, Massachusetts Institute ofTechnology, 2003.
Neumark, David. “Sex Discrimination in Res-taurant Hiring: An Audit Study.” QuarterlyJournal of Economics, August 1996, 111(3),pp. 915–42.
Newman, Jerry M. “Discrimination in Recruit-ment: An Empirical Analysis.” Industrial andLabor Relations Review, October 1978,32(1), pp. 15–23.
Nisbett, Richard E. and Cohen, Dov. The cultureof honor: The psychology of violence in theSouth. Boulder, CO: Westview Press, 1996.
Phelps, Edmund S. “The Statistical Theory ofRacism and Sexism.” American EconomicReview, September 1972, 62(4), pp. 659–61.
Raphael, Steven; Stoll, Michael A. and Holzer,Harry J. “Are Suburban Firms More Likelyto Discriminate against African Americans?”Journal of Urban Economics, November2000, 48(3), pp. 485–508.
Riach, Peter A. and Rich, Judity. “Testing forRacial Discrimination in the Labour Market.”Cambridge Journal of Economics, September1991, 15(3), pp. 239–56.
Turner, Margery A.; Fix, Michael and Struyk,Raymond J. Opportunities denied, opportuni-ties diminished: Racial discrimination in hir-ing. Washington, DC: Urban Institute Press,1991.
Weichselbaumer, Doris. “Sexual OrientationDiscrimination in Hiring.” Labour Econom-ics, December 2003, 10(6), pp. 629–42.
. “Is it Sex or Personality? The Impactof Sex-Stereotypes on Discrimination in Ap-plicant Selection.” Eastern Economic Jour-nal, Spring 2004, 30(2), pp. 159–86.
1013VOL. 94 NO. 4 BERTRAND AND MULLAINATHAN: RACE IN THE LABOR MARKET

This article has been cited by:
1. ABIGAIL WOZNIAK. 2011. Field Perspectives on the Causes of Low Employment Among LessSkilled Black Men. American Journal of Economics and Sociology 70:3, 811-844. [CrossRef]
2. John M. Nunley, Mark F. Owens, R. Stephen Howard. 2011. The Effects of Information andCompetition on Racial Discrimination: Evidence from A Field Experiment. Journal of EconomicBehavior & Organization . [CrossRef]
3. Thomas G. Blomberg, William D. Bales, Alex R. Piquero. 2011. Is Educational Achievementa Turning Point for Incarcerated Delinquents Across Race and Sex?. Journal of Youth andAdolescence . [CrossRef]
4. Reyn van Ewijk. 2011. Same work, lower grade? Student ethnicity and teachers’ subjectiveassessments. Economics of Education Review . [CrossRef]
5. Kevin Lang, , Michael Manove. 2011. Education and Labor Market DiscriminationEducation andLabor Market Discrimination. American Economic Review 101:4, 1467-1496. [Abstract] [ViewPDF article] [PDF with links]
6. SUBHASISH DUGAR, HAIMANTI BHATTACHARYA, DAVID REILEY. 2011. CAN'T BUYME LOVE? A FIELD EXPERIMENT EXPLORING THE TRADE-OFF BETWEEN INCOMEAND CASTE-STATUS IN AN INDIAN MATRIMONIAL MARKET. Economic Inquiry no-no.[CrossRef]
7. Victoria R. Brown, E. Daly Vaughn. 2011. The Writing on the (Facebook) Wall: The Use of SocialNetworking Sites in Hiring Decisions. Journal of Business and Psychology . [CrossRef]
8. Daniel Ji, Pablo Guillen. 2011. TRUST, DISCRIMINATION AND ACCULTURATIONExperimental Evidence on Asian International and Australian Domestic University Students.Journal of Socio-Economics . [CrossRef]
9. Daniel M. Butler, David E. Broockman. 2011. Do Politicians Racially Discriminate AgainstConstituents? A Field Experiment on State Legislators. American Journal of Political Science no-no. [CrossRef]
10. Daniel H. Krymkowski, Beth Mintz. 2011. College as an Investment: The Role of Graduation Ratesin Changing Occupational Inequality by Race, Ethnicity, and Gender. Race and Social Problems. [CrossRef]
11. Andrew Hanson, Zackary Hawley. 2011. Do Landlords Discriminate in the Rental HousingMarket? Evidence from an Internet Field Experiment in U.S. Cities. Journal of Urban Economics. [CrossRef]
12. Leo Kaas, Christian Manger. 2011. Ethnic Discrimination in Germany's Labour Market: A FieldExperiment. German Economic Review no-no. [CrossRef]
13. CAROLE J. LEE, CHRISTIAN D. SCHUNN. 2011. Social Biases and Solutions for ProceduralObjectivity. Hypatia no-no. [CrossRef]
14. Therese Macan, Stephanie MerrittActions Speak Too: Uncovering Possible Implicit and ExplicitDiscrimination in the Employment Interview Process 293-337. [CrossRef]
15. Björn Tyrefors Hinnerich, Erik Höglin, Magnus Johannesson. 2011. Are boys discriminated inSwedish high schools?. Economics of Education Review . [CrossRef]
16. D. James Greiner, Donald B Rubin. 2011. Causal Effects of Perceived Immutable Characteristics.Review of Economics and Statistics 110223123708091. [CrossRef]
17. Rocio Albert, Lorenzo Escot, Jose Andres Fernandez-Cornejo. 2011. A field experiment to studysex and age discrimination in the Madrid labour market. The International Journal of HumanResource Management 22:2, 351-375. [CrossRef]

18. Nick Drydakis. 2011. Women's Sexual Orientation and Labor Market Outcomes in Greece.Feminist Economics 17:1, 89-117. [CrossRef]
19. Benjamin L. Solow, John L. Solow, Todd B. Walker. 2010. Moving on up: The Rooney rule andminority hiring in the NFL#. Labour Economics . [CrossRef]
20. Pierre-Guillaume Méon, Ariane Szafarz. 2010. The modern corporation as a safe haven for taste-based discrimination: An agency model of hiring decisions. Labour Economics . [CrossRef]
21. Christopher Finn, Jack Glaser. 2010. Voter Affect and the 2008 U.S. Presidential Election: Hopeand Race Mattered. Analyses of Social Issues and Public Policy 10:1, 262-275. [CrossRef]
22. Jerry Kang, Nilanjana Dasgupta, Kumar Yogeeswaran, Gary Blasi. 2010. Are Ideal LitigatorsWhite? Measuring the Myth of Colorblindness. Journal of Empirical Legal Studies 7:4, 886-915.[CrossRef]
23. Dan-Olof Rooth. 2010. Work out or out of work — The labor market return to physical fitness andleisure sports activities. Labour Economics . [CrossRef]
24. Thomas S. Moore. 2010. The Locus of Racial Disadvantage in the Labor Market 1. The AmericanJournal of Sociology 116:3, 909-42. [CrossRef]
25. Robert Slonim, Pablo Guillen. 2010. Gender selection discrimination: Evidence from a Trust game.Journal of Economic Behavior & Organization 76:2, 385-405. [CrossRef]
26. Clayton S. Rose, William T. Bielby. 2010. Race at the top: How companies shape the inclusion ofAfrican Americans on their boards in response to institutional pressures. Social Science Research. [CrossRef]
27. Nick Drydakis. 2010. Religious Affiliation and Employment Bias in the Labor Market. Journalfor the Scientific Study of Religion 49:3, 477-493. [CrossRef]
28. Rodney J. Andrews. 2010. Comments on “Black Americans in the 21st Century: Should We BeOptimistic or Concerned?”. The Review of Black Political Economy 37:3-4, 253-255. [CrossRef]
29. Niki Dickerson VonLockette. 2010. The Impact of Metropolitan Residential Segregation on theEmployment Chances of Blacks and Whites in the United States. City & Community 9:3, 256-273.[CrossRef]
30. Magnus Carlsson. 2010. Experimental Evidence of Discrimination in the Hiring of First- andSecond-generation Immigrants. LABOUR 24:3, 263-278. [CrossRef]
31. Oren Gazal-Ayal, Raanan Sulitzeanu-Kenan. 2010. Let My People Go: Ethnic In-Group Bias inJudicial Decisions-Evidence from a Randomized Natural Experiment. Journal of Empirical LegalStudies 7:3, 403-428. [CrossRef]
32. Christina M. Fong, Erzo F.P. Luttmer. 2010. Do fairness and race matter in generosity? Evidencefrom a nationally representative charity experiment. Journal of Public Economics . [CrossRef]
33. Guy Michaels, , Xiaojia Zhi. 2010. Freedom FriesFreedom Fries. American Economic Journal:Applied Economics 2:3, 256-281. [Abstract] [View PDF article] [PDF with links]
34. Abigail A. Sewell, David R. Heise. 2010. Racial differences in sentiments: Exploring variantcultures. International Journal of Intercultural Relations 34:4, 400-412. [CrossRef]
35. Guido W. Imbens. 2010. Better LATE Than Nothing: Some Comments on Deaton (2009) andHeckman and Urzua (2009)Better LATE Than Nothing: Some Comments on Deaton (2009) andHeckman and Urzua (2009). Journal of Economic Literature 48:2, 399-423. [Abstract] [View PDFarticle] [PDF with links]
36. NICK DRYDAKIS, MINAS VLASSIS. 2010. ETHNIC DISCRIMINATION IN THE GREEKLABOUR MARKET: OCCUPATIONAL ACCESS, INSURANCE COVERAGE AND WAGEOFFERS. The Manchester School 78:3, 201-218. [CrossRef]

37. Elizabeth Hirsh, Christopher J. Lyons. 2010. Perceiving Discrimination on the Job: LegalConsciousness, Workplace Context, and the Construction of Race Discrimination. Law & SocietyReview 44:2, 269-298. [CrossRef]
38. Markus Gangl. 2010. Causal Inference in Sociological Research. Annual Review of Sociology 36:1,21-47. [CrossRef]
39. Ali M. Ahmed. 2010. Muslim Discrimination: Evidence From Two Lost-Letter Experiments.Journal of Applied Social Psychology 40:4, 888-898. [CrossRef]
40. James Kaufman, John Baer, Mark Agars, David Loomis. 2010. Creativity Stereotypes and theConsensual Assessment Technique. Creativity Research Journal 22:2, 200-205. [CrossRef]
41. Marret Noordewier, Femke Horen, Kirsten Ruys, Diederik Stapel. 2010. What's in a Name?361.708 Euros: The Effects of Marital Name Change. Basic and Applied Social Psychology 32:1,17-25. [CrossRef]
42. Myrtle P. Bell, Eileen N. Kwesiga, Daphne P. Berry. 2010. Immigrants: The new “invisible menand women” in diversity research. Journal of Managerial Psychology 25:2, 177-188. [CrossRef]
43. SAKU AURA, GREGORY D. HESS. 2010. WHAT’S IN A NAME?. Economic Inquiry 48:1,214-227. [CrossRef]
44. Daniel Sabbagh. 2010. Les ravages de la pensée moniste : à propos de La Diversité contre l'égalitéde Walter Benn Michaels, Raisons d'agir, 2009. Mouvements 61:1, 172. [CrossRef]
45. Philip Broyles, Weston Fenner. 2010. Race, human capital, and wage discrimination in STEMprofessions in the United States. International Journal of Sociology and Social Policy 30:5/6,251-266. [CrossRef]
46. Michael Stoll. 2010. Labor Market Advancement for Young Men: How It Differs by EducationalAttainment and Race/Ethnicity During the Initial Transition to Work. Journal of Education forStudents Placed at Risk (JESPAR) 15:1, 66-92. [CrossRef]
47. M. Weisbuch, K. Pauker, N. Ambady. 2009. The Subtle Transmission of Race Bias via TelevisedNonverbal Behavior. Science 326:5960, 1711-1714. [CrossRef]
48. Susan F. Cabrera, Stephen J. Sauer, Melissa C. Thomas-Hunt. 2009. THE EVOLVINGMANAGER STEREOTYPE: THE EFFECTS OF INDUSTRY GENDER TYPING ONPERFORMANCE EXPECTATIONS FOR LEADERS AND THEIR TEAMS. Psychology ofWomen Quarterly 33:4, 419-428. [CrossRef]
49. Michelle Jackson. 2009. Disadvantaged through discrimination? The role of employers in socialstratification1. The British Journal of Sociology 60:4, 669-692. [CrossRef]
50. David M. Kaplan, James E. Fisher. 2009. A Rose by Any Other Name: Identity andImpression Management in Résumés. Employee Responsibilities and Rights Journal 21:4,319-332. [CrossRef]
51. Rockoff Jonah. 2009. Field Experiments in Class Size from the Early Twentieth CenturyFieldExperiments in Class Size from the Early Twentieth Century. Journal of Economic Perspectives23:4, 211-230. [Abstract] [View PDF article] [PDF with links]
52. Stephanie Riegg Cellini, Signe-Mary McKernan, Caroline Ratcliffe. 2009. The dynamics ofpoverty in the United States: A review of data, methods, and findings. Journal of Policy Analysisand Management 27:3, 577-605. [CrossRef]
53. Femina P. Varghese, Erin E. Hardin, Rebecca L. Bauer. 2009. Factors Influencing theEmployability of Latinos: The Roles of Ethnicity, Criminal History, and Qualifications. Race andSocial Problems 1:3, 171-181. [CrossRef]
54. Amon Emeka. 2009. Race and Unemployment Amidst the New Diversity: More Evidence of aBlack/Non-Black Divide. Race and Social Problems 1:3, 157-170. [CrossRef]

55. Eva Derous, Hannah-Hanh Nguyen, Ann Marie Ryan. 2009. Hiring Discrimination Against ArabMinorities: Interactions Between Prejudice and Job Characteristics. Human Performance 22:4,297-320. [CrossRef]
56. Geert Demuijnck. 2009. Non-Discrimination in Human Resources Management as a MoralObligation. Journal of Business Ethics 88:1, 83-101. [CrossRef]
57. MARLENE KIM. 2009. Race and Gender Differences in the Earnings of Black Workers. IndustrialRelations: A Journal of Economy and Society 48:3, 466-488. [CrossRef]
58. ALI M. AHMED, MATS HAMMARSTEDT. 2009. Detecting Discrimination againstHomosexuals: Evidence from a Field Experiment on the Internet. Economica 76:303, 588-597.[CrossRef]
59. Lars-Eric Petersen, Franciska Krings. 2009. Are Ethical Codes of Conduct Toothless Tigers forDealing with Employment Discrimination?. Journal of Business Ethics 85:4, 501-514. [CrossRef]
60. Christina M. Fong, , Erzo F. P. Luttmer. 2009. What Determines Giving to Hurricane KatrinaVictims? Experimental Evidence on Racial Group LoyaltyWhat Determines Giving to HurricaneKatrina Victims? Experimental Evidence on Racial Group Loyalty. American Economic Journal:Applied Economics 1:2, 64-87. [Abstract] [View PDF article] [PDF with links]
61. Douglas S. Massey. 2009. Racial Formation in Theory and Practice: The Case of Mexicans in theUnited States. Race and Social Problems 1:1, 12-26. [CrossRef]
62. Benjamin L. Cook, Thomas G. McGuire, Ellen Meara, Alan M. Zaslavsky. 2009. Adjustingfor health status in non-linear models of health care disparities. Health Services and OutcomesResearch Methodology 9:1, 1-21. [CrossRef]
63. B. Coffey, P. A. McLaughlin. 2009. Do Masculine Names Help Female Lawyers Become Judges?Evidence from South Carolina. American Law and Economics Review 11:1, 112-133. [CrossRef]
64. David E. Kalist, Daniel Y. Lee. 2009. First Names and Crime: Does Unpopularity Spell Trouble?.Social Science Quarterly 90:1, 39-49. [CrossRef]
65. James King, Myrtle Bell, Ericka Lawrence. 2009. Religion as an aspect of workplace diversity:an examination of the US context and a call for international research. Journal of Management,Spirituality & Religion 6:1, 43-57. [CrossRef]
66. Guido W. Imbens, , Jeffrey M. Wooldridge. 2009. Recent Developments in the Econometrics ofProgram EvaluationRecent Developments in the Econometrics of Program Evaluation. Journal ofEconomic Literature 47:1, 5-86. [Abstract] [View PDF article] [PDF with links]
67. John Morgan, , Felix Várdy. 2009. Diversity in the WorkplaceDiversity in the Workplace.American Economic Review 99:1, 472-485. [Abstract] [View PDF article] [PDF with links]
68. Nicole M. Lindner, Brian A. Nosek. 2009. Alienable Speech: Ideological Variations in theApplication of Free-Speech Principles. Political Psychology 30:1, 67-92. [CrossRef]
69. Cecily R. Hardaway, Vonnie C. McLoyd. 2009. Escaping Poverty and Securing Middle ClassStatus: How Race and Socioeconomic Status Shape Mobility Prospects for African AmericansDuring the Transition to Adulthood. Journal of Youth and Adolescence 38:2, 242-256. [CrossRef]
70. Eugene M. Caruso, Dobromir A. Rahnev, Mahzarin R. Banaji. 2009. Using Conjoint Analysis toDetect Discrimination: Revealing Covert Preferences From Overt Choices. Social Cognition 27:1,128-137. [CrossRef]
71. Victoria Busch, Svenn-Åge Dahl, Dennis Dittrich. 2009. An empirical study of age discriminationin Norway and Germany. Applied Economics 41:5, 633-651. [CrossRef]
72. V. L. Hutchings. 2009. Change or More of The Same?: Evaluating Racial Attitudes in the ObamaEra. Public Opinion Quarterly 73:5, 917-942. [CrossRef]

73. Jens Agerström, Dan-Olof Rooth. 2009. Implicit prejudice and ethnic minorities: Arab-Muslimsin Sweden. International Journal of Manpower 30:1/2, 43-55. [CrossRef]
74. Gitte Jensen, Magdalena Cismaru, Anne Lavack, Romulus Cismaru. 2009. Examining prejudice-reduction theories in anti-racism initiatives. International Journal of Nonprofit and VoluntarySector Marketing n/a-n/a. [CrossRef]
75. David Branham. 2008. Taking Advantage of an Untapped Pool: Assessing the Success of AfricanAmerican Head Coaches in the National Football League. The Review of Black Political Economy35:4, 129-146. [CrossRef]
76. LISA M. LESLIE, EDEN B. KING, JILL C. BRADLEY, MICHELLE R. HEBL.2008. Triangulation Across Methodologies: All Signs Point to Persistent Stereotyping andDiscrimination in Organizations. Industrial and Organizational Psychology 1:4, 399-404.[CrossRef]
77. Leanna Stiefel, Amy Ellen Schwartz, Ingrid Gould Ellen. 2008. Disentangling the racial testscore gap: Probing the evidence in a large urban school district. Journal of Policy Analysis andManagement 26:1, 7-30. [CrossRef]
78. RAYMOND PATERNOSTER, ROBERT BRAME. 2008. REASSESSING RACEDISPARITIES IN MARYLAND CAPITAL CASES*. Criminology 46:4, 971-1008. [CrossRef]
79. C. MIRJAM VAN PRAAG, BERNARD M.S. VAN PRAAG. 2008. The Benefits of BeingEconomics Professor A (rather than Z). Economica 75:300, 782-796. [CrossRef]
80. C. Elizabeth Hirsh, Youngjoo Cha. 2008. Understanding Employment Discrimination: AMultilevel Approach. Sociology Compass 2:6, 1989-2007. [CrossRef]
81. References 310-338. [CrossRef]
82. Kerwin Kofi Charles, Jonathan Guryan. 2008. Prejudice and Wages: An Empirical Assessmentof Becker’s The Economics of Discrimination. Journal of Political Economy 116:5, 773-809.[CrossRef]
83. M. Maria Glymour, Jennifer J. Manly. 2008. Lifecourse Social Conditions and Racial and EthnicPatterns of Cognitive Aging. Neuropsychology Review 18:3, 223-254. [CrossRef]
84. Judith K. Hellerstein, David Neumark. 2008. Workplace Segregation in the United States: Race,Ethnicity, and Skill. Review of Economics and Statistics 90:3, 459-477. [CrossRef]
85. Devah Pager, Hana Shepherd. 2008. The Sociology of Discrimination: Racial Discrimination inEmployment, Housing, Credit, and Consumer Markets. Annual Review of Sociology 34:1, 181-209.[CrossRef]
86. Joe Magee, Adam Galinsky. 2008. Chapter 8: Social Hierarchy: The Self-Reinforcing Nature ofPower and Status. The Academy of Management Annals 2, 351-398. [CrossRef]
87. David Bjerk. 2008. Glass Ceilings or Sticky Floors? Statistical Discrimination in a Dynamic Modelof Hiring and Promotion*. The Economic Journal 118:530, 961-982. [CrossRef]
88. Robert Slonim, Ellen Garbarino. 2008. Increases in trust and altruism from partner selection:Experimental evidence. Experimental Economics 11:2, 134-153. [CrossRef]
89. SALLY HASLANGER. 2008. Changing the Ideology and Culture of Philosophy: Not by Reason(Alone). Hypatia 23:2, 210-223. [CrossRef]
90. Sally Haslanger. 2008. Changing the Ideology and Culture of Philosophy: Not by Reason (Alone).Hypatia: A Journal of Feminist Philosophy 23:2, 210-223. [CrossRef]
91. PETER BAMBERGER, ELA KOHN, INBAL NAHUM-SHANI. 2008. Aversive WorkplaceConditions and Employee Grievance Filing: The Moderating Effects of Gender and Ethnicity.Industrial Relations 47:2, 229-259. [CrossRef]

92. Major G. Coleman, William A. Darity Jr., Rhonda V. Sharpe. 2008. Are Reports of DiscriminationValid? Considering the Moral Hazard Effect. American Journal of Economics and Sociology 67:2,149-175. [CrossRef]
93. Jay S. Kaufman. 2008. Epidemiologic analysis of racial/ethnic disparities: Some fundamentalissues and a cautionary example#. Social Science & Medicine 66:8, 1659-1669. [CrossRef]
94. DAVID A. KRAVITZ. 2008. THE DIVERSITY–VALIDITY DILEMMA: BEYONDSELECTION—THE ROLE OF AFFIRMATIVE ACTION. Personnel Psychology 61:1, 173-193.[CrossRef]
95. C. Elizabeth Hirsh, Sabino Kornrich. 2008. The Context of Discrimination: Workplace Conditions,Institutional Environments, and Sex and Race Discrimination Charges. American Journal ofSociology 113:5, 1394-1432. [CrossRef]
96. Maria Krysan, Reynolds Farley, Mick P. Couper. 2008. IN THE EYE OF THE BEHOLDER. DuBois Review: Social Science Research on Race 5:01, 5. [CrossRef]
97. Pnina Shachaf, Shannon M. Oltmann, Sarah M. Horowitz. 2008. Service equality in virtualreference. Journal of the American Society for Information Science and Technology 59:4, 535-550.[CrossRef]
98. Michael I. Norton, Joseph A. Vandello, Andrew Biga, John M. Darley. 2008. Colorblindness andDiversity: Conflicting Goals in Decisions Influenced by Race. Social Cognition 26:1, 102-111.[CrossRef]
99. David H. Autor, David Scarborough. 2008. Does Job Testing Harm Minority Workers? Evidencefrom Retail Establishments *. Quarterly Journal of Economics 123:1, 219-277. [CrossRef]
100. Keith Head, Thierry Mayer. 2008. DETECTION OF LOCAL INTERACTIONS FROM THESPATIAL PATTERN OF NAMES IN FRANCE*. Journal of Regional Science 48:1, 67-95.[CrossRef]
101. John DiNardo. 2007. Interesting Questions in FreakonomicsInteresting Questions inFreakonomics. Journal of Economic Literature 45:4, 973-1000. [Abstract] [View PDF article][PDF with links]
102. Heidi B. Carlone, Angela Johnson. 2007. Understanding the science experiences of successfulwomen of color: Science identity as an analytic lens. Journal of Research in Science Teaching44:8, 1187-1218. [CrossRef]
103. Francesco Renna, Randall King. 2007. The Impact of Racial Discrimination on the Early CareerOutcomes of Young Men. Atlantic Economic Journal 35:3, 269-278. [CrossRef]
104. Nauro F. Campos, Vitaliy S. Kuzeyev. 2007. On the Dynamics of Ethnic Fractionalization.American Journal of Political Science 51:3, 620-639. [CrossRef]
105. PAUL J. FERRARO, RONALD G. CUMMINGS. 2007. CULTURAL DIVERSITY,DISCRIMINATION, AND ECONOMIC OUTCOMES: AN EXPERIMENTAL ANALYSIS.Economic Inquiry 45:2, 217-232. [CrossRef]
106. Robin R. Sobotta, Heather E. Campbell, Beverly J. Owens. 2007. AVIATION NOISE ANDENVIRONMENTAL JUSTICE: THE BARRIO BARRIER. Journal of Regional Science 47:1,125-154. [CrossRef]
107. 2007. Table of Contents. ASHE Higher Education Report 33:1, 1-139. [CrossRef]
108. M. I. Norton, S. R. Sommers, E. P. Apfelbaum, N. Pura, D. Ariely. 2006. Color Blindness andInterracial Interaction: Playing the Political Correctness Game. Psychological Science 17:11,949-953. [CrossRef]
109. Todd L. Pittinsky, Margaret J. Shih, Amy Trahan. 2006. Identity Cues: Evidence From and forIntra-Individual Perspectives on Positive and Negative Stereotyping1. Journal of Applied SocialPsychology 36:9, 2215-2239. [CrossRef]
110. Niki T. Dickerson. 2006. "WE ARE A FORCE TO BE RECKONED WITH": BLACK ANDLATINA WOMEN'S LEADERSHIP IN THE CONTEMPORARY U.S. LABOR MOVEMENT.WorkingUSA 9:3, 293-313. [CrossRef]
111. Lincoln Quillian. 2006. New Approaches to Understanding Racial Prejudice and Discrimination.Annual Review of Sociology 32:1, 299-328. [CrossRef]
112. Adrian G. Carpusor, William E. Loges. 2006. Rental Discrimination and Ethnicity in Names1.Journal of Applied Social Psychology 36:4, 934-952. [CrossRef]
113. Liran Einav , Leeat Yariv . 2006. What's in a Surname? The Effects of Surname Initials onAcademic SuccessWhat's in a Surname? The Effects of Surname Initials on Academic Success.Journal of Economic Perspectives 20:1, 175-188. [Abstract] [View PDF article] [PDF with links]
114. Shannon Harper, Barbara Reskin. 2005. Affirmative Action at School and on the Job. AnnualReview of Sociology 31:1, 357-379. [CrossRef]
115. Jennifer A. Chatman, Francis J. Flynn. 2005. Full-Cycle Micro-Organizational Behavior Research.Organization Science 16:4, 434-447. [CrossRef]
116. William Darity. 2005. Stratification economics: The role of intergroup inequality. Journal ofEconomics and Finance 29:2, 144-153. [CrossRef]
117. Marianne Bertrand , Dolly Chugh , Sendhil Mullainathan . 2005. Implicit DiscriminationImplicitDiscrimination. American Economic Review 95:2, 94-98. [Citation] [View PDF article] [PDF withlinks]
118. William Darity. 2004. The wellspring of racial inequality. The Review of Black Political Economy32:2, 61-68. [CrossRef]
119. Vonnie C. McLoyd, Rachel Kaplan, Kelly M. Purtell, Erika Bagley, Cecily R. Hardaway, CiaraSmallsPoverty and Socioeconomic Disadvantage in Adolescence . [CrossRef]