ARE CEOS PAID FOR PERFORMANCE? Evaluating the ... · PDF fileARE CEOS PAID FOR PERFORMANCE?...
23
Are CEOs Paid for Performance? 1 ARE CEOS PAID FOR PERFORMANCE? Evaluating the Effectiveness of Equity Incentives October 4, 2016 Ric Marshall Linda-Eling Lee Abstract Has CEO pay reflected long-term stock performance? In a word, “no.” Companies that awarded their Chief Executive Officers higher pay incentive levels had below-median returns, based on a sample of 429 large-cap U.S. companies observed from 2005 to 2015. On a 10-year cumulative basis, total shareholder returns of those companies whose total summary pay was below their sector median outperformed those companies where pay exceeded the sector median by as much as 39%. This potential misalignment of interests between CEOs and shareholders contradicts a long history of academic studies that, until very recently, have not questioned the basic premise that equity incentives should comprise the largest component of overall CEO pay. If adopted, the arguments in this paper could undermine the adoption of equity-based incentive pay that has dominated executive pay practices in the U.S. for the past three decades. This paper uses 10 years of data covering a universe of 446 companies to test concerns voiced by institutional investors that CEO pay at many U.S. companies does not reflect company performance and incentivizes short-term share price gains over long-term value creation.
Transcript of ARE CEOS PAID FOR PERFORMANCE? Evaluating the ... · PDF fileARE CEOS PAID FOR PERFORMANCE?...
Are CEOs Paid for Performance? -‐ 1
ARE CEOS PAID FOR PERFORMANCE?
Evaluating the Effectiveness of Equity Incentives
October 4, 2016
Ric Marshall
Linda-Eling Lee
Abstract
Has CEO pay reflected long-term stock performance? In a word, “no.” Companies that awarded their Chief Executive Officers higher pay incentive levels had below-median returns, based on a sample of 429 large-cap U.S. companies observed from 2005 to 2015. On a 10-year cumulative basis, total shareholder returns of those companies whose total summary pay was below their sector median outperformed those companies where pay exceeded the sector median by as much as 39%.
This potential misalignment of interests between CEOs and shareholders contradicts a long history of academic studies that, until very recently, have not questioned the basic premise that equity incentives should comprise the largest component of overall CEO pay. If adopted, the arguments in this paper could undermine the adoption of equity-based incentive pay that has dominated executive pay practices in the U.S. for the past three decades.
This paper uses 10 years of data covering a universe of 446 companies to test concerns voiced by institutional investors that CEO pay at many U.S. companies does not reflect company performance and incentivizes short-term share price gains over long-term value creation.
Are CEOs Paid for Performance? -‐ 2
Executive Summary Has CEO pay reflected long-term stock performance? In a word, “no.”
Companies that awarded their Chief Executive Officers (CEOs) higher equity incentives had below-median returns based on a sample of 429 large-cap U.S. companies observed from 2006 to 2015. On a 10-year cumulative basis, total shareholder returns of those companies whose total summary pay (the level that must be disclosed in the summary tables of proxy statements) was below their sector median outperformed those companies where pay exceeded the sector median by as much as 39%.1
For long-term institutional investors, this potential misalignment of interests between CEOs and shareholders may undermine the adoption of equity-based incentive pay that has dominated executive pay practices in the U.S. for the past three decades. During the observed period, long-term incentive pay was the largest element of CEO pay, accounting for more than 70% of compensation for both summary pay and realized pay (which incorporates stocks gains realized during the course of the year), according to our calculations.
A large part of the issue is that disclosure rules mandated by the U.S. Securities and Exchange Commission (SEC) focus on annual instead of long-term reporting. Inclusion of certain long-term data, such as a comparison of total summary incentive pay over the CEO’s entire tenure to company stock performance, could help better align the interests of CEOs and long-term investors. In addition, improved disclosure of one-time benefits such as signing bonuses and severance agreements in cumulative totals would likely increase the focus on these often significant pay provisions.
In general, companies very rarely include the sort of cumulative figures in presentations of CEO pay that long-term investors would find most helpful. We derived such long-term measures from multiple filings but we believe the general lack of such integrated disclosure results in an excessive focus on short-term share price gains, at the expense of long-term returns. We suggest several ideas for improvement, such as the reporting of cumulative pay and performance data over the CEO’s full tenure, to reduce the focus on the short term that prevails currently.
1 While we have not yet completed a full statistical evaluation of this relationship, we believe that the findings are sufficiently compelling to serve as a basis for further review and discussion regarding this widely debated aspect of corporate governance.
Are CEOs Paid for Performance? -‐ 3
Introduction Few other areas of corporate governance are more hotly or widely debated than CEO pay. According to a recent study published by the Rock Center for Corporate Governance at Stanford University, a majority of Americans believe that most CEOs are “vastly overpaid,” while a majority of corporate directors think just the opposite.2
This perceptual disconnect is a persistent challenge. News stories detailing the purported excesses of CEO pay have been featured in the business and general media, particularly when the companies cited were performing poorly.
Despite the negative press, investors have approved the vast majority of U.S. corporate pay plans, often votes ranging from 90% to 95%, since “Say on Pay” voting was mandated the 2010 Dodd-Frank Wall Street Reform and Consumer Protection Act.3
Has CEO pay reflected the companies’ stock performance? The seeds of this debate were first planted over 30 years ago, when shareholders and others embraced the idea that CEOs and other senior executives should be rewarded primarily in some form of company equity.4 In theory, such rewards were intended to convert these corporate agents into corporate principals, and thus ensure the alignment of their personal interests with those of the company’s shareholders. In combination with accounting treatment that favored stock option grants, this notion almost certainly helped fuel the internet-based high tech revolution and subsequent hi-tech bubble of the late 1990s. Even today, long after such favorable accounting treatment has been eliminated, equity awards continue to account for 70% or more of the CEO’s total pay package, based on our calculations.
What do we even mean by “CEO pay”? The total pay figures reported in standard summary compensation tables mandated by the SEC include a combination of prior year base salary benefits and bonuses, plus any forward-looking equity incentive awards made that year. Should we really include such awards, which may or may not be realized, in our assessment of current pay?
These are not the only figures to consider. In reality, CEOs almost never realized the exact amount reported in the summary table, based on our sample period. Moreover, the value of these awards as reported is based on the share price of the company’s stock as of the date the grant was made, usually referred to as “grant date value,” in keeping with SEC requirements.5 Thus, the reported value of last year’s stock awards may be higher or lower than the previous year’s awards, even if the number of shares granted is exactly the same. Our research indicates that 2 Larcker, D., N.E. Donatiello, B. Tayan. (2016). “Americans and CEO Pay: 2016 Public Perception Survey on CEO Compensation.” Corporate Governance Research Initiative, Stanford Rock Center for Corporate Governance. 3 For additional background on “Say on Pay” approval rates, see Weaver, R.L. (2016). “The 100 Most Overpaid CEOs: Executive Compensation at S&P 500 Companies.” As You Sow. 4 Desai, M. A. (2012). "The Incentive Bubble." Harvard Business Review, Vol. 90, No. 3 (March). 5 U.S. Securities and Exchange Commission, Release Nos. 33-‐8732A;34-‐54302A; IC-‐27444A; File No. S7-‐03-‐06 (March 2006).
Are CEOs Paid for Performance? -‐ 4
many individuals for whom other executive pay research firms have reported a decline in 2016 reported summary pay actually experienced a net increase in year-over-year total realized pay — that is, how much the CEO actually took home when equity gains are considered.
When it comes to CEO pay, directors see a detailed and transparent process at work — an efficient, well-oiled machine. In contrast, the public — and many investors — often see a complex array of figures and terminology that vary considerably company by company. Is it any surprise that the public cannot help but wonder if this particular machine wasn’t designed by a modern day Rube Goldberg?
Terms and Definitions We define total summary pay as the total pay figure reported in the summary compensation table that appears in all publicly held U.S. companies’ annual proxy filings. For the proxy years 2006 through 2015, these figures include the total annual pay awarded each CEO plus the grant date value of any stock option or restricted share grants awarded, as mandated by the SEC. For the year prior to 2006, we calculated values for the equity incentive awards reported in those years, based on a share price valuation methodology that was applied identically to all sample companies.
We define total realized pay as the total annual pay figure, plus any prior period equity-based award values actually realized in the course of the reporting year. The SEC mandates reporting these values, but they are found in a separate table. We generally favor use of the simpler term “pay” over “compensation” or “remuneration,” but consider all three terms to be interchangeable. For purposes of this report, we also calculated cumulative total summary pay and cumulative total realized pay totals, in this case for the 10-year period under study (from proxy year 2006 for performance year 2005 through the proxy year 2015 for performance year 2014). These long-term figures are not currently required to be disclosed, but in our view both are essential to analyzing CEO pay over long-term periods.
Are CEOs Paid for Performance? -‐ 5
Equity Incentives and Long Term Investment How effectively is CEO pay tied to their companies’ stock performance? More specifically, have larger equity incentives been effective in improving investor returns?
A number of studies have considered this question from a relatively long-term perspective by testing against rolling five-year performance periods.6 Up until very recently, however, the basic premise that equity incentives should comprise the largest component of overall pay has very rarely been questioned.7
As part of this study, we compared CEO pay figures against 10-year Total Shareholder Returns (TSR). Starting with the MSCI USA Index, which as of March 31, 2016 included 626 large- and mid-cap U.S. companies, we selected companies where a full 10 years of both CEO pay and performance data were available. The resulting universe of 446 companies was well-diversified, with 10 GICS® sector representation, as shown in Exhibit 1.8 Based on their full market capitalization as of that date, the smallest company included was PPL Corp., at $2.4 billion, and the largest was Apple Inc., at $591 billion.
However, average CEO tenure at U.S. large- and mid-cap companies is 6.6 years, and only 159 of these firms employed the same CEO throughout this entire 10-year period. As a result, pay figures for over 800 individual CEOs were included in the analysis. At companies where two individuals were paid for CEO service in the same year, we included the aggregate amount paid or awarded to both individuals: our goal was to evaluate the relationship between pay and performance for each company, not for each CEO.
Testing each company’s 10-year total pay figures against its 10-year TSR for the same reporting period, we compiled both annual and cumulative total pay figures for both total summary and total realized pay for each company.9
6 Van Clief, M, K. Leefland and S. O’Byrne. (2014). “The Alignment Gap Between Creating Value, Performance Measurement, and Long-‐Term Incentive Design.” The Investor Responsibility Research Center Institute (IRRCi) and Organizational Capital Partners. 7 For example, M.B. Dorff. (2014). “Indispensable and Other Myths: Why the CEO Pay Experiment Failed and How to Fix It.” University of California Press. 8 GICS is the Global Industry Classification Standard jointly developed by MSCI Inc. and Standard & Poor’s. 9 We began with pay figures reported in proxy year 2006 for the prior year’s performance, through the figures reported in proxy year 2015 for compensation year 2014. While many of these companies will have published updated pay and performance figures for compensation year 2015 as of the time of this report’s publication, this data was not yet available at the time this research was conducted.
Are CEOs Paid for Performance? -‐ 6
Returns How effectively is CEO pay tied to their companies’ stock performance? More specifically, have larger equity incentives been effective in improving investor returns?
A number of studies have considered this question from a relatively long-term perspective by testing against rolling five-year performance periods.10 Up until very recently, however, the basic premise that equity incentives should comprise the largest component of overall pay has very rarely been questioned.11
As part of this study, we compared CEO pay figures against 10-year Total Shareholder Returns (TSR). Starting with the MSCI USA Index, which as of March 31, 2016 included 626 large- and mid-cap U.S. companies, we selected companies where a full 10 years of both CEO pay and performance data were available. The resulting universe of 446 companies was well-diversified, with 10 GICS® sector representation, as shown in Exhibit 1.12 Based on their full market capitalization as of that date, the smallest company included was PPL Corp., at $2.4 billion, and the largest was Apple Inc., at $591 billion.
However, average CEO tenure at U.S. large- and mid-cap companies is 6.6 years, and only 159 of these firms employed the same CEO throughout this entire 10-year period. As a result, pay figures for over 800 individual CEOs were included in the analysis. At companies where two individuals were paid for CEO service in the same year, we included the aggregate amount paid or awarded to both individuals: our goal was to evaluate the relationship between pay and performance for each company, not for each CEO.
Testing each company’s 10-year total pay figures against its 10-year TSR for the same reporting period, we compiled both annual and cumulative total pay figures for both total summary and total realized pay for each company.13
10 Van Clief, M, K. Leefland and S. O’Byrne. (2014). “The Alignment Gap Between Creating Value, Performance Measurement, and Long-‐Term Incentive Design.” The Investor Responsibility Research Center Institute (IRRCi) and Organizational Capital Partners. 11 For example, M.B. Dorff. (2014). “Indispensable and Other Myths: Why the CEO Pay Experiment Failed and How to Fix It.” University of California Press. 12 GICS is the Global Industry Classification Standard jointly developed by MSCI Inc. and Standard & Poor’s. 13 We began with pay figures reported in proxy year 2006 for the prior year’s performance, through the figures reported in proxy year 2015 for compensation year 2014. While many of these companies will have published updated pay and performance figures for compensation year 2015 as of the time of this report’s publication, this data was not yet available at the time this research was conducted.
Are CEOs Paid for Performance? -‐ 7
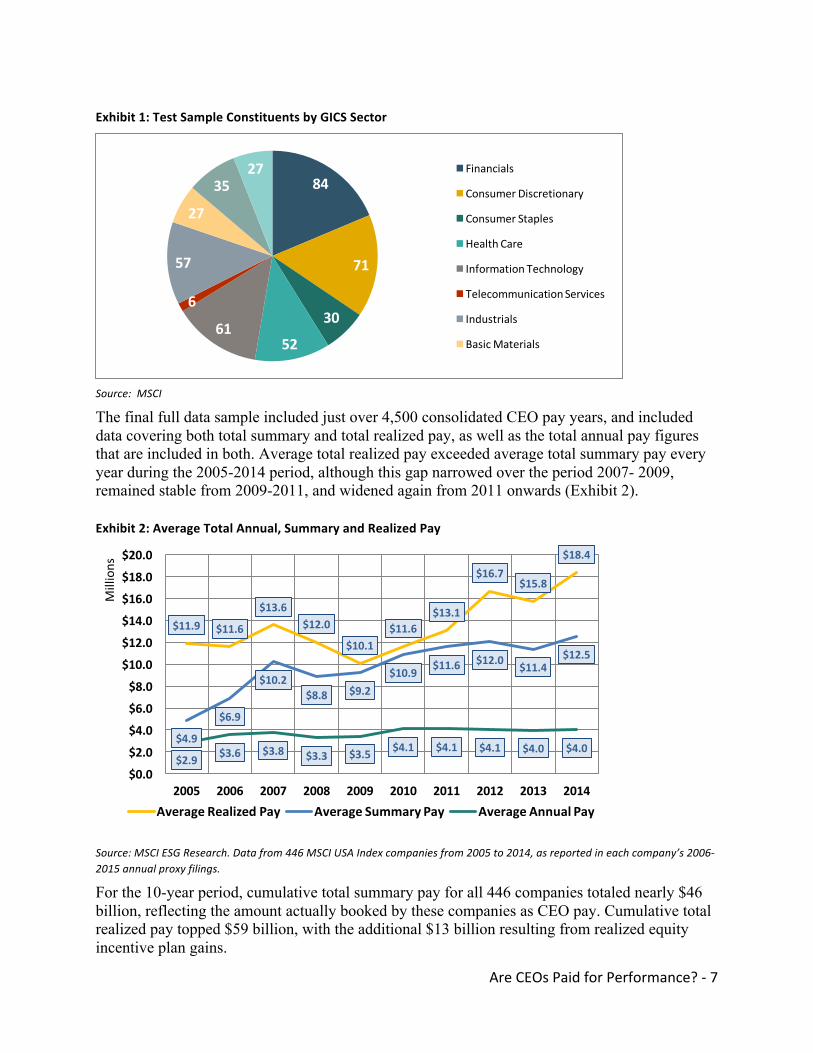
Exhibit 1: Test Sample Constituents by GICS Sector
Source: MSCI
The final full data sample included just over 4,500 consolidated CEO pay years, and included data covering both total summary and total realized pay, as well as the total annual pay figures that are included in both. Average total realized pay exceeded average total summary pay every year during the 2005-2014 period, although this gap narrowed over the period 2007- 2009, remained stable from 2009-2011, and widened again from 2011 onwards (Exhibit 2).
Exhibit 2: Average Total Annual, Summary and Realized Pay
Source: MSCI ESG Research. Data from 446 MSCI USA Index companies from 2005 to 2014, as reported in each company’s 2006-‐2015 annual proxy filings.
For the 10-year period, cumulative total summary pay for all 446 companies totaled nearly $46 billion, reflecting the amount actually booked by these companies as CEO pay. Cumulative total realized pay topped $59 billion, with the additional $13 billion resulting from realized equity incentive plan gains.
84
71
30
5261
6
57
27
3527 Financials
Consumer Discretionary
Consumer Staples
Health Care
Information Technology
Telecommunication Services
Industrials
Basic Materials
$18.4
$15.8$16.7
$13.1$11.6
$10.1
$12.0$13.6
$11.6$11.9
$12.5$11.4$12.0$11.6$10.9
$9.2$8.8$10.2
$6.9
$4.9$4.0$4.0$4.1$4.1$4.1$3.5$3.3$3.8$3.6$2.9
$0.0
$2.0
$4.0
$6.0
$8.0
$10.0
$12.0
$14.0
$16.0
$18.0
$20.0
2014201320122011201020092008200720062005
Millions
Average Realized Pay Average Summary Pay Average Annual Pay
Are CEOs Paid for Performance? -‐ 8
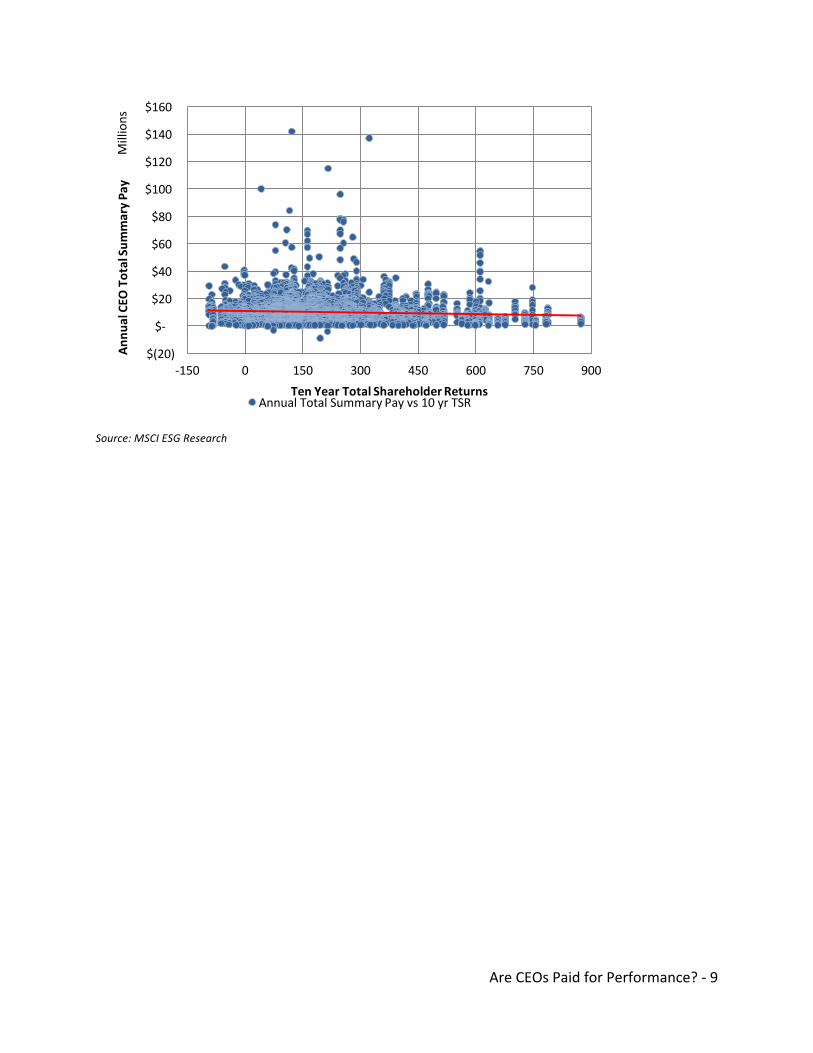
Before testing the relationship between CEO pay and total shareholder returns, we adjusted our sample set to exclude the impact of 17 outliers, including Apple, whose 10-year total returns were significantly higher than all other companies. The pay performance relationship for these outlier companies was evaluated separately, on a case-by-case basis.14 This left us with a final sample set of 429 companies. In theory, it is the total summary pay figure that is intended to incentivize future performance, while the total realized pay figure reflects the amounts that each individual actually takes home. In the event of outperformance, the total realized pay figure for a given period can be much higher than the original summary pay figure. Conversely, in the event of underperformance, total realized pay should be less, though we also observed cases where the reverse was true. The relationship between a particular performance period and the resulting total realized pay also was typically dependent on the Long-Term Incentive Plan (LTIP) performance measures targeted, and any vesting period limitations that must be met before the first payout. On average, the incentive pay portions of total summary pay accounted for approximately 70% of annual totals. If the total summary pay figures were effective in incentivizing superior future performance, we would expect to see a strong correlation between higher pay figures and 10-year TSRs. However, we found very little statistical evidence to support this; in fact, we found a small but consistently negative relationship, a possible indicator that superior performance may have been linked to lower rather than higher pay awards.
Exhibit 3: 10-‐year Annual Total Summary Pay vs. 10-‐year TSRs
14 The outperformance outliers excluded from our 10-‐year sample set were Alexion Pharmaceuticals, Apple, Biomarin Pharmaceuticals, Celgene, Gilead Sciences, Illumina, Intuitive Surgical, Ionis Pharmaceuticals, Keurig Green Mountain, LKQ, Netflix, Regeneron Pharmaceuticals, Salesforce.com, SBA Communications, Priceline, Vertex Pharmaceuticals and Western Digital, where 10-‐year TSRs ranged from 946%-‐7,088%. For additional information regarding these companies, see Appendix 1.
Are CEOs Paid for Performance? -‐ 9
Source: MSCI ESG Research
$(20)
$-‐
$20
$40
$60
$80
$100
$120
$140
$160
-‐150 0 150 300 450 600 750 900
Annu
al CEO
Total Su
mmary Pa
yMillions
Ten Year Total Shareholder ReturnsAnnual Total Summary Pay vs 10 yr TSR
Are CEOs Paid for Performance? -‐ 10
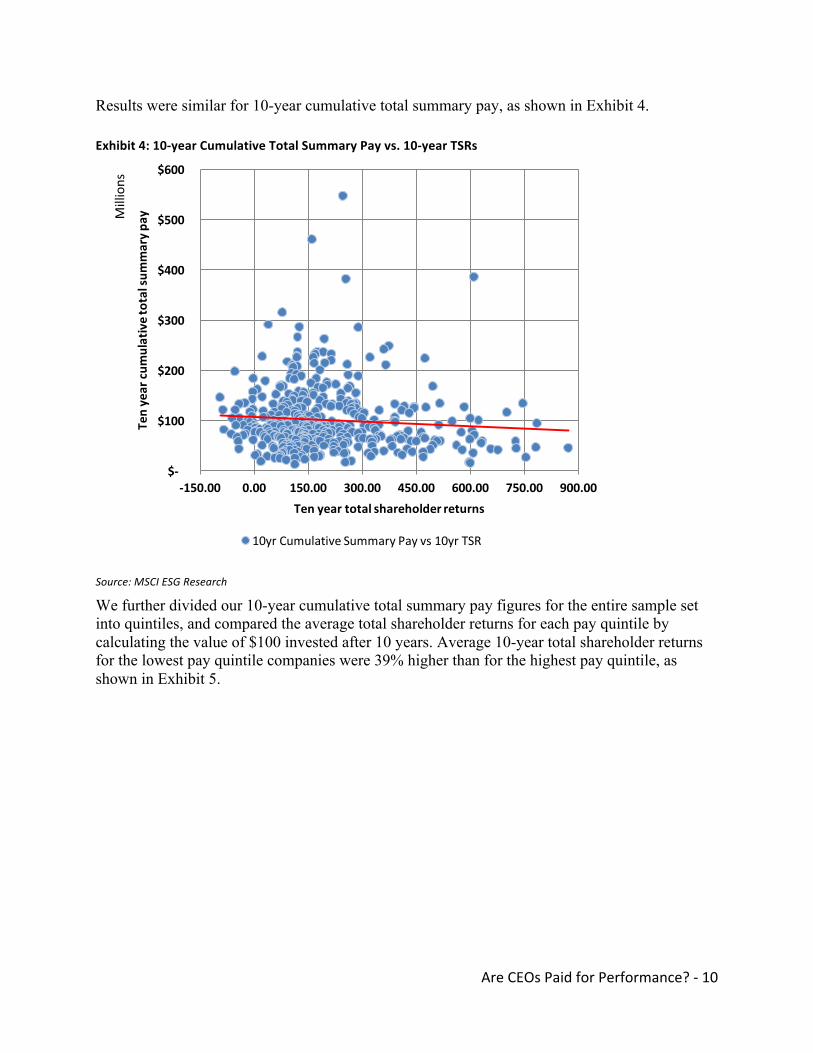
Results were similar for 10-year cumulative total summary pay, as shown in Exhibit 4.
Exhibit 4: 10-‐year Cumulative Total Summary Pay vs. 10-‐year TSRs
Source: MSCI ESG Research
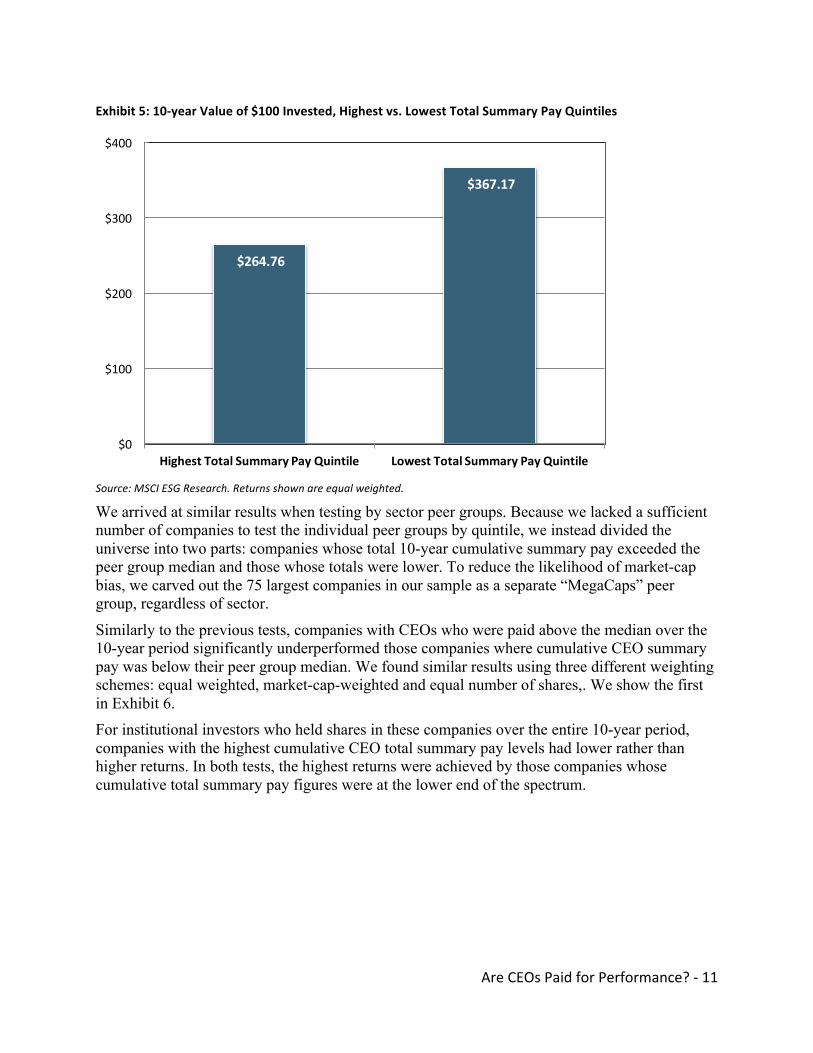
We further divided our 10-year cumulative total summary pay figures for the entire sample set into quintiles, and compared the average total shareholder returns for each pay quintile by calculating the value of $100 invested after 10 years. Average 10-year total shareholder returns for the lowest pay quintile companies were 39% higher than for the highest pay quintile, as shown in Exhibit 5.
$-‐
$100
$200
$300
$400
$500
$600
-‐150.00 0.00 150.00 300.00 450.00 600.00 750.00 900.00
Ten year cu
mulative total su
mmary p
ayMillions
Ten year total shareholder returns
10yr Cumulative Summary Pay vs 10yr TSR
Are CEOs Paid for Performance? -‐ 11
Exhibit 5: 10-‐year Value of $100 Invested, Highest vs. Lowest Total Summary Pay Quintiles
Source: MSCI ESG Research. Returns shown are equal weighted.
We arrived at similar results when testing by sector peer groups. Because we lacked a sufficient number of companies to test the individual peer groups by quintile, we instead divided the universe into two parts: companies whose total 10-year cumulative summary pay exceeded the peer group median and those whose totals were lower. To reduce the likelihood of market-cap bias, we carved out the 75 largest companies in our sample as a separate “MegaCaps” peer group, regardless of sector.
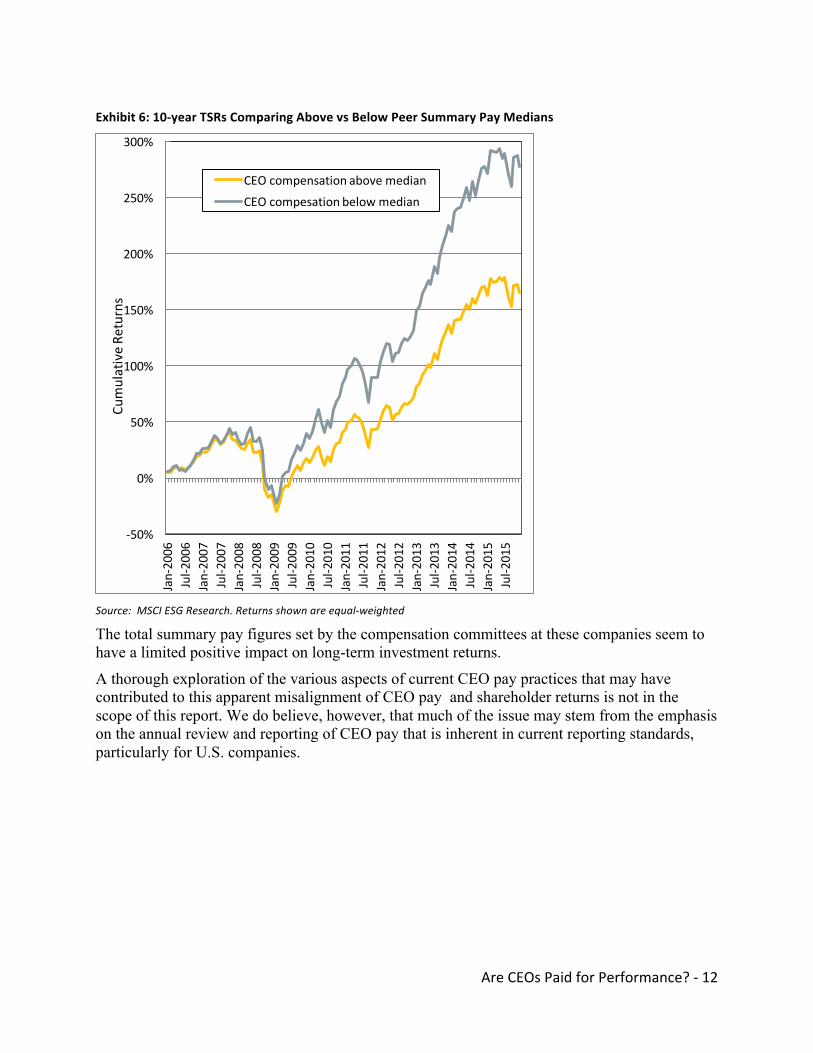
Similarly to the previous tests, companies with CEOs who were paid above the median over the 10-year period significantly underperformed those companies where cumulative CEO summary pay was below their peer group median. We found similar results using three different weighting schemes: equal weighted, market-cap-weighted and equal number of shares,. We show the first in Exhibit 6. For institutional investors who held shares in these companies over the entire 10-year period, companies with the highest cumulative CEO total summary pay levels had lower rather than higher returns. In both tests, the highest returns were achieved by those companies whose cumulative total summary pay figures were at the lower end of the spectrum.
$264.76
$367.17
$0
$100
$200
$300
$400
Highest Total Summary Pay Quintile Lowest Total Summary Pay Quintile
Are CEOs Paid for Performance? -‐ 12
Exhibit 6: 10-‐year TSRs Comparing Above vs Below Peer Summary Pay Medians
Source: MSCI ESG Research. Returns shown are equal-‐weighted
The total summary pay figures set by the compensation committees at these companies seem to have a limited positive impact on long-term investment returns.
A thorough exploration of the various aspects of current CEO pay practices that may have contributed to this apparent misalignment of CEO pay and shareholder returns is not in the scope of this report. We do believe, however, that much of the issue may stem from the emphasis on the annual review and reporting of CEO pay that is inherent in current reporting standards, particularly for U.S. companies.
-‐50%
0%
50%
100%
150%
200%
250%
300%
Jan-‐2006
Jul-‐2
006
Jan-‐2007
Jul-‐2
007
Jan-‐2008
Jul-‐2
008
Jan-‐2009
Jul-‐2
009
Jan-‐2010
Jul-‐2
010
Jan-‐2011
Jul-‐2
011
Jan-‐2012
Jul-‐2
012
Jan-‐2013
Jul-‐2
013
Jan-‐2014
Jul-‐2
014
Jan-‐2015
Jul-‐2
015
Cumulative Re
turns
CEO compensation above medianCEO compesation below median
Are CEOs Paid for Performance? -‐ 13
Improving CEO Pay Reporting U.S. companies present investors with a rich but sometimes overwhelming mixture of incentive pay figures. Despite the detailed levels of disclosure mandated by the SEC, in some critical ways these requirements fall short of providing full and transparent information to investors. We will offer suggestions to close key gaps in reporting requirements.
SEC-mandated pay disclosure standards entail combining both backward- and forward-looking incentive awards, in the form of both cash and equity. In addition, these awards may vest over time horizons that vary considerably between individual companies. These presentations are updated in each company’s annual proxy filing.
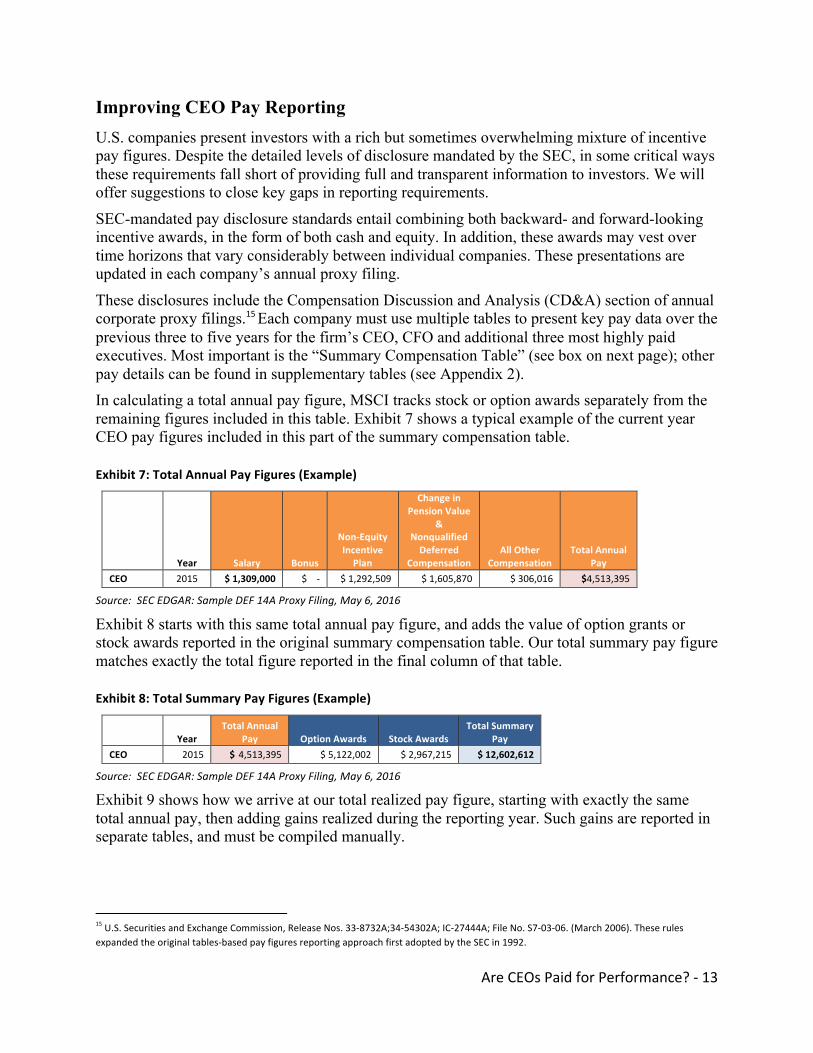
These disclosures include the Compensation Discussion and Analysis (CD&A) section of annual corporate proxy filings.15 Each company must use multiple tables to present key pay data over the previous three to five years for the firm’s CEO, CFO and additional three most highly paid executives. Most important is the “Summary Compensation Table” (see box on next page); other pay details can be found in supplementary tables (see Appendix 2). In calculating a total annual pay figure, MSCI tracks stock or option awards separately from the remaining figures included in this table. Exhibit 7 shows a typical example of the current year CEO pay figures included in this part of the summary compensation table.
Exhibit 7: Total Annual Pay Figures (Example)
Year Salary Bonus
Non-‐Equity Incentive
Plan
Change in Pension Value
& Nonqualified Deferred
Compensation All Other
Compensation Total Annual
Pay CEO 2015 $ 1,309,000 $ -‐ $ 1,292,509 $ 1,605,870 $ 306,016 $4,513,395
Source: SEC EDGAR: Sample DEF 14A Proxy Filing, May 6, 2016
Exhibit 8 starts with this same total annual pay figure, and adds the value of option grants or stock awards reported in the original summary compensation table. Our total summary pay figure matches exactly the total figure reported in the final column of that table.
Exhibit 8: Total Summary Pay Figures (Example)
Year Total Annual
Pay Option Awards Stock Awards Total Summary
Pay CEO 2015 $ 4,513,395 $ 5,122,002 $ 2,967,215 $ 12,602,612
Source: SEC EDGAR: Sample DEF 14A Proxy Filing, May 6, 2016
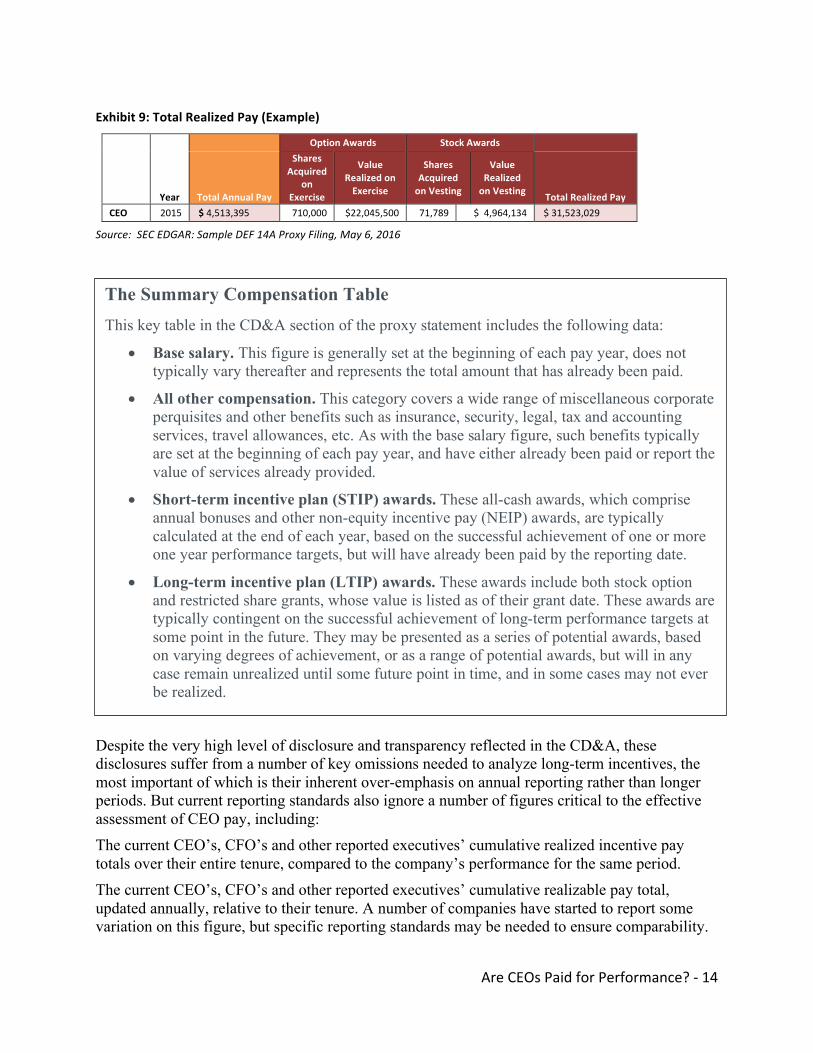
Exhibit 9 shows how we arrive at our total realized pay figure, starting with exactly the same total annual pay, then adding gains realized during the reporting year. Such gains are reported in separate tables, and must be compiled manually.
15 U.S. Securities and Exchange Commission, Release Nos. 33-‐8732A;34-‐54302A; IC-‐27444A; File No. S7-‐03-‐06. (March 2006). These rules expanded the original tables-‐based pay figures reporting approach first adopted by the SEC in 1992.
Are CEOs Paid for Performance? -‐ 14
Exhibit 9: Total Realized Pay (Example)
Option Awards Stock Awards
Year Total Annual Pay
Shares Acquired
on Exercise
Value Realized on Exercise
Shares Acquired on Vesting
Value Realized on Vesting Total Realized Pay
CEO 2015 $ 4,513,395 710,000 $22,045,500 71,789 $ 4,964,134 $ 31,523,029
Source: SEC EDGAR: Sample DEF 14A Proxy Filing, May 6, 2016
Despite the very high level of disclosure and transparency reflected in the CD&A, these disclosures suffer from a number of key omissions needed to analyze long-term incentives, the most important of which is their inherent over-emphasis on annual reporting rather than longer periods. But current reporting standards also ignore a number of figures critical to the effective assessment of CEO pay, including: The current CEO’s, CFO’s and other reported executives’ cumulative realized incentive pay totals over their entire tenure, compared to the company’s performance for the same period. The current CEO’s, CFO’s and other reported executives’ cumulative realizable pay total, updated annually, relative to their tenure. A number of companies have started to report some variation on this figure, but specific reporting standards may be needed to ensure comparability.
The Summary Compensation Table This key table in the CD&A section of the proxy statement includes the following data:
• Base salary. This figure is generally set at the beginning of each pay year, does not typically vary thereafter and represents the total amount that has already been paid.
• All other compensation. This category covers a wide range of miscellaneous corporate perquisites and other benefits such as insurance, security, legal, tax and accounting services, travel allowances, etc. As with the base salary figure, such benefits typically are set at the beginning of each pay year, and have either already been paid or report the value of services already provided.
• Short-term incentive plan (STIP) awards. These all-cash awards, which comprise annual bonuses and other non-equity incentive pay (NEIP) awards, are typically calculated at the end of each year, based on the successful achievement of one or more one year performance targets, but will have already been paid by the reporting date.
• Long-term incentive plan (LTIP) awards. These awards include both stock option and restricted share grants, whose value is listed as of their grant date. These awards are typically contingent on the successful achievement of long-term performance targets at some point in the future. They may be presented as a series of potential awards, based on varying degrees of achievement, or as a range of potential awards, but will in any case remain unrealized until some future point in time, and in some cases may not ever be realized.
Are CEOs Paid for Performance? -‐ 15
In the case of a departing CEO, the cumulative total realized pay for their entire tenure, compared to the company’s performance results for that same period.
In the case of a new CEO, an assessment of how their internal or external hiring has been reflected in their initial pay package and the impact of their hiring on total top executive pay for the company. As noted previously, the impact of individual pay awards that are contract-specific or out-of-plan for some other reason. Such awards might include, but would not be limited to, awards based on initial signing agreements (“golden hellos”); individual severance and/or change of control agreements; and any one time equity incentive awards to a specific individual. Such figures should always be included in the cumulative totals listed above.
Broadly speaking, the sort of cumulative figures that long-term investors would find most helpful are very rarely included in current CD&A presentations. We have calculated such long-term figures based on available data from multiple proxies, but we believe the general lack of such information in individual annual filings may be a likely cause for much of the short-term orientation we encounter in tracking and analyzing U.S. CEO pay practices and reporting.
Are CEOs Paid for Performance? -‐ 16
Conclusion Equity incentive awards now comprise 70% or more of total summary CEO pay in the United States, based on our calculations. Yet we found little evidence to show a link between the large proportion of pay that such awards represent and long-term company stock performance. In fact, even after adjusting for company size and sector, companies with lower total summary CEO pay levels more consistently displayed higher long-term investment returns.
We also examined how current mandated reporting standards, and in particular the annual reporting cycle, may have contributed to this misalignment between CEO pay and shareholder returns. We offered several ideas for improvement, such as cumulative pay and performance data over the CEO’s full tenure, to reduce the current short-term focus. Based on current requirements and practices, such data is rarely included in CD&A tables. Long-term institutional investors typically bear the cost of this misalignment, yet they have routinely approved CEO pay packages. Closer scrutiny of the relationship between CEO pay and performance over longer time periods could lead to different conclusions.
Are CEOs Paid for Performance? -‐ 17
About the authors
Ric Marshall is Executive Director and senior analyst in corporate governance at MSCI ESG Research, which was named the top global SRI and corporate governance firm by respondents to the 2015 Independent Research in Responsible Investment (IRRI) Survey.
Ric was previously Chief Analyst at GMI Ratings, which was acquired by MSCI in 2014, and led the development of what is now MSCI's corporate governance ratings model. Over the past twenty years Ric has written extensively on the importance of corporate governance for investors, and has been a guest speaker and panelist at conferences throughout the United States and Europe.
Linda-Eling Lee is Global Head of Research for MSCI’s ESG Research group. She oversees all ESG-related content and methodology and chairs MSCI’s ESG Ratings Review Committee. She leads one of the largest teams of research analysts in the world who are dedicated to identifying risks and opportunities arising from material ESG issues. The team, located in 12 offices globally, provides ESG ratings of 5,000+ issuers; industry and thematic research; and analysis used by investors for positive and negative screening.
Linda joined MSCI in 2010 following the acquisition of RiskMetrics, where she led ESG ratings research and was head of consumer sector analysis. Linda joined RiskMetrics Group in 2009 through the acquisition of Innovest. Prior to joining Innovest, Linda was the Research Director at the Center for Research on Corporate Performance, developing academic research at Harvard Business School into management tools to drive long-term corporate performance. Previously, she was a strategy consultant with Monitor Group in Europe and in Asia, where she worked with Fortune 500 clients in industries ranging from beverages to telecommunications.
Linda received her AB from Harvard, MSt from Oxford, and PhD in Organizational Behavior from Harvard University. Linda has published research both in management journals such as the Harvard Business Review and MIT’s Sloan Management Review, as well as in top academic peer-reviewed journals such as Management Science and Journal of Organizational Behavior.
Are CEOs Paid for Performance? -‐ 18
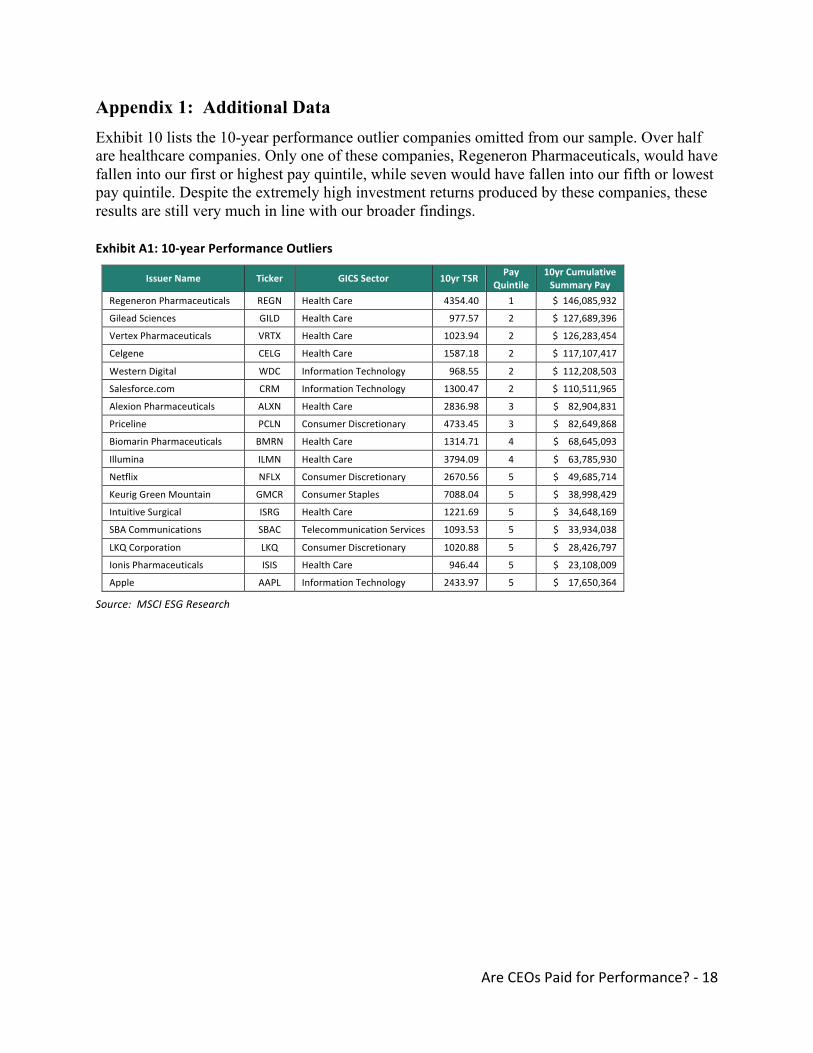
Appendix 1: Additional Data Exhibit 10 lists the 10-year performance outlier companies omitted from our sample. Over half are healthcare companies. Only one of these companies, Regeneron Pharmaceuticals, would have fallen into our first or highest pay quintile, while seven would have fallen into our fifth or lowest pay quintile. Despite the extremely high investment returns produced by these companies, these results are still very much in line with our broader findings.
Exhibit A1: 10-‐year Performance Outliers
Issuer Name Ticker GICS Sector 10yr TSR Pay Quintile
10yr Cumulative Summary Pay
Regeneron Pharmaceuticals REGN Health Care 4354.40 1 $ 146,085,932
Gilead Sciences GILD Health Care 977.57 2 $ 127,689,396
Vertex Pharmaceuticals VRTX Health Care 1023.94 2 $ 126,283,454
Celgene CELG Health Care 1587.18 2 $ 117,107,417
Western Digital WDC Information Technology 968.55 2 $ 112,208,503
Salesforce.com CRM Information Technology 1300.47 2 $ 110,511,965
Alexion Pharmaceuticals ALXN Health Care 2836.98 3 $ 82,904,831
Priceline PCLN Consumer Discretionary 4733.45 3 $ 82,649,868
Biomarin Pharmaceuticals BMRN Health Care 1314.71 4 $ 68,645,093
Illumina ILMN Health Care 3794.09 4 $ 63,785,930
Netflix NFLX Consumer Discretionary 2670.56 5 $ 49,685,714
Keurig Green Mountain GMCR Consumer Staples 7088.04 5 $ 38,998,429
Intuitive Surgical ISRG Health Care 1221.69 5 $ 34,648,169
SBA Communications SBAC Telecommunication Services 1093.53 5 $ 33,934,038
LKQ Corporation LKQ Consumer Discretionary 1020.88 5 $ 28,426,797
Ionis Pharmaceuticals ISIS Health Care 946.44 5 $ 23,108,009
Apple AAPL Information Technology 2433.97 5 $ 17,650,364
Source: MSCI ESG Research
Are CEOs Paid for Performance? -‐ 19
Appendix 2: Secondary Compensation Tables While the summary compensation table is the cornerstone of the current CD&A reporting standard, a number of secondary tables present more detailed data:
• Breakdowns of the short- and long-term incentive plan awards cited in the main summary table. These breakdowns generally will include a description of the performance measure that must be met before such awards can be realized, including any peer-based benchmarking conditions and relevant vesting schedules.
• Year-over-year pension gains and cumulative pension entitlements, based on the number of years of service credited to each individual. These figures represent tax-qualified pension plan benefits that are typically made available to more than one company executive.
• Non-qualified deferred compensation (NQDC) awards. These figures represent additional deferred pay awards of various types, including Supplemental Employee Retirement Plans.
• Severance entitlement figures, based on the circumstances in various termination scenarios, including possible change of control.
Companies must also report any gains actually realized by each individual over the course of the prior year.16 In most cases, such gains appear in one of two forms: either option award gains realized or share awards realized on vesting, both of which are based on achieving past equity incentive plan awards. Disclosure regarding such awards can vary considerably from company to company. A few companies have even begun reporting on potential realizable pay, which refers to any remaining awards still outstanding, in most cases based on the company’s share price as of the reporting period. But disclosure in this area is still mostly a matter of company and compensation committee preference, making company-to-company comparisons very difficult.
Some awards are made outside of normal pay plans but, if implemented, can be considerable. For example, any additional pay realized as a result of executive service, such as severance or change of control awards or new signing bonuses must be reported, though some of these figures are buried in footnotes and sidebars. Such figures are often referred to as out-of-plan or outside-of-plan awards, as they represent awards that were not anticipated by the company’s various formulaic incentive plans.17
16 U.S. Securities and Exchange Commission, Release Nos. 33-‐8732A;34-‐54302A; IC-‐27444A; File No. S7-‐03-‐06 (March 2006). 17 For a recent summary of the size and frequency of such awards, see “Outside of Plan Awards 2015,” co-‐authored by the Canadian Pension Plan Investment Board and Ontario Teachers’ Pension Plan
Are CEOs Paid for Performance? -‐ 20
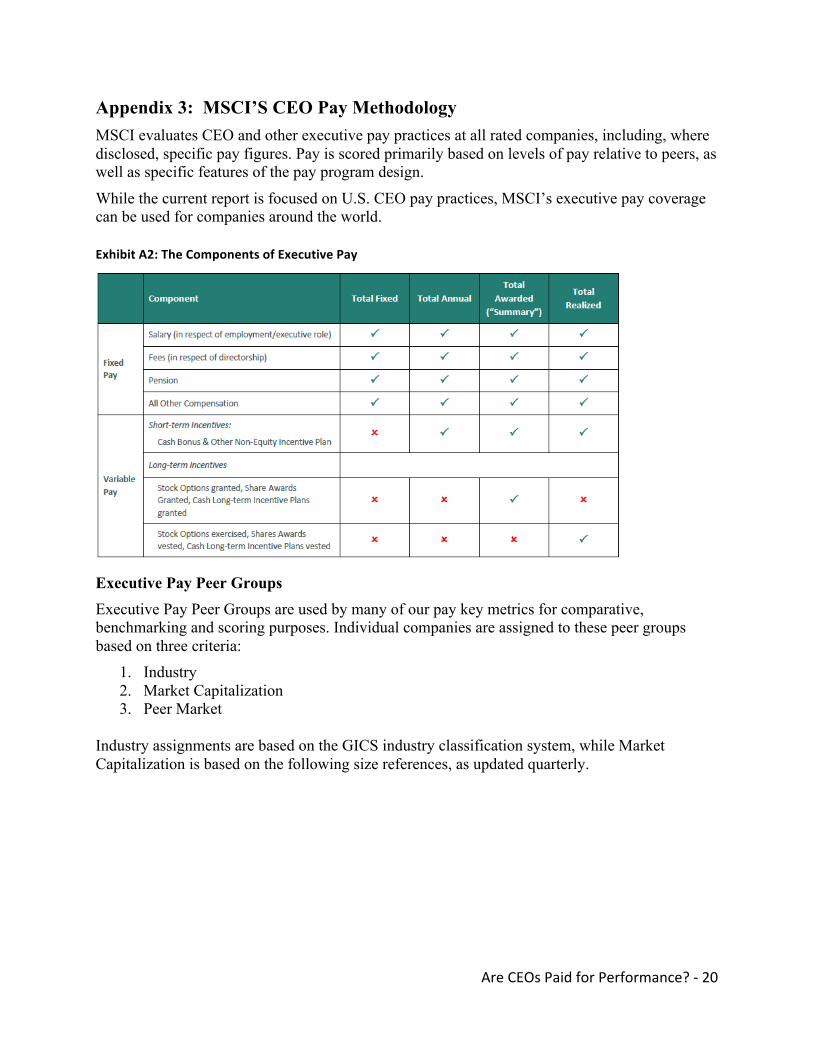
Appendix 3: MSCI’S CEO Pay Methodology MSCI evaluates CEO and other executive pay practices at all rated companies, including, where disclosed, specific pay figures. Pay is scored primarily based on levels of pay relative to peers, as well as specific features of the pay program design.
While the current report is focused on U.S. CEO pay practices, MSCI’s executive pay coverage can be used for companies around the world.
Exhibit A2: The Components of Executive Pay
Executive Pay Peer Groups Executive Pay Peer Groups are used by many of our pay key metrics for comparative, benchmarking and scoring purposes. Individual companies are assigned to these peer groups based on three criteria:
1. Industry 2. Market Capitalization 3. Peer Market
Industry assignments are based on the GICS industry classification system, while Market Capitalization is based on the following size references, as updated quarterly.
Are CEOs Paid for Performance? -‐ 21
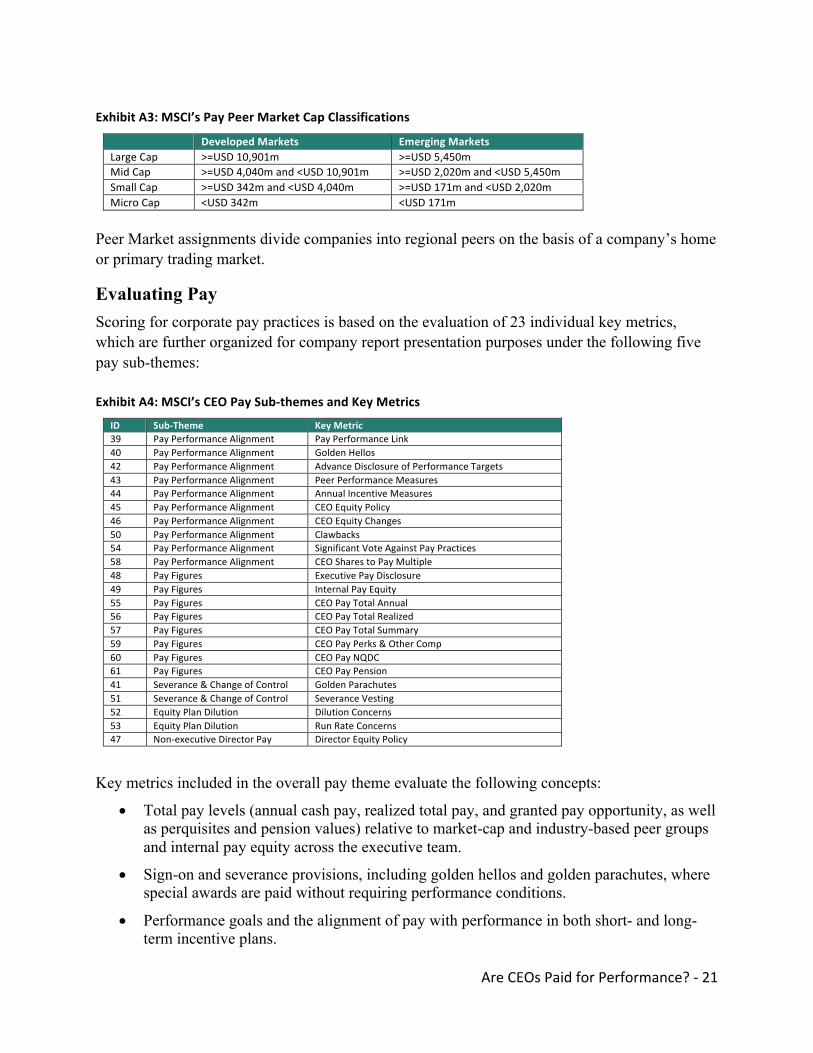
Exhibit A3: MSCI’s Pay Peer Market Cap Classifications
Developed Markets Emerging Markets Large Cap >=USD 10,901m >=USD 5,450m Mid Cap >=USD 4,040m and <USD 10,901m >=USD 2,020m and <USD 5,450m Small Cap >=USD 342m and <USD 4,040m >=USD 171m and <USD 2,020m Micro Cap <USD 342m <USD 171m
Peer Market assignments divide companies into regional peers on the basis of a company’s home or primary trading market.
Evaluating Pay Scoring for corporate pay practices is based on the evaluation of 23 individual key metrics, which are further organized for company report presentation purposes under the following five pay sub-themes:
Exhibit A4: MSCI’s CEO Pay Sub-‐themes and Key Metrics
ID Sub-‐Theme Key Metric 39 Pay Performance Alignment Pay Performance Link 40 Pay Performance Alignment Golden Hellos 42 Pay Performance Alignment Advance Disclosure of Performance Targets 43 Pay Performance Alignment Peer Performance Measures 44 Pay Performance Alignment Annual Incentive Measures 45 Pay Performance Alignment CEO Equity Policy 46 Pay Performance Alignment CEO Equity Changes 50 Pay Performance Alignment Clawbacks 54 Pay Performance Alignment Significant Vote Against Pay Practices 58 Pay Performance Alignment CEO Shares to Pay Multiple 48 Pay Figures Executive Pay Disclosure 49 Pay Figures Internal Pay Equity 55 Pay Figures CEO Pay Total Annual 56 Pay Figures CEO Pay Total Realized 57 Pay Figures CEO Pay Total Summary 59 Pay Figures CEO Pay Perks & Other Comp 60 Pay Figures CEO Pay NQDC 61 Pay Figures CEO Pay Pension 41 Severance & Change of Control Golden Parachutes 51 Severance & Change of Control Severance Vesting 52 Equity Plan Dilution Dilution Concerns 53 Equity Plan Dilution Run Rate Concerns 47 Non-‐executive Director Pay Director Equity Policy
Key metrics included in the overall pay theme evaluate the following concepts:
• Total pay levels (annual cash pay, realized total pay, and granted pay opportunity, as well as perquisites and pension values) relative to market-cap and industry-based peer groups and internal pay equity across the executive team.
• Sign-on and severance provisions, including golden hellos and golden parachutes, where special awards are paid without requiring performance conditions.
• Performance goals and the alignment of pay with performance in both short- and long-term incentive plans.

Are CEOs Paid for Performance? -‐ 22
• Policies and practices regarding the use of equity, including dilution and run rate concerns, as well as policies regarding CEO and director equity ownership.
Reflecting the varying levels of disclosure across markets, pay rankings are also designed to prevent companies with poor disclosure from being rewarded.

Are CEOs Paid for Performance? -‐ 23
This document and all of the information contained in it, including without limitation all text, data, graphs, charts (collectively, the “Information”) is the property of MSCI Inc. or its subsidiaries (collectively, “MSCI”), or MSCI’s licensors, direct or indirect suppliers or any third party involved in making or compiling any Information (collectively, with MSCI, the “Information Providers”) and is provided for informational purposes only. The Information may not be modified, reverse-‐engineered, reproduced or redisseminated in whole or in part without prior written permission from MSCI.
The Information may not be used to create derivative works or to verify or correct other data or information. For example (but without limitation), the Information may not be used to create indexes, databases, risk models, analytics, software, or in connection with the issuing, offering, sponsoring, managing or marketing of any securities, portfolios, financial products or other investment vehicles utilizing or based on, linked to, tracking or otherwise derived from the Information or any other MSCI data, information, products or services.
The user of the Information assumes the entire risk of any use it may make or permit to be made of the Information. NONE OF THE INFORMATION PROVIDERS MAKES ANY EXPRESS OR IMPLIED WARRANTIES OR REPRESENTATIONS WITH RESPECT TO THE INFORMATION (OR THE RESULTS TO BE OBTAINED BY THE USE THEREOF), AND TO THE MAXIMUM EXTENT PERMITTED BY APPLICABLE LAW, EACH INFORMATION PROVIDER EXPRESSLY DISCLAIMS ALL IMPLIED WARRANTIES (INCLUDING, WITHOUT LIMITATION, ANY IMPLIED WARRANTIES OF ORIGINALITY, ACCURACY, TIMELINESS, NON-‐INFRINGEMENT, COMPLETENESS, MERCHANTABILITY AND FITNESS FOR A PARTICULAR PURPOSE) WITH RESPECT TO ANY OF THE INFORMATION.
Without limiting any of the foregoing and to the maximum extent permitted by applicable law, in no event shall any Information Provider have any liability regarding any of the Information for any direct, indirect, special, punitive, consequential (including lost profits) or any other damages even if notified of the possibility of such damages. The foregoing shall not exclude or limit any liability that may not by applicable law be excluded or limited, including without limitation (as applicable), any liability for death or personal injury to the extent that such injury results from the negligence or willful default of itself, its servants, agents or sub-‐contractors.
Information containing any historical information, data or analysis should not be taken as an indication or guarantee of any future performance, analysis, forecast or prediction. Past performance does not guarantee future results.
The Information should not be relied on and is not a substitute for the skill, judgment and experience of the user, its management, employees, advisors and/or clients when making investment and other business decisions. All Information is impersonal and not tailored to the needs of any person, entity or group of persons.
None of the Information constitutes an offer to sell (or a solicitation of an offer to buy), any security, financial product or other investment vehicle or any trading strategy.
It is not possible to invest directly in an index. Exposure to an asset class or trading strategy or other category represented by an index is only available through third party investable instruments (if any) based on that index. MSCI does not issue, sponsor, endorse, market, offer, review or otherwise express any opinion regarding any fund, ETF, derivative or other security, investment, financial product or trading strategy that is based on, linked to or seeks to provide an investment return related to the performance of any MSCI index (collectively, “Index Linked Investments”). MSCI makes no assurance that any Index Linked Investments will accurately track index performance or provide positive investment returns. MSCI Inc. is not an investment adviser or fiduciary and MSCI makes no representation regarding the advisability of investing in any Index Linked Investments.
Index returns do not represent the results of actual trading of investible assets/securities. MSCI maintains and calculates indexes, but does not manage actual assets. Index returns do not reflect payment of any sales charges or fees an investor may pay to purchase the securities underlying the index or Index Linked Investments. The imposition of these fees and charges would cause the performance of an Index Linked Investment to be different than the MSCI index performance.
The Information may contain back tested data. Back-‐tested performance is not actual performance, but is hypothetical. There are frequently material differences between back tested performance results and actual results subsequently achieved by any investment strategy.
Constituents of MSCI equity indexes are listed companies, which are included in or excluded from the indexes according to the application of the relevant index methodologies. Accordingly, constituents in MSCI equity indexes may include MSCI Inc., clients of MSCI or suppliers to MSCI. Inclusion of a security within an MSCI index is not a recommendation by MSCI to buy, sell, or hold such security, nor is it considered to be investment advice.
Data and information produced by various affiliates of MSCI Inc., including MSCI ESG Research Inc. and Barra LLC, may be used in calculating certain MSCI indexes. More information can be found in the relevant index methodologies on www.msci.com.
MSCI receives compensation in connection with licensing its indexes to third parties. MSCI Inc.’s revenue includes fees based on assets in Index Linked Investments. Information can be found in MSCI Inc.’s company filings on the Investor Relations section of www.msci.com.
MSCI ESG Research Inc. is a Registered Investment Adviser under the Investment Advisers Act of 1940 and a subsidiary of MSCI Inc. Except with respect to any applicable products or services from MSCI ESG Research, neither MSCI nor any of its products or services recommends, endorses, approves or otherwise expresses any opinion regarding any issuer, securities, financial products or instruments or trading strategies and MSCI’s products or services are not intended to constitute investment advice or a recommendation to make (or refrain from making) any kind of investment decision and may not be relied on as such. Issuers mentioned or included in any MSCI ESG Research materials may include MSCI Inc., clients of MSCI or suppliers to MSCI, and may also purchase research or other products or services from MSCI ESG Research. MSCI ESG Research materials, including materials utilized in any MSCI ESG Indexes or other products, have not been submitted to, nor received approval from, the United States Securities and Exchange Commission or any other regulatory body.
Any use of or access to products, services or information of MSCI requires a license from MSCI. MSCI, Barra, RiskMetrics, IPD, FEA, InvestorForce, and other MSCI brands and product names are the trademarks, service marks, or registered trademarks of MSCI or its subsidiaries in the United States and other jurisdictions. The Global Industry Classification Standard (GICS) was developed by and is the exclusive property of MSCI and Standard & Poor’s. “Global Industry Classification Standard (GICS)” is a service mark of MSCI and Standard & Poor’s.
NOTICE AND DISCLAIMER