IJESRT /Archives-2015/July-2015/71_FINITE... · FINITE ELEMENT ANALYSIS AND FATIGUE ANALYSIS OF...
12
[Hasan*, 4.(7): July, 2015] ISSN: 2277-9655 (I2OR), Publication Impact Factor: 3.785 http: // www.ijesrt.com © International Journal of Engineering Sciences & Research Technology [523] IJESRT INTERNATIONAL JOURNAL OF ENGINEERING SCIENCES & RESEARCH TECHNOLOGY FINITE ELEMENT ANALYSIS AND FATIGUE ANALYSIS OF SPUR GEAR UNDER RANDOM LOADING Shaik Gulam Abul Hasan*, Ganoju Sravan Kumar, Syeda Saniya Fatima * Assistant professor,Mehanical department, vidya jyothi institute of technology,c.b.post.aziz nagar. Assistant professor,Mehanical department, MGIT,c.b.post.aziz nagar. Assistant professor,Mehanical department, vidya jyothi institute of technology,c.b.post.aziz nagar. ABSTRACT Every component or structure is designed based on factor of safety. Which means the component should not fail below the design load. But in actual arena it is not so. There is a need for an analysis which predicts the life of the component. This requirement is satisfied by Fatigue analysis. It takes all types of loads i.e., static loads, random loads varying with time and gives life of the component as output. Present analysis is one such analysis of carrying fatigue test on spur gear using software package ANSYS.The gear fitted in the gearbox of armored tracked vehicle is vulnerable to considerable fatigue damage over its life period due to the dynamic excitations caused by the terrain undulations, the rotating wheel and track assemblies. For this purpose, initially static analysis of the model was carried out to validate the model and the boundary conditions correctness. Further Modal analysis is carried out to determine the dynamic characteristics of the gear model. The present work deals with the calculation of static and dynamic analysis, and fatigue life estimation of test gear, which is contacting master gear and assuming loading on the gear is random or constant amplitude by Finite Element package ANSYS. Initially gear system is modeled in CATIA V5 later it is imported into ANSYS for further analysis. KEYWORDS: safety, ansys, catia v5, Fatigue analysis. INTRODUCTION A gear more correctly a gear wheel is a rotating machine part having cut teeth, or cogs, which mesh with another toothed part in order to transmit torque. Two or more gears working in tandem are called a transmission and can produce a mechanical advantage through a gear ratio and thus may be considered a simple machine. Geared devices can change the speed, magnitude, and direction of a power source. The most common situation is for a gear to mesh with another gear. However a gear can also mesh a non-rotating toothed part, called a rack, thereby producing translation instead of rotation. The gears in a transmission are analogous to the wheels in a pulley. An advantage of gears is that the teeth of a gear prevent slipping. When two gears of unequal number of teeth are combined a mechanical advantage is produced, with both the rotational speeds and the torques of the two gears differing in a simple relationship. In transmissions which offer multiple gear ratios, such as bicycles and cars, the term gear, as in first gear, refers to a gear ratio rather than an actual physical gear. The term is used to describe similar devices even when gear ratio is continuous rather than discrete, or when the device does not actually contain any gears, as in a continuously variable transmission.Gears are machine elements that transmit motion by means of successively engaging teeth. The gear teeth act like small levers. The four major failure modes in gear systems are tooth bending fatigue, contact fatigue, surface wear and scoring. Two kinds of teeth damage can occur on gears under repeated loading due to fatigue; namely the pitting of gear teeth flanks and tooth breakage in the tooth root. Tooth breakage is clearly the worst damage case, since the gear could have seriously hampered operating condition or even be destroyed. Because of this, the stress in the tooth should always be carefully studied in all practical gear application. The fatigue process leading to tooth breakage is divided into crack initiation and crack propagation period. However, the crack initiation period generally account for the most of service life, especially in high cycle fatigue.
Transcript of IJESRT /Archives-2015/July-2015/71_FINITE... · FINITE ELEMENT ANALYSIS AND FATIGUE ANALYSIS OF...
[Hasan*, 4.(7): July, 2015] ISSN: 2277-9655
(I2OR), Publication Impact Factor: 3.785
http: // www.ijesrt.com © International Journal of Engineering Sciences & Research Technology
[523]
IJESRT INTERNATIONAL JOURNAL OF ENGINEERING SCIENCES & RESEARCH
TECHNOLOGY
FINITE ELEMENT ANALYSIS AND FATIGUE ANALYSIS OF SPUR GEAR UNDER
RANDOM LOADING Shaik Gulam Abul Hasan*, Ganoju Sravan Kumar, Syeda Saniya Fatima
* Assistant professor,Mehanical department, vidya jyothi institute of technology,c.b.post.aziz nagar.
Assistant professor,Mehanical department, MGIT,c.b.post.aziz nagar.
Assistant professor,Mehanical department, vidya jyothi institute of technology,c.b.post.aziz nagar.
ABSTRACT Every component or structure is designed based on factor of safety. Which means the component should not fail below
the design load. But in actual arena it is not so. There is a need for an analysis which predicts the life of the component.
This requirement is satisfied by Fatigue analysis. It takes all types of loads i.e., static loads, random loads varying with
time and gives life of the component as output. Present analysis is one such analysis of carrying fatigue test on spur
gear using software package ANSYS.The gear fitted in the gearbox of armored tracked vehicle is vulnerable to
considerable fatigue damage over its life period due to the dynamic excitations caused by the terrain undulations, the
rotating wheel and track assemblies. For this purpose, initially static analysis of the model was carried out to validate
the model and the boundary conditions correctness. Further Modal analysis is carried out to determine the dynamic
characteristics of the gear model. The present work deals with the calculation of static and dynamic analysis, and
fatigue life estimation of test gear, which is contacting master gear and assuming loading on the gear is random or
constant amplitude by Finite Element package ANSYS. Initially gear system is modeled in CATIA V5 later it is
imported into ANSYS for further analysis.
KEYWORDS: safety, ansys, catia v5, Fatigue analysis.
INTRODUCTIONA gear more correctly a gear wheel is a rotating machine part having cut teeth, or cogs, which mesh with another
toothed part in order to transmit torque. Two or more gears working in tandem are called a transmission and can
produce a mechanical advantage through a gear ratio and thus may be considered a simple machine. Geared devices
can change the speed, magnitude, and direction of a power source. The most common situation is for a gear to mesh
with another gear. However a gear can also mesh a non-rotating toothed part, called a rack, thereby producing
translation instead of rotation. The gears in a transmission are analogous to the wheels in a pulley. An advantage of
gears is that the teeth of a gear prevent slipping. When two gears of unequal number of teeth are combined a
mechanical advantage is produced, with both the rotational speeds and the torques of the two gears differing in a
simple relationship.
In transmissions which offer multiple gear ratios, such as bicycles and cars, the term gear, as in first gear, refers to a
gear ratio rather than an actual physical gear. The term is used to describe similar devices even when gear ratio is
continuous rather than discrete, or when the device does not actually contain any gears, as in a continuously variable
transmission.Gears are machine elements that transmit motion by means of successively engaging teeth. The gear
teeth act like small levers.
The four major failure modes in gear systems are tooth bending fatigue, contact fatigue, surface wear and scoring.
Two kinds of teeth damage can occur on gears under repeated loading due to fatigue; namely the pitting of gear teeth
flanks and tooth breakage in the tooth root. Tooth breakage is clearly the worst damage case, since the gear could have
seriously hampered operating condition or even be destroyed. Because of this, the stress in the tooth should always be
carefully studied in all practical gear application. The fatigue process leading to tooth breakage is divided into crack
initiation and crack propagation period. However, the crack initiation period generally account for the most of service
life, especially in high cycle fatigue.

[Hasan*, 4.(7): July, 2015] ISSN: 2277-9655
(I2OR), Publication Impact Factor: 3.785
http: // www.ijesrt.com © International Journal of Engineering Sciences & Research Technology
[524]
The initial crack can be formed due to various reasons. The most common reasons are short-term overload, material
defects, defects due to mechanical or thermal treatment and material fatigue. The initial crack then propagates under
impulsive loading until some critical length is reached, when a complete tooth breakage occurs. The service life of a
gear with a crack in the tooth root can be determined experimentally or numerically (e.g. with finite element method).
The fatigue life of components subjected to sinusoidal loading can be estimated by using cumulative damage theories.
Their extension to random load fatigue, through straightforward, may not be very accurate owing to inherent scatter
exhibition by the fatigue phenomena. Due to the complexity in geometry and loading on the structure, the finite
element method is preferably adopted.
PROBLEM STATEMENT The present work deals with the calculation of static and dynamic analysis, and fatigue life estimation of test gear,
which is contacting master gear and assuming loading on the gear is random or constant amplitude by Finite Element
package ANSYS.
AIMS AND OBJECTIVES
1. PSD response at vulnerable locations.
2. To carry out fatigue analysis in order to determine the fatigue life of the test gear with help of above stress
PSD responses at vulnerable locations. To carry out the detail finite element analysis like static analysis to
validate the model and boundary conditions correctness, Modal analysis to determine dynamic characteristics
of the model and transient dynamic analysis to determine dynamic load factor.
3. Simulation of loads of deterministic and non- deterministic nature causing fluctuations bending stresses in
gear.
4. To carry out dynamic analysis of gear both under random loading and constant amplitude loading conditions
and obtain the stress
The master gear is in contact with the test gear and master gear is receiving power from the gearbox, which is shown
below, and it has been taken from the published paper “Bending fatigue testing of gear teeth under random loading”,
[1].
Fig: 1 Master gear meshed with test gear
[Hasan*, 4.(7): July, 2015] ISSN: 2277-9655
(I2OR), Publication Impact Factor: 3.785
http: // www.ijesrt.com © International Journal of Engineering Sciences & Research Technology
[525]
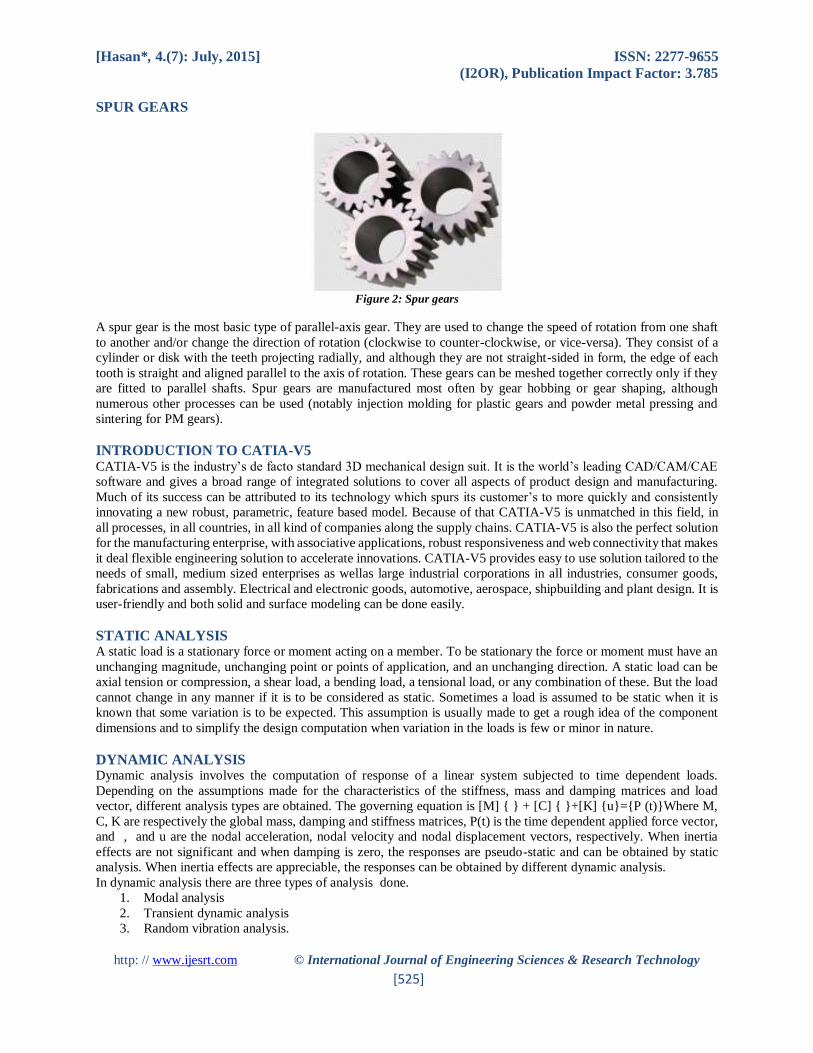
SPUR GEARS
Figure 2: Spur gears
A spur gear is the most basic type of parallel-axis gear. They are used to change the speed of rotation from one shaft
to another and/or change the direction of rotation (clockwise to counter-clockwise, or vice-versa). They consist of a
cylinder or disk with the teeth projecting radially, and although they are not straight-sided in form, the edge of each
tooth is straight and aligned parallel to the axis of rotation. These gears can be meshed together correctly only if they
are fitted to parallel shafts. Spur gears are manufactured most often by gear hobbing or gear shaping, although
numerous other processes can be used (notably injection molding for plastic gears and powder metal pressing and
sintering for PM gears).
INTRODUCTION TO CATIA-V5
CATIA-V5 is the industry’s de facto standard 3D mechanical design suit. It is the world’s leading CAD/CAM/CAE
software and gives a broad range of integrated solutions to cover all aspects of product design and manufacturing.
Much of its success can be attributed to its technology which spurs its customer’s to more quickly and consistently
innovating a new robust, parametric, feature based model. Because of that CATIA-V5 is unmatched in this field, in
all processes, in all countries, in all kind of companies along the supply chains. CATIA-V5 is also the perfect solution
for the manufacturing enterprise, with associative applications, robust responsiveness and web connectivity that makes
it deal flexible engineering solution to accelerate innovations. CATIA-V5 provides easy to use solution tailored to the
needs of small, medium sized enterprises as wellas large industrial corporations in all industries, consumer goods,
fabrications and assembly. Electrical and electronic goods, automotive, aerospace, shipbuilding and plant design. It is
user-friendly and both solid and surface modeling can be done easily.
STATIC ANALYSIS A static load is a stationary force or moment acting on a member. To be stationary the force or moment must have an
unchanging magnitude, unchanging point or points of application, and an unchanging direction. A static load can be
axial tension or compression, a shear load, a bending load, a tensional load, or any combination of these. But the load
cannot change in any manner if it is to be considered as static. Sometimes a load is assumed to be static when it is
known that some variation is to be expected. This assumption is usually made to get a rough idea of the component
dimensions and to simplify the design computation when variation in the loads is few or minor in nature.
DYNAMIC ANALYSIS Dynamic analysis involves the computation of response of a linear system subjected to time dependent loads.
Depending on the assumptions made for the characteristics of the stiffness, mass and damping matrices and load
vector, different analysis types are obtained. The governing equation is [M] { } + [C] { }+[K] {u}={P (t)}Where M,
C, K are respectively the global mass, damping and stiffness matrices, P(t) is the time dependent applied force vector,
and , and u are the nodal acceleration, nodal velocity and nodal displacement vectors, respectively. When inertia
effects are not significant and when damping is zero, the responses are pseudo-static and can be obtained by static
analysis. When inertia effects are appreciable, the responses can be obtained by different dynamic analysis.
In dynamic analysis there are three types of analysis done.
1. Modal analysis
2. Transient dynamic analysis
3. Random vibration analysis.
[Hasan*, 4.(7): July, 2015] ISSN: 2277-9655
(I2OR), Publication Impact Factor: 3.785
http: // www.ijesrt.com © International Journal of Engineering Sciences & Research Technology
[526]
MODAL ANALYSIS
This analysis deals with undamped free vibrations of a structure. Eigen value analysis does not involve the
computation of response due to any loading, but yields the natural frequencies (Eigen values) and the corresponding
mode shapes (Eigen vectors) of the structure when there is no dissipation energy due to damping then the above
equation becomes [M] { } + [K] {u}= A structure with a non-zero initial condition (initial displacement or velocity)
corresponding to any of the mode shapes will exhibit simple harmonic motion at the corresponding natural frequency.
The amplitudes of the free vibrations will depend on the initial conditions, and in the absence of damping, the
vibrations will continue without any decay.
TRANSIENT DYNAMIC ANALYSIS
Transient dynamic analysis may be used to determine the response of structures subjected to arbitrary time-varying
loads. The variation of loads can be represented by piecewise linear curves of time vs. amplitude. The modal response
is evaluated exactly in closed form.
RANDOM VIBRATION ANALYSIS
The data representing a physical random phenomenon cannot be described by an explicit mathematical relationship.
In other words, any given observation will represent only one of many possible results that might have occurred. A
single time history representing a time phenomenon is called sample function or a sample record when observed over
a finite time interval. The collection of all possible sample function that the random phenomenon might have produced
is called a random process or stochastic process. Hence a sample record of data for a random physical phenomenon
may be thought of as one physical realization of a random process.
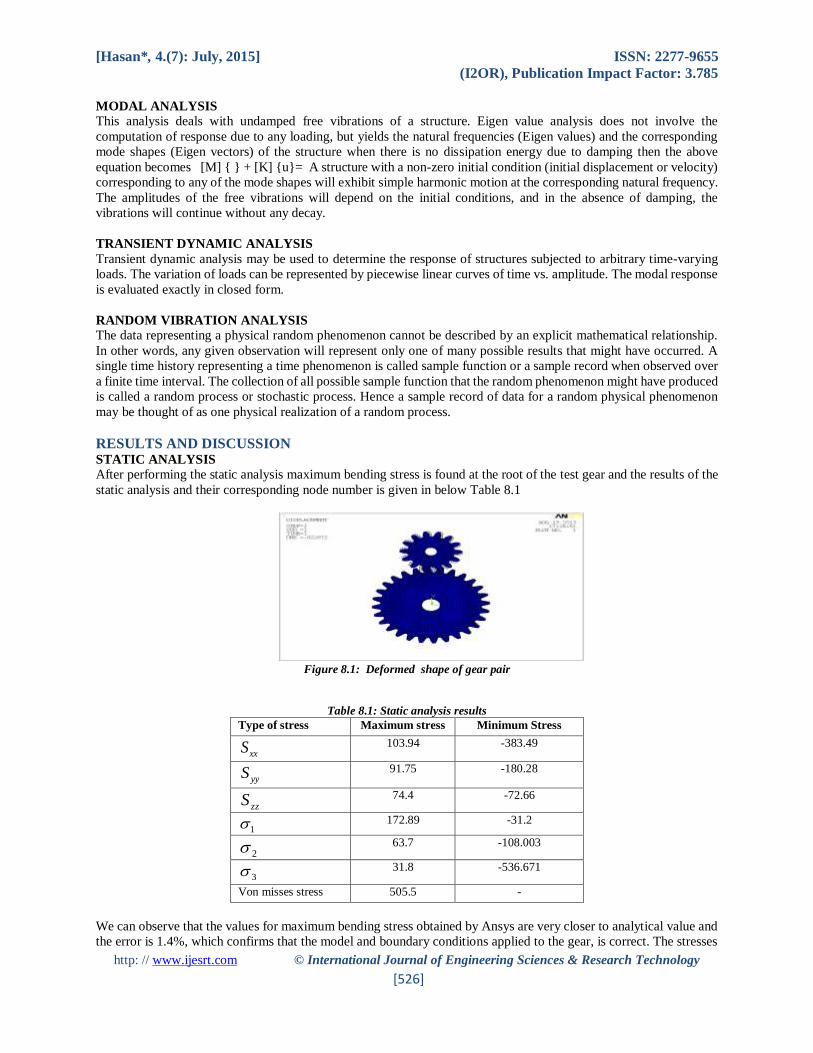
RESULTS AND DISCUSSION
STATIC ANALYSIS
After performing the static analysis maximum bending stress is found at the root of the test gear and the results of the
static analysis and their corresponding node number is given in below Table 8.1
Figure 8.1: Deformed shape of gear pair
Table 8.1: Static analysis results
Type of stress Maximum stress Minimum Stress
xxS 103.94 -383.49
yyS 91.75 -180.28
zzS
74.4 -72.66
1 172.89 -31.2
2 63.7 -108.003
3 31.8 -536.671
Von misses stress 505.5 -
We can observe that the values for maximum bending stress obtained by Ansys are very closer to analytical value and
the error is 1.4%, which confirms that the model and boundary conditions applied to the gear, is correct. The stresses
[Hasan*, 4.(7): July, 2015] ISSN: 2277-9655
(I2OR), Publication Impact Factor: 3.785
http: // www.ijesrt.com © International Journal of Engineering Sciences & Research Technology
[527]
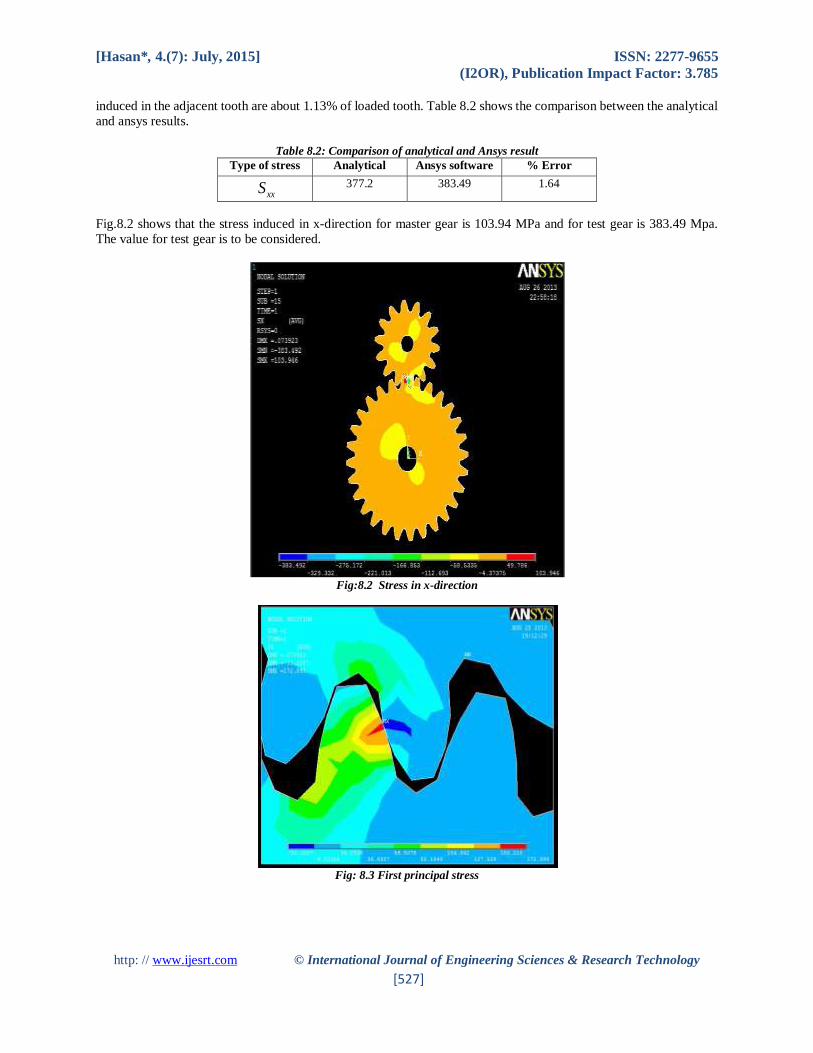
induced in the adjacent tooth are about 1.13% of loaded tooth. Table 8.2 shows the comparison between the analytical
and ansys results.
Table 8.2: Comparison of analytical and Ansys result
Type of stress Analytical Ansys software % Error
xxS 377.2 383.49 1.64
Fig.8.2 shows that the stress induced in x-direction for master gear is 103.94 MPa and for test gear is 383.49 Mpa.
The value for test gear is to be considered.
Fig:8.2 Stress in x-direction
Fig: 8.3 First principal stress
[Hasan*, 4.(7): July, 2015] ISSN: 2277-9655
(I2OR), Publication Impact Factor: 3.785
http: // www.ijesrt.com © International Journal of Engineering Sciences & Research Technology
[528]
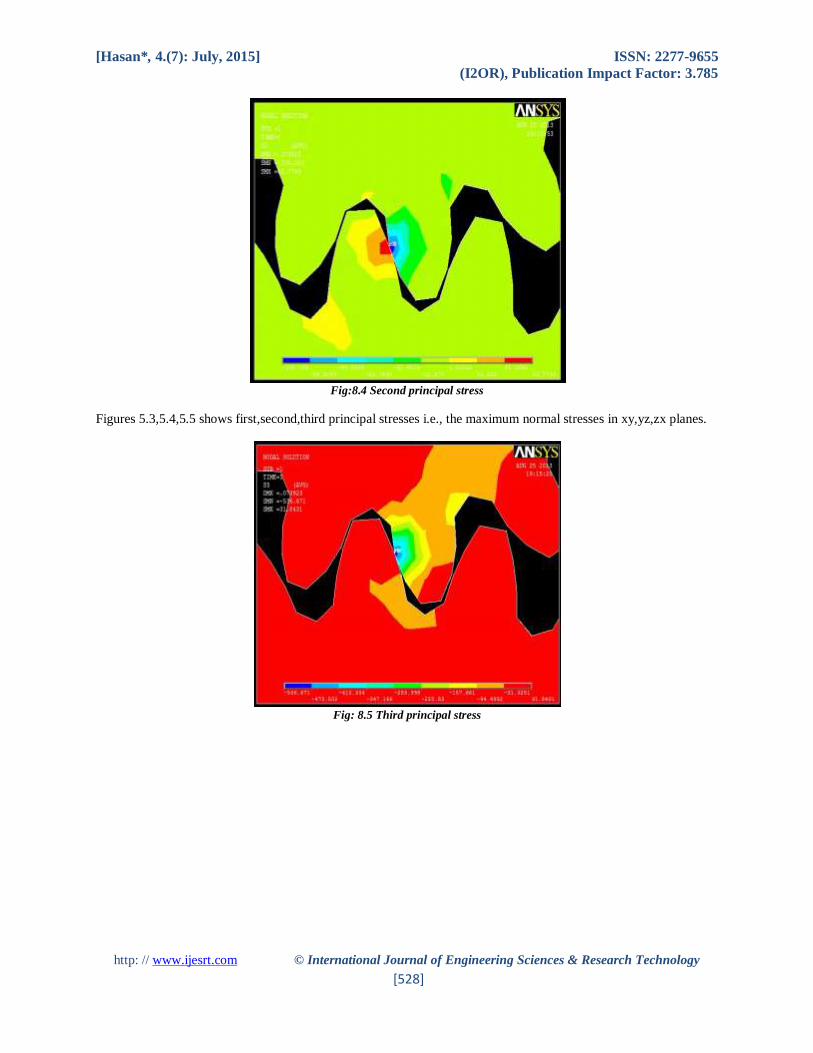
Fig:8.4 Second principal stress
Figures 5.3,5.4,5.5 shows first,second,third principal stresses i.e., the maximum normal stresses in xy,yz,zx planes.
Fig: 8.5 Third principal stress
[Hasan*, 4.(7): July, 2015] ISSN: 2277-9655
(I2OR), Publication Impact Factor: 3.785
http: // www.ijesrt.com © International Journal of Engineering Sciences & Research Technology
[529]
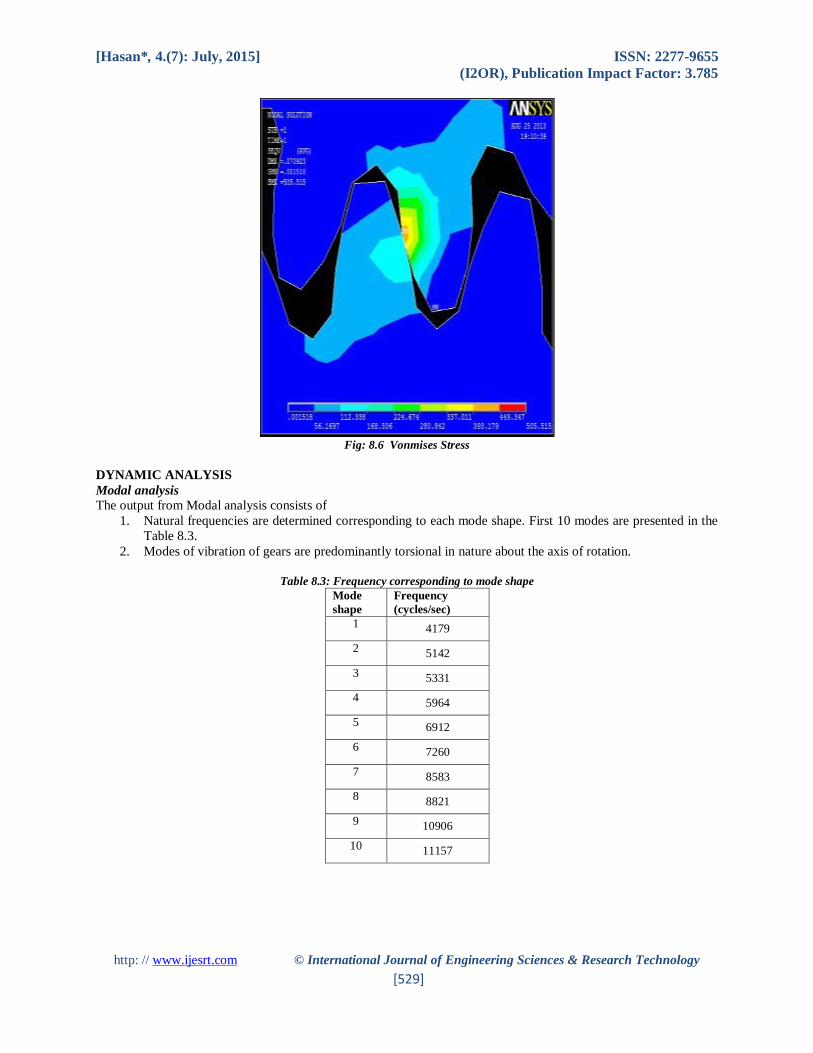
Fig: 8.6 Vonmises Stress
DYNAMIC ANALYSIS
Modal analysis The output from Modal analysis consists of
1. Natural frequencies are determined corresponding to each mode shape. First 10 modes are presented in the
Table 8.3.
2. Modes of vibration of gears are predominantly torsional in nature about the axis of rotation.
Table 8.3: Frequency corresponding to mode shape
Mode
shape
Frequency
(cycles/sec)
1 4179
2 5142
3 5331
4 5964
5 6912
6 7260
7 8583
8 8821
9 10906
10 11157

[Hasan*, 4.(7): July, 2015] ISSN: 2277-9655
(I2OR), Publication Impact Factor: 3.785
http: // www.ijesrt.com © International Journal of Engineering Sciences & Research Technology
[530]
Fig: 8.7 Mode shape 1 and mode shape 2
Fig 8.8 Mode shapes 3,4,5,6,7,8
[Hasan*, 4.(7): July, 2015] ISSN: 2277-9655
(I2OR), Publication Impact Factor: 3.785
http: // www.ijesrt.com © International Journal of Engineering Sciences & Research Technology
[531]
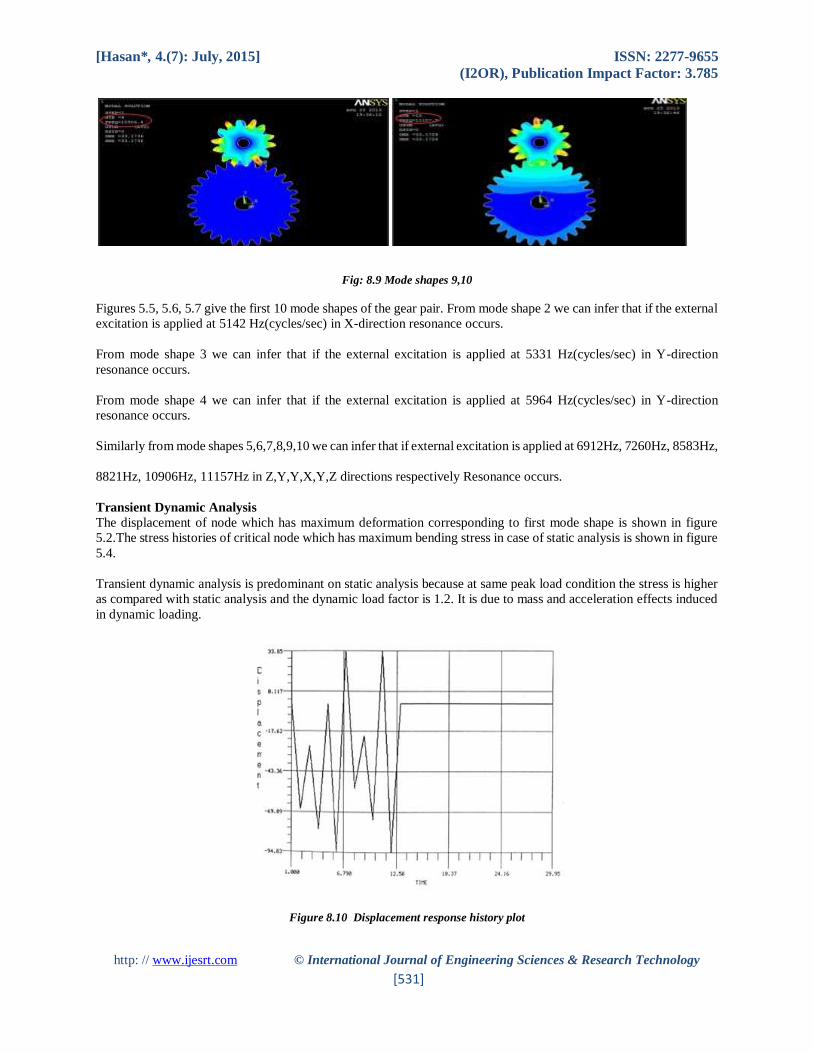
Fig: 8.9 Mode shapes 9,10
Figures 5.5, 5.6, 5.7 give the first 10 mode shapes of the gear pair. From mode shape 2 we can infer that if the external
excitation is applied at 5142 Hz(cycles/sec) in X-direction resonance occurs.
From mode shape 3 we can infer that if the external excitation is applied at 5331 Hz(cycles/sec) in Y-direction
resonance occurs.
From mode shape 4 we can infer that if the external excitation is applied at 5964 Hz(cycles/sec) in Y-direction
resonance occurs.
Similarly from mode shapes 5,6,7,8,9,10 we can infer that if external excitation is applied at 6912Hz, 7260Hz, 8583Hz,
8821Hz, 10906Hz, 11157Hz in Z,Y,Y,X,Y,Z directions respectively Resonance occurs.
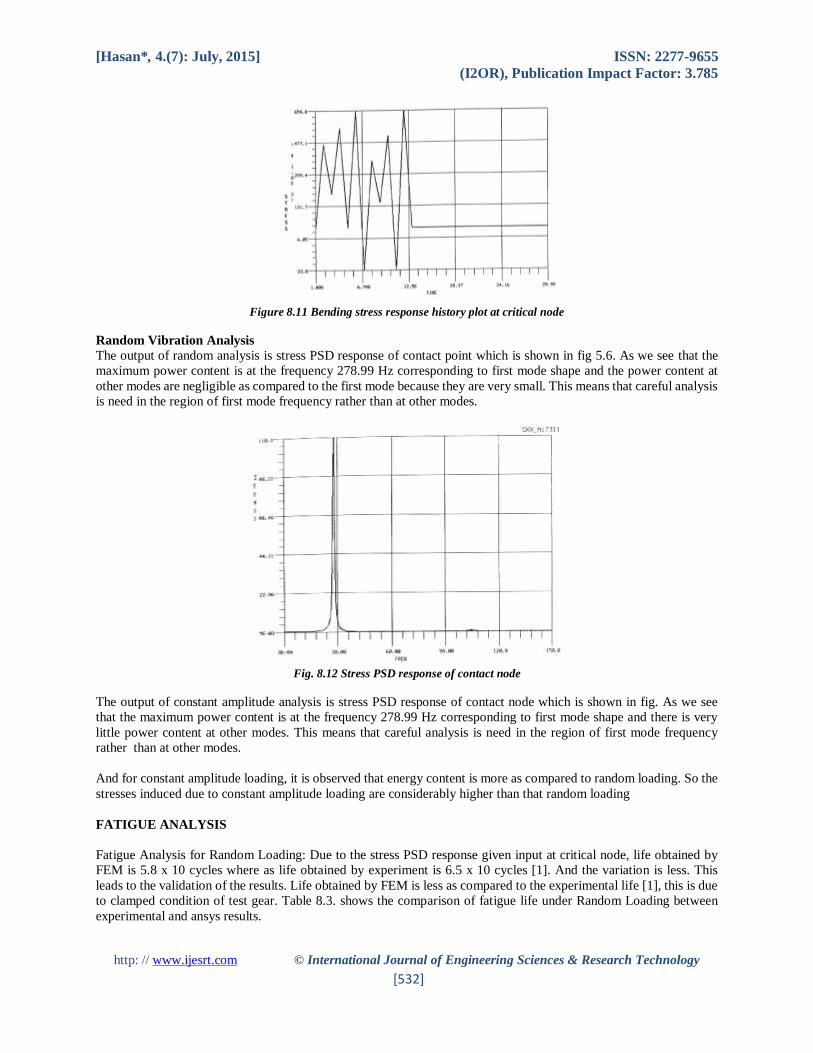
Transient Dynamic Analysis
The displacement of node which has maximum deformation corresponding to first mode shape is shown in figure
5.2.The stress histories of critical node which has maximum bending stress in case of static analysis is shown in figure
5.4.
Transient dynamic analysis is predominant on static analysis because at same peak load condition the stress is higher
as compared with static analysis and the dynamic load factor is 1.2. It is due to mass and acceleration effects induced
in dynamic loading.
Figure 8.10 Displacement response history plot
[Hasan*, 4.(7): July, 2015] ISSN: 2277-9655
(I2OR), Publication Impact Factor: 3.785
http: // www.ijesrt.com © International Journal of Engineering Sciences & Research Technology
[532]
Figure 8.11 Bending stress response history plot at critical node
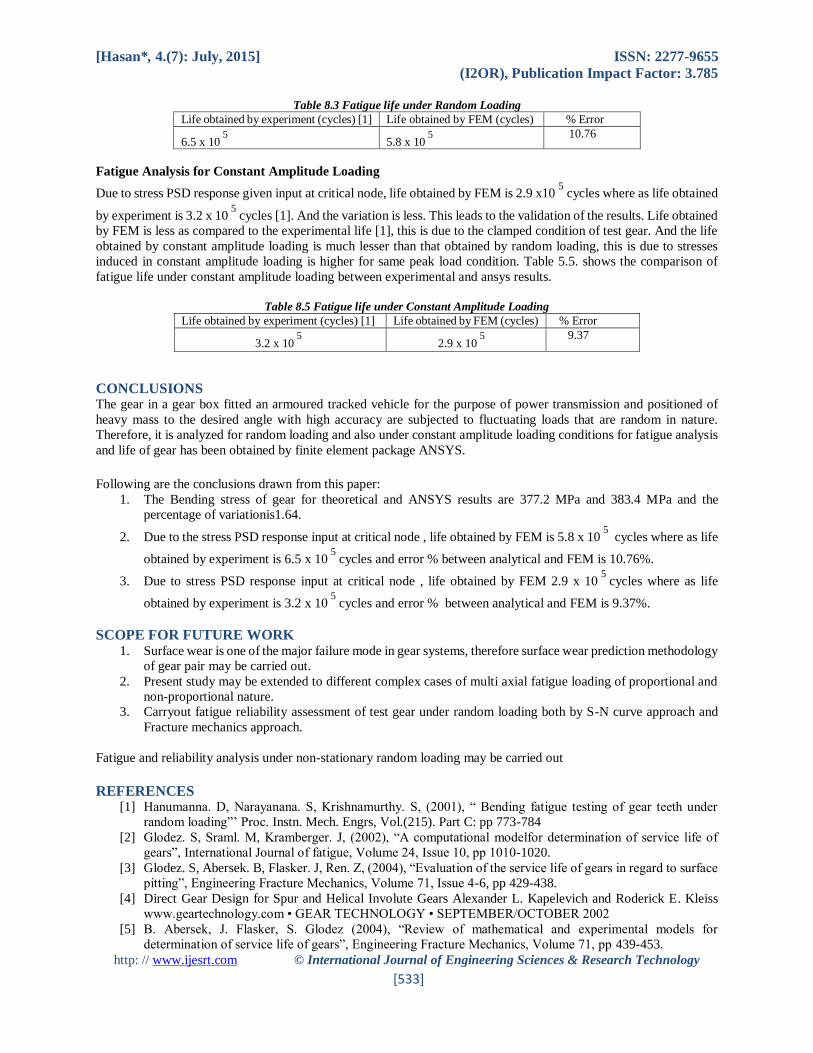
Random Vibration Analysis
The output of random analysis is stress PSD response of contact point which is shown in fig 5.6. As we see that the
maximum power content is at the frequency 278.99 Hz corresponding to first mode shape and the power content at
other modes are negligible as compared to the first mode because they are very small. This means that careful analysis
is need in the region of first mode frequency rather than at other modes.
Fig. 8.12 Stress PSD response of contact node
The output of constant amplitude analysis is stress PSD response of contact node which is shown in fig. As we see
that the maximum power content is at the frequency 278.99 Hz corresponding to first mode shape and there is very
little power content at other modes. This means that careful analysis is need in the region of first mode frequency
rather than at other modes.
And for constant amplitude loading, it is observed that energy content is more as compared to random loading. So the
stresses induced due to constant amplitude loading are considerably higher than that random loading
FATIGUE ANALYSIS
Fatigue Analysis for Random Loading: Due to the stress PSD response given input at critical node, life obtained by
FEM is 5.8 x 10 cycles where as life obtained by experiment is 6.5 x 10 cycles [1]. And the variation is less. This
leads to the validation of the results. Life obtained by FEM is less as compared to the experimental life [1], this is due
to clamped condition of test gear. Table 8.3. shows the comparison of fatigue life under Random Loading between
experimental and ansys results.
[Hasan*, 4.(7): July, 2015] ISSN: 2277-9655
(I2OR), Publication Impact Factor: 3.785
http: // www.ijesrt.com © International Journal of Engineering Sciences & Research Technology
[533]
Table 8.3 Fatigue life under Random Loading
Life obtained by experiment (cycles) [1] Life obtained by FEM (cycles) % Error
6.5 x 10⁵
5.8 x 10⁵
10.76
Fatigue Analysis for Constant Amplitude Loading
Due to stress PSD response given input at critical node, life obtained by FEM is 2.9 x10⁵
cycles where as life obtained
by experiment is 3.2 x 10⁵
cycles [1]. And the variation is less. This leads to the validation of the results. Life obtained
by FEM is less as compared to the experimental life [1], this is due to the clamped condition of test gear. And the life
obtained by constant amplitude loading is much lesser than that obtained by random loading, this is due to stresses
induced in constant amplitude loading is higher for same peak load condition. Table 5.5. shows the comparison of
fatigue life under constant amplitude loading between experimental and ansys results.
Table 8.5 Fatigue life under Constant Amplitude Loading
Life obtained by experiment (cycles) [1] Life obtained by FEM (cycles) % Error
3.2 x 10⁵
2.9 x 10⁵
9.37
CONCLUSIONS The gear in a gear box fitted an armoured tracked vehicle for the purpose of power transmission and positioned of
heavy mass to the desired angle with high accuracy are subjected to fluctuating loads that are random in nature.
Therefore, it is analyzed for random loading and also under constant amplitude loading conditions for fatigue analysis
and life of gear has been obtained by finite element package ANSYS.
Following are the conclusions drawn from this paper:
1. The Bending stress of gear for theoretical and ANSYS results are 377.2 MPa and 383.4 MPa and the
percentage of variationis1.64.
2. Due to the stress PSD response input at critical node , life obtained by FEM is 5.8 x 10⁵
cycles where as life
obtained by experiment is 6.5 x 10⁵
cycles and error % between analytical and FEM is 10.76%.
3. Due to stress PSD response input at critical node , life obtained by FEM 2.9 x 10⁵
cycles where as life
obtained by experiment is 3.2 x 10⁵
cycles and error % between analytical and FEM is 9.37%.
SCOPE FOR FUTURE WORK 1. Surface wear is one of the major failure mode in gear systems, therefore surface wear prediction methodology
of gear pair may be carried out.
2. Present study may be extended to different complex cases of multi axial fatigue loading of proportional and
non-proportional nature.
3. Carryout fatigue reliability assessment of test gear under random loading both by S-N curve approach and
Fracture mechanics approach.
Fatigue and reliability analysis under non-stationary random loading may be carried out
REFERENCES [1] Hanumanna. D, Narayanana. S, Krishnamurthy. S, (2001), “ Bending fatigue testing of gear teeth under
random loading”’ Proc. Instn. Mech. Engrs, Vol.(215). Part C: pp 773-784
[2] Glodez. S, Sraml. M, Kramberger. J, (2002), “A computational modelfor determination of service life of
gears”, International Journal of fatigue, Volume 24, Issue 10, pp 1010-1020.
[3] Glodez. S, Abersek. B, Flasker. J, Ren. Z, (2004), “Evaluation of the service life of gears in regard to surface
pitting”, Engineering Fracture Mechanics, Volume 71, Issue 4-6, pp 429-438.
[4] Direct Gear Design for Spur and Helical Involute Gears Alexander L. Kapelevich and Roderick E. Kleiss
www.geartechnology.com • GEAR TECHNOLOGY • SEPTEMBER/OCTOBER 2002
[5] B. Abersek, J. Flasker, S. Glodez (2004), “Review of mathematical and experimental models for
determination of service life of gears”, Engineering Fracture Mechanics, Volume 71, pp 439-453.

[Hasan*, 4.(7): July, 2015] ISSN: 2277-9655
(I2OR), Publication Impact Factor: 3.785
http: // www.ijesrt.com © International Journal of Engineering Sciences & Research Technology
[534]
[6] Q.J. Yang (1996), “Fatigue test and reliability of TLP tethers under random loading”, Marine structures,
Volume 14, pp331-352.
[7] Statistical considerations in Fatigue (1996), “ Fatigue and Fracture”, ASM Handbook, Volume 19, pp 295-
302.
[8] Structural life assessment Methods (2001), “ Failure Analysis and Prevention”, ASM Handbook, Volume 11,
pp 225-289.
[9] Julius S. Bendat, Allan G. Piersol (1966), “ Measurement and Analysis of Random Data”, John wiley and
sons, Inc. USA.


![Fatigue Analysis [Compatibility Mode]](https://static.fdocuments.us/doc/165x107/577cc0c81a28aba7119117e8/fatigue-analysis-compatibility-mode.jpg)