Arch. Metall. Mater. 62 (2017), 2B, 1243-1248 - IMIMgrain refinement. In the case of Alloy 690,...
6
Arch. Metall. Mater. 62 (2017), 2B, 1243-1248 DOI: 10.1515/amm-2017-0185 S.-W. KIM* # , T.-Y. AHN*, Y.-S. LIM*, S.-S. HWANG* EFFECT OF LOCAL STRAIN DISTRIBUTION OF COLD-ROLLED ALLOY 690 ON PRIMARY WATER STRESS CORROSION CRACK GROWTH BEHAVIOR This work aims to study the stress corrosion crack growth behavior of cold-rolled Alloy 690 in the primary water of a pres- surized water reactor. Compared with Alloy 600, which shows typical intergranular cracking along high angle grain boundaries, the cold-rolled Alloy 690, with its heterogeneous microstructure, revealed an abnormal crack growth behavior in mixed mode, that is, in transgranular cracking near a banded region, and in intergranular cracking in a matrix region. From local strain distribution analysis based on local mis-orientation, measured along the crack path using the electron back scattered diffraction method, it was suggested that the abnormal behavior was attributable to a heterogeneity of local strain distribution. In the cold-rolled Alloy 690, the stress corrosion crack grew through a highly strained area formed by a prior cold-rolling process in a direction perpendicular to the maximum principal stress applied during a subsequent stress corrosion cracking test. Keywords: Alloy 690, crack growth, electron backscatter diffraction, local strain distribution, stress corrosion cracking 1. Introduction Alloy 690, with high Cr content, has been widely used in recent years as a structural material in pressurized water reac- tors (PWRs) to replace Alloy 600, which revealed susceptibility to stress corrosion cracking (SCC) in operating conditions of PWRs. Over the past few decades, Alloy 690 has been known to be ‘immune’ to SCC in the primary water coolant, as there have been no reports of SCC failures of components made from Alloy 690 in operating PWRs [1]. However, recent laboratory experiments revealed that the alloy is not immune to SCC in the primary water environment, the so-called PWSCC (primary water stress corrosion cracking), when exposed to accelerated test conditions [2,3]. Under a con- stant moderate stress intensity factor (K) in the primary water environment, Alloy 690 generally shows a low crack growth rate (CGR) of less than 1×10 –9 mm/s, which is much lower than that of Alloy 600, which has a CGR of 1×10 –7 mm/s. When Alloy 690 is strain-hardened after welding or cold-working during fabrication or repair process of structural components, the CGR increases to 1×10 –8 mm/s. The strain-hardening has been regarded as the main cause of service failure in the structural components of PWRs, because very high residual stress and plastic strain exceeding the nominal yield point can be induced by welding, cold-working, or surface machining during the fabrication or repair process [4]. Recently, there have been interesting reports that some heats of Alloy 690 having heterogeneous microstructure show abnor- mally high CGR that exceeds 1×10 –7 mm/s after plastic deforma- tion by cold-working [4]. Heterogeneity in the microstructure is often found in wrought alloys when thermo-mechanical energy during hot-forming process was insufficient to achieve uniform grain refinement. In the case of Alloy 690, carbide banding can be found in forged products, that is, a banded microstructure of intragranular carbides within small grains in a matrix of coarse grains in the axial direction of the forged bar. Recent work by Kim et al. [5] sought to use an electron backscatter diffraction (EBSD) method to characterize the local mis-orientation distribu- tion in the cold-rolled Alloy 690 with the carbide banded micro- structure in an effort to understand its PWSCC growth behavior. From experimental findings of previous work, it was speculated that the microstructural heterogeneity of Alloy 690 results in heterogeneous straining on a micro-scale during cold-rolling pro- cess and thus locally accelerates PWSCC growth. However, this speculation was not clearly proved due to a lack of experimental work on strain analysis around the crack path to reveal a cor- relation between the crack path and the local strain distribution. In this respect, this work is aimed at investigating the local strain distribution around the cracking path of PWSCC in the cold-rolled Alloy 690 with heterogeneous microstructure. The EBSD method was used to perform local strain distribution analysis on a cross-section of cracks after the SCC test in the primary water environment. For comparison, the analysis was also carried out for the cold-rolled Alloy 600 with homogeneous microstructure. * NUCLEAR MATERIALS SAFETY RESEARCH DIVISION, KOREA ATOMIC ENERGY RESEARCH INSTITUTE, DAEDEOK-DAERO 989-111, YUSEONG-GU, DAEJEON 34057, KOREA # Corresponding author: [email protected]
Transcript of Arch. Metall. Mater. 62 (2017), 2B, 1243-1248 - IMIMgrain refinement. In the case of Alloy 690,...

Arch. Metall. Mater. 62 (2017), 2B, 1243-1248
DOI: 10.1515/amm-2017-0185
S.-W. KIM*#, T.-Y. AHN*, Y.-S. LIM*, S.-S. HWANG*
EFFECT OF LOCAL STRAIN DISTRIBUTION OF COLD-ROLLED ALLOY 690 ON PRIMARY WATER STRESS CORROSION CRACK GROWTH BEHAVIOR
This work aims to study the stress corrosion crack growth behavior of cold-rolled Alloy 690 in the primary water of a pres-surized water reactor. Compared with Alloy 600, which shows typical intergranular cracking along high angle grain boundaries, the cold-rolled Alloy 690, with its heterogeneous microstructure, revealed an abnormal crack growth behavior in mixed mode, that is, in transgranular cracking near a banded region, and in intergranular cracking in a matrix region. From local strain distribution analysis based on local mis-orientation, measured along the crack path using the electron back scattered diffraction method, it was suggested that the abnormal behavior was attributable to a heterogeneity of local strain distribution. In the cold-rolled Alloy 690, the stress corrosion crack grew through a highly strained area formed by a prior cold-rolling process in a direction perpendicular to the maximum principal stress applied during a subsequent stress corrosion cracking test.
Keywords: Alloy 690, crack growth, electron backscatter diffraction, local strain distribution, stress corrosion cracking
1. Introduction
Alloy 690, with high Cr content, has been widely used in recent years as a structural material in pressurized water reac-tors (PWRs) to replace Alloy 600, which revealed susceptibility to stress corrosion cracking (SCC) in operating conditions of PWRs. Over the past few decades, Alloy 690 has been known to be ‘immune’ to SCC in the primary water coolant, as there have been no reports of SCC failures of components made from Alloy 690 in operating PWRs [1].
However, recent laboratory experiments revealed that the alloy is not immune to SCC in the primary water environment, the so-called PWSCC (primary water stress corrosion cracking), when exposed to accelerated test conditions [2,3]. Under a con-stant moderate stress intensity factor (K) in the primary water environment, Alloy 690 generally shows a low crack growth rate (CGR) of less than 1×10⁻⁹ mm/s, which is much lower than that of Alloy 600, which has a CGR of 1×10⁻⁷ mm/s. When Alloy 690 is strain-hardened after welding or cold-working during fabrication or repair process of structural components, the CGR increases to 1×10⁻⁸ mm/s. The strain-hardening has been regarded as the main cause of service failure in the structural components of PWRs, because very high residual stress and plastic strain exceeding the nominal yield point can be induced by welding, cold-working, or surface machining during the fabrication or repair process [4].
Recently, there have been interesting reports that some heats of Alloy 690 having heterogeneous microstructure show abnor-
mally high CGR that exceeds 1×10⁻⁷ mm/s after plastic deforma-tion by cold-working [4]. Heterogeneity in the microstructure is often found in wrought alloys when thermo-mechanical energy during hot-forming process was insufficient to achieve uniform grain refinement. In the case of Alloy 690, carbide banding can be found in forged products, that is, a banded microstructure of intragranular carbides within small grains in a matrix of coarse grains in the axial direction of the forged bar. Recent work by Kim et al. [5] sought to use an electron backscatter diffraction (EBSD) method to characterize the local mis-orientation distribu-tion in the cold-rolled Alloy 690 with the carbide banded micro-structure in an effort to understand its PWSCC growth behavior. From experimental findings of previous work, it was speculated that the microstructural heterogeneity of Alloy 690 results in heterogeneous straining on a micro-scale during cold-rolling pro-cess and thus locally accelerates PWSCC growth. However, this speculation was not clearly proved due to a lack of experimental work on strain analysis around the crack path to reveal a cor-relation between the crack path and the local strain distribution.
In this respect, this work is aimed at investigating the local strain distribution around the cracking path of PWSCC in the cold-rolled Alloy 690 with heterogeneous microstructure. The EBSD method was used to perform local strain distribution analysis on a cross-section of cracks after the SCC test in the primary water environment. For comparison, the analysis was also carried out for the cold-rolled Alloy 600 with homogeneous microstructure.
* NUCLEAR MATERIALS SAFETY RESEARCH DIVISION, KOREA ATOMIC ENERGY RESEARCH INSTITUTE, DAEDEOK-DAERO 989-111, YUSEONG-GU, DAEJEON 34057, KOREA# Corresponding author: [email protected]
1244
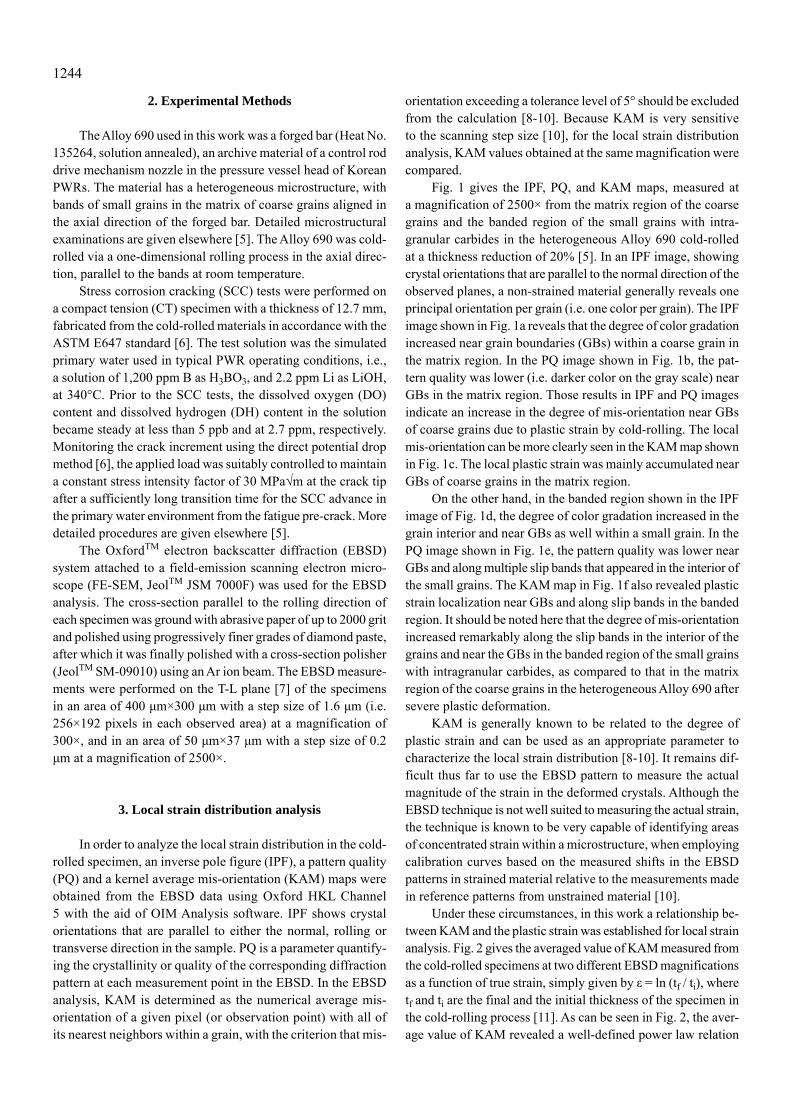
2. Experimental Methods
The Alloy 690 used in this work was a forged bar (Heat No. 135264, solution annealed), an archive material of a control rod drive mechanism nozzle in the pressure vessel head of Korean PWRs. The material has a heterogeneous microstructure, with bands of small grains in the matrix of coarse grains aligned in the axial direction of the forged bar. Detailed microstructural examinations are given elsewhere [5]. The Alloy 690 was cold-rolled via a one-dimensional rolling process in the axial direc-tion, parallel to the bands at room temperature.
Stress corrosion cracking (SCC) tests were performed on a compact tension (CT) specimen with a thickness of 12.7 mm, fabricated from the cold-rolled materials in accordance with the ASTM E647 standard [6]. The test solution was the simulated primary water used in typical PWR operating conditions, i.e., a solution of 1,200 ppm B as H3BO3, and 2.2 ppm Li as LiOH, at 340°C. Prior to the SCC tests, the dissolved oxygen (DO) content and dissolved hydrogen (DH) content in the solution became steady at less than 5 ppb and at 2.7 ppm, respectively. Monitoring the crack increment using the direct potential drop method [6], the applied load was suitably controlled to maintain a constant stress intensity factor of 30 MPa√m at the crack tip after a sufficiently long transition time for the SCC advance in the primary water environment from the fatigue pre-crack. More detailed procedures are given elsewhere [5].
The OxfordTM electron backscatter diffraction (EBSD) system attached to a field-emission scanning electron micro-scope (FE-SEM, JeolTM JSM 7000F) was used for the EBSD analysis. The cross-section parallel to the rolling direction of each specimen was ground with abrasive paper of up to 2000 grit and polished using progressively finer grades of diamond paste, after which it was finally polished with a cross-section polisher (JeolTM SM-09010) using an Ar ion beam. The EBSD measure-ments were performed on the T-L plane [7] of the specimens in an area of 400 μm×300 μm with a step size of 1.6 μm (i.e. 256×192 pixels in each observed area) at a magnification of 300×, and in an area of 50 μm×37 μm with a step size of 0.2 μm at a magnification of 2500×.
3. Local strain distribution analysis
In order to analyze the local strain distribution in the cold-rolled specimen, an inverse pole figure (IPF), a pattern quality (PQ) and a kernel average mis-orientation (KAM) maps were obtained from the EBSD data using Oxford HKL Channel 5 with the aid of OIM Analysis software. IPF shows crystal orientations that are parallel to either the normal, rolling or transverse direction in the sample. PQ is a parameter quantify-ing the crystallinity or quality of the corresponding diffraction pattern at each measurement point in the EBSD. In the EBSD analysis, KAM is determined as the numerical average mis-orientation of a given pixel (or observation point) with all of its nearest neighbors within a grain, with the criterion that mis-
orientation exceeding a tolerance level of 5° should be excluded from the calculation [8-10]. Because KAM is very sensitive to the scanning step size [10], for the local strain distribution analysis, KAM values obtained at the same magnification were compared.
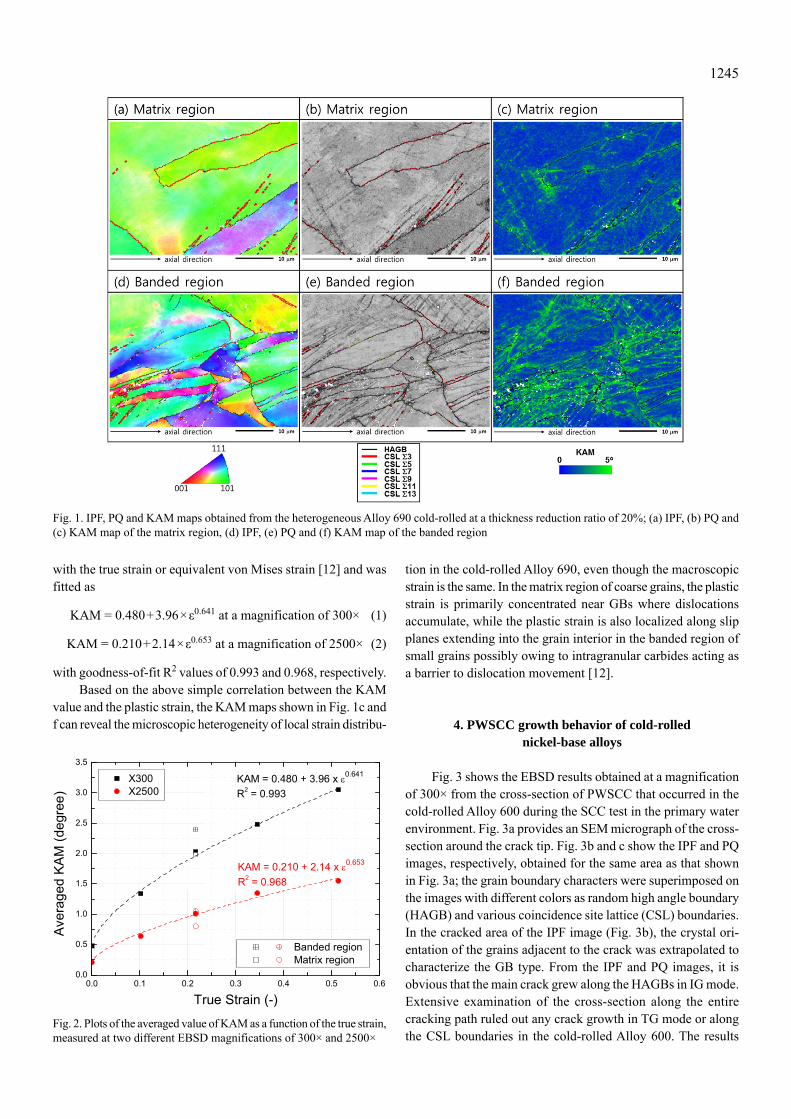
Fig. 1 gives the IPF, PQ, and KAM maps, measured at a magnification of 2500× from the matrix region of the coarse grains and the banded region of the small grains with intra-granular carbides in the heterogeneous Alloy 690 cold-rolled at a thickness reduction of 20% [5]. In an IPF image, showing crystal orientations that are parallel to the normal direction of the observed planes, a non-strained material generally reveals one principal orientation per grain (i.e. one color per grain). The IPF image shown in Fig. 1a reveals that the degree of color gradation increased near grain boundaries (GBs) within a coarse grain in the matrix region. In the PQ image shown in Fig. 1b, the pat-tern quality was lower (i.e. darker color on the gray scale) near GBs in the matrix region. Those results in IPF and PQ images indicate an increase in the degree of mis-orientation near GBs of coarse grains due to plastic strain by cold-rolling. The local mis-orientation can be more clearly seen in the KAM map shown in Fig. 1c. The local plastic strain was mainly accumulated near GBs of coarse grains in the matrix region.
On the other hand, in the banded region shown in the IPF image of Fig. 1d, the degree of color gradation increased in the grain interior and near GBs as well within a small grain. In the PQ image shown in Fig. 1e, the pattern quality was lower near GBs and along multiple slip bands that appeared in the interior of the small grains. The KAM map in Fig. 1f also revealed plastic strain localization near GBs and along slip bands in the banded region. It should be noted here that the degree of mis-orientation increased remarkably along the slip bands in the interior of the grains and near the GBs in the banded region of the small grains with intragranular carbides, as compared to that in the matrix region of the coarse grains in the heterogeneous Alloy 690 after severe plastic deformation.
KAM is generally known to be related to the degree of plastic strain and can be used as an appropriate parameter to characterize the local strain distribution [8-10]. It remains dif-ficult thus far to use the EBSD pattern to measure the actual magnitude of the strain in the deformed crystals. Although the EBSD technique is not well suited to measuring the actual strain, the technique is known to be very capable of identifying areas of concentrated strain within a microstructure, when employing calibration curves based on the measured shifts in the EBSD patterns in strained material relative to the measurements made in reference patterns from unstrained material [10].
Under these circumstances, in this work a relationship be-tween KAM and the plastic strain was established for local strain analysis. Fig. 2 gives the averaged value of KAM measured from the cold-rolled specimens at two different EBSD magnifications as a function of true strain, simply given by ε = ln (tf / ti), where tf and ti are the final and the initial thickness of the specimen in the cold-rolling process [11]. As can be seen in Fig. 2, the aver-age value of KAM revealed a well-defined power law relation
1245
with the true strain or equivalent von Mises strain [12] and was fitted as
KAM = 0.480+3.96×ε0.641 at a magnification of 300× (1)
KAM = 0.210+2.14×ε0.653 at a magnification of 2500× (2)
with goodness-of-fit R2 values of 0.993 and 0.968, respectively.Based on the above simple correlation between the KAM
value and the plastic strain, the KAM maps shown in Fig. 1c and f can reveal the microscopic heterogeneity of local strain distribu-
tion in the cold-rolled Alloy 690, even though the macroscopic strain is the same. In the matrix region of coarse grains, the plastic strain is primarily concentrated near GBs where dislocations accumulate, while the plastic strain is also localized along slip planes extending into the grain interior in the banded region of small grains possibly owing to intragranular carbides acting as a barrier to dislocation movement [12].
4. PWSCC growth behavior of cold-rolled nickel-base alloys
Fig. 3 shows the EBSD results obtained at a magnification of 300× from the cross-section of PWSCC that occurred in the cold-rolled Alloy 600 during the SCC test in the primary water environment. Fig. 3a provides an SEM micrograph of the cross-section around the crack tip. Fig. 3b and c show the IPF and PQ images, respectively, obtained for the same area as that shown in Fig. 3a; the grain boundary characters were superimposed on the images with different colors as random high angle boundary (HAGB) and various coincidence site lattice (CSL) boundaries. In the cracked area of the IPF image (Fig. 3b), the crystal ori-entation of the grains adjacent to the crack was extrapolated to characterize the GB type. From the IPF and PQ images, it is obvious that the main crack grew along the HAGBs in IG mode. Extensive examination of the cross-section along the entire cracking path ruled out any crack growth in TG mode or along the CSL boundaries in the cold-rolled Alloy 600. The results
Fig. 1. IPF, PQ and KAM maps obtained from the heterogeneous Alloy 690 cold-rolled at a thickness reduction ratio of 20%; (a) IPF, (b) PQ and (c) KAM map of the matrix region, (d) IPF, (e) PQ and (f) KAM map of the banded region
0.0 0.1 0.2 0.3 0.4 0.5 0.60.0
0.5
1.0
1.5
2.0
2.5
3.0
3.5
X300X2500
KAM = 0.210 + 2.14 x 0.653
R2 = 0.968
Banded region Matrix region
Aver
aged
KAM
(deg
ree)
True Strain (-)
KAM = 0.480 + 3.96 x 0.641
R2 = 0.993
Fig. 2. Plots of the averaged value of KAM as a function of the true strain, measured at two different EBSD magnifications of 300× and 2500×

1246
are in line with the recent TEM work by Lim et al. [13] on the relationships among the IG cracking behaviors of PWSCC, GB characters, and preferential oxidation along GBs.
Fig. 3d presents the local strain distribution, estimated from the EBSD-derived KAM data using the calibration curve of KAM vs. true strain given by Eq. 1. Although it is difficult to measure the actual magnitude of the strain from the EBSD patterns, the local strain analysis approach in this work is capable of iden-tifying relative strain distribution within a microstructure with the aid of calibration curves, as discussed in Section 3. Fig. 3d suggests that PWSCC grew in IG mode along HAGBs that were highly strained rather than grain interior; however, the crack did not propagate along the CSL boundaries, even those boundaries that were highly strained by the cold-rolling process.
This consistency between the crack path and the local strain distribution can be more clearly visualized in Fig. 4, which was obtained at a magnification of 2500× around the crack tip shown in Fig. 3. The local strain distribution map in Fig. 4d was derived from the KAM map using the calibration curve given by Eq. 2. From those figures, it was confirmed that the PWSCC of the cold-rolled Alloy 600 tends to grow along the highly strained HAGB.
Fig. 5 gives EBSD results obtained at a magnification of 300× from the cold-rolled Alloy 690 after the SCC test in the primary water environment. The SEM, IPF, and PQ images in Fig. 5a through c reveal that the PWSCC of the cold-rolled Alloy 690 with heterogeneous microstructure propagated in TG mode near the banded region of small grains with intragranular carbides. Fig. 5d shows the local strain distribution map, estimated from the
KAM data; however, the image quality is slightly worse than the image quality obtained from the cold-rolled Alloy 600 shown in Fig. 3d, possibly due to the complex heterogeneity in the highly strained microstructure of the cold-rolled Alloy 690. Neverthe-less, it seems to be reasonable to admit that the PWSCC of the cold-rolled Alloy 690 propagated in TG mode near the highly strained area, which partially corresponds to the banded region, in a direction perpendicular to the maximum principal stress applied during the SCC test. The crack growth behavior is less dependent on the GB characters than it is on the stress/strain factor.
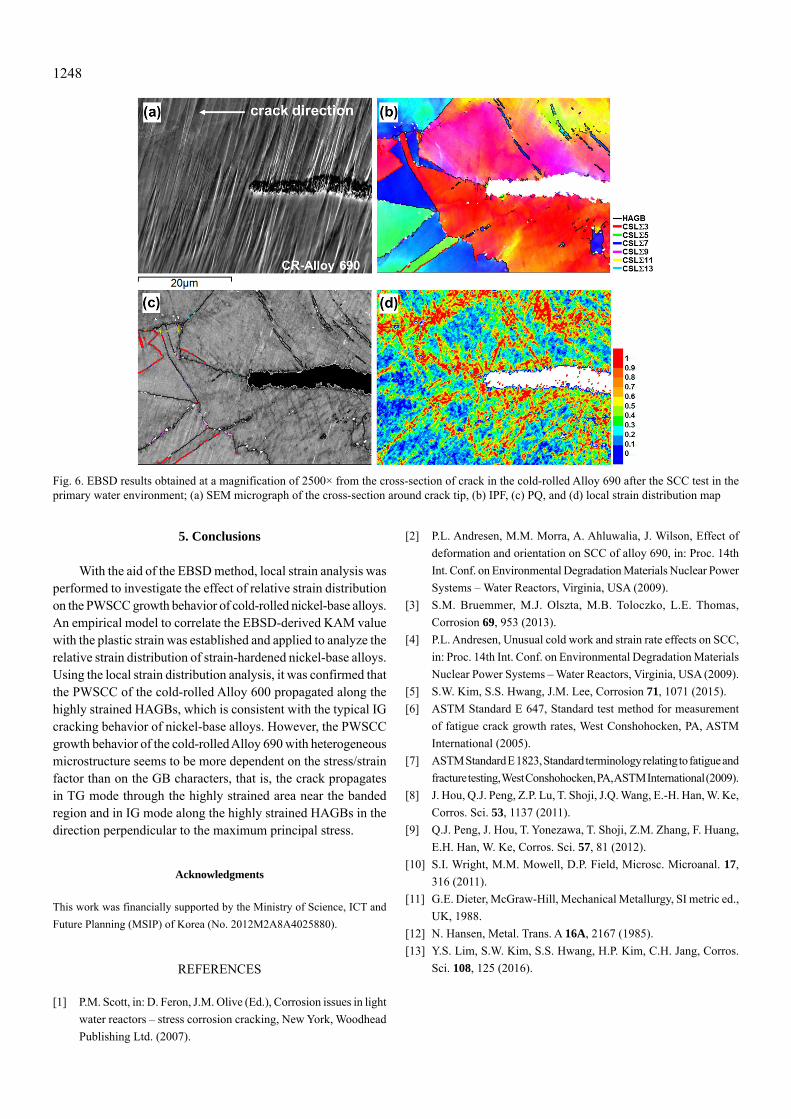
When the crack tip encountered the highly strained HAGBs in the matrix region of the cold-rolled Alloy 690, cracking oc-curred along the most susceptible path to SCC, just as it did for the cold-rolled Alloy 600, as shown in Fig. 6. For the crack propa-gated in IG mode, EBSD results were obtained around the crack tip at a magnification of 2500× for the cold-rolled Alloy 690. It is clear that cracking occurred along the highly strained HAGBs.
Despite considerable experimental efforts, due to the complexity of interactions between microstructural and strain-hardening effects on corrosion, no consensus has yet been achieved as to the nature of the abnormal PWSCC growth behav-ior of strain-hardened Alloy 690 materials with heterogeneous microstructures [5]. Although the present work does not cover all aspects of the relevant factors of PWSCC, the local strain analysis method applied in this work provides a clue with which to begin to explain the effects of the microstructure and resultant heterogeneity in the relative strain distribution on the PWSCC growth behavior of highly strained Alloy 690 materials.
Fig. 3. EBSD results obtained at a magnification of 300× from the cross-section of crack in the cold-rolled Alloy 600 after the SCC test in the primary water environment; (a) SEM micrograph of the cross-section around crack tip, (b) IPF, (c) PQ, and (d) local strain distribution map

1247
Fig. 4. EBSD results obtained at a magnification of 2500× from the cross-section of crack in the cold-rolled Alloy 600 after the SCC test in the primary water environment; (a) SEM micrograph of the cross-section around crack tip, (b) IPF, (c) PQ, and (d) local strain distribu-tion map
Fig. 5. EBSD results obtained at a magnification of 300× from the cross-section of crack in the cold-rolled Alloy 690 after the SCC test in the primary water environment; (a) SEM micrograph of the cross-section around crack tip, (b) IPF, (c) PQ, and (d) local strain distribu-tion map
1248
5. Conclusions
With the aid of the EBSD method, local strain analysis was performed to investigate the effect of relative strain distribution on the PWSCC growth behavior of cold-rolled nickel-base alloys. An empirical model to correlate the EBSD-derived KAM value with the plastic strain was established and applied to analyze the relative strain distribution of strain-hardened nickel-base alloys. Using the local strain distribution analysis, it was confirmed that the PWSCC of the cold-rolled Alloy 600 propagated along the highly strained HAGBs, which is consistent with the typical IG cracking behavior of nickel-base alloys. However, the PWSCC growth behavior of the cold-rolled Alloy 690 with heterogeneous microstructure seems to be more dependent on the stress/strain factor than on the GB characters, that is, the crack propagates in TG mode through the highly strained area near the banded region and in IG mode along the highly strained HAGBs in the direction perpendicular to the maximum principal stress.
Acknowledgments
This work was financially supported by the Ministry of Science, ICT and Future Planning (MSIP) of Korea (No. 2012M2A8A4025880).
REFERENCES
[1] P.M. Scott, in: D. Feron, J.M. Olive (Ed.), Corrosion issues in light water reactors – stress corrosion cracking, New York, Woodhead Publishing Ltd. (2007).
[2] P.L. Andresen, M.M. Morra, A. Ahluwalia, J. Wilson, Effect of deformation and orientation on SCC of alloy 690, in: Proc. 14th Int. Conf. on Environmental Degradation Materials Nuclear Power Systems – Water Reactors, Virginia, USA (2009).
[3] S.M. Bruemmer, M.J. Olszta, M.B. Toloczko, L.E. Thomas, Corrosion 69, 953 (2013).
[4] P.L. Andresen, Unusual cold work and strain rate effects on SCC, in: Proc. 14th Int. Conf. on Environmental Degradation Materials Nuclear Power Systems – Water Reactors, Virginia, USA (2009).
[5] S.W. Kim, S.S. Hwang, J.M. Lee, Corrosion 71, 1071 (2015).[6] ASTM Standard E 647, Standard test method for measurement
of fatigue crack growth rates, West Conshohocken, PA, ASTM International (2005).
[7] ASTM Standard E 1823, Standard terminology relating to fatigue and fracture testing, West Conshohocken, PA, ASTM International (2009).
[8] J. Hou, Q.J. Peng, Z.P. Lu, T. Shoji, J.Q. Wang, E.-H. Han, W. Ke, Corros. Sci. 53, 1137 (2011).
[9] Q.J. Peng, J. Hou, T. Yonezawa, T. Shoji, Z.M. Zhang, F. Huang, E.H. Han, W. Ke, Corros. Sci. 57, 81 (2012).
[10] S.I. Wright, M.M. Mowell, D.P. Field, Microsc. Microanal. 17, 316 (2011).
[11] G.E. Dieter, McGraw-Hill, Mechanical Metallurgy, SI metric ed., UK, 1988.
[12] N. Hansen, Metal. Trans. A 16A, 2167 (1985).[13] Y.S. Lim, S.W. Kim, S.S. Hwang, H.P. Kim, C.H. Jang, Corros.
Sci. 108, 125 (2016).
Fig. 6. EBSD results obtained at a magnification of 2500× from the cross-section of crack in the cold-rolled Alloy 690 after the SCC test in the primary water environment; (a) SEM micrograph of the cross-section around crack tip, (b) IPF, (c) PQ, and (d) local strain distribution map