Arçelik 2016 9-Month Financial Results Q3 Results.pdf · • Arçelik A.Ş., outperforming...
24
Arçelik 2016 9-Month Financial Results
Transcript of Arçelik 2016 9-Month Financial Results Q3 Results.pdf · • Arçelik A.Ş., outperforming...
Arçelik
2016 9-Month Financial Results
2
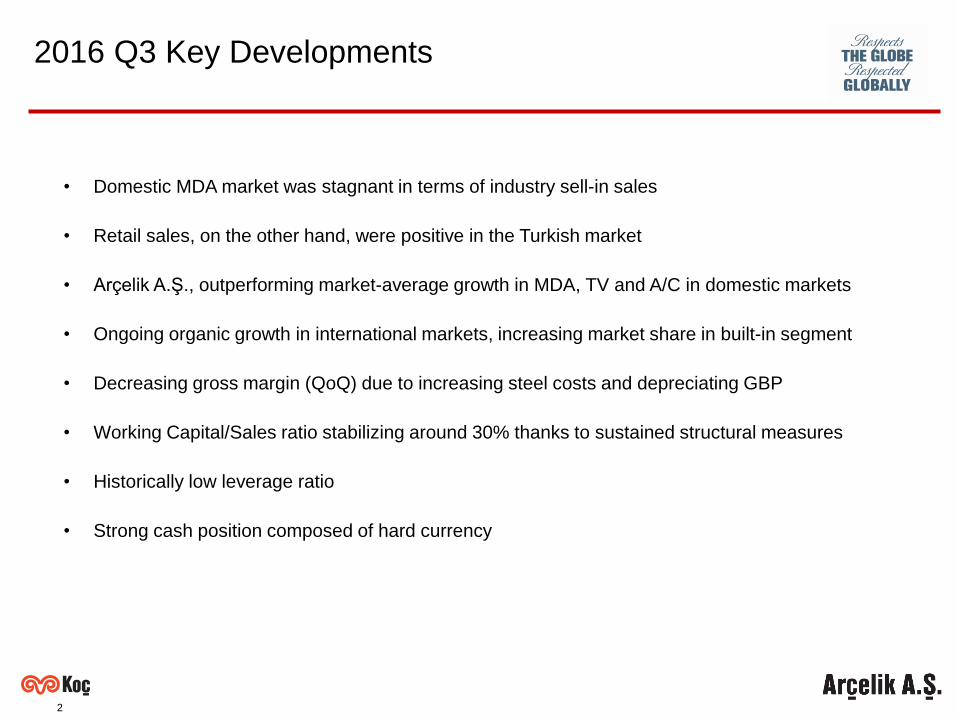
• Domestic MDA market was stagnant in terms of industry sell-in sales
• Retail sales, on the other hand, were positive in the Turkish market
• Arçelik A.Ş., outperforming market-average growth in MDA, TV and A/C in domestic markets
• Ongoing organic growth in international markets, increasing market share in built-in segment
• Decreasing gross margin (QoQ) due to increasing steel costs and depreciating GBP
• Working Capital/Sales ratio stabilizing around 30% thanks to sustained structural measures
• Historically low leverage ratio
• Strong cash position composed of hard currency
2016 Q3 Key Developments
3
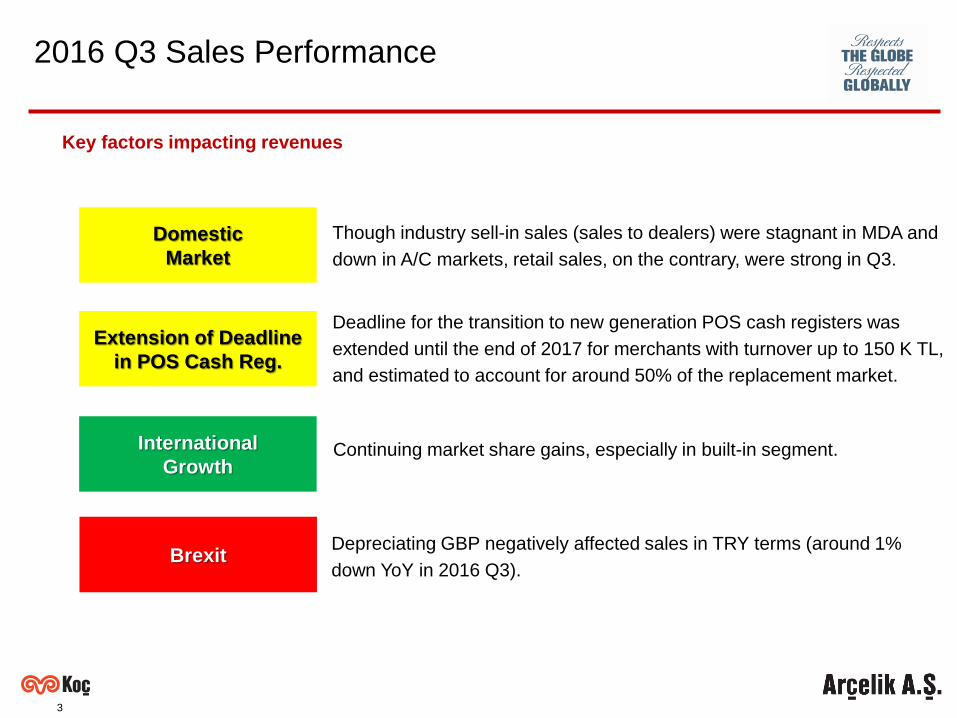
Key factors impacting revenues
2016 Q3 Sales Performance
Domestic
Market
International
Growth
Though industry sell-in sales (sales to dealers) were stagnant in MDA and
down in A/C markets, retail sales, on the contrary, were strong in Q3.
Continuing market share gains, especially in built-in segment.
Extension of Deadline
in POS Cash Reg.
Deadline for the transition to new generation POS cash registers was
extended until the end of 2017 for merchants with turnover up to 150 K TL,
and estimated to account for around 50% of the replacement market.
BrexitDepreciating GBP negatively affected sales in TRY terms (around 1%
down YoY in 2016 Q3).
4
2016 Q3 Margins
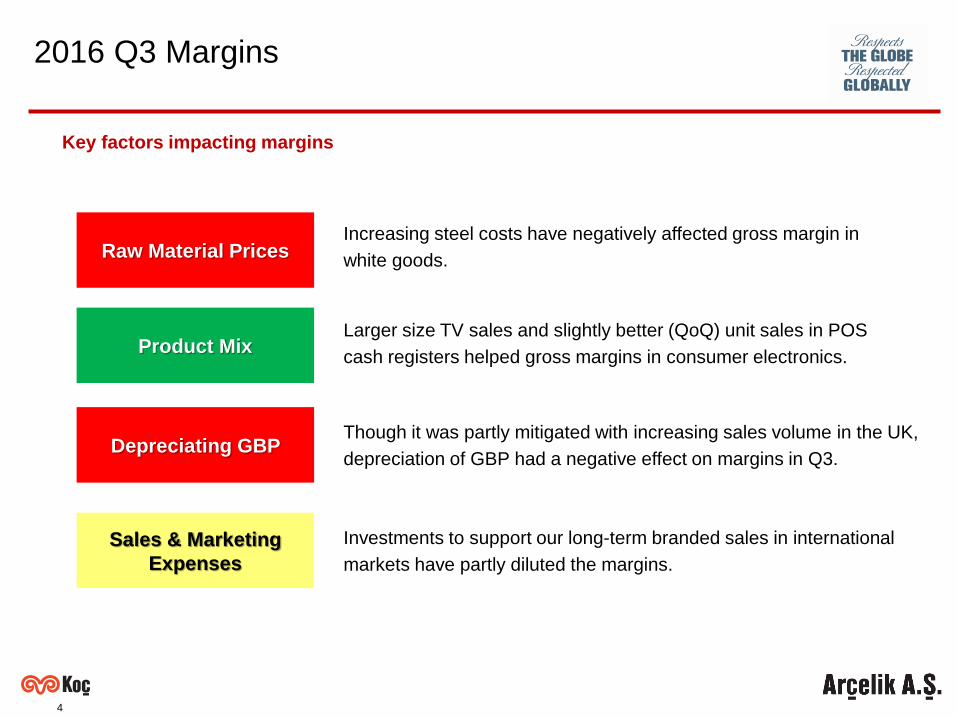
Key factors impacting margins
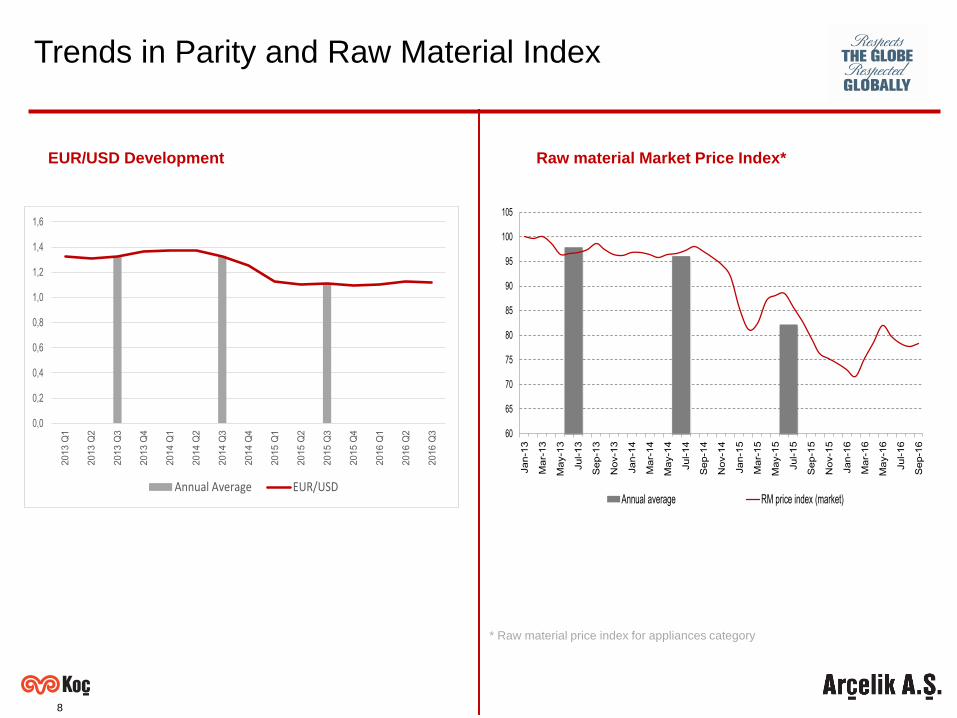
Raw Material Prices
Depreciating GBP Though it was partly mitigated with increasing sales volume in the UK,
depreciation of GBP had a negative effect on margins in Q3.
Increasing steel costs have negatively affected gross margin in
white goods.
Sales & Marketing
Expenses
Investments to support our long-term branded sales in international
markets have partly diluted the margins.
Product MixLarger size TV sales and slightly better (QoQ) unit sales in POS
cash registers helped gross margins in consumer electronics.
5
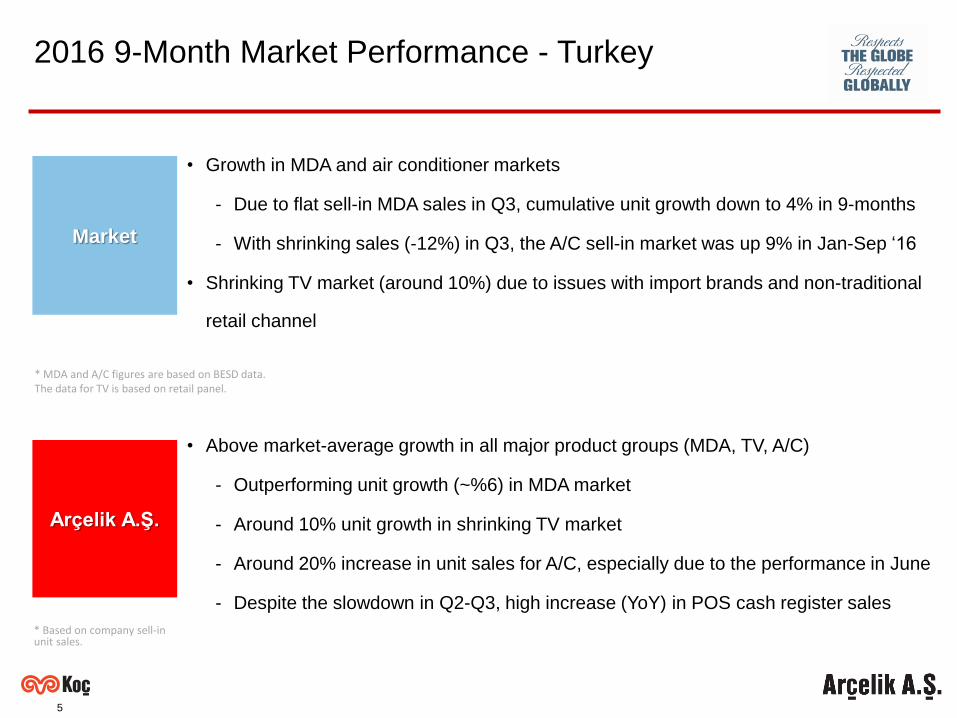
• Growth in MDA and air conditioner markets
- Due to flat sell-in MDA sales in Q3, cumulative unit growth down to 4% in 9-months
- With shrinking sales (-12%) in Q3, the A/C sell-in market was up 9% in Jan-Sep ‘16
• Shrinking TV market (around 10%) due to issues with import brands and non-traditional
retail channel
2016 9-Month Market Performance - Turkey
Market
Arçelik A.Ş.
• Above market-average growth in all major product groups (MDA, TV, A/C)
- Outperforming unit growth (~%6) in MDA market
- Around 10% unit growth in shrinking TV market
- Around 20% increase in unit sales for A/C, especially due to the performance in June
- Despite the slowdown in Q2-Q3, high increase (YoY) in POS cash register sales
* MDA and A/C figures are based on BESD data. The data for TV is based on retail panel.
* Based on company sell-in unit sales.
6
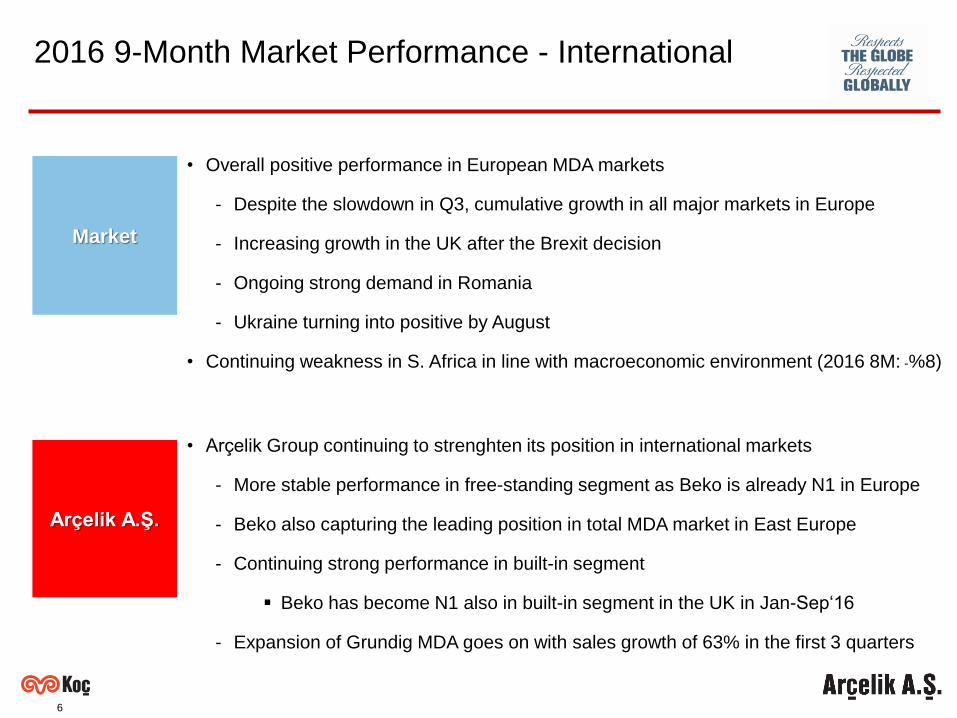
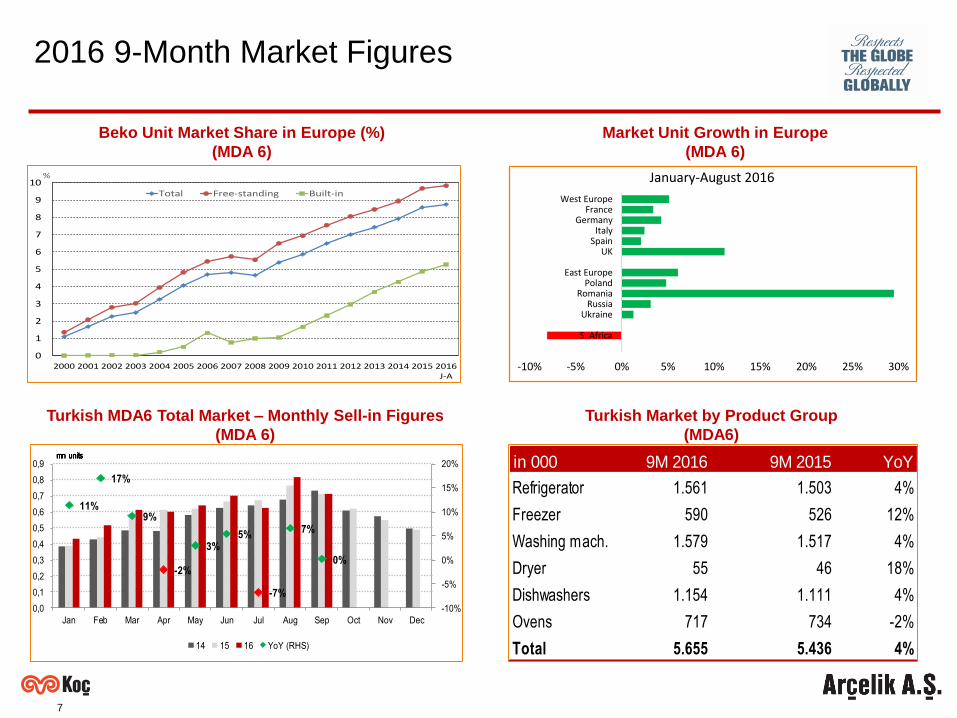
• Overall positive performance in European MDA markets
- Despite the slowdown in Q3, cumulative growth in all major markets in Europe
- Increasing growth in the UK after the Brexit decision
- Ongoing strong demand in Romania
- Ukraine turning into positive by August
• Continuing weakness in S. Africa in line with macroeconomic environment (2016 8M: -%8)
2016 9-Month Market Performance - International
Market
Arçelik A.Ş.
• Arçelik Group continuing to strenghten its position in international markets
- More stable performance in free-standing segment as Beko is already N1 in Europe
- Beko also capturing the leading position in total MDA market in East Europe
- Continuing strong performance in built-in segment
Beko has become N1 also in built-in segment in the UK in Jan-Sep‘16
- Expansion of Grundig MDA goes on with sales growth of 63% in the first 3 quarters
7
Market Unit Growth in Europe
(MDA 6)
Beko Unit Market Share in Europe (%)
(MDA 6)
2016 9-Month Market Figures
Turkish MDA6 Total Market – Monthly Sell-in Figures
(MDA 6)
Turkish Market by Product Group
(MDA6)
in 000 9M 2016 9M 2015 YoY
Refrigerator 1.561 1.503 4%
Freezer 590 526 12%
Washing mach. 1.579 1.517 4%
Dryer 55 46 18%
Dishwashers 1.154 1.111 4%
Ovens 717 734 -2%
Total 5.655 5.436 4%
11%
17%
9%
-2%
3%5%
-7%
7%
0%
-10%
-5%
0%
5%
10%
15%
20%
0,0
0,1
0,2
0,3
0,4
0,5
0,6
0,7
0,8
0,9
Jan Feb Mar Apr May Jun Jul Aug Sep Oct Nov Dec
14 15 16 YoY (RHS)
mn unitsmn unitsmn unitsmn units
0
1
2
3
4
5
6
7
8
9
10
2000 2001 2002 2003 2004 2005 2006 2007 2008 2009 2010 2011 2012 2013 2014 2015 2016J-A
%
Total Free-standing Built-in
-10% -5% 0% 5% 10% 15% 20% 25% 30%
S. Africa
UkraineRussia
RomaniaPoland
East Europe
UKSpain
ItalyGermany
FranceWest Europe
January-August 2016
8
Trends in Parity and Raw Material Index
EUR/USD Development Raw material Market Price Index*
* Raw material price index for appliances category
0,0
0,2
0,4
0,6
0,8
1,0
1,2
1,4
1,6
20
13
Q1
20
13
Q2
20
13
Q3
20
13
Q4
20
14
Q1
20
14
Q2
20
14
Q3
20
14
Q4
20
15
Q1
20
15
Q2
20
15
Q3
20
15
Q4
20
16
Q1
20
16
Q2
20
16
Q3
Annual Average EUR/USD
60
65
70
75
80
85
90
95
100
105
Ja
n-1
3
Ma
r-13
Ma
y-1
3
Ju
l-1
3
Se
p-1
3
Nov-1
3
Jan-1
4
Ma
r-14
Ma
y-1
4
Ju
l-1
4
Se
p-1
4
Nov-1
4
Ja
n-1
5
Ma
r-15
Ma
y-1
5
Ju
l-1
5
Se
p-1
5
Nov-1
5
Ja
n-1
6
Ma
r-16
Ma
y-1
6
Ju
l-1
6
Se
p-1
6
Annual average RM price index (market)
9
• Arçelik A.Ş. intends to separate its Turkish marketing and aftersales functions from its other
operations (such as its production and R&D operations) and transfer these functions to a new
wholly-owned subsidiary, Arçelik Pazarlama A.Ş., in order to bring Turkish operations in line with
global organization.
• The Proposed Reorganisation will be effected by dividing the balance sheet of Arçelik A.Ş. through
a partial spin-off (using a procedure for restructurings provided for under Turkish law), with the
relevant assets and liabilities being transferred to the new subsidiary.
• As Arçelik Pazarlama A.Ş. will be a wholly-owned subsidiary of Arçelik A.Ş., the Proposed
Reorganisation is not expected to have any impact on the presentation of the Group’s consolidated
financial reports.
• Following the approval process from local authorities and shareholders, the Proposed
Reorganisation is expected to become effective from 1 January 2017.
2016 Q3 Other Developments:
Proposed Reorganization in Turkey
10
• Arçelik A.Ş. participated the IFA 2016 Fair in Berlin with Beko and Grundig stands.
• Arçelik A.Ş., with its 5 products, was granted awards at the Red Dot Awards, which is one of the
most important competitions of the design world besides being a quality approval recognised by
authorities.
2016 Q3 Other Developments:
* A survey of senior executives conducted by monthly economy magazine Capital
11
Sales Performance
12
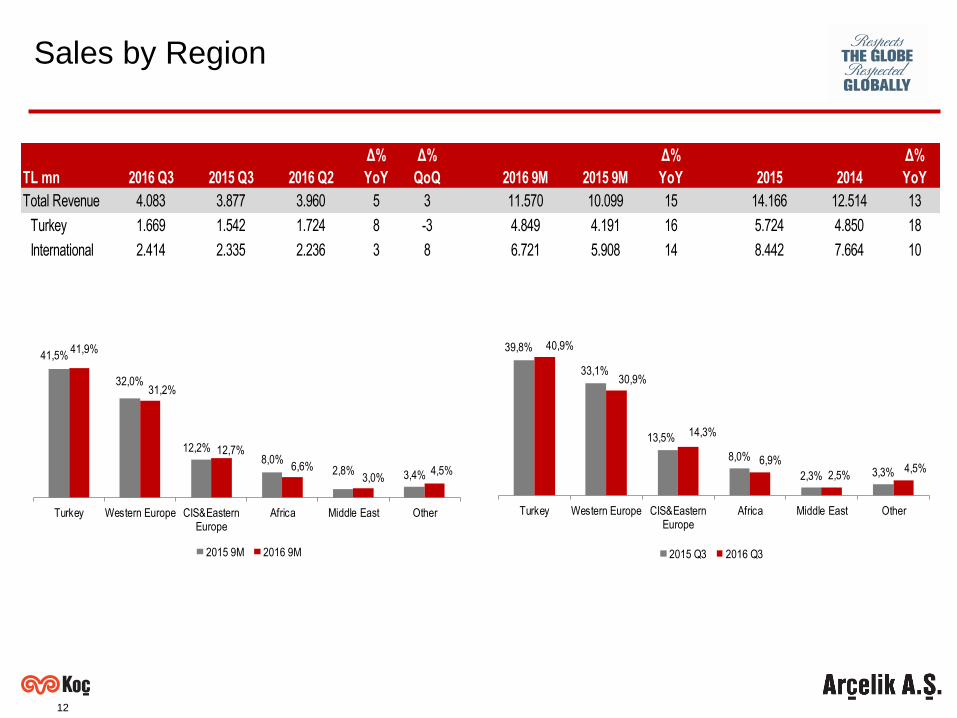
Sales by Region
TL mn 2016 Q3 2015 Q3 2016 Q2
Δ%
YoY
Δ%
QoQ 2016 9M 2015 9M
Δ%
YoY 2015 2014
Δ%
YoY
Total Revenue 4.083 3.877 3.960 5 3 11.570 10.099 15 14.166 12.514 13
Turkey 1.669 1.542 1.724 8 -3 4.849 4.191 16 5.724 4.850 18
International 2.414 2.335 2.236 3 8 6.721 5.908 14 8.442 7.664 10
41,5%
32,0%
12,2%8,0%
2,8% 3,4%
41,9%
31,2%
12,7%
6,6%3,0%
4,5%
Turkey Western Europe CIS&EasternEurope
Africa Middle East Other
2015 9M 2016 9M
39,8%
33,1%
13,5%
8,0%
2,3% 3,3%
40,9%
30,9%
14,3%
6,9%
2,5%4,5%
Turkey Western Europe CIS&EasternEurope
Africa Middle East Other
2015 Q3 2016 Q3
13
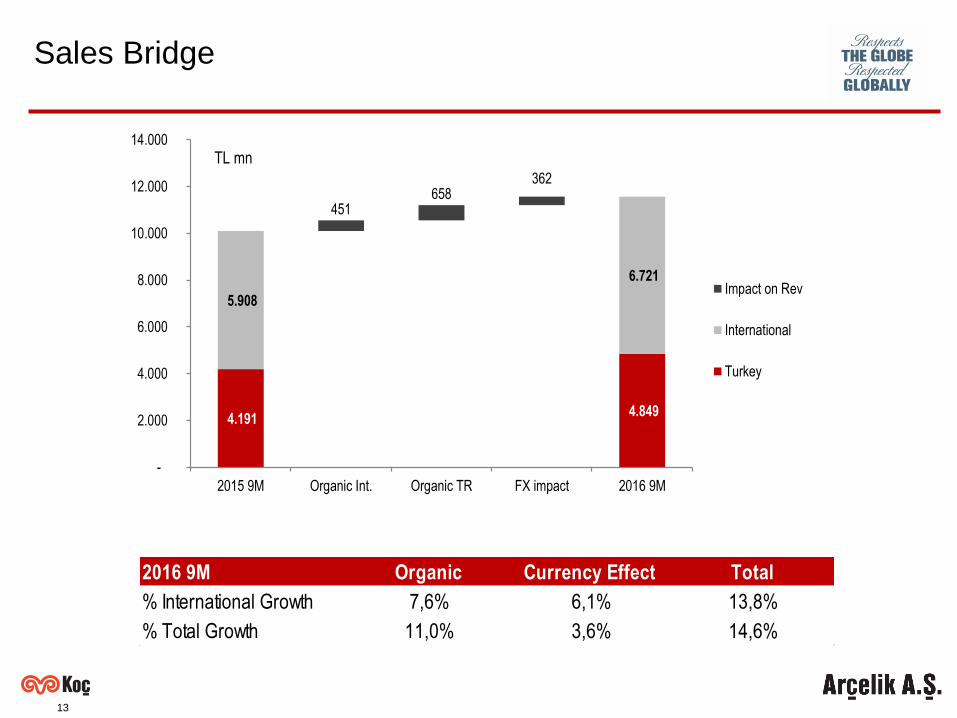
Sales Bridge
4.191 4.849
5.908
6.721
451658
362
-
2.000
4.000
6.000
8.000
10.000
12.000
14.000
2015 9M Organic Int. Organic TR FX impact 2016 9M
Impact on Rev
International
Turkey
TL mn
2016 9M Organic Currency Effect Total
% International Growth 7,6% 6,1% 13,8%
% Total Growth 11,0% 3,6% 14,6%
14
Financial Performance
15
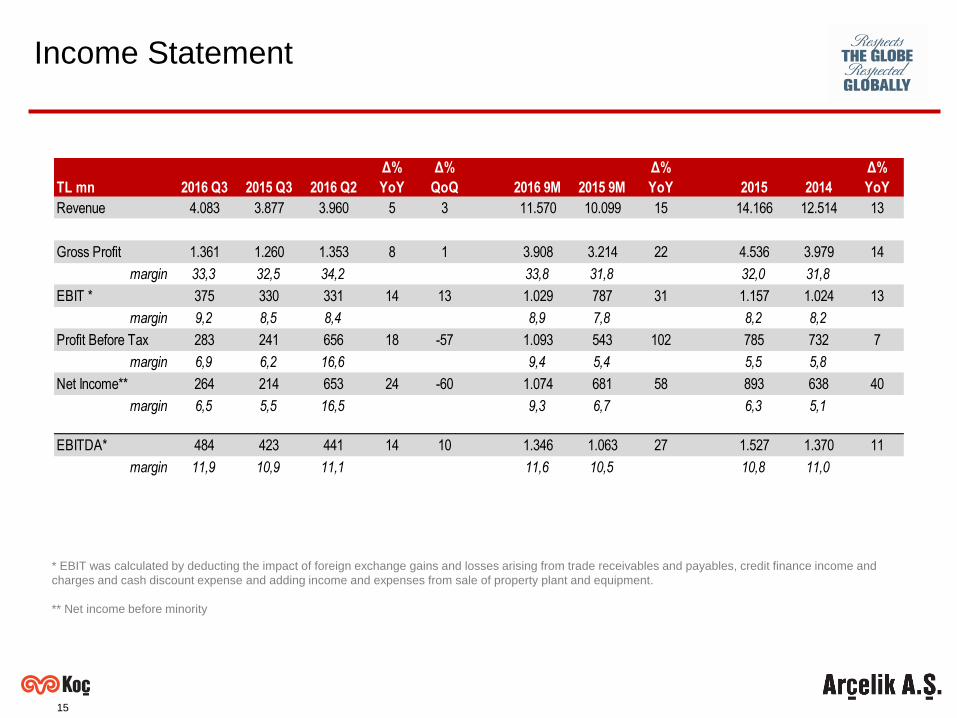
* EBIT was calculated by deducting the impact of foreign exchange gains and losses arising from trade receivables and payables, credit finance income and
charges and cash discount expense and adding income and expenses from sale of property plant and equipment.
** Net income before minority
Income Statement
TL mn 2016 Q3 2015 Q3 2016 Q2
Δ%
YoY
Δ%
QoQ 2016 9M 2015 9M
Δ%
YoY 2015 2014
Δ%
YoY
Revenue 4.083 3.877 3.960 5 3 11.570 10.099 15 14.166 12.514 13
Gross Profit 1.361 1.260 1.353 8 1 3.908 3.214 22 4.536 3.979 14
margin 33,3 32,5 34,2 33,8 31,8 32,0 31,8
EBIT * 375 330 331 14 13 1.029 787 31 1.157 1.024 13
margin 9,2 8,5 8,4 8,9 7,8 8,2 8,2
Profit Before Tax 283 241 656 18 -57 1.093 543 102 785 732 7
margin 6,9 6,2 16,6 9,4 5,4 5,5 5,8
Net Income** 264 214 653 24 -60 1.074 681 58 893 638 40
margin 6,5 5,5 16,5 9,3 6,7 6,3 5,1
EBITDA* 484 423 441 14 10 1.346 1.063 27 1.527 1.370 11
margin 11,9 10,9 11,1 11,6 10,5 10,8 11,0
16
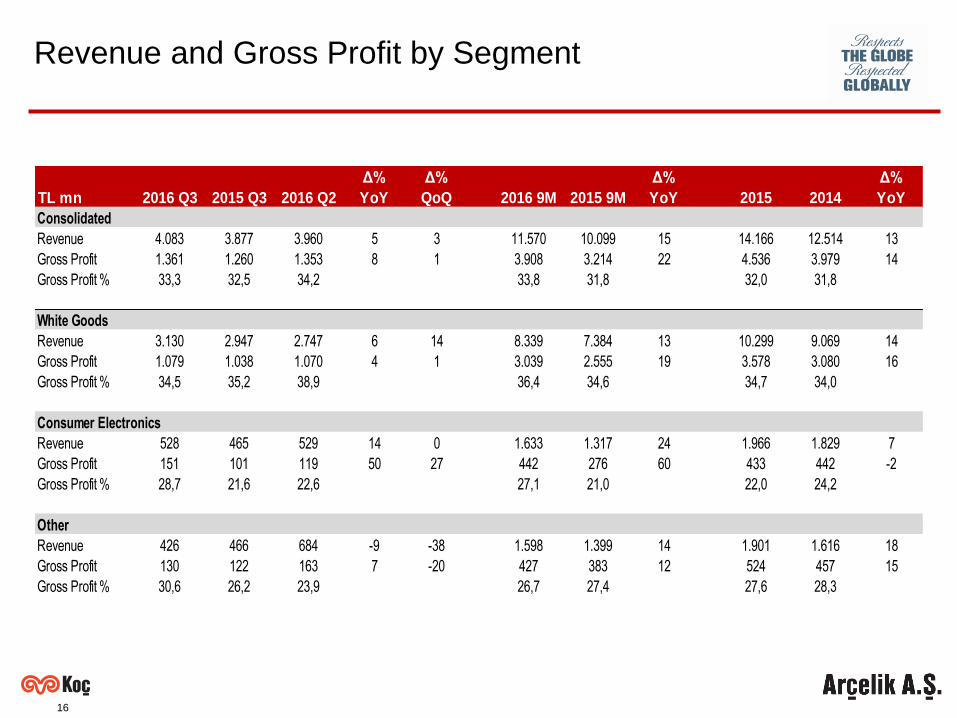
Revenue and Gross Profit by Segment
TL mn 2016 Q3 2015 Q3 2016 Q2
Δ%
YoY
Δ%
QoQ 2016 9M 2015 9M
Δ%
YoY 2015 2014
Δ%
YoY
Consolidated
Revenue 4.083 3.877 3.960 5 3 11.570 10.099 15 14.166 12.514 13
Gross Profit 1.361 1.260 1.353 8 1 3.908 3.214 22 4.536 3.979 14
Gross Profit % 33,3 32,5 34,2 33,8 31,8 32,0 31,8
White Goods
Revenue 3.130 2.947 2.747 6 14 8.339 7.384 13 10.299 9.069 14
Gross Profit 1.079 1.038 1.070 4 1 3.039 2.555 19 3.578 3.080 16
Gross Profit % 34,5 35,2 38,9 36,4 34,6 34,7 34,0
Consumer Electronics
Revenue 528 465 529 14 0 1.633 1.317 24 1.966 1.829 7
Gross Profit 151 101 119 50 27 442 276 60 433 442 -2
Gross Profit % 28,7 21,6 22,6 27,1 21,0 22,0 24,2
Other
Revenue 426 466 684 -9 -38 1.598 1.399 14 1.901 1.616 18
Gross Profit 130 122 163 7 -20 427 383 12 524 457 15
Gross Profit % 30,6 26,2 23,9 26,7 27,4 27,6 28,3
17
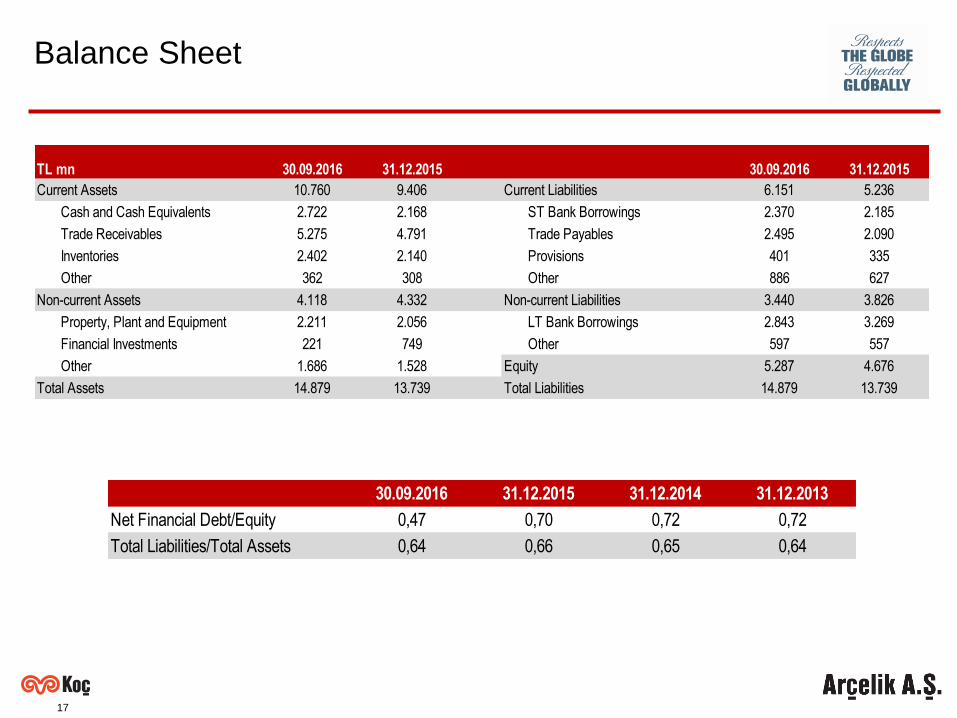
Balance Sheet
TL mn 30.09.2016 31.12.2015 30.09.2016 31.12.2015
Current Assets 10.760 9.406 Current Liabilities 6.151 5.236
Cash and Cash Equivalents 2.722 2.168 ST Bank Borrowings 2.370 2.185
Trade Receivables 5.275 4.791 Trade Payables 2.495 2.090
Inventories 2.402 2.140 Provisions 401 335
Other 362 308 Other 886 627
Non-current Assets 4.118 4.332 Non-current Liabilities 3.440 3.826
Property, Plant and Equipment 2.211 2.056 LT Bank Borrowings 2.843 3.269
Financial Investments 221 749 Other 597 557
Other 1.686 1.528 Equity 5.287 4.676
Total Assets 14.879 13.739 Total Liabilities 14.879 13.739
30.09.2016 31.12.2015 31.12.2014 31.12.2013
Net Financial Debt/Equity 0,47 0,70 0,72 0,72
Total Liabilities/Total Assets 0,64 0,66 0,65 0,64
18
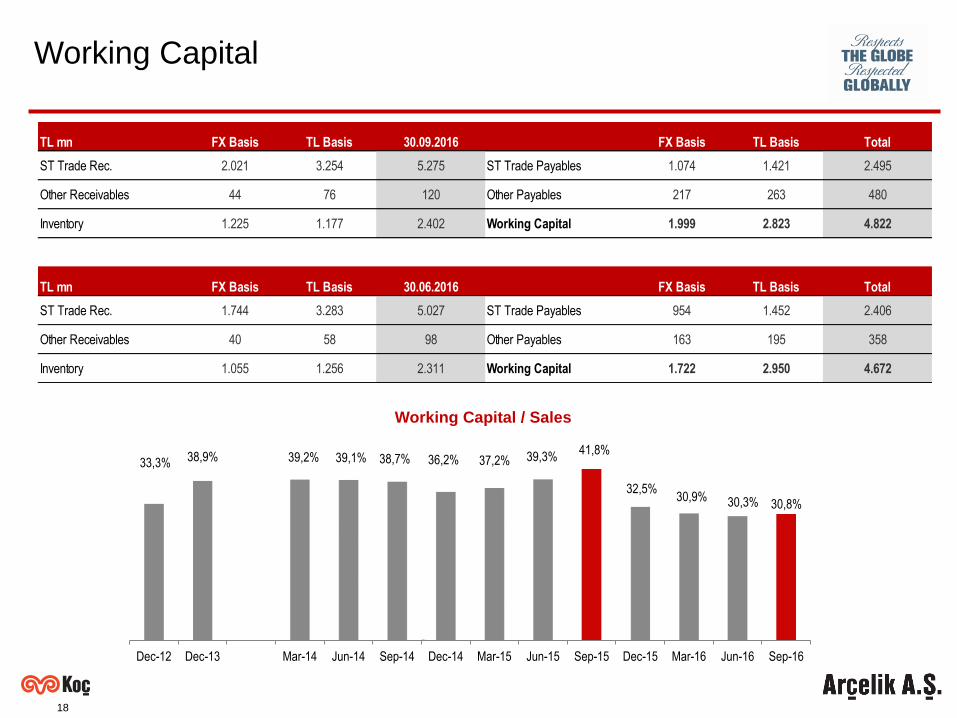
Working Capital / Sales
Working Capital
TL mn FX Basis TL Basis 30.09.2016 FX Basis TL Basis Total
ST Trade Rec. 2.021 3.254 5.275 ST Trade Payables 1.074 1.421 2.495
Other Receivables 44 76 120 Other Payables 217 263 480
Inventory 1.225 1.177 2.402 Working Capital 1.999 2.823 4.822
TL mn FX Basis TL Basis 30.06.2016 FX Basis TL Basis Total
ST Trade Rec. 1.744 3.283 5.027 ST Trade Payables 954 1.452 2.406
Other Receivables 40 58 98 Other Payables 163 195 358
Inventory 1.055 1.256 2.311 Working Capital 1.722 2.950 4.672
33,3% 38,9% 39,2% 39,1% 38,7% 36,2% 37,2% 39,3%41,8%
32,5%30,9% 30,3% 30,8%
Dec-12 Dec-13 Mar-14 Jun-14 Sep-14 Dec-14 Mar-15 Jun-15 Sep-15 Dec-15 Mar-16 Jun-16 Sep-16
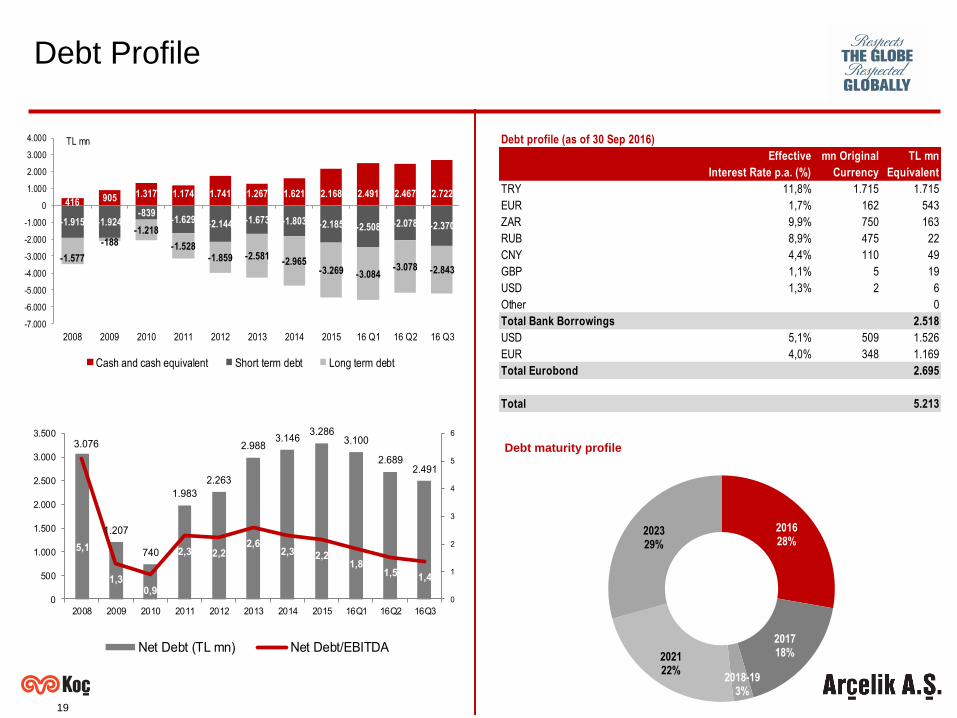
19
Debt maturity profile
Debt Profile
416 905 1.317 1.174 1.741 1.267 1.621 2.168 2.491 2.467 2.722
-1.915 -1.924-839
-1.629 -2.144 -1.673 -1.803 -2.185 -2.508 -2.078 -2.370
-1.577
-188-1.218
-1.528-1.859 -2.581
-2.965-3.269 -3.084
-3.078 -2.843
-7.000
-6.000
-5.000
-4.000
-3.000
-2.000
-1.000
0
1.000
2.000
3.000
4.000
2008 2009 2010 2011 2012 2013 2014 2015 16 Q1 16 Q2 16 Q3
Cash and cash equivalent Short term debt Long term debt
TL mn
3.076
1.207
740
1.983
2.263
2.9883.146
3.2863.100
2.6892.491
5,1
1,30,9
2,3 2,22,6
2,3 2,21,8
1,5 1,4
0
1
2
3
4
5
6
0
500
1.000
1.500
2.000
2.500
3.000
3.500
2008 2009 2010 2011 2012 2013 2014 2015 16Q1 16Q2 16Q3
Net Debt (TL mn) Net Debt/EBITDA
Debt profile (as of 30 Sep 2016)
Effective mn Original TL mn
Interest Rate p.a. (%) Currency Equivalent
TRY 11,8% 1.715 1.715
EUR 1,7% 162 543
ZAR 9,9% 750 163
RUB 8,9% 475 22
CNY 4,4% 110 49
GBP 1,1% 5 19
USD 1,3% 2 6
Other 0
Total Bank Borrowings 2.518
USD 5,1% 509 1.526
EUR 4,0% 348 1.169
Total Eurobond 2.695
Total 5.213
201628%
201718%
2018-193%
202122%
202329%
20
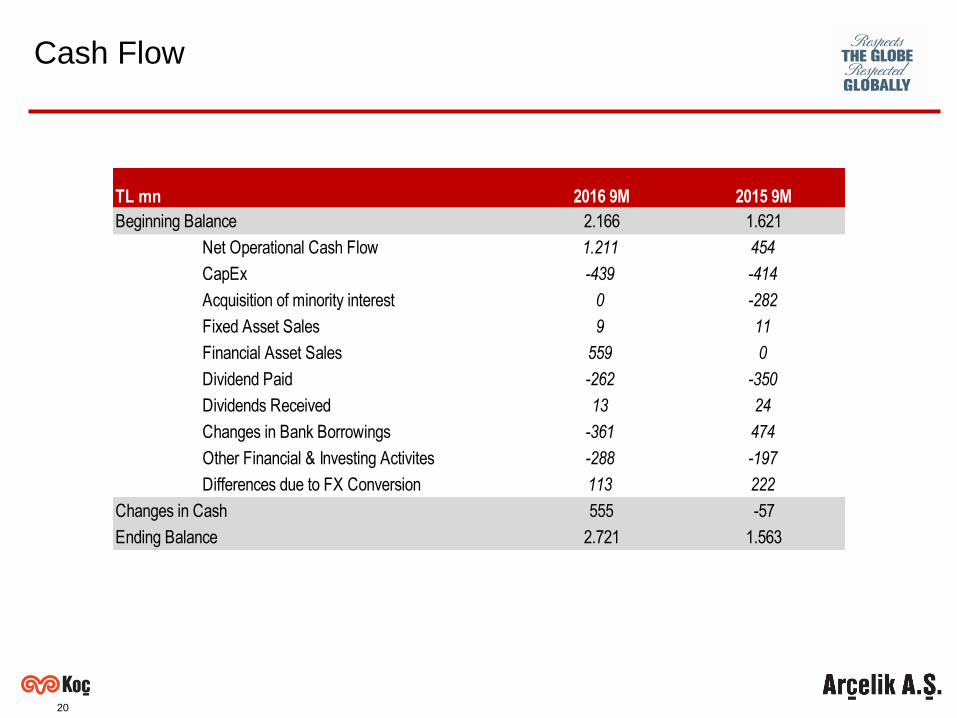
Cash Flow
TL mn 2016 9M 2015 9M
Beginning Balance 2.166 1.621
Net Operational Cash Flow 1.211 454
CapEx -439 -414
Acquisition of minority interest 0 -282
Fixed Asset Sales 9 11
Financial Asset Sales 559 0
Dividend Paid -262 -350
Dividends Received 13 24
Changes in Bank Borrowings -361 474
Other Financial & Investing Activites -288 -197
Differences due to FX Conversion 113 222
Changes in Cash 555 -57
Ending Balance 2.721 1.563
21
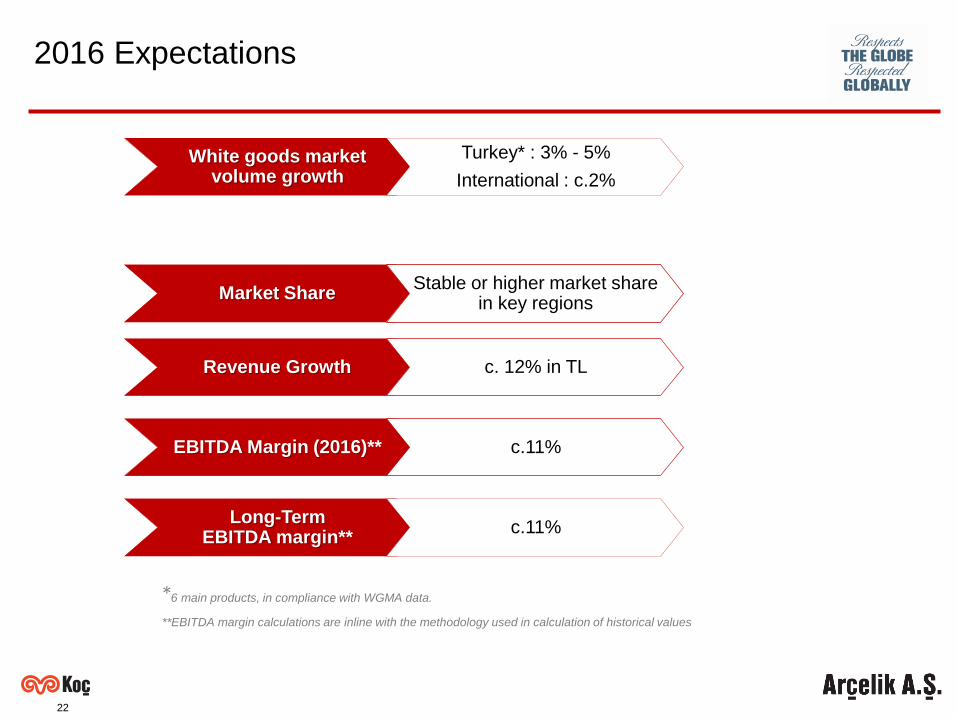
2016 Expectations
22
Market Share
White goods market volume growth
Revenue Growth
EBITDA Margin (2016)**
Long-TermEBITDA margin**
Stable or higher market share in key regions
Turkey* : 3% - 5%
International : c.2%
c. 12% in TL
c.11%
c.11%
*6 main products, in compliance with WGMA data.
**EBITDA margin calculations are inline with the methodology used in calculation of historical values
2016 Expectations

23
Polat Şen
CFO
Tel: (+90 212) 314 34 34
www.arcelikas.com
Contacts for Investor Relations
Hande Sarıdal
Finance Director
Tel: (+90 212) 314 31 85
Orkun İnanbil
Investor Relations Manager
Tel: (+90 212) 314 31 14
24
This presentation contains information and analysis on financial statements as well as forward-looking
statements that reflect the Company management’s current views with respect to certain future events.
Although it is believed that the information and analysis are correct and expectations reflected in these
statements are reasonable, they may be affected by a variety of variables and changes in underlying
assumptions that could cause actual results to differ materially.
Neither Arçelik nor any of its managers or employees nor any other person shall have any liability
whatsoever for any loss arising from the use of this presentation.
Disclaimer