ARCADIS U.S., Inc. - Wisconsin Department of Natural...
45
Page: 1/12 MEMO To: Michael Schmoller Wisconsin Department of Natural Resources (WDNR) Copies: From: Dave Lipson, Mike LeFrancois, Jennine Trask Date: ARCADIS Project No.: April 16, 2014 WI001368.0009 Subject: Evaluation of Plume Stability and Fate and Transport Modeling for PCE in Bedrock Groundwater, Madison Kipp Corporation, Madison, Wisconsin Introduction ARCADIS U.S., Inc. (ARCADIS) evaluated the stability of a dissolved-phase tetrachloroethene (PCE) plume present in bedrock groundwater beneath the Madison Kipp Facility located at 201 Waubesa Street, Madison, Wisconsin (site, Figure 1). The evaluation consisted of two parts: 1. Analysis of PCE concentration trends at 22 site groundwater monitoring wells located within the PCE plume and at the plume margin, where data have been collected in some cases since 1995 and in most cases quarterly since 2012. The 22 site groundwater monitoring wells used in this analysis screen the shallow, intermediate, and deep bedrock zones to a maximum depth of 240 feet below ground surface (ft bgs). 2. Calibration of a discrete-fracture groundwater fate and transport model that simulates PCE transport subject to mechanisms including: groundwater flow in a bedrock fracture network, dispersion, molecular diffusion and storage in bedrock matrix blocks, hydrophobic sorption, and chemical degradation due to both biotic and abiotic degradation processes. The purpose of the fate and transport model was to provide a quantitative framework for understanding trends in the site groundwater monitoring data and PCE plume stability. As discussed in greater detail below, the empirical data show that PCE concentration trends in groundwater samples collected at monitoring wells within the PCE plume and at the plume margin are decreasing or stable over time, which indicates that the PCE plume has stabilized and is no longer expanding. The primary mechanisms contributing to PCE plume stability are molecular diffusion and ARCADIS U.S., Inc. 126 North Jefferson Street, Suite 400 Milwaukee Wisconsin 53202 Tel 414-277-6203 Fax 414-276-7603
-
Upload
trinhthuan -
Category
Documents
-
view
215 -
download
1
Transcript of ARCADIS U.S., Inc. - Wisconsin Department of Natural...

Page:
1/12
MEMO
To:
Michael Schmoller Wisconsin Department of Natural Resources (WDNR)
Copies:
From:
Dave Lipson, Mike LeFrancois, Jennine Trask
Date: ARCADIS Project No.:
April 16, 2014 WI001368.0009
Subject:
Evaluation of Plume Stability and Fate and Transport Modeling for PCE in Bedrock Groundwater, Madison Kipp Corporation, Madison, Wisconsin
Introduction
ARCADIS U.S., Inc. (ARCADIS) evaluated the stability of a dissolved-phase tetrachloroethene (PCE)
plume present in bedrock groundwater beneath the Madison Kipp Facility located at 201 Waubesa Street,
Madison, Wisconsin (site, Figure 1). The evaluation consisted of two parts:
1. Analysis of PCE concentration trends at 22 site groundwater monitoring wells located within the PCE
plume and at the plume margin, where data have been collected in some cases since 1995 and in
most cases quarterly since 2012. The 22 site groundwater monitoring wells used in this analysis
screen the shallow, intermediate, and deep bedrock zones to a maximum depth of 240 feet below
ground surface (ft bgs).
2. Calibration of a discrete-fracture groundwater fate and transport model that simulates PCE transport
subject to mechanisms including: groundwater flow in a bedrock fracture network, dispersion,
molecular diffusion and storage in bedrock matrix blocks, hydrophobic sorption, and chemical
degradation due to both biotic and abiotic degradation processes. The purpose of the fate and
transport model was to provide a quantitative framework for understanding trends in the site
groundwater monitoring data and PCE plume stability.
As discussed in greater detail below, the empirical data show that PCE concentration trends in
groundwater samples collected at monitoring wells within the PCE plume and at the plume margin are
decreasing or stable over time, which indicates that the PCE plume has stabilized and is no longer
expanding. The primary mechanisms contributing to PCE plume stability are molecular diffusion and
ARCADIS U.S., Inc.
126 North Jefferson Street,
Suite 400
Milwaukee
Wisconsin 53202
Tel 414-277-6203
Fax 414-276-7603

Page:
2/12
storage of PCE in low-permeability bedrock matrix blocks, as well as naturally-occurring in-situ abiotic and
biotic degradation processes that either result in PCE mineralization or facilitate dechlorination to daughter
products, respectively.
The remainder of this memorandum discusses in greater detail the site conceptual model, empirical data,
data analysis methods, and fate and transport modeling techniques used in this evaluation.
Site Conceptual Model Summary
The Site is located at 201 Waubesa Street in the city of Madison, Dane County, Wisconsin, on the isthmus
between Lake Mendota and Lake Monona (Figure 1). Regional hydrogeology near the site has been
investigated by the Wisconsin Geological Natural History Survey (WGNHS) and documented in
publications such as Bradbury et al (1999) and Krohelski et al (2000). Site-specific hydrogeology at the
site has been investigated by Madison Kipp and documented in the March 2013 Site Investigation and
Interim Actions Report (ARCADIS, 2013). The remainder of this section summarizes key elements of the
site conceptual model relevant to evaluating PCE plume stability.
Surface water elevations in Lake Mendota are controlled by a lock and dam system and remain
approximately four feet higher than surface water elevations in Lake Monona, resulting in a regional
hydraulic gradient across the site of approximately 0.0014 feet per foot (ft/ft) oriented northwest to
southeast (Figure 1).
Municipal Unit Well 8 (Unit Well 8) is located approximately 1,400 feet southeast of the site (Figure 1). The
intake portion of Unit Well 8 is screened from approximately 280 to 774 ft bgs within the Mount Simon
Formation. Unit Well 8 is currently not being utilized for water supply.
Figure 2 maps the horizontal extent of the PCE plume in bedrock groundwater at the site and was
interpreted based on groundwater samples collected in October 2013, from wells screened in the Upper
Wonewoc Formation. The Wonewoc Formation is present beneath the site at depths between
approximately 75 and 220 ft bgs and site monitoring wells are screened at discrete intervals throughout
this formation. The extent of PCE is larger in the Upper Wonewoc Formation compared to other
formations beneath the site, which is why it was selected for Figure 2. As shown, the interpreted PCE
plume is approximately 2,400 feet long and 1,550 feet wide. Monitoring well cluster MW-25contains one
monitoring well designated as MW-25D screened at a depth of approximately 120 ft bgs and a second
monitoring well designated as MW-25D2 screened at a depth of approximately 160 ft bgs. These
monitoring wells: (1) delineate the downgradient extent of the PCE plume in bedrock groundwater; and (2)
are located between the PCE plume and Unit Well 8 potentially serving as “sentinel wells” and providing
early-warning detection capabilities in the unlikely event of future PCE plume expansion. There is
approximately 800 feet of horizontal separation between the PCE plume and Unit Well 8.

Page:
3/12
Figure 3 maps the vertical extent of the PCE plume in bedrock groundwater at the site onto a geologic
cross section. As shown, the vertical extent of the PCE plume has been delineated to a depth of
approximately 170 ft bgs beneath the site. Additionally, the site and the PCE plume are underlain by a
regionally-extensive, well-documented shale layer present within the Eau Claire Formation with an
estimated vertical hydraulic conductivity of approximately 0.0006 feet per day (ft/day) (Krohelski, 2000). In
contrast, the horizontal hydraulic conductivity of the Wonewoc Formation has been estimated between
approximately 5 and 6 ft/day (ARCADIS, 2013; Krohelski, 2000), suggesting that the vertical hydraulic
conductivity of the Eau Claire shale is roughly four orders of magnitude lower than the horizontal hydraulic
conductivity of the Wonewoc Formation (i.e., the horizontal to vertical anisotropic permeability ratio may
be as high as 10,000). Because of this, the Eau Claire shale strongly resists vertical groundwater flow and
transport and forces predominantly horizontal groundwater flow near the site. This is evidenced by the
shape of the PCE plume which is roughly 10 times longer than it is deep.
When pumping, Unit Well 8 could possibly be vulnerable to PCE impacts because, even with Unit Well 8
screened below the protective Eau Claire shale and approximately 110 feet of vertical separation and
approximately 800 feet of horizontal separation between the PCE plume and the Unit Well 8 intake, the
city of Madison completed a “Test Hole” within approximately five feet of Unit Well 8 that is open across
the Eau Claire shale (Figure 3). The Unit Well 8 Test Hole provides the only hypothetically plausible
pathway for relevant quantities of shallow groundwater containing PCE to migrate vertically downward and
impact Unit Well 8. The potential created by the Unit Well 8 Test Hole for shallow groundwater containing
PCE to migrate vertically downward is one reason for completion of the PCE plume stability evaluation
documented in this memorandum. As has been discussed with the city of Madison, it would be prudent to
properly plug and abandon the Unit Well 8 Test Hole.
Analysis of Site Groundwater Monitoring Data
The first part of the PCE plume stability evaluation involved analyzing empirical groundwater monitoring
data in accordance with standard environmental guidance documents (e.g., WDNR, 2014; USEPA, 1998;
USEPA, 2004). One thing common to all of these documents is that the primary line of evidence for plume
stability is chemical concentration trends over time in monitoring wells. The following general definitions of
plume stability are useful:
Receding Plume: Decreasing chemical concentration trends within the plume and a stable plume
margin.
Stable Plume: Stable chemical concentration trends within the plume and a stable plume margin.
Advancing Plume: Chemical concentration trends that increase over two or three consecutive
monitoring events.
Page:
4/12
In accordance with these guidance documents and their general framework for evaluating plume stability,
we analyzed site groundwater monitoring data for trends in PCE concentrations over time at select wells
within both the PCE plume and at the margins (Figure 2). The data used to perform this analysis and
resulting trends are shown in Appendix A. The methods are summarized below.
To evaluate PCE concentration trends in groundwater samples collected at the monitoring wells shown on
Figure 2, we used a combination of quantitative and qualitative statistical methods, depending on the
nature of the dataset. The quantitative statistical method involved linear regression analysis using natural
log-normalized concentration data to evaluate trend direction and statistical significance (USEPA, 2002).
This quantitative statistical method was used to evaluate PCE concentration trends when the following
conditions were present:
Sufficient data points were available (i.e., more than eight data points in a dataset); and
PCE concentrations were not influenced by the December 2012 in-situ chemical oxidation pilot testing
activities.
For monitoring locations that did not fulfill the above criteria, qualitative methods were used which involved
visually identifying the trend direction and identifying a best-fit line through the data.
Results of the quantitative statistical analyses are provided in Appendix A and summarized in Table 1,
including both the p-value and the coefficient of determination, also known as the R2 value. The p-value
provides a measure of the significance of the slope, or the correlation between the x and y variables.
Correlations were accepted as statistically significant at the 90 percent confidence level which is indicated
by a p-value of 0.10 or less. The R2 value measures the overall fit of linear regression to the data set;
values close to one are considered to be a good fit, while values close to zero are considered poor.
Results show that 12 of 22 monitoring wells tested had a sufficient amount of data to support quantitative
statistical analysis and, of those, seven showed statistically significant evidence of decreasing PCE
concentration trends over time (i.e., their p-values were less than 0.1). For the remaining five monitoring
wells with a sufficient amount of data for quantitative analysis, there is a clear decreasing or stable PCE
concentration trend over time but too much scatter in the data to be statistically significant. The one
exception is Monitoring Well MW-4S which had a sufficient amount of data to support quantitative
statistical analysis, but showed an increasing trend that was statistically insignificant. All of the PCE
concentrations measured in groundwater samples collected at Monitoring Well MW-4S were below the
maximum contaminant level (MCL) for PCE of 5 micrograms per liter (g/L). 10 of the 22 monitoring wells
had insufficient data to support quantitative statistical analyses and were analyzed qualitatively. Of these
wells, all showed evidence of decreasing or stable PCE concentration trends over time.

Page:
5/12
In summary, results of the statistical analysis indicate that all of the monitoring wells tested within the PCE
plume or at the plume margin showed decreasing or stable PCE concentration trends over time. The
exception is for Monitoring Well MW-4S which showed a slightly increasing trend, but all of the historical
PCE concentrations detected in groundwater samples collected at Monitoring Well MW-4S have been
below the MCL. This information demonstrates that the PCE plume in bedrock groundwater beneath the
site is stable or shrinking over time, likely due to a combination of naturally-occurring fate and transport
processes. Reasons for plume stabilization are explored in greater detail below.
Fate and Transport Modeling
The second part of the evaluation of PCE plume stability in site groundwater involved calibrating a
mathematical PCE fate and transport model using methods described in Lipson et al (2005). This
approach uses a discrete-fracture groundwater fate and transport model that simulates PCE transport
subject to mechanisms including groundwater flow in bedrock fractures, dispersion, molecular diffusion in
bedrock matrix blocks (also known as matrix diffusion), hydrophobic
sorption, and chemical degradation due to both biotic and abiotic
degradation processes. The purpose of the fate and transport model was
to provide a quantitative framework for understanding trends in the site
groundwater monitoring data and PCE plume stability.
Theory
Matrix diffusion refers to the transport process whereby solutes such as
PCE dissolved in groundwater diffuse either from open bedrock fractures
into the bedrock matrix, or from the matrix into open fractures (Pankow
and Cherry, 1996). The direction of diffusion depends on the direction of
the concentration gradient. For example, when solutes are initially
introduced into fractures (figure a), a strong concentration gradient exists
from the open fractures to the initially un-impacted rock matrix, resulting
in diffusion of solutes from the fractures into the matrix. This forward
diffusion process continues until either the solute storage capacity of the
rock matrix has been reached, or the solute concentration in the fractures
is equal to that in the matrix. Once the solute source is removed from the
fractures (figure b), the concentration gradient reverses resulting in back
diffusion of solutes from the rock matrix into the fractures. One implication
of matrix diffusion is that the majority of the solute mass in fractured rock
may be located within the rock matrix and not in open fractures. While
open bedrock fractures can be considered the primary pathways for flow
and transport, the rock matrix can be considered the primary reservoir for solute storage. A second
implication of matrix diffusion is that the average rate of plume migration in fractured rock may be
(a) When concentrations are higher
in the fracture, solutes diffuse from
the fracture into the matrix. (b)
When concentrations are higher in
the matrix, solutes diffuse from the
matrix into the fracture.

Page:
6/12
significantly less than the rate of groundwater flow. The rock matrix acts as a solute sink, continuously
removing solute from groundwater flowing through fractures as the plume advances. This plume
attenuation process manifests itself in a manner similar to what would occur due to solute sorption to grain
surfaces.
Another important mechanism that is well-known to influence the fate and transport of PCE in groundwater
is degradation. PCE can be degraded in groundwater via both chemical (i.e., abiotic) and microbiological
degradation reactions (Pankow and Cherry, 1996). In-situ biodegradation of PCE in groundwater typically
involves biologically-mediated reductive dechlorination, in which naturally occurring groundwater
microorganisms use PCE as an electron acceptor while metabolizing alternative organic carbon
substrates. Biologically-mediated reductive dechlorination of PCE in groundwater has been thoroughly
documented in the scientific literature (e.g., Pankow and Cherry, 1996; USEPA, 1998) and is commonly
used to remediate sites either under natural or enhanced conditions. Abiotic dechlorination can also be an
important naturally occurring mechanism that degrades PCE in groundwater, and occurs in the presence
of naturally occurring metals such as iron or manganese, sulfide minerals, or green rusts. Both
biologically-mediated and abiotic degradation reactions can be important and contribute to plume
stabilization if the overall degradation rate exceeds the groundwater transport rate.
Mathematical Model
The mathematical fate and transport model used in this evaluation is an analytical solution to the one-
dimensional (1D) dual-porosity advection-dispersion-diffusion equation developed by Sudicky and Frind
(1988) that has been programmed into a FORTRAN software program referred to as CRAFLUSH.
CRAFLUSH simulates transport of dissolved organic chemicals in fractured bedrock, including advection
within the fracture network, dispersion within the fracture network, diffusive exchange of chemicals
between bedrock fractures and matrix, storage of groundwater and chemicals in the bedrock matrix,
hydrophobic sorption in the rock matrix and along fracture walls, and first-order degradation reactions.
The conceptual model underlying CRAFLUSH assumes unidirectional, steady-state groundwater flow in
parallel planar fractures with no advective flow in the bedrock matrix. This model approximates the
structure of the Wonewoc Formation, which is horizontally-deposited, fine to coarse-grained sandstone
with numerous horizontal to sub-horizontal bedding plane fractures that may extend for hundreds and
possibly thousands of feet (Figure 4). It is recognized that some steeply-dipping or even vertical fractures
may exist in the Wonewoc Formation that can cross-connect the horizontal bedding plane fractures and
provide transport pathways for downward vertical migration (e.g., Bradbury et al., 2013). Tortuosity along
a flow-path can be accounted for mathematically in CRAFLUSH through use of a tortuosity factor.

Page:
7/12
Model Parameters
Model parameters are shown in Table 2 and include source information, geologic media-specific values
derived from site data, boundary values, and chemical-specific values. Parameters used in this evaluation
fall into three categories:
1. Parameters constrained by site investigation data, for example hydraulic conductivity, hydraulic
gradient, fracture spacing, rock matrix porosity, rock matrix fraction of organic carbon, rock matrix bulk
density, and PCE source concentration.
2. Parameters obtained from scientific literature sources, such as PCE organic-carbon partition
coefficient and PCE pure-water diffusion constant.
3. Parameters estimated during model calibration, including matrix tortuosity and PCE half-life.
These parameters are discussed in greater detail below.
Average linear groundwater velocity in the fracture network was estimated using a form of Darcy’s Law as
follows:
12Δ
where is average linear groundwater velocity, e is average hydraulic aperture in the fractures, is
groundwater density, g is acceleration due to gravity, is groundwater viscosity, and Δhis hydraulic
gradient across the fracture network.
A hydraulic gradient of 0.0014 ft/ft was used in the model based on the regional hydraulic gradient
between Lakes Mendota and Monona. This value is within the range of hydraulic gradients measured at
the site groundwater monitoring well network (ARCADIS, 2013).
A range of fracture hydraulic aperture values was estimated throughout the site (Table 2) based on 75
hydraulic conductivity tests completed in isolated sections of bedrock during the vertical aquifer profiling
phase of site investigation activities (ARCADIS, 2013). Results show the bulk hydraulic conductivity of
fractured bedrock beneath the site varied between 0.8 and 13 ft/day and averaged 6 ft/day (geometric
mean), which is consistent with a hydraulic conductivity value of 5 ft/day used to simulate the Wonewoc
Formation in the WGNHS regional groundwater flow model (Krohelski et al, 2004). Fracture apertures
were estimated by dividing bulk hydraulic conductivity of the bedrock by fracture spacing in accordance
with Freeze and Cherry (1979).

Page:
8/12
A range of fracture spacing values was estimated based on down-hole geophysical measurements
collected at six open boreholes prior to completion of bedrock monitoring wells, spanning a total vertical
distance of approximately 600 linear feet to a total depth of approximately 230 ft bgs (Table 2). The
geophysical measurements were made using optical and acoustic televiewers, which identified and
measured the orientation of 617 planar features intersecting boreholes interpreted to be open, flowing
fractures. The primary purpose of this investigation was to identify transmissive groundwater–bearing
zones targeted for monitoring (ARCADIS 2013).
In addition to fracture network characterization, bedrock matrix properties including rock porosity, fraction
of organic carbon, and bulk density were measured on 21 undisturbed bedrock samples collected during
drilling to a total depth of 235 ft bgs (Table 2). These measurements were made in an analytical laboratory
using standard geotechnical methods (ARCADIS, 2013).
Source area PCE concentration and other flow-path PCE concentrations were developed using averages
of site investigation data. A constant PCE concentration of 7,900 g/L was assigned as a boundary
condition at the fracture origin, and initial concentrations in the fractures and bedrock matrix were
assumed to be zero.
PCE sorption to solid organic carbon in the bedrock matrix was accounted for by estimating a matrix
retardation factor of 1.4 using standard groundwater calculations (e.g., Freeze and Cherry, 1979). PCE
sorption to bedrock fracture walls was assumed to be negligible.
In terms of source timing, it was assumed that PCE first penetrated bedrock beneath the site in June
1965. This results in a PCE plume residence time of approximately 48 years.
Model Calibration and Results
The fate and transport model was calibrated by assigning average or reasonable values to parameters
constrained by site investigation data and scientific literature, and adjusting the only two remaining
uncertain parameters, namely (1) matrix tortuosity and (2) PCE degradation rate, until modeled PCE
concentrations were consistent with measured PCE concentrations at calibration target locations along a
conceptual flow-path (Figure 2).
Matrix tortuosity is an uncertain parameter that accounts for tortuous diffusion pathways through complex
pore geometries in the bedrock matrix porosity, and is very difficult to measure in the field. The PCE pure-
water diffusion coefficient, a highly constrained literature value, is valid in open water where diffusion may
occur relatively unimpeded. However, chemicals diffusing through bedrock must follow sinuous pathways
around solid rock particles. This results in flow-path lengthening during diffusive transport, and is
accounted for mathematically by multiplying the free-water diffusion coefficient by a tortuosity factor which
ranges between zero and one.

Page:
9/12
Calibration targets consisted of average PCE concentrations measured at monitoring wells located on and
near the conceptual flow-path (Table 3, Figure 2). The period of PCE concentration averaging for
calibration purposes was January through May 2013. Calibration targets were selected as those
monitoring wells screened in the Upper Wonewoc Formation (Figure 3) because the extent of PCE is
larger in this formation compared to other geologic formations beneath the site.
The calibration procedure involved holding all parameters steady at their estimated values, and iteratively
adjusting matrix tortuosity and PCE degradation rate (expressed as half-life) until modeled PCE
concentrations were consistent with measured concentrations. The degree of model calibration was
quantitatively evaluated using the coefficient of determination (i.e., R2 value) between modeled and
measured PCE concentrations. The model was considered calibrated when the R2 value reached its
maximum.
Modeling results are shown on Figure 5, which plots modeled and measured PCE concentrations over
distance in bedrock groundwater along the conceptual flow-path after 48 years of transport. As shown,
model results were consistent with measured results and the two datasets have a coefficient of
determination of 0.66, which indicates the fate and transport model simulates PCE transport in bedrock
beneath the site with a good degree of accuracy.
Parameters estimated through model calibration are shown in Table 2. As shown, the final estimated
value for matrix tortuosity was 0.10, which is well within the range of published literature values for
tortuosity of sandstone and is therefore a reasonable result. Also, as shown, the final estimated value for
PCE half-life was 1,775 days (4.9 years), which is well within the range of published literature values for
in-situ PCE degradation under natural conditions and is therefore a reasonable result. Based on these
results, we consider the fate and transport model to be reasonably calibrated within a sufficient degree of
accuracy to achieve its stated purpose.
Parameter Sensitivity
Sensitivity of model parameters used in
CRAFLUSH was thoroughly investigated by
Lipson et al (2005). A copy of their results is
shown in the adjacent figure. In this analysis,
sensitivity of CRAFLUSH parameters was
evaluated using an RE factor, which is a matrix-
diffusion derived plume retardation factor that
indicates the degree to which plume velocity is
slowed down due to the matrix diffusion effect
relative to the average linear groundwater
velocity. In this case, results showed that plume

Page:
10/12
velocity was most sensitive to rock matrix porosity (m), rock matrix fraction of organic carbon (foc),
fracture aperture (e), and fracture spacing (S), and it was least sensitive to bedrock matrix tortuosity factor
(). Because CRAFLUSH uses the same mathematical formulation regardless of which parameter set is
used, these results are valid for the site fate and transport model. Knowledge of the sensitivity of these
parameters helped inform the site investigation strategy so that some site-specific data were collected to
help constrain the most sensitive model parameters.
Predictive Scenarios
The calibrated site-specific PCE fate and transport model was run for timeframes 5, 10, and 20 years
longer than 48 years (i.e., totals of 53, 58, and 68 years) to predict potential plume migration 5, 10, and 20
years into the future, also known as a forecasting scenario. Results show that the PCE plume is currently
stable and no longer migrating. Results demonstrate that the primary mechanism controlling the PCE
plume length is matrix diffusion and the primary mechanism controlling plume stability is the PCE
degradation rate.
In an effort to predict when the PCE plume reached steady-state, the model was run at a variety of
timeframes shorter than 48 years, also known as a hind-casting scenario. Results show that the PCE
plume expanded rapidly during the initial several years after PCE first penetrated bedrock, and then the
PCE plume migration rate gradually decreased over time until a stabilized condition was reached after
approximately 45 years of transport.
Summary and Conclusions
In summary, the PCE plume in bedrock groundwater beneath the site is stable and no longer expanding
as demonstrated by empirical site groundwater monitoring data. The most probable mechanisms
controlling the extent and stability of the PCE plume in site groundwater are matrix diffusion (i.e., diffusive
transfer and storage of PCE into low-permeability bedrock matrix zones) and in-situ PCE degradation,
respectively. Results of the modeling analysis indicate that the PCE plume stabilized after approximately
45 years of transport, approximately three years ago. These results suggest that Unit Well 8 will likely not
be impacted by PCE in groundwater at the site if Unit Well 8 were to become operational in the future.
This conclusion is further supported by the following:
The vertical extent of PCE has been delineated at the site and is limited to a depth of approximately
170 ft bgs.
The intake portion of Unit Well 8 starts at approximately 280 ft bgs and, therefore, there are at least
110 feet of vertical separation between the bottom of the PCE plume and the top of the intake screen
of Unit Well 8, as well as approximately 800 feet of horizontal separation.

Page:
11/12
The intake portion of Unit Well 8 is screened below the Eau Claire shale which is regional in extent,
has a very low vertical hydraulic conductivity (0.0006 ft/day), and strongly restricts vertical
groundwater flow and transport above the confining layer from migrating vertically downward and into
the deeper aquifer in which Unit Well 8 is screened.
Pumping at Unit Well 8 for water supply purposes will result in radial flow of groundwater from all
directions toward Unit Well 8 to the extent that the vast majority (e.g., ~90%) of groundwater entering
Unit Well 8 will be from other areas not associated with the site.
The PCE source area at the site (i.e., the zone with the highest PCE concentrations) will be
hydraulically contained by Madison Kipp’s proposed groundwater extraction system.
The PCE plume at the site has stabilized and is no longer expanding. The key controlling factors on
plume stabilization are matrix diffusion and biodegradation.
Moreover, monitoring well cluster MW-25 is located between the PCE plume and Unit Well 8, and can
serve as a sentinel well for early-warning detection in the unlikely event that the PCE plume begins to
migrate.
Recommendations
We continue to recommend that additional evaluation should be completed by the city of Madison to
determine the extent to which the original Test Hole is or is not connected to Municipal Unit Well 8. If a
connection exists, it is recommended that the city abandon the Test Hole as a conservative measure to
protect Unit Well 8.
It is also recommended that groundwater monitoring be completed by Madison Kipp as presented in the
2013 Annual Report (ARCADIS, 2014).
References
ARCADIS. March 2014. 2013 Annual Report, Madison-Kipp Corporation.
ARCADIS. March 2013. Site Investigation and Interim Actions Report, Madison-Kipp Corporation.
Bradbury, K. R., Swanson, S.K., Krohelski, J.T., and Fritz, A.K., 1999, Hydrogeology of Dane County,
Wisconsin. Wisconsin Geological and Natural History Survey Open-File Report 1999-04.
Page:
12/12
Bradbury, K. R., M.A. Borchardt, M. Gotkowitz, S.K. Spencer, J. Zhu, and R.J. Hunt. 2013. Source and
Transport of Human Enteric Viruses in Deep Municipal Water Supply Wells. Environ. Sci. Technol., 47,
4096-4103.
Freeze, R.A. and J.A. Cherry. 1979. Groundwater. Prentice-Hall, Inc.: Englewood Cliffs, NJ.
Krohelski, J.T., K.R. Bradbury, R.J. Hunt, and S.K. Swanson. 2000. Numerical Simulation of Groundwater
Flow in Dane County Wisconsin. Wisconsin Geological and Natural History Survey. Bulletin 98.
Lipson, D., Kueper, B., Gefell, M., 2005, Matrix Diffusion-Derived Plume Attenuation in Fractured Bedrock,
Ground Water, Vol. 34, No. 1, pp. 30-39.
Pankow, J.F. and J.A. Cherry. 1996. Dense Chlorinated Solvents and Other DNAPLs in Groundwater.
Waterloo Press: Portland, Oregon.
Sudicky, E.A., 1988, CRAFLUSH, Programmer’s Guide. Waterloo Centre for Ground-water Research,
University of Waterloo, Waterloo, Ontario, Canada, 12p.
United States Environmental Protection Agency (USEPA). 1998. Technical Protocol for Evaluating Natural
Attenuation of Chlorinated Solvents in Ground Water. Office of Research and Development. EPA/600/R-
98/128.
USEPA. 2002. Calculation and Use of First-Order Rate Constants for Monitored Natural Attenuation
Studies. EPA/540/S-02/500.
USEPA. 2004. Performance Monitoring of MNA Remedies for VOCs in Ground Water. National Risk
Management Research Laboratory. EPA/600/R-04/027.
Wisconsin Department of Natural Resources (WDNR). 2014. Guidance on Natural Attenuation for
Petroleum Releases. RR-614. January 2014.

Tables
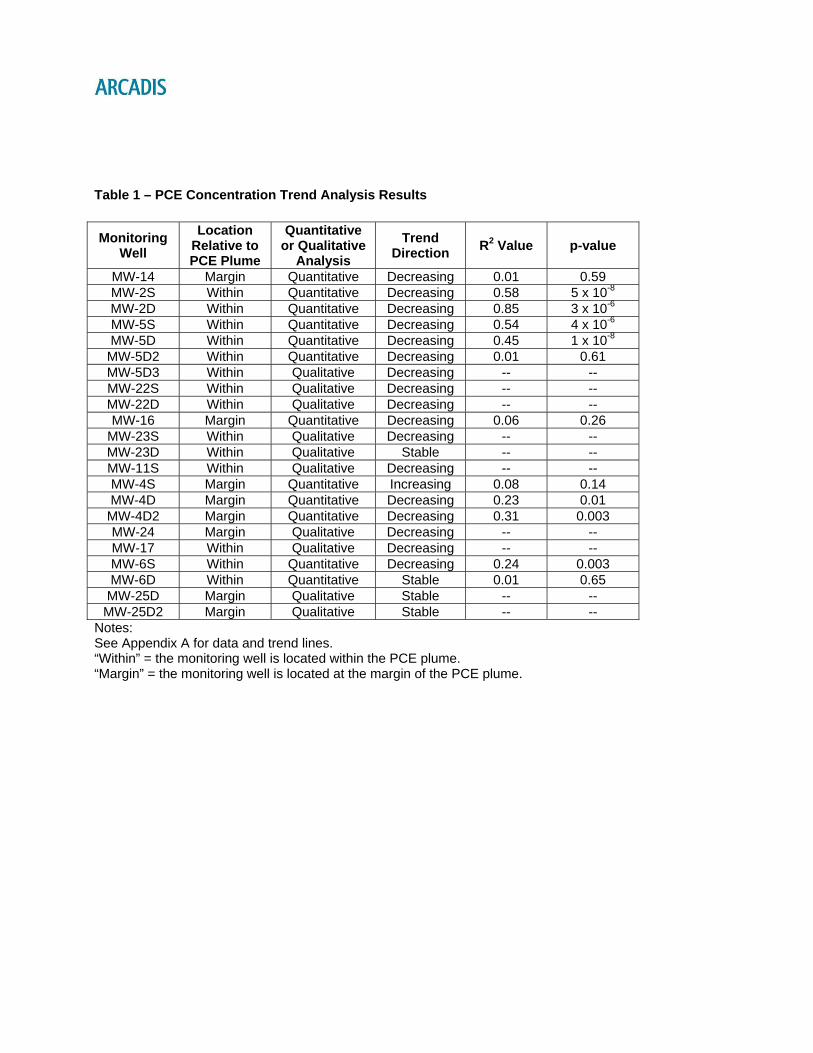
Table 1 – PCE Concentration Trend Analysis Results
Monitoring Well
Location Relative to PCE Plume
Quantitative or Qualitative
Analysis
Trend Direction
R2 Value p-value
MW-14 Margin Quantitative Decreasing 0.01 0.59 MW-2S Within Quantitative Decreasing 0.58 5 x 10⁻⁸ MW-2D Within Quantitative Decreasing 0.85 3 x 10⁻⁶ MW-5S Within Quantitative Decreasing 0.54 4 x 10⁻⁶ MW-5D Within Quantitative Decreasing 0.45 1 x 10⁻⁸ MW-5D2 Within Quantitative Decreasing 0.01 0.61 MW-5D3 Within Qualitative Decreasing -- -- MW-22S Within Qualitative Decreasing -- -- MW-22D Within Qualitative Decreasing -- -- MW-16 Margin Quantitative Decreasing 0.06 0.26
MW-23S Within Qualitative Decreasing -- -- MW-23D Within Qualitative Stable -- -- MW-11S Within Qualitative Decreasing -- -- MW-4S Margin Quantitative Increasing 0.08 0.14 MW-4D Margin Quantitative Decreasing 0.23 0.01 MW-4D2 Margin Quantitative Decreasing 0.31 0.003 MW-24 Margin Qualitative Decreasing -- -- MW-17 Within Qualitative Decreasing -- -- MW-6S Within Quantitative Decreasing 0.24 0.003 MW-6D Within Quantitative Stable 0.01 0.65 MW-25D Margin Qualitative Stable -- --
MW-25D2 Margin Qualitative Stable -- -- Notes: See Appendix A for data and trend lines. “Within” = the monitoring well is located within the PCE plume. “Margin” = the monitoring well is located at the margin of the PCE plume.

Table 2 – Fate and Transport Model Parameters
Notes: 1Calculated or based on site investigation data. 2Estimated during calibration. 3Diffusion coefficient in water from EPA Soil Screening Guidance. 4Partition Coefficient from EPA Technical Factsheet on PCE. ft – feet ft2/d – square feet per day g/cm3 – grams per cubic centimeter g/L – micrograms per liter
Parameter Range of Values
Evaluated
Final Parameter
Value
Fracture Avg. Lin. Groundwater Velocity (ft/day)1 3 - 96 23.5
Fracture Dispersivity (ft) -- 1.0
Fracture Hydraulic Aperture (microns)1 93 - 544 270
Fracture Spacing (ft)1 0.74 – 9.2 2.6
Matrix Tortuosity (-)2 -- 0.10
PCE Diffusion Coefficient in Water3 (ft2/d) -- 8.79x10⁻⁴
Fracture Retardation Factor (-) -- 1.0
Matrix Retardation Factor (-)1 1.3 – 2.4 1.4
PCE Half-Life (days)2 -- 1,775
Bedrock Matrix Porosity (%)1 17 – 29 25
Bedrock Matrix Fraction Organic Carbon (foc) (%)1 0.01 – 0.07 0.019
Bedrock Matrix Bulk Density (g/cm3)1 2.16 – 2.37 2.26
PCE Partition Coefficient (cm3/g )4 -- 238
PCE Source Concentration (g/L)1 -- 7,900

Table 3 - Calibration Targets
Observation Name
Number of Observations
Average PCE Concentration
(g/L)
MP-13
MW-19D
MW-19D2
MW-20D
MW-20D2
MW-03D2
MW-03D
MW-21D
MW-21D2
MW-03S
MW-18S
MW-05D2
MW-05S
MW-05D
MW-22D
MW-22S
MW-23S
MW-23D
MW-24
MW-17
MW-06D
MW-25D
MW-25D2
4
5
5
5
5
11
9
5
5
8
5
3
7
6
2
2
2
2
1
2
9
1
1
7,233.33
2,175.00
1,225.00
657.50
620.00
1,137.50
577.50
1,225.00
2,700.00
364.50
1,947.50
646.67
200.00
1,566.67
485.00
170.00
435.00
93.00
3.00
1,045.00
23.50
0.76
0.17 Notes: Average PCE concentrations calculated with site analytical data from 1/14/2013 through 5/6/2013. g/L – micrograms per liter.

Figures

XY!(
!(
XY
XYXY
!(
XY
XY
XY
!(
!(
XY
!(
!(
SITE
WELL #7
WELL #8
WELL #15
WELL #11
LAKE MENDOTA STATION
CLARK OIL BRRTS#0313113339
LITTLE YAHARA RIVER STATION
CLASSIC CLEANERS BRRTS #0213522764
LINDSAY FINISHES BRRTS #0213001439WELL #3 (ABANDONED) BRRTS#0213282670
MADISON BRASS WORKS BRRTS #0313001683
MCDONALDS RESTARAUNT BRRTS #0313551041
BLOCK SYSTEM CLEANER BRRTS #0213552132
GOODMAN COMMUNITY CENTER BRRTS #0213552584
MADISON CITY - GARUER FEED BRRTS#0313252719
MADISON CITY DEMETRAL LF BRRTS #0213286306
MADISON CITY - OLBRICH PARK LF BRRTS #0213526338
CITY
: MPL
S DI
V/GRO
UP: IM
/DV
DB: M
G LD
: CK
MADI
SON-
KIPP
G:\G
IS\Pr
ojects
\Mad
isonK
ipp\Ar
cMap
\2014
-04\Fi
g1_S
ite_L
ocati
on_M
ap_2
0140
411.m
xd
0 2,000 4,000Feet
SITE LOCATION MAP
FIGURE1
NOTE:TOPO BASE MAP OBTAINED FROMESRI ONLINE MAPPING, USINGARCMAP 10, ACCESSED 4/15/2014USGS 15' QUADRANGLE, MADISONEAST, WISCONSIN, 1983.
WISCONSIN
_̂SITE LOCATION
LEGENDXY OPEN SITE (ONGOING CLEANUP)
XY CLOSED SITE (COMPLETED CLEANUP)
!( GAUGING STATION!( MUNICIPAL WATER SUPPLY WELL
OPEN SITE - SITE BOUNDARIES
CLOSED SITE - SITE BOUNDARIES
PROJECT BOUNDARY
MADISON-KIPP CORPORATION201 WAUBESA STREETMADISON, WISCONSIN
2014 FATE AND TRANSPORT MODEL

XY
&<
&<
&<
&<
&<
&<
&<
&<
&<
&<
&<&<&<&<&<&<
&<&<
&<&<
&<&<
&<&<&<&<
&<&<&<
&<&<&<&<
&<&<
&<
&<
&<&<
&<
&<
&<&<
&<&<
&<
&<
&<
&<
&<
&<
&<
&<
ED
ED
EDEDEDEDEDEDED
EDED
EDED
EDEDEDED
EDEDEDED
EDEDED
EDED
@?
@?
@?
@?
@?@?
@?@?
@?@?
@?@?@?
@?@?@?@?
@?@?
@?
@?@?
LAKE MONONALAKE MONONA
51001000
2000
4000MP-13(6,500)
MP-15(1,800)
MP-16(94)
MW-17(800)
MW-21D2(1,500)
MW-25D2(<0.17 )
MP-14(970)
MW-1
MW-10S
MW-11S
MW-12S
MW-19DMW-19D2
MW-22DMW-22S
MW-23DMW-23S
MW-2DMW-2S
MW-3D2
MW-3S
MW-4DMW-4D2
MW-5D2MW-5D3
MW-6S
MW-7
MW-8
MW-9D2
UNIT WELL 8
MW-24
MW-25D
MW-27D (2)MW-27D2
MW-26S
MW-9D
MW-6D
MW-5SMW-5D
MW-4S
MW-3D3
MW-3D
MW-21DMW-20D2MW-20D
MW-18S
CLASSIC CLEANERSBRRTS #0213522764
0 350 700Feet
UPPER WONEWOC FORMATIONTETRACHLOROETHENE
ISOCONCENTRATION MAP, OCTOBER 2013FIGURE2
SERV
ICE L
AYER
CRE
DITS
: SOU
RCES
: ESR
I, DEL
ORME
, NAV
TEQ,
TOMT
OM, IN
TERM
AP, IN
CREM
ENT P
COR
P., G
EBCO
, USG
S, FA
O, N
PS, N
RCAN
, GEO
BASE
, IGN,
KADA
STER
NL,
ORDN
ANCE
SURV
EY, E
SRI J
APAN
, MET
I, ESR
I CHI
NA (H
ONG
KONG
), SWI
SSTO
PO, A
ND TH
E GIS
USER
COM
MUNI
TY
MADISON-KIPP CORPORATION201 WAUBESA STREETMADISON, WISCONSIN
2014 FATE AND TRANSPORT MODEL
CITY
: MPL
S DI
V/GRO
UP: IM
/DV
DB: M
G LD
: TS
MADI
SON-
KIPP
G:\G
IS\Pr
ojects
\Mad
isonK
ipp\Ar
cMap
\2014
-04\Fi
g2_F
TM_U
WF_P
CE_2
0140
415.m
xd
REGIONAL HYDRAULICGRADIENT 0.0014
ASSUMED SOURCE
ASSUMED PLUME CENTERLINEFOR 1-D ANALYSIS
LEGEND
XYCLOSED SITE(COMPLETED CLEANUP)
&< MUNICIPAL UNIT WELL 8
&< MONITORING WELL
@?WELLS FOR EVALUATIONOF PLUME STABILITY
EDWELLS FOR FATE ANDTRANSPORT MODEL
(6,500)5
TETRACHLOROETHENE CONCENTRATIONS ARE REPORTED IN MICROGRAMS PER LITER (µg/L).TETRACHLOROETHENE ISOCONCENTRATION CONTOUR (DASHED WHERE INFERRED)
THE UPPER WONEWOCFORMATION IS INTERPRETTEDTO BE FROM APPROXIMATELY87 - 139 FEET BELOW LAND SURFACEOR 767 - 690 FEET ABOVE MEAN SEALEVEL

CITY
: MPL
S DI
V/GRO
UP: IM
/DV
DB: M
G LD
: TS
MADI
SON-
KIPP
G:\G
IS\Pr
ojects
\Mad
isonK
ipp\Ar
cMap
\2014
-04\Fi
g3_C
rossS
ectio
nA-A
_201
4041
1.mxd
MADISON-KIPP CORPORATION201 WAUBESA STREETMADISON, WISCONSIN
TETRACHLOROETHENE ISOCONCENTRATIONCROSS SECTIONAL VIEW A-A’, OCTOBER 2013
FIGURE3
2014 FATE AND TRANSPORT MODEL
Shale (Kv = 0.0006 ft/d)
Regional HydraulicGradient 0.0014 Lake MononaLake Mendota

Conceptual Model for Fate and Transport Evaluation
4FIGURE
Bedding Plane Fracture
Mathematical Model FormulationReality: Wonewoc Formation
Parallel Plate Groundwater Flow
Matrix Diffusion
Bedding Plane Fractures
Bedrock Outcrop Near Site
Rock Core from Site
Bedrock MatrixMADISON‐KIPP CORPORATION
201 WAUBESA STREETMADISON, WISCONSIN
2014 FATE AND TRANSPORT MODEL

Calibrated Condition
5FIGURE
Bedding Plane Fracture
Bedrock Outcrop Near Site
MADISON‐KIPP CORPORATION201 WAUBESA STREETMADISON, WISCONSIN
2014 FATE AND TRANSPORT MODEL
Notes:
Average of 2013 data and range of all data (ug/L)
Simulated PCE concentrations (ug/L)
Coefficient of determination of 0.66
PCE observations are averages from 1/14/2013 to 5/6/2013

APPENDIX A
Statistical Analysis of PCE Groundwater Analytical Data

PCE Concentration Trend Analysis
A-1 FIGURE
Bedding Plane Fracture
Bedrock Outcrop Near Site
MADISON-KIPP CORPORATION 201 WAUBESA STREET MADISON, WISCONSIN
2014 FATE AND TRANSPORT MODEL
Quantitative Trendline Qualitative Trendline

PCE Concentration Trend Analysis
A-2 FIGURE
Bedding Plane Fracture
Bedrock Outcrop Near Site
MADISON-KIPP CORPORATION 201 WAUBESA STREET MADISON, WISCONSIN
2014 FATE AND TRANSPORT MODEL
Quantitative Trendline Qualitative Trendline

PCE Concentration Trend Analysis
A-3 FIGURE
Bedding Plane Fracture
Bedrock Outcrop Near Site
MADISON-KIPP CORPORATION 201 WAUBESA STREET MADISON, WISCONSIN
2014 FATE AND TRANSPORT MODEL
Quantitative Trendline Qualitative Trendline

PCE Concentration Trend Analysis
A-4 FIGURE
Bedding Plane Fracture
Bedrock Outcrop Near Site
MADISON-KIPP CORPORATION 201 WAUBESA STREET MADISON, WISCONSIN
2014 FATE AND TRANSPORT MODEL
Quantitative Trendline Qualitative Trendline

PCE Concentration Trend Analysis
A-5 FIGURE
Bedding Plane Fracture
Bedrock Outcrop Near Site
MADISON-KIPP CORPORATION 201 WAUBESA STREET MADISON, WISCONSIN
2014 FATE AND TRANSPORT MODEL
Quantitative Trendline Qualitative Trendline

PCE Concentration Trend Analysis
A-6 FIGURE
Bedding Plane Fracture
Bedrock Outcrop Near Site
MADISON-KIPP CORPORATION 201 WAUBESA STREET MADISON, WISCONSIN
2014 FATE AND TRANSPORT MODEL
Quantitative Trendline Qualitative Trendline
Data not used due to influence of ISCO pilot test

PCE Concentration Trend Analysis
A-7 FIGURE
Bedding Plane Fracture
Bedrock Outcrop Near Site
MADISON-KIPP CORPORATION 201 WAUBESA STREET MADISON, WISCONSIN
2014 FATE AND TRANSPORT MODEL
Quantitative Trendline Qualitative Trendline

PCE Concentration Trend Analysis
A-8 FIGURE
Bedding Plane Fracture
Bedrock Outcrop Near Site
MADISON-KIPP CORPORATION 201 WAUBESA STREET MADISON, WISCONSIN
2014 FATE AND TRANSPORT MODEL
Quantitative Trendline Qualitative Trendline

PCE Concentration Trend Analysis
A-9 FIGURE
Bedding Plane Fracture
Bedrock Outcrop Near Site
MADISON-KIPP CORPORATION 201 WAUBESA STREET MADISON, WISCONSIN
2014 FATE AND TRANSPORT MODEL
Quantitative Trendline Qualitative Trendline

PCE Concentration Trend Analysis
A-10 FIGURE
Bedding Plane Fracture
Bedrock Outcrop Near Site
MADISON-KIPP CORPORATION 201 WAUBESA STREET MADISON, WISCONSIN
2014 FATE AND TRANSPORT MODEL
Quantitative Trendline Qualitative Trendline

PCE Concentration Trend Analysis
A-11 FIGURE
Bedding Plane Fracture
Bedrock Outcrop Near Site
MADISON-KIPP CORPORATION 201 WAUBESA STREET MADISON, WISCONSIN
2014 FATE AND TRANSPORT MODEL
Quantitative Trendline Qualitative Trendline
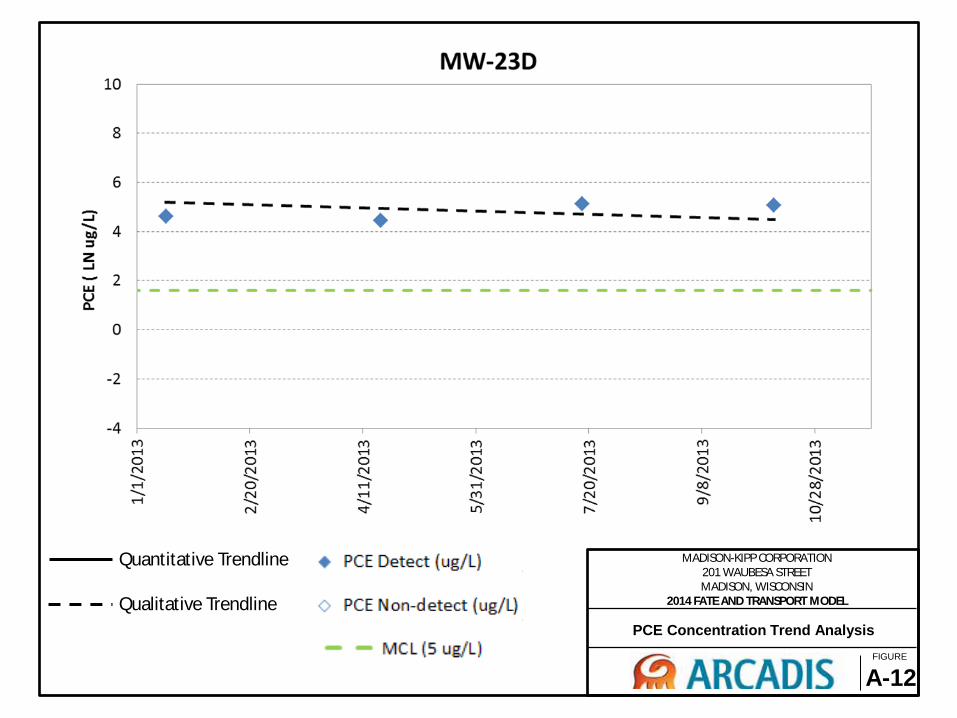
PCE Concentration Trend Analysis
A-12 FIGURE
Bedding Plane Fracture
Bedrock Outcrop Near Site
MADISON-KIPP CORPORATION 201 WAUBESA STREET MADISON, WISCONSIN
2014 FATE AND TRANSPORT MODEL
Quantitative Trendline Qualitative Trendline

PCE Concentration Trend Analysis
A-13 FIGURE
Bedding Plane Fracture
Bedrock Outcrop Near Site
MADISON-KIPP CORPORATION 201 WAUBESA STREET MADISON, WISCONSIN
2014 FATE AND TRANSPORT MODEL
Quantitative Trendline Qualitative Trendline

PCE Concentration Trend Analysis
A-14 FIGURE
Bedding Plane Fracture
Bedrock Outcrop Near Site
MADISON-KIPP CORPORATION 201 WAUBESA STREET MADISON, WISCONSIN
2014 FATE AND TRANSPORT MODEL
Quantitative Trendline Qualitative Trendline

PCE Concentration Trend Analysis
A-15 FIGURE
Bedding Plane Fracture
Bedrock Outcrop Near Site
MADISON-KIPP CORPORATION 201 WAUBESA STREET MADISON, WISCONSIN
2014 FATE AND TRANSPORT MODEL
Quantitative Trendline Qualitative Trendline

PCE Concentration Trend Analysis
A-16 FIGURE
Bedding Plane Fracture
Bedrock Outcrop Near Site
MADISON-KIPP CORPORATION 201 WAUBESA STREET MADISON, WISCONSIN
2014 FATE AND TRANSPORT MODEL
Quantitative Trendline Qualitative Trendline

PCE Concentration Trend Analysis
A-17 FIGURE
Bedding Plane Fracture
Bedrock Outcrop Near Site
MADISON-KIPP CORPORATION 201 WAUBESA STREET MADISON, WISCONSIN
2014 FATE AND TRANSPORT MODEL
Quantitative Trendline Qualitative Trendline

PCE Concentration Trend Analysis
A-18 FIGURE
Bedding Plane Fracture
Bedrock Outcrop Near Site
MADISON-KIPP CORPORATION 201 WAUBESA STREET MADISON, WISCONSIN
2014 FATE AND TRANSPORT MODEL
Quantitative Trendline Qualitative Trendline

PCE Concentration Trend Analysis
A-19 FIGURE
Bedding Plane Fracture
Bedrock Outcrop Near Site
MADISON-KIPP CORPORATION 201 WAUBESA STREET MADISON, WISCONSIN
2014 FATE AND TRANSPORT MODEL
Quantitative Trendline Qualitative Trendline

PCE Concentration Trend Analysis
A-20 FIGURE
Bedding Plane Fracture
Bedrock Outcrop Near Site
MADISON-KIPP CORPORATION 201 WAUBESA STREET MADISON, WISCONSIN
2014 FATE AND TRANSPORT MODEL
Quantitative Trendline Qualitative Trendline

PCE Concentration Trend Analysis
A-21 FIGURE
Bedding Plane Fracture
Bedrock Outcrop Near Site
MADISON-KIPP CORPORATION 201 WAUBESA STREET MADISON, WISCONSIN
2014 FATE AND TRANSPORT MODEL
Quantitative Trendline Qualitative Trendline

PCE Concentration Trend Analysis
A-22 FIGURE
Bedding Plane Fracture
Bedrock Outcrop Near Site
MADISON-KIPP CORPORATION 201 WAUBESA STREET MADISON, WISCONSIN
2014 FATE AND TRANSPORT MODEL
Quantitative Trendline Qualitative Trendline