Arcadis LLP - WordPress.com · 2017. 4. 14. · Appendix 7 – Bus Routes and Site Catchment...
70
traffic engineering and transport planning Arcadis LLP Proposed Secondary School (Bolder Academy) Macfarlane Lane, Isleworth Transport Assessment March 2017 Armstrong House, The Flemingate Centre, Beverley, HU17 0NZ 01482 679 911 [email protected] www.local-transport-projects.co.uk Registered No. 5295328
Transcript of Arcadis LLP - WordPress.com · 2017. 4. 14. · Appendix 7 – Bus Routes and Site Catchment...

traffic engineering and transport planning
Arcadis LLP
Proposed Secondary School
(Bolder Academy)
Macfarlane Lane, Isleworth
Transport Assessment
March 2017
Armstrong House, The Flemingate Centre, Beverley, HU17 0NZ 01482 679 911 [email protected] www.local-transport-projects.co.uk
Registered No. 5295328
Document Control www.local-transport-projects.co.uk
Arcadis LLP
Proposed Secondary School
(Bolder Academy)
Macfarlane Lane, Isleworth
Transport Assessment
March 2017
Client Commission
Client: Arcadis LLP Date Commissioned: August 2016
LTP Quality Control
Job No: LTP/16/2504 File Ref: Bolder Academy TA Final ISSUE 1
Issue Revision Description Originated Checked Date
1 - Final issue for planning JH SW 30/03/2017
Authorised for Issue: TK
LTP PROJECT TEAM As part of our commitment to quality the following team of transport professionals was assembled specifically for the delivery of this project. Relevant qualifications are shown and CVs are available upon request to demonstrate our experience and credentials.
Team Member LTP Designation Qualifications
Tony Kirby Director (Project Manager) IEng MSc MCIHT FIHE
Steven Windass Principal Transport Planner BSc (Hons) MSc (Eng) MCIHT MIHE
Jack Hearnshaw Transport Planner BA(Hons) MIHE
Chris Wilkinson Graduate Transport Planner BA(Hons)
Sophie Lee Assistant Transport Planner -
The contents of this document must not be copied or reproduced, in whole or in part, without the written consent of Local Transport Projects Ltd.

Bolder Academy Macfarlane Lane, Isleworth Transport Assessment
traffic engineering and transport planning Page 1 of 66
BOLDER ACADEMY
MACFARLANE LANE, ISLEWORTH
TRANSPORT ASSESSMENT
CONTENTS
EXECUTIVE SUMMARY ...............................................................................................................4 1.0 INTRODUCTION ..............................................................................................................4
1.1 Background ........................................................................................................................................... 5 1.2 Scope .................................................................................................................................................... 5
2.0 SITE BACKGROUND .........................................................................................................8 2.1 Site Location & Existing Use ................................................................................................................... 8 2.2 Development Proposals ......................................................................................................................... 9 2.3 Proposed Access Arrangements ............................................................................................................. 9 2.4 Proposed Parking Arrangements .......................................................................................................... 11 2.5 Planning History & Committed Developments ...................................................................................... 12
3.0 SITE ASSESSMENT ......................................................................................................... 15 3.1 Local Highway Network ....................................................................................................................... 15 3.2 Pedestrian Infrastructure..................................................................................................................... 17 3.3 Cycling Infrastructure .......................................................................................................................... 20 3.4 Public Transport Provision ................................................................................................................... 22
4.0 ROAD CASUALTY APPRAISAL ......................................................................................... 26 4.1 Introduction ........................................................................................................................................ 26 4.2 Casualties............................................................................................................................................ 27 4.3 Collision Conditions ............................................................................................................................. 28 4.4 Collision Times .................................................................................................................................... 28 4.5 Collision Locations ............................................................................................................................... 29 4.6 Road Safety Impact ............................................................................................................................. 30
5.0 TRIP GENERATION PROJECTIONS .................................................................................. 31 5.1 School Catchment Area ....................................................................................................................... 31 5.2 Pupil Modal Split & Person Trip Generation ......................................................................................... 32 5.3 Staff Modal Split & Person Trip Generation .......................................................................................... 34
6.0 TRAFFIC IMPACT ........................................................................................................... 36 6.1 Existing Network Traffic Flows ............................................................................................................. 36 6.2 Assessment Scenarios ......................................................................................................................... 36 6.3 Staff Traffic Distribution & Assignment ................................................................................................ 37 6.4 Pupil Traffic Distribution and Assignment ............................................................................................. 39 6.5 Impact at Local Junctions ..................................................................................................................... 41 6.6 Junction Capacity Assessments ............................................................................................................ 43 6.7 Impact on Local Highway Network ....................................................................................................... 56
7.0 PEDESTRIAN, CYCLE & PUBLIC TRANSPORT IMPACT ...................................................... 57 7.1 Impact on Pedestrian and Cycle Infrastructure ..................................................................................... 57 7.2 Impact on London Bus Network ........................................................................................................... 58 7.3 Impact on Train & London Underground Services ................................................................................. 59 7.4 Off-Site Highway Works ....................................................................................................................... 60
8.0 CONCLUSIONS .............................................................................................................. 61 9.0 REFERENCES ................................................................................................................. 65

Bolder Academy Macfarlane Lane, Isleworth
Transport Assessment
Page 2 of 66 www.local-transport-projects.co.uk
APPENDICES
Appendix 1 – Proposed Site Layout Plan
Appendix 2 – Proposed Macfarlane Lane Design
Appendix 3 – Access Management Strategy
Appendix 4 – Construction TMP
Appendix 5 – Macfarlane Lane/Syon Lane Works
Appendix 6 – PTAL Output
Appendix 7 – Bus Routes and Site Catchment
Appendix 8 – PIC Data
Appendix 9 – Catchment Area
Appendix 10 – Pupil Modal Split Projections
Appendix 11 – Network Traffic Flows
Appendix 12 – TEMPRO Growth
Appendix 13 – Staff Gravity Model
Appendix 14 – Staff Traffic Distribution
Appendix 15 – Pupil Home Location Zones
Appendix 16 – Pupil Gravity Model
Appendix 17 – Pupil Traffic Distribution
Appendix 18 – Network Diagrams
Appendix 19 – Syon Lane/Jersey Road Modelling
Appendix 20 – Syon Lane/Jersey Road Queues
Appendix 21 – Macfarlane/Syon Lane Modelling
Appendix 22 – Syon Lane/Tesco Modelling
Appendix 23 – Syon Lane/Grant Way Modelling
Appendix 24 – Syon Lane/A4 Modelling
Appendix 25 – Wood Lane/A4 Modelling
Appendix 26 – Thornbury Road/A4 Modelling
Appendix 27 – PERS/CERS Audit Report
Appendix 28 – Pupil Bus Use Projections
FIGURES
Figure 1: Site Location ................................................................................................................8
Figure 2: Cycle Time Isochrone ................................................................................................. 21
Figure 3: Local Cycle Routes ..................................................................................................... 21
Figure 4: PIC Study Area ........................................................................................................... 26
Figure 5: Gravity Model Zones.................................................................................................. 38

Bolder Academy Macfarlane Lane, Isleworth Transport Assessment
traffic engineering and transport planning Page 3 of 66
TABLES
Table 1: Local Bus Services ....................................................................................................... 23
Table 2: Sky Shuttle Bus Services .............................................................................................. 24
Table 3: Syon Lane Railway Services ......................................................................................... 24
Table 4: Collision History .......................................................................................................... 27
Table 5: Casualty Road User Groups ......................................................................................... 27
Table 6: Collision Conditions .................................................................................................... 28
Table 7: Collisions by Time of Year ........................................................................................... 28
Table 8: Collisions by Day and Time .......................................................................................... 29
Table 9: Mixed-Gender Hounslow Secondary Schools - 75th Quartile Travel Distances .............. 31
Table 10: Proposed Pupil Modal Split ....................................................................................... 32
Table 11: Two-Way Pupil Vehicle Trip Generation .................................................................... 34
Table 12: Proposed Staff Modal Split ........................................................................................ 34
Table 13: Two-Way Staff Vehicle Trip Generation ..................................................................... 35
Table 14: Staff Travel Gravity Model Results ............................................................................ 38
Table 15: Pupil Home Location Zones ....................................................................................... 39
Table 16: Pupil Travel Gravity Model Results ............................................................................ 40
Table 17: Predicted Traffic Impact at Local Junctions ................................................................ 41
Table 18: Windmill Lane/Syon Lane/Jersey Road Mini-Roundabout Capacity Assessment ........ 44
Table 19: Windmill Lane/Syon Lane/Jersey Road Mini-Roundabout Queue Lengths ................. 45
Table 20: Macfarlane Lane/Syon Lane Junction Capacity Assessment ....................................... 47
Table 21: Syon Lane/Tesco Roundabout Capacity Assessment.................................................. 48
Table 22: Syon Lane/Grant Way Mini-Roundabout Capacity Assessment.................................. 49
Table 23: Syon Lane/Great West Road (A4)/Harlequin Avenue Junction Capacity Assessment.. 51
Table 24: Wood Lane/Great West Road (A4) Junction Capacity Assessment ............................. 53
Table 25: Thornbury Road/Great West Road (A4) Junction Capacity Assessment ..................... 55
Table 26: Impact on Local Bus Services ..................................................................................... 58
PHOTOS
Photo 1: Macfarlane Lane ........................................................................................................ 15
Photo 2: Existing Macfarlane Lane/Syon Lane Junction ............................................................ 16
Photo 3: Gillette Corner Junction ............................................................................................. 16
Photo 4: Footpath Connecting Wood Lane with Syon Lane ....................................................... 18
Photo 5: Zebra Crossing on Syon Lane ...................................................................................... 18
Photo 6: Toucan Crossing Facility on Great West Road (A4)...................................................... 19
Photo 7: Puffin Crossing on Syon Lane...................................................................................... 19
Photo 8: Off-Road Facility on Great West Road ........................................................................ 22
Photo 9: Osterley Tesco Bus Stop ............................................................................................. 23
Photo 10: Syon Lane Railway Station ........................................................................................ 24
Bolder Academy Macfarlane Lane, Isleworth
Transport Assessment
Page 4 of 66 www.local-transport-projects.co.uk
EXECUTIVE SUMMARY
This Transport Assessment (TA) provides a detailed appraisal of the transport impacts associated
with proposals to construct a new secondary school (Bolder Academy) at the site of the existing
Grasshoppers Rugby Football Club (GRFC) at 1 Macfarlane Lane, Isleworth, Hounslow, TW7 5PN.
The proposed school will have a capacity of 1,150 pupils and will employ a total of 90 staff.
The proposed site will be accessed via Macfarlane Lane, which will be improved in order to
provide a 6.0m carriageway and a 3.0m footway on the northern side across the full length
between Syon Lane and the proposed site. A number of other public highway improvements are
to be made within the vicinity of the site. With the exception of Special Educational Needs (SEN)
pupils, pupil drop-offs and pick-ups will not be permitted on site or across the full length of
Macfarlane Lane. The car park of the nearby Tesco Extra store will be utilised as a park and stride
facility for the school.
The proposed development is located within a reasonable walking distance (up to 2km) of the
residential areas of Osterley and Isleworth which form part of the expected school catchment.
The pedestrian infrastructure within the vicinity of the site is generally well-developed, with
formal crossing facilities available at key junctions. The proposed site is located within a 15
minute cycle ride of a large catchment area, including Osterley, Brentford and Isleworth. Public
bus services available within the vicinity of the site include the H28 from Osterley Tesco and the
H91 from the A4. Syon Lane Railway Station is located 1.1km walk from the proposed site. Audits
have been undertaken of the local pedestrian and cycle infrastructure, with improvement
schemes identified.
A road casualty study showed that 88 collisions occurred within the local study area around the
proposed development site during the 5 year study period. Analysis of the study collisions has
not revealed any identifiable existing collision issues associated with the expected movements
generated by the proposed school.
The likely school catchment area has been determined based upon the distances travelled by
75% of pupils attending existing mixed-gender secondary schools in Hounslow. It is expected that
75% of pupils would travel to the site from within a 2.5km distance, including Osterley, Spring
Grove and parts of Isleworth and Brentford.
It is expected that approximately 15.4% of pupils would travel to the site by vehicle trip
generating modes (i.e. park and stride), with the remainder travelling by more sustainable
modes. Approximately 58% of staff could be expected to travel by vehicle trip generating modes.
The traffic generation projections indicate that the development could generate up to 378 two-
way vehicle trips during the AM peak hour (08:00-09:00) and 277 two-way trips during the school
PM peak hour (15:00-16:00). These projections are based upon a number of worst-case
assumptions.
Capacity assessments using industry standard modelling software have been undertaken at key
local junctions. Subject to the provision of a mitigation scheme at the Syon Lane/Tesco
roundabout, it is considered that the proposed development will not have a detrimental impact
on the operation of the local highway network.
Based on the assessments of this TA, it is considered that the proposed development would not
be expected to have a severe detrimental impact on the operation of the local highway network,
and is therefore in accordance with the ‘National Planning Policy Framework’ (NPPF).
Bolder Academy Macfarlane Lane, Isleworth Transport Assessment
traffic engineering and transport planning Page 5 of 66
1.0 INTRODUCTION
1.1 Background
1.1.1 Local Transport Projects Ltd has been commissioned to produce a Transport Assessment
(TA) which provides a detailed appraisal of all transport impacts associated with
proposals for Bolder Academy, to be located at 1 Macfarlane Lane, Isleworth, Hounslow,
TW7 5PN.
1.1.2 The development proposals include demolition of club house and associated car park
and Multi-Use Games Area, construction of a new part 2 - part 4 storey secondary school
(Use Class D1) with ancillary car parking, cycle parking, Multi-Use Games Area, hard and
soft landscaping and associated works, together with improvements to Macfarlane Lane.
The proposed school will have a capacity of 1,150 pupils and is expected to employ a
total of 90 staff.
1.1.3 A Travel Plan (LTP, 2017) that provides a strategy for encouraging sustainable travel at
the proposed school site has been produced in conjunction with this TA as a separate
document.
1.2 Scope
1.2.1 The proposals and scope of this TA have been discussed as part of pre-application
discussions with London Borough of Hounslow Council (LBHC) (Ref: Robert Heslop) and
Transport for London (TfL) (Ref: Arjun Singh) and has been produced in accordance with
the Government’s ‘Planning Practice Guidance’ (DCLG, 2014) and TfL’s ‘Transport
Assessment Guidance’ (TfL, 2015), as outlined below:
Executive Summary: A non-technical summary of the report outlining the key
outcomes of the assessment.
Introduction & Description of Proposals:
o Description of the development site, including location and existing access arrangements;
o Summary of relevant planning and allocation history for the site; o Description of the proposed development including site layout, pedestrian/cycle
facilities and proposed access arrangements.
Site Assessment:
o Site assessments to determine existing traffic conditions, such as posted speed limits, road restrictions, highway geometry, on-street parking restrictions and any other relevant features of the local area;
o Assessment of the sustainable transport infrastructure (pedestrian, cycle and public transport) local to the site and identification of any opportunities for enhancing the accessibility of the site by sustainable modes, including a Public Transport Accessibility Level (PTAL) assessment;
o Assessment of the likely school catchment area and the potential for trips to be made to the site by sustainable modes of transport;

Bolder Academy Macfarlane Lane, Isleworth
Transport Assessment
Page 6 of 66 www.local-transport-projects.co.uk
o Establish the baseline traffic situation during network peak hours at the following locations: Windmill Lane/Syon Lane/Jersey Road/Osterley Lane mini-roundabout; Syon Lane/Macfarlane Lane junction; Syon Lane/Tesco access roundabout; Syon Lane/Grant Way mini-roundabout; Syon Lane/Great West Road (A4) signal junction; Wood Lane/A4 signal junction; and Thornbury Road/A4 signal junction.
Road Casualty Appraisal: Examination of road collision records (5 year study period)
and assessment of the road safety impact of the proposed development on the local
highway network.
Traffic Impact:
o Calculation of the projected trip generation for the proposed development. These projections will include consideration of the trip generation potential of the site for all modes of travel, not just vehicular traffic;
o Consideration of any relevant consented developments within the local area and any committed changes to the surrounding highway network;
o Predicted distribution of the vehicle trips generated by the site onto the local highway network;
o Calculation of suitable future traffic growthing factor(s) utilising the DfT’s approved models and software;
o Assessment of the likely traffic impact of the proposed development on the operation of the local highway network, to include junction capacity assessments at the following key local junctions: Windmill Lane/Syon Lane/Jersey Road/Osterley Lane mini-roundabout; Syon Lane/Macfarlane Lane junction; Syon Lane/Tesco access roundabout; Syon Lane/Grant Way mini-roundabout; Syon Lane/Great West Road (A4) signal junction; Wood Lane/A4 signal junction; and Thornbury Road/A4 signal junction.
Public Transport Capacity: Assessment of the likely impact of the development on
the London bus network.
PERS/CERS Assessment: Assessment of the suitability of the local pedestrian and
cycle infrastructure utilising TfL recognised Pedestrian Environment Review System
(PERS) and Cycling Environment Review System (CERS) software;
Access, Parking & Internal Layout: Description of the proposed access arrangements
and internal layout of the site, including consideration of the proposed parking
provision, access/servicing arrangements and suitability of the proposed access
junction(s).
Conclusions: Conclusions summarising the outcomes of the TA, including a
commentary on the suitability of the proposals in terms of traffic impact and road
safety.

Bolder Academy Macfarlane Lane, Isleworth Transport Assessment
traffic engineering and transport planning Page 7 of 66
1.2.2 This report has been prepared in accordance with the above scope and reference has
been made to the following documents where appropriate:
The London Plan - updated March 2016 (MoL, 2016);
Transport Assessment Guidance (TfL, 2015);
Planning Practice Guidance (DCLG, 2014);
National Planning Policy Framework (DCLG, 2012);
Mayor’s Transport Strategy (GLA, 2010);
Manual for Streets 2: Wider Application of the Principles (CIHT, 2010);
Guidance on Transport Assessment (DfT, 2007a); and
Manual for Streets (DfT, 2007b).

Bolder Academy Macfarlane Lane, Isleworth
Transport Assessment
Page 8 of 66 www.local-transport-projects.co.uk
2.0 SITE BACKGROUND
2.1 Site Location & Existing Use
2.1.1 The proposed site is located to the north and west of Macfarlane Lane in Isleworth,
London Borough of Hounslow. It is currently understood to be Metropolitan Open Land
(MOL), accommodating Grasshoppers Rugby Football Club (GRFC). It is bound by further
MOL to the north-east, Macfarlane Lane and the Sky campus to the south-east, Goals
Football Centre to the south-west and Wyke Green Golf Club to the north-west. The site
is to be accessed via Macfarlane Lane, which is understood to be a private road. The
approximate boundary of the site is shown in Figure 1:
Figure 1: Site Location
Source Imagery: Copyright Google Earth Pro (License Key-JCPMR5M58LXF2GE)
2.1.2 Macfarlane Lane currently provides access to Goals Football Centre, GRFC and overflow
parking areas for the Sky campus and Cole Van Hire. It is understood that Sky currently
has agreements with both Goals and GRFC for use of part of their parking areas during
the daytime period Monday to Friday.

Bolder Academy Macfarlane Lane, Isleworth Transport Assessment
traffic engineering and transport planning Page 9 of 66
2.2 Development Proposals
2.2.1 This TA is based upon the proposals outlined on the site plan attached as Appendix 1.
The proposals involve the construction of a new secondary school which will have a total
capacity of 1,150 pupils and will be known as Bolder Academy. The main school building
will be provided on largely brownfield land within the southern part of the site, with
sports pitches provided to the north. A proposed site layout plan is included as Appendix
1.
2.2.2 The school will accommodate up to 180 pupils in each academic year (Years 7 to 11),
giving 900 places for pupils aged 11-16. A sixth-form with 250 places will also be
provided. The school includes 25 places for Special Educational Needs (SEN) pupils.
Under the current proposals, the school will have an initial Year 7 intake of 150 pupils,
with a phased intake of 180 pupils per year thereafter up to a capacity of 1,150 pupils.
2.2.3 The school is expected to employ a total of 90 members of staff upon full occupation of
the site, with staff numbers expected to increase incrementally alongside pupil numbers.
2.2.4 The site is expected to have facilities available for community use, including floodlit
playing pitches and Multi-Use Games Areas (MUGAs), the Sports Hall, Activity Studio,
Main Hall, Drama Studio and several seminar learning spaces. It should be noted that this
community use would be outside of the typical network peak hours (evenings, weekends
and school holidays) and would serve a local catchment area, therefore it is considered
that a high proportion of trips would be made by sustainable modes.
2.2.5 The timings of the school day are to be confirmed, although it is expected that times will
be staggered with the nearby Nishkam School to avoid conflict between the two sites.
2.2.6 A planning application for the proposed relocation of GRFC to a new site located at
Conquest Club on Syon Lane (adjacent to the recently approved Nishkam School
development) was submitted to LBHC on 20th July 2016 and is currently pending
consideration. The planning history of the site and local area is discussed further within
Section 2.4.
2.3 Proposed Access Arrangements
2.3.1 Access to the site by all modes will be via Macfarlane Lane, a private road that connects
with Syon Lane at a priority junction to the south-west of the site. It is proposed to
provide a number of highway improvements on Macfarlane Lane in order to
accommodate the proposed development, and preliminary highway access drawings
showing the proposed access arrangements are included as Appendix 2.
2.3.2 Design proposals include the widening of the carriageway from 4.8m to 6.0m in order to
ensure the safe flow of two-way traffic. Improved and additional traffic calming
measures are to be provided along Macfarlane Lane as part of the development.
2.3.3 Under the development proposals, Macfarlane Lane will serve Bolder Academy and
Goals Football Centre only. Access will be retained to the Sky campus for a potential
future pedestrian and cycle link to Boston Manor. Two existing pedestrian accesses to
the Tesco site are to be retained to the car park and garden area.

Bolder Academy Macfarlane Lane, Isleworth
Transport Assessment
Page 10 of 66 www.local-transport-projects.co.uk
2.3.4 Further details as to how Macfarlane Lane will be managed to accommodate all users are
contained within the Access Management Strategy, which is included as Appendix 3. A
Construction Traffic Management Plan (CTMP) that provides a strategy for managing the
movement of traffic during the construction phase of the development is included as
Appendix 4.
2.3.5 There will be no provision for pupil drop-offs and pick-ups on site (with the exception of
Special Educational Need (SEN) pupils), and such trips will not be permitted on-site or on
Macfarlane Lane. Waiting restrictions are in place on Syon Lane within the vicinity of the
Macfarlane Lane junction, restricting such movements on Syon Lane.
2.3.6 Given these drop-off and pick-up restrictions, the car park of the nearby Tesco Extra store
will be designated as a park and stride for the school. The Travel Plan for the site (LTP,
2017) outlines the strategy for maximising trips by sustainable modes, however all
parents/guardians of pupils travelling by car will be expected to utilise the park and stride
facility. The park and stride facility has been discussed with Tesco, and although a formal
agreement has not yet been made, Tesco note that there are no restrictions in place on
site which would stop parents from utilising the car park in this manner.
2.3.7 It is envisaged that the impact of the development on the highway network will be
minimised by providing a park and stride facility, with no drop-offs and pick-ups occurring
on streets surrounding the site. Pupil drop-offs and pick-ups are therefore not expected
to have an impact on the free-flow of traffic within the vicinity of the site. The traffic
impact of the proposals on links and junctions local to the site is considered further
within Section 6.5 of this TA.
2.3.8 The proposals include the provision of a continuous 3.0m footway along the full extents
of Macfarlane Lane on the northern side of the carriageway. This footway is proposed to
be provided adjacent to the carriageway for approximately 130m, before transferring to
the northern side of the tree line and connecting with the existing footway within the
Goals site, which is to be improved and widened as part of the development. A footway
is also to be provided on the northern side of Macfarlane Lane adjacent to the
carriageway from the existing pedestrian access to the Tesco Garden to the Goals Access.
An improved pedestrian crossing facility, with dropped kerbs and tactile paving on a
raised table, is to be provided across the Goals access, and a continuous footway will be
provided along the northern side of Macfarlane Lane from the Goals Football Centre to
the existing northern end of Macfarlane Lane.
2.3.9 The proposed school building will have 3 pedestrian access points, including 2 to the
south of the building (including the main entrance) which will serve the majority of
pedestrian trips, and 1 to the north-east, which will serve pedestrian trips to/from the
proposed car park and coach bays.

Bolder Academy Macfarlane Lane, Isleworth Transport Assessment
traffic engineering and transport planning Page 11 of 66
2.3.10 In addition to the carriageway widening and footway works on Macfarlane Lane, the
following off-site highway works are proposed to be provided as part of the development
proposals:
The provision of a zebra crossing in place of the existing dropped kerb crossing with
central island on Syon Lane, to the north of the Macfarlane Lane junction;
Widening of Syon Lane in order to provide a ghost-island right-turn lane to serve
Macfarlane Lane. This will ensure that the free-flow of traffic on Syon Lane is
maintained. Kerbing works will also be undertaken at the Macfarlane Lane junction
to tie-in with proposals to widen the carriageway.
2.3.11 A preliminary design drawing showing the proposed works is included as Appendix 5.
2.4 Proposed Parking Arrangements
2.4.1 A total of 57 car parking spaces will be provided at the site, including 47 standard bays,
3 visitor bays plus 7 accessible bays. The majority of spaces will be provided within the
main site car park to the north of the main school building, with the visitor parking and
3 accessible bays provided near to the main entrance to the school, adjacent to
Macfarlane Lane.
2.4.2 Guidance within ‘The London Plan’ (MoL, 2016) states that the level of parking should be
determined by the Transport Assessment, with consideration of impact on traffic
congestion and availability of on and off-street parking. Given that there is no on-street
parking available within the vicinity of the site and that approximately 58% of staff could
be expected to travel by vehicle trip generating modes (see Section 5.3), it is considered
that the proposed level of parking provision is suitable, and accounts for the potential
reduction in staff car trips set out within the Travel Plan (LTP, 2017), but also allows
suitable provision for visitors.
2.4.3 In order to encourage cycling amongst pupils and staff, a total of 150 cycle parking spaces
will be provided in secure cycle stores in several locations around the proposed
development. This provision is in line with adopted cycle parking standards of the London
Plan (MoL, 2016).
2.4.4 A total of 9 parking spaces will be provided with Electric Vehicle (EV) charging points,
with passive provision at a further 7 spaces to enable simple installation and activation
of a charge point at a future date. Guidance within ‘The London Plan’ (MoL, 2016) states
that 1 in 5 parking spaces should provide an EV charging point. It is therefore considered
that the proposed provision is in line with London Plan standards.
2.4.5 A turning circle will be provided on-site, adjacent to the main access from Macfarlane
Lane in order to accommodate buses and coaches. A total of 3 coach parking bays will be
provided on-site.
Bolder Academy Macfarlane Lane, Isleworth
Transport Assessment
Page 12 of 66 www.local-transport-projects.co.uk
2.5 Planning History & Committed Developments
2.5.1 As agreed with LBHC, there are a number of committed developments within the vicinity
of the site that need to be considered as part of the assessments of this TA. A summary
of the committed developments that have been referenced within the remainder of this
TA is provided below:
A planning application for the redevelopment of land at Gillette Corner to the south
of the A4 and north of Northumberland Avenue to provide a mixed-use development
consisting of 102 residential units, office and self-storage uses was submitted to LBHC
on 5th January 2017 (planning reference: 00505/AF/P27). The application was
supported by a TA (TTP, 2016a) and Residential Travel Plan (TTP, 2016b) and is
pending consideration at the time of writing. The traffic flows associated with the
development have been explicitly included as part of the traffic impact analysis of this
TA.
A planning application for the relocation of Grasshoppers Rugby Football Club from
the proposed development site on Macfarlane Lane to new facilities at the former
Conquest Club site to the west of Syon Lane was submitted to LBHC on 20th July 2016
(planning reference: 01255/D/P2). The application was supported by a Transport
Statement (TS – PE, 2016a), TP (PE, 2016b) and subsequent Addendum Report (PE,
2016c) and is pending consideration at the time of writing. The traffic flows associated
with the development have been explicitly included as part of the traffic impact
analysis of this TA.
A planning application for the erection of an All Through Free School (herein referred
to as “Nishkam School”) at the former Conquest Club site to the west of Syon Lane
was submitted to LBHC on 18th June 2015 (planning reference: 01106/152/P3). The
application was supported by a number of technical assessments, including a TA (SA,
2015a), TP (SA, 2015b), Technical Note Addendum (SA, 2015c) and PERS Audit (TRL,
2015) and was afforded planning approval (subject to a Section 106 agreement) on
25th January 2016. The traffic flows associated with the development have been
explicitly included as part of the traffic impact analysis of this TA.
An outline planning application for the redevelopment of the British Sky Broadcasting
campus (herein referred to as “Sky campus”) on Grant Way was submitted to LBHC
on 16th July 2013 (planning reference: 00558/A/P51). The application was supported
by a TA (ARUP, 2013), with an updated Travel Plan (ARUP, 2016) submitted as part of
a subsequent reserved matters application. The outline application was afforded
planning approval on 20th December 2013. The traffic flows associated with the
development have been explicitly included as part of the traffic impact analysis of this
TA.

Bolder Academy Macfarlane Lane, Isleworth Transport Assessment
traffic engineering and transport planning Page 13 of 66
An outline planning application for the redevelopment of land to the south of
Brentford High Street and Waterside to provide a mixed-use development was
submitted to LBHC on 18th September 2012 (planning reference: 00607/BA/P2). The
application was supported by a TA (WSP, 2012) and TA Addendum report (WSP, 2013)
and was afforded planning approval (subject to a Section 106 agreement) on 2nd April
2015. The assessments of the TA and subsequent Addendum report demonstrate that
the proposed development is not expected to have a significant impact on the study
area junctions, with any minor increase in flows accounted for in the typical growth
projections.
A planning application for a mixed-use development at Wallis House, 961 Great West
Road was submitted to LBHC on 17th August 2012 (planning reference: 00505/P/P97).
The submitted scheme was an amendment to a planning application at the same site
which gained approval in October 2005. The revised application was supported by a
Technical Note (WSP, 2012) which concluded that the development would not have
a material impact on the highway network when compared to the previously
approved scheme. The application was approved by LBHC on 8th February 2013. The
transport assessment work undertaken as part of the proposals demonstrate that the
proposed development is not expected to have a significant impact on the study area
junctions, with any minor increase in flows accounted for in the typical growth
projections.
An outline planning application for the redevelopment of Commerce Road Industrial
Estate to provide a mixed-use development was submitted to LBHC on 27th October
2010 (planning reference: 00297/R/P3). The application was supported by a TA and
draft TP (CB, 2010) and was afforded planning approval (subject to a Section 106
agreement) on 21st March 2012. A number of reserved matters applications have
subsequently been submitted and the development is understood to be currently
under construction. The assessments of the TA (CB, 2010) demonstrate that the
proposed development is not expected to have an impact on the study area junctions,
with any minor increase in flows accounted for in the typical growth projections.
A planning application for the redevelopment of the Gillette Building and Gillette
Corner site to provide a mixed-use development, including a hotel and offices was
originally approved by LBHC on 22nd November 2007 (application reference:
00505/AP/L22. An extension of time application for the development was submitted
on 3rd September 2010 and was subsequently approved on 30th December 2010
(application reference: 00505/AP/P75). The extension of time application was
supported by a TA Addendum report (MTP, 2010) which provided an update of the
impact of the proposed development. The traffic flows associated with the
development have been explicitly included as part of the traffic impact analysis of this
TA.

Bolder Academy Macfarlane Lane, Isleworth
Transport Assessment
Page 14 of 66 www.local-transport-projects.co.uk
A planning application for the redevelopment of the Alfa Laval site on the Great West
Road (A4) to provide a mixed-use development including hotels, offices and
residential units was submitted to LBHC on 26th June 2009 (planning reference:
00505/Z/P33). The application was supported by a TA (WSP, 2009) and was afforded
planning approval (subject to a Section 106 agreement) on 1st July 2011. The
development is currently understood to be under construction. The assessments of
the TA (WSP, 2009) demonstrate that the proposed development is not expected to
have a significant impact on the study area junctions, with any minor increase in flows
accounted for in the typical growth projections.
2.5.2 With the exception of the proposals to relocate Grasshoppers Rugby Club away from the
proposed development site, it is understood that there have been no other relevant,
recent planning applications relating to the site.

Bolder Academy Macfarlane Lane, Isleworth Transport Assessment
traffic engineering and transport planning Page 15 of 66
3.0 SITE ASSESSMENT
3.1 Local Highway Network
3.1.1 Access to the site by all modes will be via Macfarlane Lane to the south of the site.
Macfarlane Lane is a private two-way single carriageway that connects the proposed
development site with Syon Lane (B454). It is a cul-de-sac that is approximately 400m in
length and currently provides access to Goals Football Centre, Grasshoppers Rugby Club
and also serves overflow parking for the Sky campus. Speed ramps are provided along
the lane and the carriageway is approximately 4.8m in width. No Waiting At Any Time
(NWAAT) restrictions are in place on both sides of the carriageway between the junction
with Syon Lane and Goals Football Centre, although as a private road, it is assumed that
these are also privately enforced.
Photo 1: Macfarlane Lane
3.1.2 As previously outlined, a number of highway improvements are to be provided on
Macfarlane Lane as part of the development proposals, including the widening of the
carriageway to 6.0m and the provision of a 3.0m footway on the northern side between
Syon Lane and the proposed school.
3.1.3 Macfarlane Lane connects with Syon Lane at a simple priority junction to the south-west
of the site. The existing junction is to be improved as part of the development proposals
in order to provide a ghost-island right-turn lane for traffic turning from Syon Lane in to
Macfarlane Lane.

Bolder Academy Macfarlane Lane, Isleworth
Transport Assessment
Page 16 of 66 www.local-transport-projects.co.uk
Photo 2: Existing Macfarlane Lane/Syon Lane Junction
3.1.4 Syon Lane forms part of the B454 route and meets Jersey Road/Windmill Lane/Osterley
Lane at a mini-roundabout approximately 600m to the north, ultimately connecting with
London Road (A315) approximately 1.1km to the south-east. There are a number of
junctions along Syon Lane within the vicinity of the site, including a roundabout at the
access to the Tesco Extra store, a mini-roundabout at the junction with Grant Way
(serving the Sky campus) and a signalised junction with the A4 at Gillette Corner. The A4
(Great West Road) is a major arterial route through West London that forms part of the
Transport for London Road Network (TLRN).
Photo 3: Gillette Corner Junction
3.1.5 Within the immediate vicinity of the Macfarlane Lane junction, Syon Lane is a two-way
single carriageway that is subject to a 30mph speed limit. It is understood that a 20mph
zone is to be introduced on Syon Lane to the north-west of Macfarlane Lane as part of
the approved Nishkam School development.

Bolder Academy Macfarlane Lane, Isleworth Transport Assessment
traffic engineering and transport planning Page 17 of 66
3.1.6 A Controlled Parking Zone (CPZ) was recently implemented in the area surrounding the
site, with double yellow lines provided on both sides of the carriageway across much of
Syon Lane. The parking bays which are provided on the north-eastern side of the
carriageway near to the Macfarlane Lane junction are for use by resident permit holders
only. All parking on Gower Road, Oaklands Avenue and Stags Way is also for resident
permit holders only.
3.2 Pedestrian Infrastructure
3.2.1 Guidance from Chartered Institution of Highways & Transportation (CIHT) suggests a
preferred maximum walking distance of 2km for a number of journeys, including
commuting and school trips (IHT, 2000). The proposed development site is located within
a reasonable walking distance (up to 2km) of the residential areas of Osterley and
Isleworth, which are primarily located to the south and west of the site.
3.2.2 There is a footway on the southern side of Macfarlane Lane at the western end. A
crossing point with dropped kerbs and tactile paving is provided approximately 140m
west of the Syon Lane junction and the footway then continues on the northern side.
Dropped kerbs and tactile paving are provided across the access to Goals Football Centre.
As previously outlined, a 3.0m footway is to be provided on the northern side of the
carriageway across the full length of Macfarlane Lane, providing a continuous link
between Syon Lane and the site. The existing crossing of the Goals Football Centre access
road is to be improved, with a dropped crossing provided on a raised table. The existing
footway on the southern side of Macfarlane Lane will be removed as part of the
proposals.
3.2.3 There is a footpath located to the north of the Tesco store and to the south of the Sky
campus which provides a traffic free pedestrian link between Macfarlane Lane and Grant
Way. This may be utilised by pupils and staff travelling to and from the proposed site and
connects with the existing footway provision on the western side of Grant Way and the
proposed provision on Macfarlane Lane. There is also a gate on Macfarlane Lane which
provides access to the Tesco car park. This will be useful to pupils walking between the
site and the proposed Park and Stride facility at Tesco.
3.2.4 The pedestrian provision on Macfarlane Lane connects with the existing footway
provision on Syon Lane. A crossing point with dropped kerbs, tactile paving and central
refuge island is provided on Syon Lane to the north of the Macfarlane Lane junction,
allowing pedestrians to utilise the footpath which connects Syon Lane and Wood Lane.
The Syon Lane crossing is to be upgraded to a zebra crossing as part of the development
proposals. It is understood that the existing dropped crossing with a central island where
the footpath emerges on to Wood Lane is to be upgraded to a zebra crossing as part of
the Nishkam School development.

Bolder Academy Macfarlane Lane, Isleworth
Transport Assessment
Page 18 of 66 www.local-transport-projects.co.uk
Photo 4: Footpath Connecting Wood Lane with Syon Lane
3.2.5 Footways are generally provided on both sides of Syon Lane to both the north and south
of the site. As part of the recently approved Nishkam School, it is proposed to provide a
zebra crossing on Syon Lane between the junctions of Stag Way and Gower Road to
enhance the local pedestrian infrastructure.
3.2.6 Dropped kerb crossing points with central refuge islands are provided across all arms of
the Tesco access roundabout and on the Grant Way arm of the mini-roundabout to the
south of the site. A zebra crossing with central island is provided to the east of the Grant
Way mini-roundabout which links the northern and southern footways on Syon Lane.
Photo 5: Zebra Crossing on Syon Lane

Bolder Academy Macfarlane Lane, Isleworth Transport Assessment
traffic engineering and transport planning Page 19 of 66
3.2.7 There are footways provided on both sides of the A4 to the south of the site, connecting
with other footway provision on local residential streets. A toucan crossing (see Photo 6)
is provided across the A4 on the western side of the junction with Syon Lane, which helps
to facilitate pedestrian access between the site and residential areas to the south. A
crossing point with dropped kerbs and tactile paving is provided across the northern arm
of Syon Lane at the A4 signal junction, however there is no dedicated pedestrian phase.
There is also a subway on the eastern side of the junction which provides a pedestrian
connection between the northern and southern arms of Syon Lane.
Photo 6: Toucan Crossing Facility on Great West Road (A4)
3.2.8 A staggered pelican crossing is provided across Syon Lane to the south of the A4 junction,
however this is offset from the A4 and is located to the south of the Northumberland
Avenue junction. There is also a puffin crossing (see Photo 7) near to Syon Lane Rail
Station, facilitating pedestrian connections between the eastern and western footways
on Syon Lane.
Photo 7: Puffin Crossing on Syon Lane

Bolder Academy Macfarlane Lane, Isleworth
Transport Assessment
Page 20 of 66 www.local-transport-projects.co.uk
3.2.9 Toucan crossings are provided across Harlequin Avenue and across the A4 to the west of
the Harlequin Avenue junction to the south of the site. These crossings facilitate
pedestrian links between the footways on the A4 and provide pedestrian connections
between the site and Brentford.
3.2.10 The footways in the local area appear to generally be of adequate width and surface
quality, with street lighting provided throughout.
3.2.11 At the request of attendees at the public consultation events for the scheme, the
potential for providing a pedestrian link to Macfarlane Lane via Harlequin Avenue has
been investigated, however it is considered not to be feasible due to significant third
party ownership and conflict of users. Furthermore, at best, this route would only be
approximately 250m (0.16 miles) shorter walking distance than the existing route via
Syon Lane.
3.2.12 A Pedestrian Environment Review System (PERS) audit has been undertaken In order to
assess the suitability of the local pedestrian network to accommodate the pedestrian
trips likely to be generated by the site. The audit is discussed further within Section 7.1
of this TA.
3.2.13 Measures to promote and encourage walking trips to the site are outlined within the site
Travel Plan (LTP, 2017).
3.3 Cycling Infrastructure
3.3.1 Cycling is a low cost and healthy alternative to car use, which can substitute for short car
trips, or can form part of a longer journey by public transport. The DfT state that “in
common with other modes, many utility cycle journeys are under three miles (5km),
although, for commuter journeys, a trip distance of over five miles (8km) is not
uncommon” (DfT, 2008).
3.3.2 Figure 2 shows the areas surrounding the site that it is anticipated can be reached within
a less than 15 minute, 15-30 minute and 30-45 minute cycle ride for the baseline AM
peak. This isochrone is derived from the travel time estimations using the online TfL
WebCAT mapping facility. This illustrates that the proposed site is located within a
reasonable cycle ride, up to 5km (approximately 15 minutes at the average cycling speed
of 12mph), of a large catchment area, including Osterley, Brentford, Isleworth and South
Ealing.

Bolder Academy Macfarlane Lane, Isleworth Transport Assessment
traffic engineering and transport planning Page 21 of 66
Figure 2: Cycle Time Isochrone
Source: WebCAT (TfL, 2017)
3.3.3 The cycling facilities within the vicinity of the site are shown on the extract from the local
area cycle map in Figure 3:
Figure 3: Local Cycle Routes
Source: London Cycling Guide 6 (TfL, 2013)

Bolder Academy Macfarlane Lane, Isleworth
Transport Assessment
Page 22 of 66 www.local-transport-projects.co.uk
3.3.4 There are off-road shared-use foot/cycleways provided on both sides of Great West Road
(A4) to the south of the site, with the provision continuing on-road through the Gillette
Corner junction. As previously outlined, toucan crossings are provided across the A4 to
the west of both Syon Lane and Harlequin Avenue. To the west of the site, Wood Lane is
traffic calmed and is designated as a suggested cycle route. Osterley Lane provides a
largely traffic free route between Syon Lane and the area of Norwood Green and Southall
to the north-west of the site.
Photo 8: Off-Road Facility on Great West Road
3.3.5 A Cycling Environment Review System (CERS) audit has been undertaken In order to
assess the suitability of the local cycle infrastructure to accommodate the cycling trips
likely to be generated by the site. The audit is discussed further within Section 7.1 of this
TA.
3.3.6 Measures to promote and encourage cycling trips to the site are outlined within the site
Travel Plan (LTP, 2017).
3.4 Public Transport Provision
3.4.1 An assessment of the site has been undertaken using the TfL PTAL database. PTAL
measures the accessibility of public transport services in the vicinity of a development
site by measuring walking distances along footways. The generally acceptable walking
time to a bus stop under the assessment is 8 minutes and to an underground/rail station
is 12 minutes.
3.4.2 Although there are bus and rail services available within the vicinity of the site, the PTAL
assessment considered these services to be marginally outside the recommended
walking distances, therefore the site was found to have a PTAL rating of 0. The PTAL
report is included as Appendix 6.
3.4.3 The nearest bus stop to the proposed school site is Osterley Tesco, which is located an
approximately 590m walk to the south. Continuous footways are provided between the
site and the bus stop via Macfarlane Lane, Syon Lane and the Tesco access road.

Bolder Academy Macfarlane Lane, Isleworth Transport Assessment
traffic engineering and transport planning Page 23 of 66
3.4.4 Additional bus stops are available on Great West Road (A4), an approximately 950m walk
from the site and accessible via continuous footways and crossing points on Macfarlane
Lane, Syon Lane and the A4. Details of the services available from the local stops are
provided within Table 1:
Table 1: Local Bus Services
Route No. Route Mon-Fri Frequency*
Bus Services from Osterley Tesco (within 590m walk) and Wood Lane (within 750m walk)
H28
Osterley Tesco – Syon Lane – West Middlesex Hospital – Wood Lane/Braybourne Drive – Osterley Library – Hounslow East – Hounslow – Hanworth Road – Wellington Road North – Springwell Road – Cranford Lane – Bulls Bridge Tesco
Every 20 Minutes
Bus Services from Great West Road (within 950m walk)
H91 Hammersmith – Ravenscourt Park – Stamford Brook – Turnham Green – Gunnersbury – Great West Road – Osterley – Lampton – Hounslow West
Every 10 Minutes
3.4.5 Table 1 shows that frequent services are available from the local bus stops, which provide
access to a number of residential areas. A plan showing the routes taken by the above
services and how these routes relate to the proposed catchment area is included as
Appendix 7. This demonstrates that the routes provide good coverage within the
catchment area, and also extend to areas slightly beyond, including Brentford and
Hounslow. It is therefore considered that there is potential to encourage pupils at the
school to travel by bus. It is also noted that these services also provide the opportunity
to connect with other bus routes, as well as London Underground (LU) and National Rail
services.
Photo 9: Osterley Tesco Bus Stop
3.4.6 Children aged 11-15 are able to travel free on TfL buses with an 11-15 Zip Oyster
Photocard and are eligible for child fares on LU and National Rail services. Children that
live in a London Borough can apply for their Zip Oyster Photocards online or at a Post
Office.

Bolder Academy Macfarlane Lane, Isleworth
Transport Assessment
Page 24 of 66 www.local-transport-projects.co.uk
3.4.7 It is understood that the Sky campus operates a number of dedicated shuttle buses for
staff and subject to agreement with Sky, these buses may also be used by school staff.
The buses will not be available for use by pupils. A summary of the Sky shuttle bus
services is provided within
Table 2: Sky Shuttle Bus Services
Route No. Route Mon-Fri Peak Time Frequency*
S1 Grant Way – Osterley Tube Station – Grant Way – West Cross House – Grant Way
Every 8-10 Minutes
S2A/S2C Grant Way – West Cross House – Gunnersbury – Chiswick Park – Acton Town – Grant Way
Every 15 Minutes
S3 Grant Way – West Cross House – Ealing Broadway – Grant Way Every 20 Minutes
3.4.8 The site is located approximately 1.1km from Syon Lane Rail Station, which forms part of
the Hounslow Loop railway line. A summary of the services available from Syon Lane is
provided within Table 3:
Table 3: Syon Lane Railway Services
Route Mon-Fri Frequency*
London Waterloo – Vauxhall – Queenstown Road – Clapham Junction – Wandsworth Town – Putney – Barnes Then loops in both directions via Barnes Bridge – Chiswick – Kew Bridge – Brentford – Syon Lane – Isleworth – Hounslow – Whitton – Twickenham – St Margarets – Richmond – North Sheen - Mortlake
Every 30 Minutes each direction
London Waterloo – Vauxhall – Queenstown Road – Clapham Junction – Wandsworth Town – Putney – Barnes – Barnes Bridge – Chiswick – Kew Bridge – Brentford – Syon Lane – Isleworth – Hounslow – Feltham – Ashford – Staines – Egham – Virginia Water – Chertsey – Addlestone - Weybridge
Every 30 Minutes each direction
Photo 10: Syon Lane Railway Station

Bolder Academy Macfarlane Lane, Isleworth Transport Assessment
traffic engineering and transport planning Page 25 of 66
3.4.9 The nearest point of access to London Underground services is Osterley, approximately
1.9km to the west. Although Boston Manor is located in closer proximity to the site
(780m as the crow flies), the walking distance to this station is much further due to the
physical barriers of a railway line and the M4 motorway. Osterley is located on the
Heathrow branch of the Piccadilly Line, with services operating between Heathrow and
Arnos Grove/Cockfosters approximately every 5 minutes during peak periods.
3.4.10 Continuous walking routes are provided between the site and both Syon Lane Rail Station
and Osterley Underground Station, therefore both are considered to be accessible from
the proposed site. Given the relatively close catchment area, it is not anticipated that a
high proportion of pupils would travel by train or London Underground services, however
a number of staff at the site may travel by these modes.

Bolder Academy Macfarlane Lane, Isleworth
Transport Assessment
Page 26 of 66 www.local-transport-projects.co.uk
4.0 ROAD CASUALTY APPRAISAL
4.1 Introduction
4.1.1 Personal Injury Collision (PIC) data for the highway network local to the proposed
development site for the most recent available 5 year study period (01/10/2011 to
30/09/2016) was obtained via a search of the Department for Transport’s road safety
data (DfT, 2016). It is noted that the 2016 data is provisional and subject to change. At
the time of writing, data for August and September 2016 had not yet been released by
the Metropolitan Police and was therefore unavailable from the DfT.
4.1.2 A total of 88 collisions occurred within the study area, which includes parts of Syon Lane,
Wood Lane and the A4 corridor. The study area is outlined within Figure 4 and the
locations of the collisions are indicated on the plan attached as Appendix 8.
Figure 4: PIC Study Area
Source Imagery: Copyright Google Earth Pro (License Key-JCPMR5M58LXF2GE)
4.1.3 A total of 115 casualties resulted from the 88 recorded injury collisions during the study
period. Table 4 below outlines the collision history of the study area.

Bolder Academy Macfarlane Lane, Isleworth Transport Assessment
traffic engineering and transport planning Page 27 of 66
Table 4: Collision History
Year 1 2 3 4 5
Total From 01/10/11 01/10/12 01/10/13 01/10/14 01/10/15
To 30/09/12 30/09/13 30/09/14 30/09/15 30/09/16
Fatal - - - 2 - 2
Serious - 1 - 2 1 4
Slight 16 11 14 24 17 82
Total 16 12 14 28 18 88
4.1.4 The collision records show that the number of PICs per year has remained relatively
consistent throughout the study period, albeit with a spike in collisions during year 4 of
the study period. There were 6 KSI collisions (Killed or Seriously Injured), therefore the
severity ratio is 6.8%.
4.2 Casualties
4.2.1 Table 5 provides a breakdown of the casualties according to mode of travel and age
group:
Table 5: Casualty Road User Groups
Age (years)
Road User Group 0 to 15 16 to 20 21 to 25 26 to 45 46 to 65 66+ Unknown Total %
Pedestrian 2 1 3 2 4 - 2 14 12.2%
Cyclist - - - 4 - - - 4 3.5%
Powered Two-Wheeler - 1 3 13 1 - - 18 15.7%
Car/Van Driver - 2 7 28 10 2 1 50 43.5%
Car Passenger 4 3 3 10 1 4 - 25 21.7%
Taxi Occupant - 2 - 1 - - - 3 2.6%
Bus Passenger - - - - 1 - - 1 0.9%
Total 6 9 16 58 17 6 3 115
% 5.2% 7.8% 13.9% 50.4% 14.8% 5.2% 2.6%
4.2.2 Table 5 shows that the highest proportion of casualties were car/van drivers (43.5%).
Approximately 69% of casualties were vehicle occupants, with the remaining 31%
vulnerable road users (pedestrians, cyclists, PTW riders). The majority of casualties were
aged between 26-45 years (50.4%). A total of 6 casualties were children, including 4 child
car passengers and 2 child pedestrians.

Bolder Academy Macfarlane Lane, Isleworth
Transport Assessment
Page 28 of 66 www.local-transport-projects.co.uk
4.3 Collision Conditions
4.3.1 Table 6 below summarises the recorded collisions by road surface, weather and lighting
conditions:
Table 6: Collision Conditions
Road Surface Collisions %
Dry 71 80.7%
Wet/Damp 16 18.2%
Frost/Ice 1 1.1%
Weather Collisions %
Fine 75 85.2%
Rain 9 10.2%
Snow 1 1.1%
Other 2 2.3%
Unknown 1 1.1%
Lighting Collisions %
Daylight 56 63.6%
Dark 32 36.4%
4.3.2 As illustrated in Table 6, the majority of collisions did not occur with adverse road surface,
weather or lighting conditions.
4.4 Collision Times
4.4.1 Table 7 summarises the collisions by time of year:
Table 7: Collisions by Time of Year
Time of Year Collisions %
Winter (Dec-Feb) 26 29.5%
Spring (Mar-May) 19 21.6%
Summer (Jun-Aug) 17 19.3%
Autumn (Sep-Nov) 26 29.5%
4.4.2 Table 7 shows that most collisions occurred in the autumn and winter months, with the
fewest collisions recorded in the summer.

Bolder Academy Macfarlane Lane, Isleworth Transport Assessment
traffic engineering and transport planning Page 29 of 66
4.4.3 Table 8 below summarises the collisions by day of week and also the time of day:
Table 8: Collisions by Day and Time
Morning (06:00-11:00)
Lunch (11:00-14:00)
Afternoon (14:00-19:00)
Evening (19:00-01:00)
Night (01:00-06:00)
Total %
Monday 2 1 4 3 - 10 11.4%
Tuesday 6 3 6 3 - 18 20.5%
Wednesday 2 1 3 4 - 10 11.4%
Thursday 2 - 5 2 - 9 10.2%
Friday 4 - 9 5 1 19 21.6%
Saturday - 3 4 1 - 8 9.1%
Sunday - 3 6 4 1 14 15.9%
Total 16 11 37 22 2 88
% 18.2% 12.5% 42.0% 25.0% 2.3%
4.4.4 Table 8 illustrates that there was a generally even spread of collisions throughout the
week, with most collisions recorded on a Tuesday (20.5%) or Friday (21.6%). The largest
proportion of collisions occurred during the afternoon (14:00-19:00) period (42.0%), with
few collisions recorded during the night.
4.5 Collision Locations
4.5.1 The locations of the 88 study collisions (shown on the plot attached as Appendix 8) can
be summarised as follows:
36 collisions occurred at the Syon Lane/A4 signalised junction;
15 collisions occurred at the Wood Lane/A4 signalised junction;
5 collisions occurred on the A4 between the Wood Lane and Syon Lane signalised
junctions;
5 collisions occurred at the A4/Harlequin Avenue signalised junction;
5 collisions occurred at the Syon Lane/Grant Way mini-roundabout;
4 collisions occurred on Syon Lane between the Grant Way mini-roundabout and the
A4 signalised junction;
4 collisions occurred on Syon Lane to the south of the Northumberland Avenue
junction;
3 collisions occurred at the Syon Lane/Northumberland Avenue junction;
3 collisions occurred at the Syon Gate Way/Syon Lane junction;
3 collisions occurred on Syon Lane between Gower Road and Jersey Road (not at a
junction);

Bolder Academy Macfarlane Lane, Isleworth
Transport Assessment
Page 30 of 66 www.local-transport-projects.co.uk
2 collisions occurred at the Syon Lane/Windmill Road/Jersey Road/Osterley Lane
mini-roundabout;
1 collision occurred at the Syon Lane/Tesco roundabout;
1 collision occurred on Syon Lane between the Tesco roundabout and Grant Way
mini-roundabout; and
1 collision occurred on Wood Lane (not at a junction).
4.5.2 It should be noted that no collisions were recorded at or in the immediate vicinity of the
Macfarlane Lane/Syon Lane junction.
4.6 Road Safety Impact
4.6.1 A total of 88 collisions, resulting in 115 casualties, have occurred within the study area
during the 5-year study period. The collision records show that the number of PICs per
year has remained relatively consistent throughout the study period, albeit with a spike
in study year 4. Approximately 69% of recorded casualties were vehicle occupants, with
the remaining 31% vulnerable road users. Most collisions were recorded during the
autumn and winter months, with a generally even spread of collisions across days of the
week. The highest proportion of collisions occurred during the afternoon period (14:00-
19:00), with few collisions recorded at night.
4.6.2 Analysis of the study collisions has not revealed any identifiable existing collision issues
associated with the expected movements of the proposed development, therefore it is
considered that there are no existing road safety issues pertinent to the development of
the site.
4.6.3 It is noted that, if the proposed site access arrangements and off-site highway works are
designed with due consideration to road safety, with appropriate highway design
features incorporated into the detailed design, then the proposals should not have a
detrimental road safety impact on the local transport network and should not adversely
affect the safety of pedestrians and cyclists.

Bolder Academy Macfarlane Lane, Isleworth Transport Assessment
traffic engineering and transport planning Page 31 of 66
5.0 TRIP GENERATION PROJECTIONS
5.1 School Catchment Area
5.1.1 In order to determine the likely catchment area of the proposed Bolder Academy, the
distances travelled by 75% of pupils attending existing mixed-gender secondary schools
in Hounslow have been interrogated utilising the London Schools Atlas
(maps.london.gov.uk/schools). The 75th quartile travel distance for each school and the
mean for all schools is shown in Table 9:
Table 9: Mixed-Gender Hounslow Secondary Schools - 75th Quartile Travel Distances
School
Distance Travelled
by 75th Quartile of
Pupils (Miles)
Chiswick School 1.9
Cranford Community College 1.29
Feltham Community College 1.2
The Heathland School 1.18
Heston Community School 1.23
Kingsley Academy 2.06
Lampton School 1.28
Rivers Academy West London 0.96
St Mark’s Catholic School 3.08
Reach Academy (Secondary) 1.21
Average Travel Distance 1.54
(2.47km)
5.1.2 Table 9 shows that the average distance travelled by the 75th quartile of pupils attending
mixed-gender secondary schools in the London Borough of Hounslow is 1.54 miles
(2.47km), with generally little variation in the travel distances to the different schools. It
is therefore considered reasonable to assume that 75% of pupils attending Bolder
Academy would travel from within approximately 2.5km of the site, in line with the
borough average.
5.1.3 This 2.5km travel distance is shown on the plan within Appendix 9 and demonstrates that
75% of pupils attending Bolder Academy would be expected to travel from areas local to
the site including Osterley, Spring Grove and Brentford. The remaining 25% of pupils
would be expected to travel to the school from outside this area, for example from
Isleworth and Hounslow to the south-west.
Bolder Academy Macfarlane Lane, Isleworth
Transport Assessment
Page 32 of 66 www.local-transport-projects.co.uk
5.2 Pupil Modal Split & Person Trip Generation
5.2.1 As part of the Travel Plan (SA, 2015b) for the nearby Nishkam School, the existing modal
splits for seven secondary schools in the London Borough of Hounslow were interrogated
to find an average pupil modal split for the local area. The schools for which modal splits
were interrogated were Isleworth & Syon Boys School, Lampton School, Heston
Community School, Gumley House School, The Heathland School, Cranford Community
College and Chiswick School.
5.2.2 In order to maintain consistency with the approach for Nishkam School, a similar
approach has also been adopted for Bolder Academy. For consistency with the approach
used to determine the likely school catchment area, only existing modal splits for mixed-
gender secondary schools within Hounslow have been utilised. The existing modal splits
within the Nishkam Travel Plan for Isleworth & Syon Boys School and Gumley House
School have therefore been excluded. Based on the existing modal splits, the average
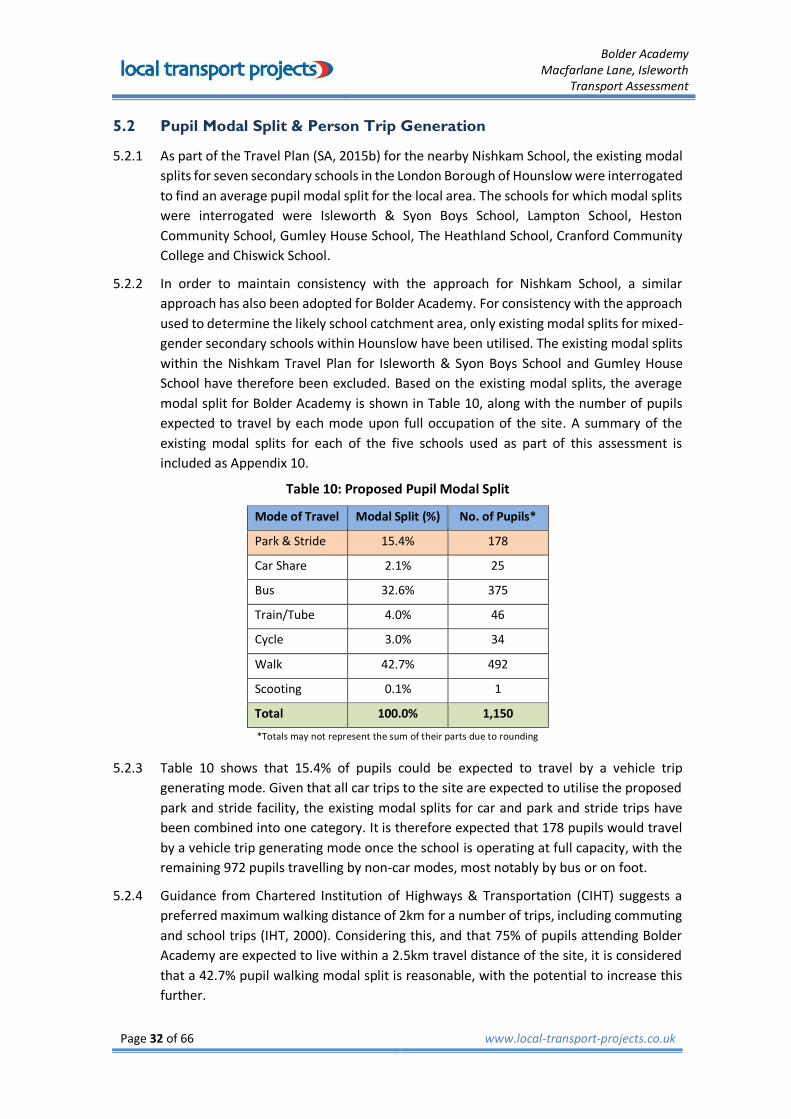
modal split for Bolder Academy is shown in Table 10, along with the number of pupils
expected to travel by each mode upon full occupation of the site. A summary of the
existing modal splits for each of the five schools used as part of this assessment is
included as Appendix 10.
Table 10: Proposed Pupil Modal Split
Mode of Travel Modal Split (%) No. of Pupils*
Park & Stride 15.4% 178
Car Share 2.1% 25
Bus 32.6% 375
Train/Tube 4.0% 46
Cycle 3.0% 34
Walk 42.7% 492
Scooting 0.1% 1
Total 100.0% 1,150
*Totals may not represent the sum of their parts due to rounding
5.2.3 Table 10 shows that 15.4% of pupils could be expected to travel by a vehicle trip
generating mode. Given that all car trips to the site are expected to utilise the proposed
park and stride facility, the existing modal splits for car and park and stride trips have
been combined into one category. It is therefore expected that 178 pupils would travel
by a vehicle trip generating mode once the school is operating at full capacity, with the
remaining 972 pupils travelling by non-car modes, most notably by bus or on foot.
5.2.4 Guidance from Chartered Institution of Highways & Transportation (CIHT) suggests a
preferred maximum walking distance of 2km for a number of trips, including commuting
and school trips (IHT, 2000). Considering this, and that 75% of pupils attending Bolder
Academy are expected to live within a 2.5km travel distance of the site, it is considered
that a 42.7% pupil walking modal split is reasonable, with the potential to increase this
further.

Bolder Academy Macfarlane Lane, Isleworth Transport Assessment
traffic engineering and transport planning Page 33 of 66
5.2.5 There are a number of important factors to consider in relation to pupil travel at the
school, as outlined below:
Vehicle trips associated with pupils travelling to/from the school by car/park and
stride may not represent ‘new’ trips to the local highway network. It is expected that
the majority of trips whereby a pupil is dropped-off and picked-up will not be primary
trips involving only one destination. For example, a number of drop-off/pick-up trips
by parents/guardians will form part of their commute to work, therefore the school
would not be the sole destination for the journey. It is recognised that such trips
would only be rerouted to/from the school, with the associated trips not new to the
wider highway network. If these trips are pass-by or diverted trips from the highway
network local to the site, then the rerouted distance would be negligible.
The vehicle trips associated with pupil travel are already likely to present on the wider
highway network local to the site, with pupils currently attending or likely to attend
other schools further away from their home addresses. By providing a school in closer
proximity to its potential catchment area, it is recognised that there is more likely to
be a higher proportion of trips by sustainable travel (walking, cycling and public
transport), with vehicle trips more likely to be generated by sites located further from
their catchment.
Vehicle trips generated by pupil travel typically generate 2 two-way trips per pupil
during each respective peak period, with both an arrival and departure occurring in
each.
There is inevitably a certain level of absence each day. The current national average
for state funded secondary schools is 4.6% (DfE, 2016), meaning that approximately
53 pupils of the 1,150 pupil capacity could be expected to be absent on any given day.
5.2.6 It is therefore considered that the projected 178 pupils travelling by vehicle trip
generating modes (park and stride) at Bolder Academy represents a robust worst-case
assessment, with the actual number of ‘new’ trips generated likely to be much lower
than this. However, in order to ensure that a robust assessment is undertaken, this TA
assumes that all pupil trips to Bolder Academy will be new to the highway network local
to the site.
5.2.7 For the purposes of this assessment, it is considered reasonable to assume that 95% of
pupil arrivals will occur during the school AM peak hour (08:00-09:00). This reflects that
approximately 5% of pupils would be expected to arrive for school late or early (e.g. for
breakfast club). The pupil departure profile would be expected to be more staggered due
to extra-curricular activities and after school clubs. It is therefore assumed that 70% of
pupils would leave during the school peak hour (15:00-16:00), with 15% leaving during
the PM inter-peak period (16:00-17:00) and 15% leaving during the network PM peak
hour (17:00-18:00).
5.2.8 Considering these arrival and departure profiles, the number of two-way vehicle trips
likely to be generated by pupil drop-offs and pick-ups at the proposed park and stride
facility during the respective peak periods is outlined within Table 11:

Bolder Academy Macfarlane Lane, Isleworth
Transport Assessment
Page 34 of 66 www.local-transport-projects.co.uk
Table 11: Two-Way Pupil Vehicle Trip Generation
Percentage Split No. Pupils Two-Way
Vehicle Trips
AM Peak (08:00-09:00) 95% 169 338
School PM Peak (15:00-16:00) 70% 125 250
PM Inter Peak (16:00-17:00) 15% 27 54
Network PM Peak (17:00-18:00) 15% 27 54
*Totals may not represent the sum of their parts due to rounding
5.3 Staff Modal Split & Person Trip Generation
5.3.1 From information provided by the Client, it is understood that there will be 90 staff
employed at Bolder Academy upon full occupation of the school, with staffing numbers
expected to increase incrementally alongside pupil numbers. The estimated travel to
work modal split for staff at the proposed school has been calculated using method of
travel to work data for the existing workplace population, obtained from the 2011 Census
(dataset: WP703EW). The proposed site is located within Middle-Layer Super Output
Area (MSOA) ‘Hounslow 009’ and it is considered reasonable to assume that the staff
journey to work modal split at the site will be comparable with that of the existing
workplace population within this local MSOA. The modal split data is summarised within
Table 12, along with the number of staff expected to travel by each mode upon full
occupation of the site:
Table 12: Proposed Staff Modal Split
Mode of Travel Modal Split (%) Proposed No
of Staff
Car/Taxi/PTW 58.4% 53
Underground 7.0% 6
Train 15.0% 14
Bus 8.2% 7
Car Passenger 1.8% 2
Pedestrian 4.9% 4
Cycle 4.3% 4
Other 0.4% 0
TOTAL 100% 90
*Totals may not represent the sum of their parts due to rounding
5.3.2 Table 12 indicates that just over half (58.4%) of all staff travel to work journeys could be
expected to be made by vehicle trip generating modes, with the remainder made by
sustainable modes of travel. Based upon 90 staff being employed at the site, it is assumed
that 53 staff could be expected to travel by vehicle trip generating modes when the
school is operating at full capacity.

Bolder Academy Macfarlane Lane, Isleworth Transport Assessment
traffic engineering and transport planning Page 35 of 66
5.3.3 For the purposes of this assessment, it is assumed that 75% of staff would arrive for work
during the school AM peak hour (08:00-09:00), with 25% arriving during the preceding
hourly period (07:00-08:00). A more staggered departure profile would be expected after
school finishes, given that extra-curricular activities and staff meetings typically occur
once pupils have left. It is therefore assumed that 50% of staff departures would occur
during the School PM peak hour (15:00 to 16:00), with 25% during the PM inter-peak
hour (16:00-17:00) and 25% during the network PM peak hour (17:00-18:00).
5.3.4 The number of two-way staff vehicle trips expected to be generated during the
respective peak periods is outlined within Table 13:
Table 13: Two-Way Staff Vehicle Trip Generation
Percentage Split Two-Way
Vehicle Trips
Pre-AM Peak (07:00-08:00) 25% 13
AM Peak (08:00-09:00) 75% 40
School PM Peak (15:00-16:00) 50% 27
PM Inter Peak (16:00-17:00) 25% 13
Network PM Peak (17:00-18:00) 25% 13
5.3.5 Table 13 demonstrates that the site is likely to generate 40 two-way staff vehicle trips
during the school AM peak period (08:00-09:00). The site could be expected to generate
up to 27 two-way vehicle trips during the school PM peak period (15:00-16:00), with up
to 13 two-way trips likely to be generated during the network peak period (17:00-18:00).
5.3.6 It is recognised that the site may also generate a small number of servicing trips (e.g.
deliveries and refuse collection), although these are likely to occur outside the usual
network peak periods. These trips have therefore not been explicitly included within the
vehicle trip generation projections of this TA.

Bolder Academy Macfarlane Lane, Isleworth
Transport Assessment
Page 36 of 66 www.local-transport-projects.co.uk
6.0 TRAFFIC IMPACT
6.1 Existing Network Traffic Flows
6.1.1 In order to establish the baseline traffic situation in the vicinity of the site, traffic flow
data was collected on Wednesday 13th May 2015 as part of the TA (SA, 2015a) for
Nishkam School. It was agreed with the client and the transport consultant for Nishkam
School that this data could be shared to form the baseline traffic situation for Bolder
Academy. Traffic surveys and queue length surveys were undertaken between the hours
of 07:00-09:30 and 14:30-18:30 at the following local junctions:
Windmill Lane/Syon Lane/Jersey Road/Osterley Lane mini-roundabout;
Syon Lane/Tesco access roundabout;
Syon Lane/Grant Way mini-roundabout;
Syon Lane/Great West Road (A4) and Harlequin Avenue/A4 linked signal junctions.
Wood Lane/A4 signal junction; and
Thornbury Road/A4 signal junction.
6.1.2 The results of these surveys, which were aggregated into 15 minute intervals, indicate
that the network peak hours for the local highway network are AM (07:45-08:45) and
PM (17:15-18:15). These peak hours reflect the largest total number of vehicle
movements across the surveyed junctions. Analysis of the data shows a negligible
difference in traffic flows between the network peak hours and the school peak hours
assessed within the TA for Nishkam School of 08:00-09:00, 15:00-16:00 and 17:00-18:00.
In order to maintain consistency and to ensure that the worst-case development impact
is tested, the same network peak periods have been assessed within this TA.
6.1.3 The recorded traffic flows during the assessed AM peak (08:00-09:00), school PM peak
(15:00-16:00) and network PM peak (17:00-18:00) periods are shown in the flow
diagrams attached as Appendix 11.
6.2 Assessment Scenarios
6.2.1 The development proposals have been tested against the following weekday AM Peak
hour (08:00-09:00), weekday school PM peak hour (15:00-16:00) and weekday network
PM peak hour (17:00-18:00) traffic flow scenarios:
2015 ’Existing’ - Traffic flows recorded and observed during the May 2015 traffic
surveys;
2025 ‘Do Nothing’ - ‘Existing’ network traffic flows, with growthing to 2025 and the
additional of committed development traffic (see Section 2.5); and
2025 ‘With Development’ - ‘2025 Do Nothing’ with the addition of traffic associated
with the proposed development.

Bolder Academy Macfarlane Lane, Isleworth Transport Assessment
traffic engineering and transport planning Page 37 of 66
6.2.2 The current proposals are for Bolder Academy to open in 2018 with 150 pupils, with 180
pupils to enrol each year thereafter. The school is expected to operate at full capacity by
2025. The traffic impact of the proposals has therefore been assessed against the
predicted traffic flows in 2025, 8 years after registration of the planning application.
6.2.3 The network traffic flows at 2025 have been predicted using the DfT’s ‘National Traffic
Model’ (NTM). The regional growth factor obtained from the NTM has been adjusted to
reflect local circumstances using TEMPRO software (Ref: London Dataset Version 7.0),
see Appendix 12. As the NTM includes for committed developments (including new
households and jobs) as part of its forecasts, in order to avoid double counting, all new
households and jobs were removed from the growth factors as the flows associated with
the committed developments represent more households and jobs than are included
within the NTM forecasts.
6.3 Staff Traffic Distribution & Assignment
6.3.1 The distribution of the projected staff vehicle trips associated with the application site
has been predicted utilising a gravity model based upon commuting patterns of the
existing workplace population of the Hounslow 009 Middle Layer Super Output Area
(MSOA) within which the site is located. ‘Location of usual residence and place of work
by method of travel to work’ data from the 2011 National Census (ONS, 2014) shows the
proportion of people travelling to Hounslow 009 from their usual residences (MSOAs and
local authority districts) by mode of travel.
6.3.2 This trip distribution data has been combined with a subjective assessment of route
choice (traffic assignment) to determine the likely distribution of staff traffic associated
with the proposals across the highway network. The predicted traffic assignment has
been undertaken utilising journey planning tools to help determine the relative
attractiveness of alternative routes, existing directional traffic signing strategy at local
junctions and known existing traffic conditions on the relevant routes.
6.3.3 The detailed calculations of the gravity model are attached as Appendix 13, with the
results summarised in Table 14.

Bolder Academy Macfarlane Lane, Isleworth
Transport Assessment
Page 38 of 66 www.local-transport-projects.co.uk
Table 14: Staff Travel Gravity Model Results
Zone Route Initial Direction at Macfarlane
Lane/Syon Lane Distribution Split
A Syon Lane (N) then Windmill Lane (N)
To/from north
18.1%
27.1% B Syon Lane (N) then Jersey Road (W) 5.0%
C Syon Lane (N) then Thornbury Road 3.2%
D Syon Lane (N) then Wood Lane 0.9%
E Syon Lane (S), A4 (W) then Wood Lane
To/from south
2.1%
72.9%
F Syon Lane (S), A4 (W) then Thornbury Road 0.1%
G Syon Lane (S) then A4 (W) 14.6%
H Syon Lane (S) then A4 (E) 34.7%
I Syon Lane (S) then A315 (E) 1.8%
J Syon Lane (S) then A310 (S) 19.5%
100%
6.3.4 The gravity model results indicate that there is expected to be an approximate 27% split
to/from the north (Zones A to D) and 73% to/from the south (Zones E to J) at the
Macfarlane Lane/Syon Lane junction, with the routes illustrated in Figure 5. Flow
diagrams illustrating the projected staff traffic distribution, based on the gravity model
and the above assumptions, are attached as Appendix 14.
Figure 5: Gravity Model Zones
Source Imagery: Copyright Google Earth Pro (License Key-JCPMR5M58LXF2GE)
A
B
C F
D E
H
I
J
D
G
C E F G

Bolder Academy Macfarlane Lane, Isleworth Transport Assessment
traffic engineering and transport planning Page 39 of 66
6.4 Pupil Traffic Distribution and Assignment
6.4.1 The distribution of the projected pupil vehicle trips associated with the proposals has
been predicted utilising a gravity model based upon the likely home locations of pupils
attending the school. As previously outlined, 75% of pupils attending the school are
expected to travel in from a localised catchment covering a 2.5km area surrounding the
site. It is therefore assumed that the remaining 25% of pupils would travel from outside
of the catchment area, but from within the London Borough of Hounslow boundary.
6.4.2 As shown within Table 10, a total of 15.4% of pupils are expected to travel to the site by
park and stride, and therefore by a vehicle trip generating mode. For the purposes of this
assessment and based upon these modal split projections, it is assumed that 60% of
pupils travelling by park and stride would do so from within the catchment area, with the
remaining 40% from outside of the catchment area. It is therefore assumed that 9.3% of
trips generated by the site would be vehicle trips from inside the catchment area, with
6.2% by vehicle trips from outside the catchment area.
6.4.3 In order to determine the proportion of pupil vehicle trips expected to originate from
areas within and outside the catchment, a total of 12 vehicle trip zones have been
identified, based on the likely home locations of pupils attending Bolder Academy. The
zones were identified based on the likely routing of associated vehicle trips to and from
the site. A plan of the zone boundaries included as Appendix 15. A summary of the
proportion of pupils expected to travel to Bolder Academy from each zone by vehicle trip
generating modes is provided within Table 15. The proportions travelling to and from
each zone have been determined considering the size of each zone and the residential
density covered.
Table 15: Pupil Home Location Zones
Home Location Ref Proportion
of Pupils No. of Pupils
1 5.4% 10
2 5.4% 10
3 8.4% 15
4 7.8% 14
5 26.4% 47
6 6.6% 12
Within 2.5km Catchment 60% 107
7 4.0% 7
8 10.0% 18
9 10.0% 18
10 8.0% 14
11 4.0% 7
12 4.0% 7
Outside 2.5km Catchment 40% 71
Total 100% 178
*Totals may not represent the sum of their parts due to rounding

Bolder Academy Macfarlane Lane, Isleworth
Transport Assessment
Page 40 of 66 www.local-transport-projects.co.uk
6.4.4 The above data has been combined with a subjective assessment of route choice (traffic
assignment) to determine the likely distribution of traffic associated with pupil trips
across the highway network. The predicted traffic assignment has been undertaken
utilising journey planning tools to help determine the relative attractiveness of routes
between the identified zones and the site, with consideration of influences such as
existing directional traffic signing strategy at local junctions and known existing traffic
conditions on the relevant routes.
6.4.5 The detailed calculations of the gravity model are attached as Appendix 16, with the
results summarised in Table 16.
Table 16: Pupil Travel Gravity Model Results
Zone Route Initial Direction at Tesco/Syon
Lane Distribution Split
A Syon Lane (N) then Windmill Lane (N)
To/from north
0.0%
19.4% B Syon Lane (N) then Jersey Road (W) 8.2%
C Syon Lane (N) then Thornbury Road 8.0%
D Syon Lane (N) then Wood Lane 3.2%
E Syon Lane (S), A4 (W) then Wood Lane
To/from south
14.1%
80.6%
F Syon Lane (S), A4 (W) then Thornbury Road 5.9%
G Syon Lane (S) then A4 (W) 5.6%
H Syon Lane (S) then A4 (E) 12.6%
I Syon Lane (S) then A315 (E) 25.6%*
J Syon Lane (S) then A310 (S) 16.8%*
*A proportion of trips towards zones I & J would be dispersed within the residential areas to the east and west of Syon Lane, therefore actual proportions in these directions will be lower
100%
6.4.6 As previously outlined, it is proposed to provide a park and stride facility within the car
park of the Tesco store to accommodate all pupil drop-off and pick-up trips, therefore
the origin or destination of these trips is assumed to be the car park. The gravity model
results indicate that approximately 80% of trips would be expected to travel to/from the
south at the Tesco/Syon Lane roundabout, with approximately 20% to/from the north.
The zones referred to within Table 16 are illustrated in Figure 5. Flow diagrams
illustrating the projected pupil traffic distribution, based on the gravity model and the
above assumptions, are attached as Appendix 17.

Bolder Academy Macfarlane Lane, Isleworth Transport Assessment
traffic engineering and transport planning Page 41 of 66
6.5 Impact at Local Junctions
6.5.1 The predicted increase in traffic at key junctions within the local highway network as a
result of each development scenario is illustrated in the network diagrams attached as
Appendix 18 and is summarised in Table 17. The traffic flows associated with the
committed developments outlined within Section 2.5 are also included on the network
diagrams within Appendix 18. All totals are expressed as Passenger Car Units (PCU).
Table 17: Predicted Traffic Impact at Local Junctions
Junction 2015
Existing
Sky Comm.
Dev.
Nishkam Comm.
Dev.
Total Comm.
Dev
2025 Do Nothing
2025 With Dev.
Dev. Impact
AM Peak (08:00-09:00)
Windmill Lane/Syon Lane/Jersey Road/Osterley Lane mini-roundabout
1,735 +162 +143 +416 2,226 2,302 +76
(+3.4%)
Macfarlane Lane/Syon Lane junction 1,056 +162 +87 +350 1,452 1,558 +106
(+7.3%)
Syon Lane/Tesco access roundabout 1,477 +162 +87 +360 1,901 2,268 +367
(+19.3%)
Syon Lane/Grant Way mini-roundabout
1,520 +560 +87 +758 2,345 2,647 +302
(+12.9%)
Syon Lane/A4 signal junction 5,824 +401 +87 +724 6,805 7,107 +302
(+4.4%)
Wood Lane/A4 signal junction 4,216 - +49 +49 4,449 4,553 +104
(+2.3%)
Thornbury Road/A4 signal junction 4,250 - +118 +118 4,556 4,629 +73
(+1.6%)
School PM Peak (15:00-16:00)
Windmill Lane/Syon Lane/Jersey Road/Osterley Lane mini-roundabout
1,362 - +90 +90 1,547 1,603 +56
(+3.6%)
Macfarlane Lane/Syon Lane junction 1,018 - +56 +38 1,128 1,204 +76
(+6.7%)
Syon Lane/Tesco access roundabout 1,620 - +56 +56 1,789 2,059 +270
(+15.1%)
Syon Lane/Grant Way mini-roundabout
1,553 - +56 +56 1,718 1,939 +221
(+12.9%)
Syon Lane/A4 signal junction 4,800 - +56 +56 5,191 5,412 +221
(+4.3%)
Wood Lane/A4 signal junction 3,354 - +31 +31 3,621 3,698 +77
(+2.1%)
Thornbury Road/A4 signal junction 3,407 - +75 +75 3,721 3,775 +54
(+1.5%)
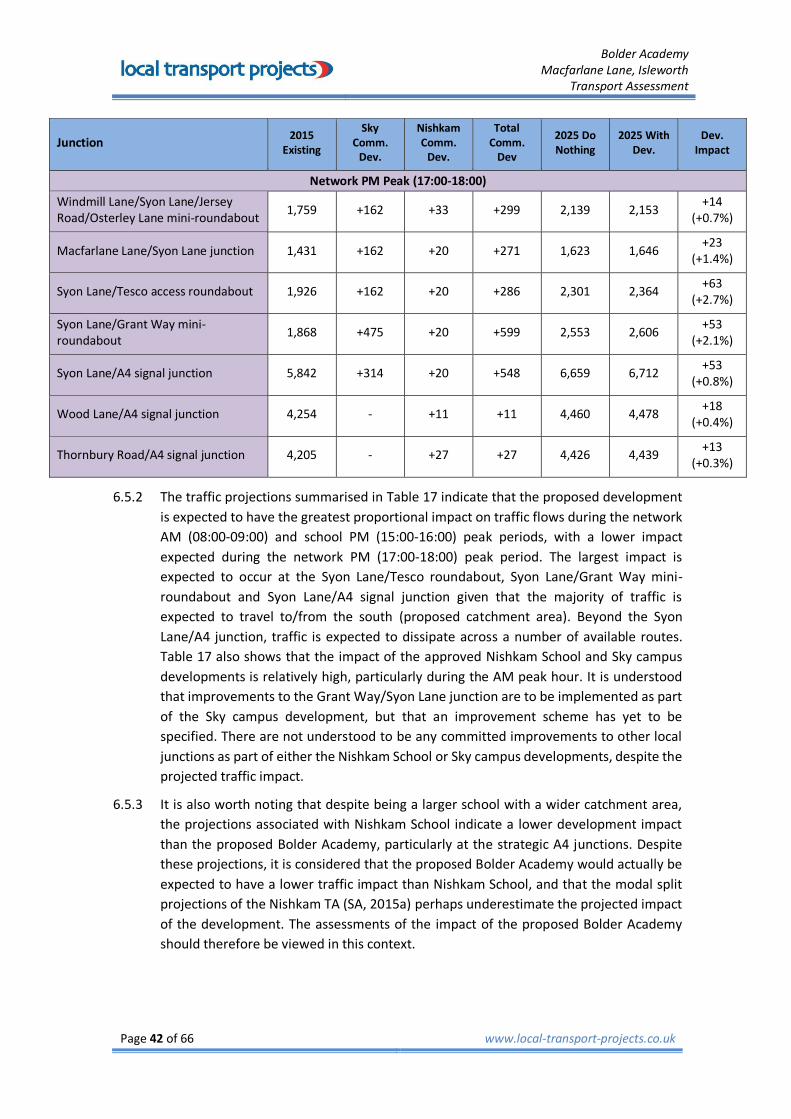
Bolder Academy Macfarlane Lane, Isleworth
Transport Assessment
Page 42 of 66 www.local-transport-projects.co.uk
Junction 2015
Existing
Sky Comm.
Dev.
Nishkam Comm.
Dev.
Total Comm.
Dev
2025 Do Nothing
2025 With Dev.
Dev. Impact
Network PM Peak (17:00-18:00)
Windmill Lane/Syon Lane/Jersey Road/Osterley Lane mini-roundabout
1,759 +162 +33 +299 2,139 2,153 +14
(+0.7%)
Macfarlane Lane/Syon Lane junction 1,431 +162 +20 +271 1,623 1,646 +23
(+1.4%)
Syon Lane/Tesco access roundabout 1,926 +162 +20 +286 2,301 2,364 +63
(+2.7%)
Syon Lane/Grant Way mini-roundabout
1,868 +475 +20 +599 2,553 2,606 +53
(+2.1%)
Syon Lane/A4 signal junction 5,842 +314 +20 +548 6,659 6,712 +53
(+0.8%)
Wood Lane/A4 signal junction 4,254 - +11 +11 4,460 4,478 +18
(+0.4%)
Thornbury Road/A4 signal junction 4,205 - +27 +27 4,426 4,439 +13
(+0.3%)
6.5.2 The traffic projections summarised in Table 17 indicate that the proposed development
is expected to have the greatest proportional impact on traffic flows during the network
AM (08:00-09:00) and school PM (15:00-16:00) peak periods, with a lower impact
expected during the network PM (17:00-18:00) peak period. The largest impact is
expected to occur at the Syon Lane/Tesco roundabout, Syon Lane/Grant Way mini-
roundabout and Syon Lane/A4 signal junction given that the majority of traffic is
expected to travel to/from the south (proposed catchment area). Beyond the Syon
Lane/A4 junction, traffic is expected to dissipate across a number of available routes.
Table 17 also shows that the impact of the approved Nishkam School and Sky campus
developments is relatively high, particularly during the AM peak hour. It is understood
that improvements to the Grant Way/Syon Lane junction are to be implemented as part
of the Sky campus development, but that an improvement scheme has yet to be
specified. There are not understood to be any committed improvements to other local
junctions as part of either the Nishkam School or Sky campus developments, despite the
projected traffic impact.
6.5.3 It is also worth noting that despite being a larger school with a wider catchment area,
the projections associated with Nishkam School indicate a lower development impact
than the proposed Bolder Academy, particularly at the strategic A4 junctions. Despite
these projections, it is considered that the proposed Bolder Academy would actually be
expected to have a lower traffic impact than Nishkam School, and that the modal split
projections of the Nishkam TA (SA, 2015a) perhaps underestimate the projected impact
of the development. The assessments of the impact of the proposed Bolder Academy
should therefore be viewed in this context.

Bolder Academy Macfarlane Lane, Isleworth Transport Assessment
traffic engineering and transport planning Page 43 of 66
6.5.4 The Department for Transport (DfT, 2007a) has previously issued guidance that transport
assessment of development impacts could be based on a threshold of “30 two-way peak
hour vehicle trips”. This guidance acknowledged that this threshold was not to be applied
rigidly, but rather that it provided “a useful point of reference from which to commence
discussions”.
6.5.5 This national DfT guidance has now been replaced with the ‘National Planning Policy
Framework’ (NPPF) (DCLG, 2012) and its accompanying ‘Planning Practice Guidance’
(PPG) (DCLG, 2014). NPPF and PPG require that transport assessment is undertaken for
“developments that generate significant amounts of movement”, although this is not
defined. It is therefore acknowledged that there is no set threshold for assessment within
the current national planning policy. In determining whether the proposed development
is expected to have a material impact on the local highway network, the traffic
projections for the proposed development have been compared against the current and
previous Government guidance.
6.5.6 The proposals are expected to generate an increase of more than 30 two-way vehicle
trips at all existing junctions listed within Table 17 during the AM and school PM peak
hours. The impact of the development during the network PM peak hour is expected to
be lower, although an increase of more than 30 two-way vehicle trips is expected to
occur at the junctions closest to the site. Given the projected increases in traffic, the
future operation of the junctions listed within Table 17 has been tested in detail in order
to ensure that the junctions can sufficiently accommodate the traffic flows associated
with the proposed development.
6.6 Junction Capacity Assessments
Windmill Lane/Syon Lane/Jersey Road/Osterley Lane Mini-Roundabout
6.6.1 In order to assess the ability of the Windmill Lane/Syon Lane/Jersey Road/Osterley Lane
mini-roundabout to accommodate the traffic associated with the proposed
development, a roundabout capacity assessment has been undertaken using Junctions 9
modelling software, which is a software package produced by TRL that provides an
industry standard method for assessing roundabout and priority junction capacity,
queuing and delay.
6.6.2 The input parameters are a combination of on-site measurements which were obtained
during a site visit, scaled UKMap plans, and scaled aerial imagery. The existing and
projected future peak hour traffic flows have been assessed against the existing
roundabout layout, the results of which are shown in full within the complete modelling
output (see Appendix 19), and are summarised in Table 18:

Bolder Academy Macfarlane Lane, Isleworth
Transport Assessment
Page 44 of 66 www.local-transport-projects.co.uk
Table 18: Windmill Lane/Syon Lane/Jersey Road Mini-Roundabout Capacity Assessment
Peak Arm
2015 Existing
2025 Do Nothing
2025 With Development
Max. RFC
Max. End Q
Max. RFC
Max. End Q
Max. RFC
Max. End Q
AM
Windmill Lane 94.2% 11.6 128.3% 159.7 132.0% 178.1
Syon Lane 48.0% 0.9 58.9% 1.4 63.0% 1.7
Jersey Road 50.6% 1.0 70.5% 2.3 74.8% 2.9
Osterley Lane 0.0% 0.0 0.0% 0.0 0.0% 0.0
OVERALL 94.2% 11.6 128.3% 159.7 132.0% 178.1
School PM
Windmill Lane 47.8% 0.9 52.5% 1.1 53.2% 1.1
Syon Lane 75.2% 2.9 88.4% 6.6 92.4% 9.3
Jersey Road 31.2% 0.5 38.3% 0.6 41.9% 0.7
Osterley Lane 0.0% 0.0 0.0% 0.0 0.0% 0.0
OVERALL 75.2% 2.9 88.4% 6.6 92.4% 9.3
Network PM
Windmill Lane 55.4% 1.2 61.1% 1.6 61.2% 1.6
Syon Lane 106.8% 40.6 146.0% 237.2 147.0% 243.7
Jersey Road 47.6% 0.9 52.2% 1.1 52.8% 1.1
Osterley Lane 0.9% 0.1 10.2% 0.1 10.3% 0.1
OVERALL 106.8% 40.6 146.0% 237.2 147.0% 243.7
6.6.3 The capacity assessment results shown in Table 18 indicate that the Windmill Lane/Syon
Lane/Jersey Road/Osterley Lane mini-roundabout currently operates at a maximum
Ratio to Flow Capacity (RFC) of 94.2% during the AM peak hour and 106.8% during the
network PM peak hour, above the typical target RFC level of 85%. The junction currently
operates within capacity during the school PM peak hour. The respective RFCs are
expected to increase substantially in the 2025 Do Nothing scenario, largely due to the
impact of local committed developments, as outlined in Table 17, with respective
committed traffic increases of 416 PCUs during the AM peak hour and 299 PCUs during
the network PM peak hour.
6.6.4 In order to validate the Junctions 9 model, queuing data was obtained alongside traffic
flow data at the junction. The results of the queue length surveys during each respective
peak hour are summarised within Table 19 and are included in full within Appendix 20.

Bolder Academy Macfarlane Lane, Isleworth Transport Assessment
traffic engineering and transport planning Page 45 of 66
Table 19: Windmill Lane/Syon Lane/Jersey Road Mini-Roundabout Queue Lengths
Osterley Lane Jersey Road Syon Lane Windmill Lane
AM Peak (08:00-09:00)
Average Queue 0 0.33 0.35 0.6
Maximum Queue 0 4 4 5
No. Mins with Queuing 0 10 13 12
No. Mins without Queuing 60 50 47 48
School PM Peak (15:00-16:00)
Average Queue 0 0.3 0.47 0
Maximum Queue 0 4 8 0
No. Mins with Queuing 0 13 8 0
No. Mins without Queuing 60 47 52 60
Network PM Peak (17:00-18:00)
Average Queue 0 0.72 0.83 0.03
Maximum Queue 0 4 7 1
No. Mins with Queuing 0 22 14 2
No. Mins without Queuing 60 38 46 58
6.6.5 Table 19 demonstrates that the existing junction currently operates without significant
levels of queueing during all assessed periods. The maximum queue recorded during the
AM peak hour was 5 vehicles (Windmill Lane arm), compared to the modelling results
which predict a maximum end queue of 11.6 vehicles. The queue length survey results
also show that all arms of the mini-roundabout currently have no queues for the majority
of the AM peak period, with an average queue of less than 1 vehicle on all arms.
6.6.6 The maximum queue recorded during the network PM period was 7 vehicles (Syon Lane
arm), compared to the modelling results which predict a maximum end queue of 40.6
vehicles. The queue length survey results show that all arms currently have no queue for
the majority of the network PM peak hour, with an average queue of less than 1 vehicle
on all arms.
6.6.7 Given the large variations in modelled queue length, relative to those recorded on site,
it is considered that the Junctions 9 model does not accurately represent the existing
operation of the junction during the modelled peak hours. Although the worst-case RFCs
largely match the arms where the largest traffic impact is expected to be during each
respective peak hour, it is considered that the Junctions 9 models underestimates the
overall existing capacity of the junction.
Bolder Academy Macfarlane Lane, Isleworth
Transport Assessment
Page 46 of 66 www.local-transport-projects.co.uk
6.6.8 Therefore, in the absence of a representative and appropriate junction model, the
predicted impact of the proposed development on the Windmill Lane/Syon Lane/Jersey
Road/Osterley Lane mini-roundabout has been assessed based on the projected increase
in traffic flows, with consideration of the relative impact of the Nishkam School and Sky
campus developments. As shown in Table 17, the proposed development is expected to
increase traffic flows at the mini-roundabout by 76 vehicle movements during the AM
peak hour, 56 movements during the school PM peak hour and 14 movements during
the network PM peak hour, which represents proportionate increase of 3.4%, 3.6% and
0.7% respectively. As previously outlined, both the Nishkam School and Sky campus
committed developments are expected to increase traffic flows at the junction by a
larger number and proportion than the proposed development and were both judged to
not be having a significant impact on junction operation, with no improvement
mitigation secured as part of these committed developments.
6.6.9 Previous guidance (IHT, 1994) from the Institution of Highways & Transportation (now
the Chartered Institution of Highways & Transportation) indicated that traffic flow
increases of less than 10% would not be expected to have a significant impact on junction
capacity, with a lower threshold of 5% where there is existing congestion. It is
acknowledged that this document has since been superseded (DfT, 2007a & DCLG, 2014),
however, in the absence of a suitable junction model, it is considered that this indicative
guidance still provides a useful benchmark.
6.6.10 Based upon the queue length data, it is considered that the mini-roundabout does not
currently experience congestion. Despite this, the proposed Bolder Academy
development is expected to increase traffic flows by a maximum of 3.6% (school PM peak
hour), which is below the 5% threshold at a junction where there is existing congestion
and below the levels approved as part of the Nishkam School and Sky campus schemes.
It is therefore considered that the proposed development should not have a severe
impact on the operation of the Windmill Lane/Syon Lane/Jersey Road/Osterley Lane
mini-roundabout.
Macfarlane Lane/Syon Lane Junction
6.6.11 In order to assess the ability of the Macfarlane Lane/Syon Lane junction to accommodate
development traffic, a capacity assessment has been undertaken using Junctions 9
modelling software. The input parameters are based upon the proposed junction layout
attached as Appendix 5. The projected future peak hour traffic flows (2025 With
Development) have been assessed against the proposed junction layout. The results of
the capacity assessment are shown in full within the complete modelling output (see
Appendix 21), and are summarised in Table 20.

Bolder Academy Macfarlane Lane, Isleworth Transport Assessment
traffic engineering and transport planning Page 47 of 66
Table 20: Macfarlane Lane/Syon Lane Junction Capacity Assessment
Peak Traffic Stream
2025 With Development
Max. RFC
Max. End Q
AM
Macfarlane Lane 2.4% 0.0
Syon Lane 9.3% 0.1
OVERALL 9.3% 0.1
School PM
Macfarlane Lane 9.9% 0.1
Syon Lane 0.4% 0.0
OVERALL 9.9% 0.1
Network PM
Macfarlane Lane 17.4% 0.2
Syon Lane 3.6% 0.0
OVERALL 17.4% 0.2
6.6.12 The capacity assessment results shown in Table 20 demonstrate that the proposed site
access junction would be expected to operate well within capacity at 2025 with the
proposed development in place. The modelling results indicate that the maximum RFC
during the peak hours is likely to be 17.4% (Macfarlane Lane arm, network PM peak),
which is considerably below the typical target RFC level of 85%. The results predict that
there should be significant levels of reserve capacity at the proposed Macfarlane
Lane/Syon Lane junction.
Syon Lane/Tesco Roundabout
6.6.13 In order to assess the ability of the Syon Lane/Tesco roundabout to accommodate the
traffic associated with the proposed development, a roundabout capacity assessment
has been undertaken using Junctions 9 modelling software. The input parameters are a
combination of on-site measurements which were obtained during a site visit, scaled
UKMap plans, and scaled aerial imagery. The existing and projected future peak hour
traffic flows have been assessed against the existing roundabout layout, the results of
which are shown in full within the complete modelling output (see Appendix 22), and are
summarised in Table 21:

Bolder Academy Macfarlane Lane, Isleworth
Transport Assessment
Page 48 of 66 www.local-transport-projects.co.uk
Table 21: Syon Lane/Tesco Roundabout Capacity Assessment
Peak Arm
2015 Existing
2025 Do Nothing
2025 With Development
Max. RFC
Max. End Q
Max. RFC
Max. End Q
Max. RFC
Max. End Q
AM
Tesco Access 16.3% 0.2 20.2% 0.3 37.6% 0.6
Syon Lane (E) 34.4% 0.6 41.9% 0.8 54.2% 1.2
Syon Lane (W) 70.3% 2.4 97.7% 18.7 108.5% 61.4
OVERALL 70.3% 2.4 97.7% 18.7 108.5% 61.4
School PM
Tesco Access 31.8% 0.5 34.9% 0.5 45.4% 0.8
Syon Lane (E) 56.0% 1.3 61.6% 1.6 69.7% 2.3
Syon Lane (W) 40.1% 0.7 46.7% 0.9 54.0% 1.2
OVERALL 56.0% 1.3 61.6% 1.6 69.7% 2.3
Network PM
Tesco Access 37.9% 0.6 40.8% 0.7 43.2% 0.8
Syon Lane (E) 70.0% 2.3 91.5% 9.4 93.4% 11.4
Syon Lane (W) 46.3% 0.9 52.8% 1.1 54.8% 1.2
OVERALL 70.0% 2.3 91.5% 9.4 93.4% 11.4
6.6.14 The capacity assessment results shown in Table 21 indicate that the existing Syon
Lane/Tesco roundabout currently operates within the target RFC level of 85%. The
roundabout is expected to operate above the target 85% RFC level in 2025 without the
proposed development in place during the AM peak and network PM peak hours, largely
due to the impact of local committed developments including Nishkam School and the
Sky campus.
6.6.15 The modelling results indicate that the proposed development is expected to increase
the worst-case RFC by 10.8% during the AM peak hour (Syon Lane (W) arm). There are
also expected to be RFC increases on the other arms during the AM peak hour. Given
that the proposed park and stride facility will be the Tesco store car park, the majority of
development trips are expected to pass through the Syon Lane/Tesco roundabout, which
explains the projected RFC increases.
6.6.16 The impact of the development is expected to be lower during the school and network
PM peak hours. A maximum RFC increase of 10.5% is expected during the school PM
peak hour (maximum queue increase of 0.7 PCUs), however the roundabout is expected
to continue operating within the target capacity. The maximum RFC increase during the
network PM peak hour is expected to be 2.4% (maximum queue increase of 2.0 PCUs)
which is not considered to be significant, particularly as the roundabout is expected to
operate above capacity in the 2025 Do Nothing scenario.
6.6.17 Given the impact of the development on the roundabout, particularly during the AM
peak hour, it is proposed to provide a mitigation scheme as part of the proposals. The
scheme is expected to be agreed with LBHC Highways.

Bolder Academy Macfarlane Lane, Isleworth Transport Assessment
traffic engineering and transport planning Page 49 of 66
6.6.18 It is considered that, subject to the provision of an appropriate mitigation scheme, that
the proposed development would not be expected to have a severe impact on the Syon
Lane/Tesco roundabout, with the mitigation scheme expected to result in wider capacity
benefits at the roundabout, including outside of the peak hours of the development.
Syon Lane/Grant Way Mini-Roundabout
6.6.19 In order to assess the ability of the Syon Lane/Grant Way mini-roundabout to
accommodate the traffic associated with the proposed development, a capacity
assessment has been undertaken using Junctions 9 modelling software.
6.6.20 The input parameters are a combination of on-site measurements which were obtained
during a site visit, scaled Ordnance Survey plans, and scaled aerial imagery. The existing
and projected future peak hour traffic flows have been assessed against the existing
junction layout, the results of which are shown in full within the complete modelling
output (see Appendix 23), and are summarised in Table 22:
Table 22: Syon Lane/Grant Way Mini-Roundabout Capacity Assessment
Peak Arm
2015 Existing
2025 Do Nothing
2025 With Development
Max. RFC
Max. End Q
Max. RFC
Max. End Q
Max. RFC
Max. End Q
AM
Grant Way 18.6% 0.3 24.3% 0.4 25.6% 0.4
Syon Lane (E) 60.0% 1.6 106.6% 50.5 122.9% 145.8
Syon Lane (W) 84.8% 5.4 146.1% 238.2 156.2% 330.1
OVERALL 84.8% 5.4 146.1% 238.2 156.2% 330.1
School PM
Grant Way 25.3% 0.3 29.6% 0.4 34.4% 0.5
Syon Lane (E) 78.5% 3.6 86.1% 5.5 96.0% 14.7
Syon Lane (W) 60.1% 1.5 67.9% 2.2 79.5% 3.8
OVERALL 78.5% 3.6 86.1% 5.5 96.0% 14.7
Network PM
Grant Way 51.2% 1.1 143.3% 125.9 148.7% 144.7
Syon Lane (E) 94.1% 11.8 119.0% 114.3 120.9% 128.0
Syon Lane (W) 65.6% 1.9 74.2% 2.9 77.2% 3.3
OVERALL 94.1% 11.8 143.3% 125.9 148.7% 144.7
6.6.21 The capacity assessment results shown in Table 22 indicate that the Syon Lane/Grant
Way mini-roundabout currently operates at the target 85% RFC level during the AM peak
hour, and above the target level during the network PM peak hour. The modelling results
largely reflect the existing operation of the junction, however it is understood that south-
east bound traffic towards from the Syon Lane/A4 signal junction often queues back
through the Syon Lane/Grant Way mini-roundabout, particularly during the AM peak
hour, which perhaps gives a perception that the mini-roundabout is operating over
capacity.

Bolder Academy Macfarlane Lane, Isleworth
Transport Assessment
Page 50 of 66 www.local-transport-projects.co.uk
6.6.22 Given the scale of committed development traffic flows (see Table 17), with an expected
increase of 758 vehicles during the AM peak hour and 599 vehicles during the network
PM peak hour, largely due to the Sky campus development, the existing junction is
expected to operate well above capacity during the 2025 Do Nothing scenario.
6.6.23 As previously outlined, the Section 106 agreement for the Sky campus development
includes a commitment to provide highway improvements at the junction to replace the
existing mini-roundabout prior to phase 3 of the development being progressed. It is
understood that an improvement scheme has yet to be specified, therefore it has not
been possible to assess the impact of the proposed development against the proposed
junction layout.
6.6.24 The modelling results for the existing junction presented in Table 22 have therefore been
used to test the impact of the proposed development. The modelling results indicate a
worst-case PRC increase of 16.3% as a result of the development proposals (Syon Lane
(E) arm, AM peak), with lower maximum increases of 11.6% and 5.4% during the
respective school and network PM peak periods.
6.6.25 Although these PRC increases are relatively high, it is considered that the mitigation
scheme provided by the Sky campus development will alleviate future congestion at the
junction and that sufficient capacity will also be provided to accommodate future traffic
growth on the corridor, including capacity to accommodate traffic associated with the
proposed development. It is also reiterated that the junction currently appears to
operate within capacity, with any queuing largely emanating from the Syon Lane/A4
signal junction.
6.6.26 It is therefore considered that the proposed development will not have a severe impact
on the operation of the Syon Lane/Grant Way mini-roundabout.
Syon Lane/Great West Road (A4)/Harlequin Avenue Signal Junction
6.6.27 In order to assess the ability of the Syon Lane/Great West Road (A4)/Harlequin Avenue
signalised junction to accommodate the traffic associated with the proposed
development, a capacity assessment has been undertaken using LinSig v3, a design and
assessment tool for traffic signal junctions. Signal controller data for the junction model
was obtained from the junction model outputs contained within the TA for Nishkam
School (SA, 2015a) and the lane input parameters have been obtained through a
combination of scaled aerial imagery and scaled Ordnance Survey plans.
6.6.28 The stage sequencing applied during the AM and PM peak hours is representative of the
staging observed on site during these periods. The junction is understood to operate
under an Urban Traffic Control (UTC) system which covers the wider A4 corridor,
therefore the actual peak hour staging and cycle times are reactive to traffic levels on
the corridor at any given time. In order to assess the operation of the junction within
LinSig, the back-up cycle time and staging which is used as a fall-back if the UTC system
fails has been adopted. The back-up cycle time is 112 seconds and this has been used as
a baseline for all peak hour assessments.

Bolder Academy Macfarlane Lane, Isleworth Transport Assessment
traffic engineering and transport planning Page 51 of 66
6.6.29 The existing and projected future peak hour traffic flows have been assessed against the
existing junction layout, the results of which are summarised in Table 23, with the
complete modelling output included as Appendix 24.
Table 23: Syon Lane/Great West Road (A4)/Harlequin Avenue Junction Capacity Assessment
Movement From
2015 Existing 2025 Do Nothing 2025 With Development 2025 Development
Impact
Degree of Saturation
(%)
Mean Max Queue (PCU)
Degree of Saturation
(%)
Mean Max Queue (PCU)
Degree of Saturation
(%)
Mean Max Queue (PCU)
Degree of Saturation
(%)
Mean Max Queue (PCU)
AM Peak (08:00-09:00)
Great West Road (E) (at Syon Lane) 74.1% 13.6 113.0% 60.8 122.1% 69.0 +9.1% +8.2
Syon Lane (S) 107.4% 44.7 124.4% 115.7 128.3% 134.1 +3.9% +18.4
Great West Road (W) (at Syon Lane) 105.8% 54.9 124.6% 138.2 130.2% 143.1 +5.6% +4.9
Syon Lane (N) 104.9% 38.5 121.2% 83.1 129.8% 94.6 +8.6% +11.5
Great West Road WBD Ped Crossing (at Syon Lane)
31.8% 0.2 44.6% 0.4 44.3% 0.4 -0.3% 0
Great West Road (W) (at Harlequin Avenue)
95.2% 39.3 105.5% 79.0 105.8% 80.4 +0.3% +1.4
Harlequin Avenue 34.6% 1.5 41.1% 1.9 41.1% 1.9 0 0
Great West Road (E) (at Harlequin Ave)
35.7% 4.4 115.8% 19.0 115.8% 19.0 0 0
Great West Road WBD Ped Crossing (at Harlequin Avenue)
35.8% 4.8 59.9% 9.4 61.0% 10.5 +1.1% +1.1
Overall Practical Reserve Capacity (PRC)
-19.4% -38.6% -45.0% -6.4%
School PM Peak (15:00-16:00)
Great West Road (E) (at Syon Lane) 93.8% 21.7 98.7% 30.0 101.0% 36.6 +2.3% +6.6
Syon Lane (S) 92.6% 23.0 100.2% 34.4 104.4% 50.3 +4.2% +15.9
Great West Road (W) (at Syon Lane) 90.4% 16.6 96.1% 19.9 116.0% 41.9 +19.9% +22.0
Syon Lane (N) 87.3% 8.2 101.7% 15.0 120.2% 61.9 +18.5% +46.9
Great West Road WBD Ped Crossing (at Syon Lane)
38.3% 0.8 39.0% 12.1 40.2% 16.9 +1.2% +4.8
Great West Road (W) (at Harlequin Avenue)
51.4% 11.0 56.0% 12.6 56.7% 12.9 +0.7% +0.3
Harlequin Avenue 72.1% 4.3 69.4% 4.4 69.4% 4.4 0 0
Great West Road (E) (at Harlequin Avenue)
39.4% 5.4 42.4% 6.2 42.8% 6.4 +0.4% +0.2
Great West Road WBD Ped Crossing (at Harlequin Avenue)
40.5% 5.8 43.2% 6.9 43.6% 7.0 +0.4% 0.1
Overall Practical Reserve Capacity (PRC)
-4.3% -13.0% -33.5% -20.5%

Bolder Academy Macfarlane Lane, Isleworth
Transport Assessment
Page 52 of 66 www.local-transport-projects.co.uk
Movement From
2015 Existing 2025 Do Nothing 2025 With Development 2025 Development
Impact
Degree of Saturation
(%)
Mean Max Queue (PCU)
Degree of Saturation
(%)
Mean Max Queue (PCU)
Degree of Saturation
(%)
Mean Max Queue (PCU)
Degree of Saturation
(%)
Mean Max Queue (PCU)
Network PM Peak (17:00-18:00)
Great West Road (E) (at Syon Lane) 98.7% 37.0 141.7% 223.2 116.6% 103.4 -25.1% -119.8
Syon Lane (S) 107.7% 44.9 100.4% 28.4 109.1% 59.9 +8.7% +31.5
Great West Road (W) (at Syon Lane) 106.8% 50.3 135.0% 116.9 145.8% 149.7 +10.8% +32.8
Syon Lane (N) 95.8% 16.0 151.0% 145.0 156.5% 159.3 +5.5% +14.3
Great West Road WBD Ped Crossing (at Syon Lane)
51.6% 7.4 41.7% 12.7 45.9% 13.4 +4.2% +0.7
Great West Road (W) (at Harlequin Avenue)
71.2% 17.8 83.3% 23.3 83.6% 23.4 +0.1% +0.1
Harlequin Avenue 84.7% 9.7 91.5% 12.8 91.5% 12.8 0 0
Great West Road (E) (at Harlequin Avenue)
56.5% 11.8 62.2% 14.3 62.3% 14.3 +0.1% 0
Great West Road WBD Ped Crossing (at Harlequin Avenue)
55.6% 8.2 58.7% 9.9 58.7% 9.9 0 0
Overall Practical Reserve Capacity (PRC)
-19.6% -67.8% -73.9% -6.1%
6.6.30 The Degree of Saturation (DoS) quoted within the above tables is a ratio of the demand
capacity on each approach to the junction, with a value of 100% meaning that demand
and capacity are equal. The results of the capacity assessments presented in Table 23
indicate that the traffic signal junction is predicted to operate above capacity in all
modelled scenarios, with notable decreases in the overall Practical Reserve Capacity
(PRC) between the 2015 Existing and 2025 Do Nothing scenarios, largely due to the
cumulative impact of local committed developments, most notably the Sky campus
development. This is particularly notable during the AM and network PM peak hours.
6.6.31 The proposed development is expected to result in PRC decreases of -6.4%, -20.5% and
-6.1% during the respective AM, school PM and network PM peak hours. The AM and
network PM peak hour PRC reductions are not considered to be significant, and although
the school PM peak hour reduction is more considerable, this is expected to occur
outside of the peak hours of the local highway network when the junction is expected to
operate with greater levels of PRC. It is noted that the modelling outputs represent a
back-up scenario and that the junction is under a UTC system, which is expected to
realise a number of capacity benefits by managing traffic demand during the peak hours.
The actual operation of the junction is therefore expected to be better than reported
within Table 23.
6.6.32 Although the proposed development is expected to result in DoS increases and PRC
decreases in all modelled scenarios, the impact of the development is not considered to
be as severe as the impact of previously approved developments. Table 17 demonstrates
that the approved Sky campus development is expected to generate an additional 401
AM peak hour and 314 network PM peak hour trips at the junction, in comparison to the
proposed development which is expected to generate 314 trips and 53 trips respectively.
Mitigation measures were not required to as part of the Sky campus development or
other local committed developments, therefore it is considered that any request for
mitigation as part of the proposed development would not be justified in this context.

Bolder Academy Macfarlane Lane, Isleworth Transport Assessment
traffic engineering and transport planning Page 53 of 66
6.6.33 It is therefore considered that the proposed development is not expected to have a
severe impact on the operation of the Syon Lane/A4/Harlequin Avenue signalised
junction.
Wood Lane/Great West Road (A4) Signal Junction
6.6.34 In order to assess the ability of the Wood Lane/Great West Road (A4) signalised junction
to accommodate the traffic associated with the proposed development, a capacity
assessment has been undertaken using LinSig v3 modelling software. Signal controller
data for the junction model was obtained from TfL and the lane input parameters have
been obtained through a combination of scaled aerial imagery and scaled Ordnance
Survey plans. The stage sequencing applied during the AM and PM peak periods is
representative of the staging observed on site during these periods. As with the Syon
Lane/A4 junction, the Wood Lane/A4 junction is under a UTC system, therefore staging
and cycle times are reactive to traffic levels on the A4 corridor. In order to assess the
operation of the junction, the back-up cycle time of 112 seconds has been utilised for the
PM peak periods, however it was found that capacity benefits could be realised by
running a 96 second cycle time during the AM peak hour, therefore this has been utilised
within the model.
6.6.35 The existing and projected future peak hour traffic flows have been assessed against the
existing junction layout, the results of which are summarised in Table 24, with the
complete modelling output included as Appendix 25.
Table 24: Wood Lane/Great West Road (A4) Junction Capacity Assessment
Movement From
2015 Existing 2025 Do Nothing 2025 With Development 2025 Development Impact
Degree of Saturation
(%)
Mean Max Queue (PCU)
Degree of Saturation
(%)
Mean Max Queue (PCU)
Degree of Saturation
(%)
Mean Max Queue (PCU)
Degree of Saturation
(%)
Mean Max Queue (PCU)
AM Peak (08:00-09:00)
Great West Road (W) 77.1% 17.5 102.9% 61.1 104.2% 65.4 +1.3% +4.3
Great West Road (E) 39.3% 6.5 40.5% 6.8 42.9% 7.4 +2.4% +0.6
Wood Lane (S) 75.1% 7.3 96.4% 12.2 97.0% 13.6 +0.6% +1.4
Wood Lane (N) 60.9% 7.8 69.1% 8.7 64.6% 8.5 -4.5% -0.2
Great West Road (W) Ped Crossing 39.0% 1.7 40.3% 1.8 42.1% 1.9 +1.8% +0.1
Great West Road (E) Ped Crossing 72.0% 4.1 91.6% 14.4 91.3% 14.7 -0.3% +0.3
Practical Reserve Capacity (PRC) +16.7% -14.4% -15.7% -1.3%
School PM Peak (15:00-16:00)
Great West Road (W) 90.2% 8.7 96.4% 10.2 96.4% 10.7 0% +0.5
Great West Road (E) 58.2% 12.7 64.4% 15.5 66.8% 16.6 +2.4% +1.1
Wood Lane (S) 77.3% 8.6 78.6% 9.2 81.2% 10.2 +2.6% +1.0
Wood Lane (N) 63.3% 4.9 66.6% 5.3 61.3% 5.2 +5.3% -0.1
Great West Road (W) Ped Crossing 56.0% 1.9 61.9% 2.7 63.9% 2.6 +2.0% -0.1
Great West Road (E) Ped Crossing 45.0% 1.8 49.4% 1.7 51.0% 1.8 +1.6% +0.1
Practical Reserve Capacity (PRC) -0.2% -7.2% -7.2% 0%

Bolder Academy Macfarlane Lane, Isleworth
Transport Assessment
Page 54 of 66 www.local-transport-projects.co.uk
Movement From
2015 Existing 2025 Do Nothing 2025 With Development 2025 Development Impact
Degree of Saturation
(%)
Mean Max Queue (PCU)
Degree of Saturation
(%)
Mean Max Queue (PCU)
Degree of Saturation
(%)
Mean Max Queue (PCU)
Degree of Saturation
(%)
Mean Max Queue (PCU)
Network PM Peak (17:00-18:00)
Great West Road (W) 92.3% 14.2 96.4% 15.4 96.4% 15.7 0% +0.3
Great West Road (E) 76.1% 21.8 80.1% 24.6 80.5% 25.0 +0.4% +0.4
Wood Lane (S) 82.9% 10.3 86.6% 11.3 88.2% 11.8 +1.6% +0.4
Wood Lane (N) 75.8% 6.3 81.5% 7.1 79.2% 6.9 -2.3% -0.2
Great West Road (W) Ped Crossing 71.0% 1.9 75.5% 2.8 75.8% 2.8 +0.3% 0
Great West Road (E) Ped Crossing 58.7% 2.4 61.5% 2.3 61.6% 2.2 +0.1% -0.1
Practical Reserve Capacity (PRC) -2.6% -7.2% -7.2% 0%
6.6.36 The results of the capacity assessments presented in Table 24 indicate that the existing
Wood Lane/Great West Road (A4) signalised junction is predicted to operate within 100%
DoS with a negative PRC during the school and network PM peak periods, and is
predicted to operate slightly above 100% DoS during the AM peak period (Great West
Road W arm), with a negative PRC in 2025 with the proposed development in place. It is
reiterated that the modelling outputs represent a back-up scenario and that the junction
is under a UTC system, which is expected to realise a number of capacity benefits by
managing traffic demand during the peak hours. The actual operation of the junction is
therefore expected to be better than reported within Table 24.
6.6.37 It is noted however, that the impact of the proposed development on the junction is not
considered to be severe. The maximum DoS increase during the AM peak hour is
expected to be 2.4%, with a maximum queue increase of 4.3 PCUs and an overall PRC
reduction of 1.3%. The proposed development is not expected to reduce the overall PRC
of the junction during the school or network peak hours, with maximum increases of
5.3% DoS and 1.0 PCUs during the school PM peak and 1.6% DoS and 0.4 PCUs during the
network peak hour.
6.6.38 It is therefore considered that the proposed development is not expected to have a
significant impact on the operation of the Wood Lane/A4 signalised junction.
Thornbury Road/Great West Road (A4) Signal Junction
6.6.39 In order to assess the ability of the Thornbury Road/Great West Road (A4) signalised
junction to accommodate the traffic associated with the proposed development, a
capacity assessment has been undertaken using LinSig v3 modelling software. Signal
controller data for the junction model was obtained from the junction model outputs
contained within the TA for Nishkam School (SA, 2015a) and the lane input parameters
have been obtained through a combination of scaled aerial imagery and scaled Ordnance
Survey plans. The stage sequencing applied during the AM and PM peak periods is
representative of the staging observed on site during these periods. As with other local
signalised junctions, the Thornbury Road/A4 junction is under a UTC system, therefore
staging and cycle times are reactive to traffic levels on the A4 corridor. In order to assess
the operation of the junction, the back-up cycle time of 112 seconds has been utilised
for all assessed periods.

Bolder Academy Macfarlane Lane, Isleworth Transport Assessment
traffic engineering and transport planning Page 55 of 66
6.6.40 The existing and projected future peak hour traffic flows have been assessed against the
existing junction layout, the results of which are summarised in Table 25, with the
complete modelling output included as Appendix 26.
Table 25: Thornbury Road/Great West Road (A4) Junction Capacity Assessment
Movement From
2015 Existing 2025 Do Nothing 2025 With Development 2025 Development Impact
Degree of Saturation
(%)
Mean Max Queue (PCU)
Degree of Saturation
(%)
Mean Max Queue (PCU)
Degree of Saturation
(%)
Mean Max Queue (PCU)
Degree of Saturation
(%)
Mean Max Queue (PCU)
AM Peak (08:00-09:00)
Great West Road (E) 81.0% 16.7 84.7% 18.4 95.2% 19.5 +10.5% +1.1
Thornbury Road (S) 95.4% 12.4 108.9% 23.4 110.8% 27.4 +1.9% +4.0
Great West Road (W) 101.9% 55.5 109.8% 94.7 112.3% 106.8 +2.5% +12.1
Thornbury Road (N) 80.7% 10.9 91.4% 14.6 87.2% 13.7 -4.2% -0.9
Great West Road (W) Ped Crossing 48.9% 14.0 51.9% 15.2 52.6% 16.1 +0.7% +0.9
Great West Road (E) Ped Crossing 74.2% 2.0 73.7% 1.8 73.0% 2.1 -0.7% +0.3
Practical Reserve Capacity (PRC) -13.2% -22.0% -24.8% -2.8%
School PM Peak (15:00-16:00)
Great West Road (E) 67.8% 17.2 75.9% 21.2 78.6% 22.5 +2.7% +1.3
Thornbury Road (S) 66.7% 6.0 64.4% 6.3 66.2% 6.9 +1.8% +0.6
Great West Road (W) 69.9% 13.2 74.6% 15.9 74.6% 16.5 0% +0.6
Thornbury Road (N) 68.5% 6.0 75.2% 7.7 74.5% 7.9 -0.7% +0.2
Great West Road (W) Ped Crossing 52.3% 14.6 56.4% 17.8 56.9% 18.4 +0.5% +0.6
Great West Road (E) Ped Crossing 43.2% 0.5 46.9% 0.6 47.4% 0.6 +0.5% 0
Practical Reserve Capacity (PRC) +28.8% +17.4% +14.4% -3.0%
Network PM Peak (17:00-18:00)
Great West Road (E) 85.9% 27.9 91.9% 33.4 92.2% 33.9 +0.3% +0.5
Thornbury Road (S) 76.0% 7.3 75.1% 7.5 77.1% 7.8 +2.0% +0.3
Great West Road (W) 77.6% 20.1 81.4% 23.1 81.4% 23.1 0% 0
Thornbury Road (N) 84.7% 8.8 86.9% 9.9 88.0% 10.2 +1.1% +0.3
Great West Road (W) Ped Crossing 62.6% 18.4 66.5% 18.5 66.7% 18.5 +0.2% 0
Great West Road (E) Ped Crossing 53.5% 0.7 56.5% 0.8 56.7% 0.8 +0.2% 0
Practical Reserve Capacity (PRC) +4.8% -2.1% -2.4% -0.3%
6.6.41 The results of the capacity assessments presented in Table 25 indicate that the existing
Thornbury Road/Great West Road (A4) signalised junction is predicted to operate within
100% DoS with a positive PRC during the school PM peak period with the proposed
development in place. The junction is expected to operate slightly above 100% DoS on
the Thornbury Road (S) and Great West Road (W) arms during the AM peak period, with
a negative overall PRC and is expected to operate within 100% DoS with a negative
overall PRC during the network PM peak hour. It is reiterated that as with other local A4
signalised junctions, the junction operates under a UTC system, therefore the results
presented within Table 25 represent a robust worst-case assessment, with the actual
capacity expected to be better than reported.

Bolder Academy Macfarlane Lane, Isleworth
Transport Assessment
Page 56 of 66 www.local-transport-projects.co.uk
6.6.42 It is noted however, that the impact of the proposed development on the junction is not
considered to be severe. The maximum DoS increase during the AM peak hour is
expected to be 10.5%, with a maximum queue increase of 12.1 PCUs and an overall PRC
reduction of 2.8%. The maximum DoS increase during the school PM peak hour is
expected to be 2.7%, with a maximum queue increase of 1.3 PCUs and an overall PRC
reduction of 3.0%. The development is expected to result in negligible DoS and queuing
increases during the network PM peak hour, with an overall PRC reduction of 0.3%.
6.6.43 It is therefore considered that the proposed development is not expected to have a
significant impact on the operation of the Thornbury Road/A4 signalised junction.
6.7 Impact on Local Highway Network
6.7.1 The results of the junction capacity assessments demonstrate that the proposed
development would not be expected to have a significant impact on the operation of
most key local junctions, particularly in light of the approval of other local committed
developments which are expected to have a greater traffic impact. It is proposed to
provide a mitigation scheme at the Syon Lane/Tesco roundabout as this is where the
greatest impact of the development is likely to be experienced.
6.7.2 It is noted that the junction capacity assessments provide a ‘worst-case’ appraisal of
junction capacity by assuming that the start and end times for Bolder Academy and the
approved Nishkam School would clash. It is proposed to provide a stagger between the
start and end times of the two schools which cannot be reflected within the junction
modelling, however there are likely to be practical ‘real-world’ benefits in providing a
stagger. It is also re-iterated that the trip generation projections included a number of
worst-case assumptions which have been carried forward to the junction capacity
assessments. It is therefore considered that capacity assessment results are suitably
robust.
6.7.3 Based on the assessments detailed in this TA, it is therefore considered that the proposed
development should not have a detrimental impact on the operation of the local highway
network. Therefore, as the impact of the proposals is not expected to be severe, the
proposals are considered to be in accordance with the ‘National Planning Policy
Framework’ (DCLG, 2012), which states that “development should only be prevented or
refused on transport grounds where the residual cumulative impacts of development are
severe”.

Bolder Academy Macfarlane Lane, Isleworth Transport Assessment
traffic engineering and transport planning Page 57 of 66
7.0 PEDESTRIAN, CYCLE & PUBLIC TRANSPORT IMPACT
7.1 Impact on Pedestrian and Cycle Infrastructure
7.1.1 As previously outlined, the proposed site is expected to have a localised catchment and
approximately 42.7% of pupils (492 pupils at full capacity) could be expected to walk to
and from the proposed site. Approximately 75% of pupils could be expected to travel
from within 2.5km of the site, therefore the walking modal split could be expected to
increase as a result of the robust Travel Plan (LTP, 2017), which outlines measures to
promote walking trips to and from the site.
7.1.2 Given that the majority of the catchment area lies to the south and west of the site, it is
expected that most pupils will utilise two primary walking routes when travelling to and
from the site, these being:
Macfarlane Lane/Syon Lane (S); and
Macfarlane Lane/Footpath/Wood Lane.
7.1.3 Beyond this, it is expected that pupils will disperse across a number of available routes.
These primary routes are also expected to be used by pupils and staff arriving and
departing the site by public transport.
7.1.4 The modal split projections indicate that approximately 3.0% of pupils travelling to and
from the site would be expected to cycle, this equates to 34 pupils upon full capacity of
the site. The projections indicate that approximately 4.3% of staff could be expected to
cycle to and from the site. It is expected that the cycling modal split will increase as a
result of the implementation of the cycling specific measures outlined within the Travel
Plan (LTP, 2017).
7.1.5 A total of three primary cycle routes have been identified, these being:
Macfarlane Lane/Syon Lane (S)/A4 (E);
Macfarlane Lane/Syon Lane (S)/A4 (W); and
Macfarlane Lane/Syon Lane (S) towards railway station.
7.1.6 In order to assess the suitability of local pedestrian and cycle infrastructure to
accommodate the pupils and staff trips to and from the site, PERS and CERS audits have
been undertaken, covering the routes outlined above and the links, junctions and
interchange points within them. The full audit report is included as Appendix 27. A
number of ‘Quick Wins’ and potential mitigation schemes were identified as part of the
audit process. The schemes which are considered to provide the greatest benefit to the
pedestrian and cycle environment are to be provided as part of the development
proposals and are included within the list of off-site highway works in Section 7.4.

Bolder Academy Macfarlane Lane, Isleworth
Transport Assessment
Page 58 of 66 www.local-transport-projects.co.uk
7.2 Impact on London Bus Network
7.2.1 In order to assess the impact of the proposed school on the London bus network, the
modal split projections have been combined with the proposed catchment area in order
to predict the number of pupils likely to utilise each local bus service to access the school.
For the purposes of this assessment, it is assumed that all pupils travelling by bus would
utilise existing public bus services (routes H28 and H91), however one of the measures
of the Travel Plan (LTP, 2017) is to assess the requirement for dedicated school buses,
which would be determined by the projected demand once the school is operational.
7.2.2 As shown within Table 10, a total of 32.6% of pupils are expected to travel to the site by
bus, based on the average for mixed-gender secondary schools within Hounslow. This
equates to a total of 375 pupils travelling by bus upon full occupation of the site. For the
purposes of this assessment, it is assumed that 60% of pupils travelling by bus would do
so from within the catchment area, with the remaining 40% from outside of the
catchment area. It is therefore assumed that 19.5% of pupil bus trips generated by the
site would be from inside the catchment area, with 13.0% from outside the catchment
area.
7.2.3 The 12 trip zones identified for traffic assignment purposes shown on the plan attached
as Appendix 15 have been used to determine the proportion of pupils likely to travel on
each bus service from each area. A full breakdown of the number
7.2.4 Table 26 provides an outline of the percentage and number of pupils likely to utilise each
route during the respective school AM and PM peak hours, with a full breakdown
included as Appendix 28. For the purposes of this assessment, it is assumed that an equal
number of pupils would use each available bus service during the hour before school and
the hour after school, although arrival and departure profiles may be more staggered,
particularly during the PM peak period when after school clubs are in operation.
Table 26: Impact on Local Bus Services
*Totals may not represent the sum of their parts due to rounding
7.2.5 As shown in Table 26, the majority of pupils could be expected to utilise Route H28,
particularly given that this route serves large parts of Osterley, Isleworth and Hounslow.
Given the route taken by this service, it could be expected that pupils travelling towards
to site from Hounslow and Osterley would alight the service on Wood Lane and walk the
remainder of the journey to school, whereas pupils travelling towards the site from
Isleworth would be expected to alight at Osterley Tesco.
Bus Service % of Pupils using route
No. of Pupils using route
No. of services per hour
Proposed No. of Pupils using each
bus during AM Peak (08:00-09:00)
Proposed No. of Pupils using each
bus during PM Peak (15:00-16:00)
H28 72% 270 3 90 90
H91 28% 105 7 15 15
TOTAL 100% 375

Bolder Academy Macfarlane Lane, Isleworth Transport Assessment
traffic engineering and transport planning Page 59 of 66
7.2.6 Fewer pupils could be expected to travel on Route H91, with the majority of these pupils
travelling to/from Hounslow or Brentford. Table 26 demonstrates that based on the
provision of 7 vehicles per hour in each direction during the peak hours, it could be
expected that on average, 15 pupils would travel on each service, notwithstanding the
potential future provision of dedicated school buses. Given that the route is currently
operated to a relatively high frequency by double deck vehicles, it is considered that the
proposed development would not be expected to have a significant impact on the
capacity of Route H91 services. It is also noted that a Section 106 contribution has been
made as part of the Sky campus development for the upgrade of H91 services, with a
future target 8 minute service frequency which is expected to further enhance service
capacity.
7.2.7 It is noted that pupils utilising both routes H28 and H91 may already be likely to travel
on these services to other local schools. It is also considered that those pupils living
within a 2km walk of the site but that are projected to travel by bus may be encouraged
to walk or cycle as an alternative. The relative impact on bus services may therefore not
be as high as reported within Table 26.
7.2.8 Given the phased approach to occupation of the school, it is recommended that the
number of pupils utilising each bus service to access Bolder Academy is monitored during
the first few years of opening to determine whether any service enhancements are likely
to be required once the school is operating at full capacity. It is understood that TfL has
funding available to cover the costs of enhancements to bus services resulting from the
opening of Free Schools throughout the lifetime of the current parliament.
7.3 Impact on Train & London Underground Services
7.3.1 As shown within Table 10, a total of 4.0% of pupils at Bolder Academy are expected to
travel by train or London Underground (LU), which equates to a total of 46 pupils upon
full occupation of the site. Table 12 demonstrates that approximately 15.0% of staff
would be expected to travel by train (14 staff) and 7.0% would be expected to travel by
London Underground services (6 staff).
7.3.2 All staff and pupils travelling by train would be expected to travel via Syon Lane railway
station, with those travelling by LU expected to travel via Osterley. Given the relatively
low numbers expected to travel via both train and LU, it is expected that the proposed
development would not be expected to have a significant impact on the capacity of these
services, particularly given the frequency of services available during peak hours from
both Syon Lane and Osterley.

Bolder Academy Macfarlane Lane, Isleworth
Transport Assessment
Page 60 of 66 www.local-transport-projects.co.uk
7.4 Off-Site Highway Works
7.4.1 The following off-site highway works are to be provided as part of the development
proposals in a phased approach based upon occupation of the school:
Widening of Macfarlane Lane to provide a 6.0m carriageway and a 3.0m footway on
the northern side between Syon Lane and Bolder Academy, including new street
lighting to adoptable standard;
Provision of a revised crossing point with tactile paving on a raised table at the
Macfarlane Lane/Goals access road junction;
Widening of Syon Lane at the Macfarlane Lane junction to provide a ghost-island
right-turn lane to serve Macfarlane Lane;
Provision of a zebra crossing to the north of Macfarlane Lane at the Syon Lane
junction;
Provision of a segregated cycle facility on the northern side of Syon Lane between
Macfarlane Lane and the A4 junction, including appropriate crossing points at the
Syon Lane/Grant Way and Syon Lane/Tesco roundabouts. It is understood that a TfL
scheme to improve the pedestrian and cycle infrastructure at the A4 junction is
proposed and would tie in with the proposed segregated facility to provide links
to/from the south.
Improvements to the existing dropped kerbs and installation of tactile paving on all
arms of the Syon Lane/Tesco roundabout;
Provision of a mitigation scheme at the Syon Lane/Tesco roundabout to increase
capacity and mitigate against levels of queueing;
Improvements to the subway connecting Syon Lane at the A4 junction, including
repairing/cleaning lights and mirrors and installation of corduroy tactile paving at
subway steps;
Installation of dropped kerbs and tactile paving at the Syon Lane/Northumberland
Avenue junction; and
Reducing obstructions wherever possible on the southern side of Syon Lane within
the vicinity of the shopping parade.

Bolder Academy Macfarlane Lane, Isleworth Transport Assessment
traffic engineering and transport planning Page 61 of 66
8.0 CONCLUSIONS
8.1.1 This Transport Assessment (TA) provides a detailed appraisal of the transport impacts
associated with proposals to construct a new secondary school (Bolder Academy) at the
site of the existing Grasshoppers Rugby Football Club (GRFC) at 1 Macfarlane Lane,
Isleworth, Hounslow, TW7 5PN. The proposed school will have a capacity of 1,150 pupils
and is expected to employ a total of 90 staff.
8.1.2 The proposed site will be accessed via Macfarlane Lane, which will be improved in order
to provide a 6.0m carriageway and a 3.0m footway on the northern side across the full
length between Syon Lane and the proposed site. A ghost-island right-turn lane will be
provided into Macfarlane Lane from Syon Lane, and it is proposed to provide a zebra
crossing on Syon Lane to the north of the Macfarlane Lane junction.
8.1.3 With the exception of Special Educational Need (SEN) pupils, pupil drop-offs and pick-
ups will not be permitted on site or across the full length of Macfarlane Lane. There are
waiting restrictions in place on both Syon Lane and Macfarlane Lane to restrict such
movements. The car park of the nearby Tesco Extra store will be utilised as a park and
stride facility for the school.
8.1.4 A total of 57 car parking spaces are to be provided on-site (including 7 accessible bays)
for use by staff and visitors. A total of 9 car parking spaces are to be provided with Electric
Vehicle (EV) charging points, with passive provision at a further 7 spaces for potential
future connection. A total of 150 cycle parking spaces will be provided in secure stores
at several locations around the development.
8.1.5 A Travel Plan (LTP, 2017) that provides a strategy for encouraging sustainable travel at
the proposed school has been produced in conjunction with this TA as a separate
document.
8.1.6 The proposed development is located within a reasonable walking distance (up to 2km)
of the residential areas of Osterley and Isleworth which form part of the expected school
catchment. Subject to the proposed pedestrian improvements on Macfarlane Lane,
there is generally good quality pedestrian infrastructure available within the vicinity of
the site, with continuous pedestrian links between the site and the local residential
catchment. Dropped kerbs and tactile paving are generally provided at local junctions,
with formal crossing facilities available at strategic crossing points, including at the Syon
Lane/A4 and Wood Lane/A4 junctions. A Pedestrian Environment Review System (PERS)
audit has been undertaken In order to assess the suitability of the local pedestrian
network to accommodate the pedestrian trips likely to be generated by the site.
8.1.7 The proposed site is located within a 15 minute cycle ride of a large catchment area,
including Osterley, Brentford and Isleworth. There is an off-road shared-use
foot/cycleway on both sides of the A4 within the vicinity of the site, with the provision
continuing on-road through the Gillette Corner junction. A Cycling Environment Review
System (CERS) audit has been undertaken In order to assess the suitability of the local
cycle infrastructure to accommodate the cycling trips likely to be generated by the site.

Bolder Academy Macfarlane Lane, Isleworth
Transport Assessment
Page 62 of 66 www.local-transport-projects.co.uk
8.1.8 Despite having a PTAL rating of 0, the site is considered to be generally accessible by
public transport, with the nearest bus stop located within a 590m walk of the site
(additional services within 950m) and Syon Lane Rail Station located within a 1.1km walk.
The local bus stops accommodate routes H28 and H91, which operate at frequencies of
every 20 minutes and every 10 minutes respectively. Rail services on the Hounslow Loop
line operate at a frequency of approximately every 15 minutes from Syon Lane.
Continuous walking routes are available between the site and the local bus stops and rail
station.
8.1.9 A road casualty study showed that 88 collisions occurred within the local study area
around the proposed development site during the 5 year study period. Analysis of the
study collisions has not revealed any identifiable existing collision issues associated with
the expected movements generated by the proposed school, therefore it is considered
that there are no existing road safety issues pertinent to the development of the site. If
the proposed site access arrangements and off-site highway works are designed with due
consideration to road safety, then the proposals should not have a detrimental road
safety impact on the local transport network and should not adversely affect the safety
of pedestrians and cyclists.
8.1.10 The likely school catchment area has been determined based upon the distances
travelled by 75% of pupils attending existing mixed-gender secondary schools in
Hounslow. The 75th quartile travel distance is 2.47km (1.54 miles), therefore it could be
expected that 75% of pupils attending Bolder Academy would travel from within
approximately 2.5km of the site, in line with the borough average. This 2.5km distance
covers the areas of Osterley, Spring Grove and parts of Isleworth and Brentford.
8.1.11 The proposed pupil modal split is based upon the average modal split of pupils attending
mixed-gender secondary schools in Hounslow. The projections indicate that
approximately 15.4% of pupils would be expected to travel by vehicle trip generating
modes (park and stride), with the remainder travelling by more sustainable modes of
transport, most notably by bus or on foot. This equates to 178 pupils travelling by vehicle
trip generating modes based upon full occupation of the site, which is considered to
represent a robust worst-case assessment. Assuming that 95% of pupils would arrive
during the AM peak hour (08:00-09:00) and that 70% would leave in the school PM peak
hour (15:00-16:00), with 15% during the network PM peak hour (17:00-18:00), pupil trips
could be expected to generate up to 338 two-way vehicle trips during the AM peak hour,
250 two-way trips during the school PM peak hour and 54 two-way trips during the
network PM peak hour.

Bolder Academy Macfarlane Lane, Isleworth Transport Assessment
traffic engineering and transport planning Page 63 of 66
8.1.12 The proposed staff modal split is based upon the average modal split for the existing
workplace population of the ‘Hounslow 009’ Middle Super Output Area (MSOA) within
which the site is located. These projections indicate that 58.4% of staff would be
expected to travel by vehicle trip generating modes, with the remainder travelling by
more sustainable modes of transport. This equates to 53 staff travelling to the site by
vehicle trip generating modes when the school is operating at full capacity. Assuming
that 75% of pupils would arrive during the AM peak hour (08:00-09:00) and that 50%
would leave in the school PM peak hour (15:00-16:00), with 25% during the network PM
peak hour (17:00-18:00), staff trips could be expected to result in the generation of 40
two-way AM peak hour trips, 27 two-way school PM peak hour trips and 13 network PM
peak hour trips.
8.1.13 The baseline weekday AM, school PM and network PM peak hour baseline traffic
situation within the vicinity of the site has been established through classified vehicle
turning counts undertaken at key local junctions on Wednesday 13th May 2015. The
traffic flow impact of the proposed development has been projected utilising traffic
growth forecasts to 2025, as this is when the school is expected to operate at full
capacity.
8.1.14 The distribution of development traffic associated with staff trips has been predicted
using a gravity model based upon the existing proportion of people travelling to
‘Hounslow 009’ from their usual residences (MSOAs and local authority districts) by
mode of travel. The predicted distribution of pupil trips is based upon a different gravity
model, utilising projections on the proportion of pupils likely to attend Bolder Academy
from different areas of Hounslow.
8.1.15 In order to assess the ability of key local junctions to accommodate the traffic associated
with the proposed development, junction capacity assessments have been undertaken
utilising Junctions 9 and LinSig modelling software. Subject to the provision of a
mitigation scheme to increase capacity at the Syon Lane/Tesco roundabout, it is
considered that the proposed development will not have a detrimental impact on the
operation of the local highway network, particularly considering the approval of local
committed developments and that the trip generation projections include a number of
worst-case assumptions.
8.1.16 The PERS and CERS audits have identified a number of ‘Quick Wins’ and mitigation
schemes which are to be implemented as part of the development proposals in order to
improve the pedestrian and cycle experience of pupils and staff travelling to and from
the site.
8.1.17 The impact of the development on the capacity of local bus services has been assessed.
The projections indicate that Route H28 may require future capacity improvements in
order to accommodate pupil demand. Given the phased approach to site occupation, it
is recommended that the number of pupils utilising both routes H28 and H91 to access
Bolder Academy is monitored during the first few years of opening to determine if and
when capacity enhancements are likely to be required. The proposed development is not
expected to have a significant impact on the capacity of train or London Underground
services.

Bolder Academy Macfarlane Lane, Isleworth
Transport Assessment
Page 64 of 66 www.local-transport-projects.co.uk
8.1.18 Based on the assessments of this TA, it is considered that the proposed development
would not be expected to have a severe detrimental impact on the operation of the local
highway network or the capacity of public transport. The proposals are therefore
considered to be in accordance with the ‘National Planning Policy Framework’ (NPPF)
which states that “development should only be prevented or refused on grounds where
the residual impacts of the development are severe” (DCLG, 2012).
8.1.19 It is concluded from the assessment within this TA that the proposed development would
not be expected to have a detrimental impact in road safety, traffic and highway terms.

Bolder Academy Macfarlane Lane, Isleworth Transport Assessment
traffic engineering and transport planning Page 65 of 66
9.0 REFERENCES
ARUP/iCube (ARUP), 2016. Sky Campus Development – Travel Plan Update.
ARUP, 2013. BskyB Campus Development and Phase 2 – Transport Assessment.
Colin Buchanan (CB), 2010. Mixed-use redevelopment of land at Brentford Lock West – Transport
Assessment and Draft Travel Plan.
Chartered Institution of Highways and Transportation (CIHT), 2010. Manual for Streets 2: Wider
Application of the Principles.
Department for Communities and Local Government (DCLG), 2014. Planning Practice Guidance - Travel
Plans, Transport Assessments and Statements in Decision-Taking (ID: 42-06/03/2014) [online:
http://planningguidance.planningportal.gov.uk].
DCLG, 2012. National Planning Policy Framework.
Department for Education (DfE), 2016. Pupil absence in schools in England: autumn term 2015. Table 1
[accessed: 21/02/2017].
Department for Transport (DfT), 2016. Road Safety Data [online: http://data.gov.uk/dataset/road-
accidents-safety-data] (released June 2016).
DfT, 2008. LTN 02/08 – Cycle Infrastructure Design.
DfT, 2007a. Guidance on Transport Assessment.
DfT, 2007b. Manual for Streets.
DfT, 2002. Inclusive Mobility.
Greater London Authority (GLA), 2010. Mayor’s Transport Strategy.
Institution of Highways and Transportation (IHT), 2000. Guidelines for Providing for Journeys on Foot.
IHT, 1999. Guidelines for Public Transport in Development.
London Borough of Hounslow Council (LBHC), 2015a. Local Plan 2015-2030, Volume One.
London Borough of Hounslow Council (LBHC), 2015b. Local Plan 2015-2030, Volume Two.
LBHC, 2011. Hounslow Local Implementation Plan for Transport 2011-2031.
Local Transport Projects (LTP), 2017. Proposed Secondary School (Bolder Academy), Macfarlane Lane,
Isleworth – Travel Plan.
Mayor of London (MoL), 2016, The London Plan - updated March 2016.
Motion Transport Planning (MTP), 2010. Proposed Mixed-Use Development, Gillette Corner, Hounslow –
Transport Assessment Addendum.
Pick Everard (PE), 2016a. Transport Statement for Relocation of Grasshoppers Rugby and Netball Club.
PE, 2016b. Travel Plan for Grasshoppers Rugby and Netball Club, Syon Lane, Osterley.
PE, 2016c. Addendum Report, Relocation of Grasshoppers Rugby & Netball Club.
Sanderson Associates (SA), 2015a. Transport Assessment For Proposed Nishkam School West London.
SA, 2015b. Travel Plan For Proposed Nishkam School West London.
SA, 2015c. Addendum to Technical Note for Nishkam School West London.
Transport for London (TfL), 2016. West London Sub-Regional Transport Plan, 2016 Update.
TfL, 2015. Transport Assessment Guidance [online: http://www.tfl.gov.uk/info-for/urban-planning-and-
construction/transport-assessment-guidance].

Bolder Academy Macfarlane Lane, Isleworth
Transport Assessment
Page 66 of 66 www.local-transport-projects.co.uk
TfL, 2013. London Local Cycling Guide 6.
TfL, 2010. Traffic Modelling Guidelines.
Transport Research Laboratory (TRL), 2015. Nishkam School, Hounslow. PERS Assessment.
TTP Consulting (TTP), 2016a. Gillette South Transport Assessment.
TTP, 2016b. Gillette South Residential Travel Plan.
WSP, 2013. Brentford, Land South of the High Street and Waterfront. Transport Assessment Addendum.
WSP, 2012. Brentford, Land South of the High Street and Waterfront. Transport Assessment.
WSP, 2009. Former Alfa Laval Site, Brentford. Transport Assessment.

Bolder Academy Macfarlane Lane, Isleworth Transport Assessment
traffic engineering and transport planning Appendix 1
Appendix 1 – Proposed Site Layout Plan