Arc Habitat Suitability Index computer software
37
United States Department of Agriculture Forest Service Rocky Mountain Research Station General Technical Report RMRS-GTR-180WWW September 2006 Arc Habitat Suitability Index Computer Software Thomas M. Juntti Mark A. Rumble
Transcript of Arc Habitat Suitability Index computer software

United States Departmentof Agriculture
Forest Service
Rocky MountainResearch Station
General Technical Report RMRS-GTR-180WWW
September 2006
Arc Habitat Suitability Index Computer Software
Thomas M. JunttiMark A. Rumble

Rocky Mountain Research StationNatural Resources Research Center
2150 Centre Avenue, Building AFort Collins, CO 80526
You may order additional copies of this publication by sending your mailing information in label form through one of the follow-ing media. Please specify the publication title and series number.
Publishing Services
Telephone (970) 498-1392 FAX (970) 498-1122 E-mail [email protected] Web site http://www.fs.fed.us/rm Mailing address Publications Distribution Rocky Mountain Research Station 240 West Prospect Road Fort Collins, CO 80526
Juntti, Thomas M.; Rumble, Mark A. 2006. Arc Habitat Suitability Index computer software. Gen. Tech. Rep. RMRS-GTR-180WWW. Ft. Collins, CO: U.S. Department of Agriculture, Forest Service, Rocky Mountain Research Station. 31 p.
Abstract—This user manual describes the Arc Habitat Suitability Index (ArcHSI), which is a geographical information system (GIS) model that estimates the ability of an area to meet the food and cover requirements of an animal species. The components and parameters of the model occur in tables and can be easily edited or otherwise modified. ArcHSI runs on personal computers with the full installation of ArcGIS (Version 8.2+). ArcHSI is a tool intended to inform planners of the probable impacts on wildlife for the alternatives they develop, and it augments, rather than supplants, the expertise of resource specialists with site-specific knowledge. System requirements are platform specific, but a typical system requires 512 megabytes RAM and a 1 gHz CPU. A Unix ArcINFO version is also available. We have included a demonstration (see DEMONSTRATION) that provides a step-by-step tour of the software, including setting up the first run; interpreting, formatting, and analyzing output; and identifying and solving the most common problems experienced by new users.
The Authors
Thomas M. Juntti is a Biological Science Technician with the USDA Forest Service, Rocky Mountain Research Station, Rapid City, SD. As a self-employed and university biologist and Forest Service Biological Science Technician, he has been producing biological science computer systems since 1983.
Mark A. Rumble is a Research Wildlife Biologist with the USDA Forest Service, Rocky Mountain Research Station, Rapid City, SD. He has researched wildlife habitat relationships for 25 years and has conducted tests of HabCap, the predecessor to ArcHSI for more than 10 years.
Acknowledgments
The authors thank Joshua Millspaugh, Parry Parrish, and Bonnie Allison for their thoughtful and helpful reviews; Kerry Burns, Patrice Lynch, and Todd Mills for beta-testing the software; John Varner for a key idea; and the Black Hills National Forest (ISA-203-01-004), the Rocky Mountain Elk Foundation (SD00268), and the South Dakota Department of Game, Fish and Parks (RMRS-98113-CC) for financial support.
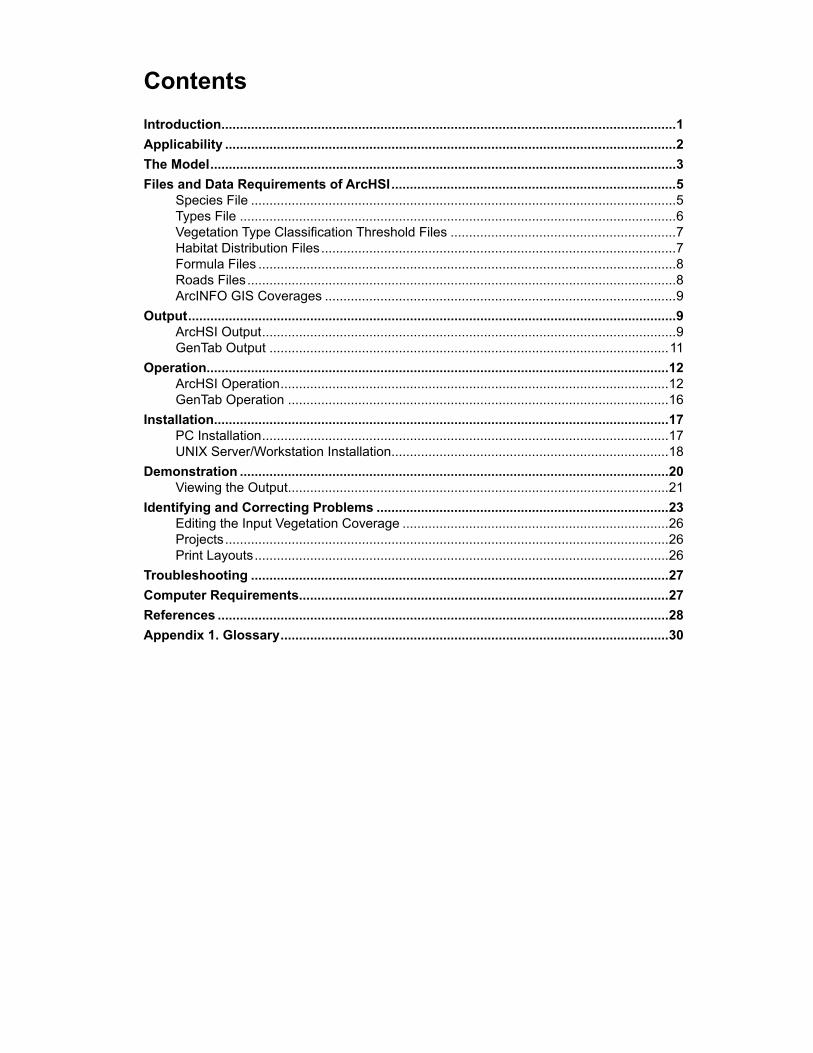
Contents
Introduction ...........................................................................................................................1
Applicability ..........................................................................................................................2
The Model ..............................................................................................................................3
Files and Data Requirements of ArcHSI .............................................................................5Species File ...................................................................................................................5Types File ......................................................................................................................6Vegetation Type Classification Threshold Files .............................................................7Habitat Distribution Files ................................................................................................7Formula Files .................................................................................................................8Roads Files ....................................................................................................................8ArcINFO GIS Coverages ...............................................................................................9
Output ....................................................................................................................................9ArcHSI Output ................................................................................................................9GenTab Output ............................................................................................................11
Operation .............................................................................................................................12ArcHSI Operation .........................................................................................................12GenTab Operation .......................................................................................................16
Installation ...........................................................................................................................17PC Installation ..............................................................................................................17UNIX Server/Workstation Installation ...........................................................................18
Demonstration ....................................................................................................................20Viewing the Output .......................................................................................................21
Identifying and Correcting Problems ...............................................................................23Editing the Input Vegetation Coverage ........................................................................26Projects ........................................................................................................................26Print Layouts ................................................................................................................26
Troubleshooting .................................................................................................................27
Computer Requirements ....................................................................................................27
References ..........................................................................................................................28
Appendix 1. Glossary .........................................................................................................30


USDA Forest Service RMRS-GTR-180WWW. 2006 1
Arc Habitat Suitability Index Computer Software
Thomas M. Juntti and Mark A. Rumble
Introduction
The National Environmental Policy Act (NEPA) mandates environmental analysis for land management projects that are likely to have a significant impact on wildlife and other values. Habitat modeling is a way of systematically inte-grating the predicted effects of multiple management alternatives on wildlife over numerous individual land units and over time. Modeling is a tool that provides a standardized, consistent approach to wildlife management across all levels of an organization. It can provide continuity through changes in personnel and varia-tion in expertise among staff.
Arc Habitat Suitability Index (ArcHSI) is a geographical information system (GIS) model that estimates the ability of an area to meet an animal species’ requirements for food and cover. While this definition seems simple enough, the literature contains a number of terms that tend to confuse this concept. The following definitions were taken from British Columbia Wildlife Habitat Rating Standards (1999).
Capability is defined as the ability of the habitat, under the optimal natural (seral) conditions for a species to provide its life requisites, irrespective of the current condition of the habitat. It is an estimate of the highest potential value of a particular habitat for a species and is useful in providing predictive scenarios for various habitat management options. Capability assumes non-intensive management and does not apply where the inherent soil characteristics and productivity have been artificially enhanced, as commonly occurs with irrigation or fertilization. The capability classification of these areas are (sic) based on what the ecosystems would be like if they reverted from their present state back to a non-intensive management state.
Suitability is defined as the ability of the habitat in its current condition to provide the life requisites of a species. It is an estimate of how well current habitat conditions provide the specified life requisite(s) of the species being con-sidered. The suitability of the land is frequently less than the capability because of unfavorable seral conditions. A suitability rating is given to each structural stage of each vegetation type in a project area. The structural stage(s) with the highest suitability rating describe the capability for any specific ecosystem. To assign suitability, a rating is the value assigned to a vegetation structural stage for its potential to support a particular species for a specified season and activity rela-tive to the best vegetation structural stages in the ecosystem used by that species for the same season and activity. It is expressed as a proportion of the best habitat in the province and it reflects the expected use of a habitat by the species.
Lyon and Christianson (1992) provide a glossary of terms specific to elk habitat management. These authors define habitat capability as the capacity of a given area to meet the needs of elk, either seasonally or year-round, and note that

2 USDA Forest Service RMRS-GTR-180WWW. 2006
it is nearly equivalent to carrying capacity. They also define habitat effectiveness as the percentage of available habitat that is usable by elk outside of the hunting season.
The application of habitat models in the Rocky Mountain Region of the USDA Forest Service derives from the need to evaluate and document land management alternatives on wildlife in order to comply with the requirements of NEPA. The initial application was based on ecosystem matrices described by Towry (1983). These matrices rated the value of forage and cover as habitat by vegetation cover type and structural stage for numerous wildlife species in the Rocky Mountain Region. The ratings were derived from the scientific literature and expert opinion. Beginning in the 1990s, the vegetation type-structural stage matrices for several species were modified based on field research (Rumble and Anderson 1995; Mills and others 1996). The geometric mean between forage and cover values provided a combined capability rating (Hitchcock and Ager 1992). Habitat capability modeling in the USDA Forest Service, Rocky Mountain Region became spatially explicit for deer and elk with the development of ArcHabcap, an unpublished model developed specifically for the Black Hills National Forest by Utah State University and based primarily on the model developed by Wisdom and others (1986). ArcHabcap treated deer and elk habitat in close proximity to roads as un-available even though it might otherwise have been of high quality (Thomas and others 1988; Rumble and others 2001). Although this treatment of road effects does not strictly conform to Lyon and Christianson’s definition, it is probably why ArcHabcap output was labeled “habitat effectiveness.” Research on elk in the Black Hills led to combining ArcHabcap model components for elk using a weighted arithmetic average instead of the geometic mean (Benkobi and others 2004).
ArcHabcap was designed to be applied to landscapes composed of vegetation types, each of which has a habitat capability; therefore, ArcHabcap does not model habitat capability despite its name. In order to conform to the established definitions (op sit), we feel that the program should be called Arc Habitat Suitability Index (ArcHSI). Numerically, our use of Habitat Suitability Index (HSI) is as originally defined by the U.S. Fish and Wildlife Service (1980a):
Study Area Habitat ConditionsHSI = ________________________ Optimum Habitat Conditions
If actual conditions are identical to optimum conditions, HSI equals one.
Applicability
ArcHSI is a tool intended to inform planners of the probable impacts on wildlife for the alternatives they develop. It is a tool that should augment, not supplant, the expertise of resource specialists with site-specific knowledge.
ArcHSI should be applied to areas large enough to encompass the home ranges of individuals of the species under consideration. For example, elk in the Black Hills require a minimum home range of approximately 2,500 acres (1,012 ha) (Benkobi and others 2005). Consequently, the minimum area for which the elk model should be applied is approximately 2,500 acres. Similarly, for any analysis to be meaningful, the area impacted by management must be large relative to

USDA Forest Service RMRS-GTR-180WWW. 2006 �
the area of the entire project. Retaining prior analyses and modeling vegetation changes over time allows fairly easy assessment of cumulative effects.
ArcHSI has several advantages over tabular summaries of habitat coefficients appearing in early versions of habitat capability models. The GIS output, even for species for which model components are not spatially explicit, allows users to visually display habitats for species and to make spatial inferences. For example, an analysis area can have uniformly moderate quality habitat or a mix of high quality and low quality habitats but have the same area-weighted average HSI. Identical treatment applied to these landscapes could have very different effects on HSI. Therefore, we discourage using ArcHSI to influence land or resource management actions on the basis of model numeric output alone. We also dis-courage tabulating average HSI values and reporting them without considering the spatial distribution of habitats relative to the land area over which the model is being applied.
The Model
This section of the ArcHSI manual concentrates on Habitat Suitability Index (HSI) modeling concepts. The following section will treat, in detail, the file and data structures that comprise an ArcHSI model.
ArcHSI includes two basic components: habitat value for forage (FV), and habitat value for cover (CV). For elk and deer we add habitat distribution of feed-ing and cover (HDV), and road effects. The Arc macro language (AML) in which ArcHSI is written forms the engine that drives models for each species. However, the information that determines model output is contained in separate files. This approach allows the data manager to easily and quickly create, extend, or modify a model by editing text or spreadsheet files.
Primary input to a model is from the COVER_TYPE and HAB_STRUCT_STAGE items of the Rocky Mountain Region Resource Inventory System (RMRIS Data Dictionary 1988). Data from these items are concatenated and matched (COVSS column) to a table of coefficients (table 1) to provide the FV and CV components. The tables of coefficients for all species and seasons of use are contained in a single file. As in the Habcap and ArcHabcap systems, coef-ficients range from zero for the poorest, to one for the best habitats.
Table 1. Excerpt from the SPECIES.DBF table containing species, season, vegetation cover type, cover type-structural stage abbreviation (COVSS), and coefficients for feed (FV) and cover (CV). Coefficients describe relative habitat suitability and range from 0 to 1.0. For simplicity, this table omits some columns present in SPECIES.DBF.
SP SEASON COVTYP COVSS FV CV
Elk Summer Aspen TAA1 0.00 1.00Elk Summer Aspen TAA2 0.50 1.00Elk Summer Aspen TAA3A 0.50 1.00Elk Summer Aspen TAA3B 1.00 1.00Elk Summer Aspen TAA3C 1.00 0.50Elk Summer Aspen TAA4A 1.00 1.00Elk Summer Aspen TAA4B 1.00 1.00Elk Summer Aspen TAA4C 1.00 0.50Elk Summer Aspen TAA5 1.00 1.00
� USDA Forest Service RMRS-GTR-180WWW. 2006
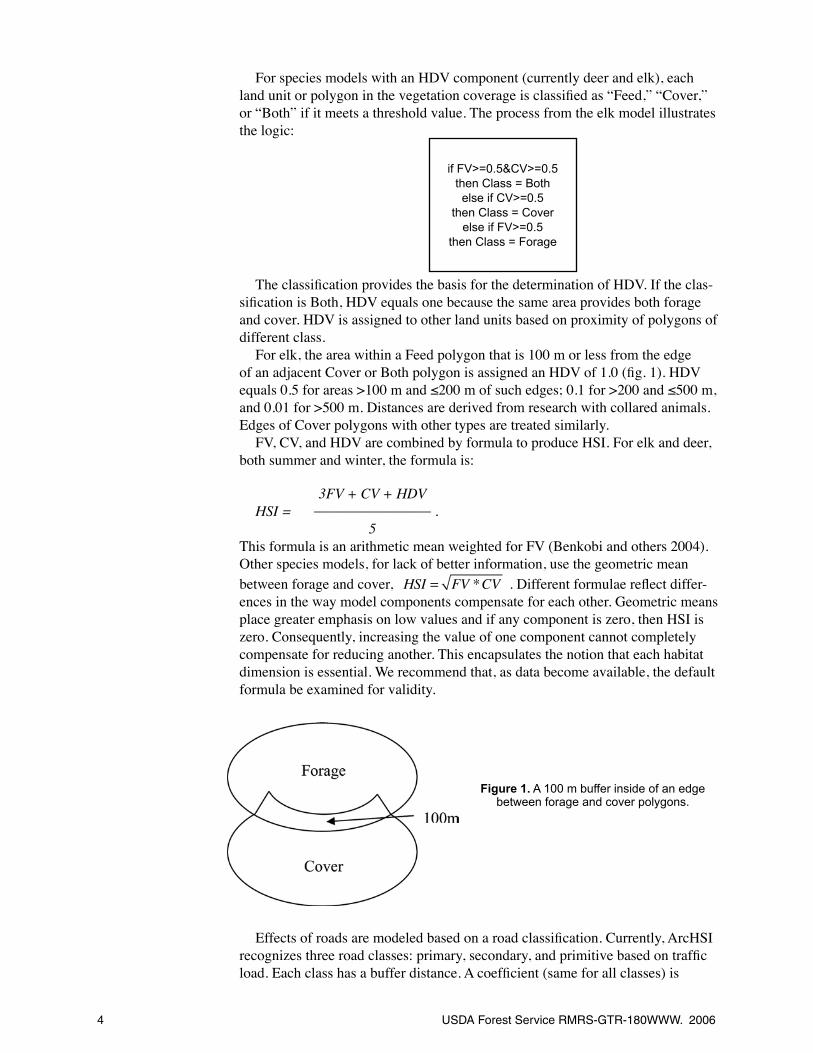
For species models with an HDV component (currently deer and elk), each land unit or polygon in the vegetation coverage is classified as “Feed,” “Cover,” or “Both” if it meets a threshold value. The process from the elk model illustrates the logic:
if FV>=0.5&CV>=0.5then Class = Bothelse if CV>=0.5
then Class = Coverelse if FV>=0.5
then Class = Forage
The classification provides the basis for the determination of HDV. If the clas-sification is Both, HDV equals one because the same area provides both forage and cover. HDV is assigned to other land units based on proximity of polygons of different class.
For elk, the area within a Feed polygon that is 100 m or less from the edge of an adjacent Cover or Both polygon is assigned an HDV of 1.0 (fig. 1). HDV equals 0.5 for areas >100 m and ≤200 m of such edges; 0.1 for >200 and ≤500 m, and 0.01 for >500 m. Distances are derived from research with collared animals. Edges of Cover polygons with other types are treated similarly.
FV, CV, and HDV are combined by formula to produce HSI. For elk and deer, both summer and winter, the formula is:
3FV+CV+HDVHSI= ________________. 5
This formula is an arithmetic mean weighted for FV (Benkobi and others 2004). Other species models, for lack of better information, use the geometric mean between forage and cover, HSI = FV *CV . Different formulae reflect differ-ences in the way model components compensate for each other. Geometric means place greater emphasis on low values and if any component is zero, then HSI is zero. Consequently, increasing the value of one component cannot completely compensate for reducing another. This encapsulates the notion that each habitat dimension is essential. We recommend that, as data become available, the default formula be examined for validity.
Figure 1. A 100 m buffer inside of an edge between forage and cover polygons.
Effects of roads are modeled based on a road classification. Currently, ArcHSI recognizes three road classes: primary, secondary, and primitive based on traffic load. Each class has a buffer distance. A coefficient (same for all classes) is

USDA Forest Service RMRS-GTR-180WWW. 2006 �
applied to HSI in those parts of vegetation polygons overlapping this buffer. For elk, HSI values are reduced 50 percent for areas within 300 m of primary roads or 260 m of secondary roads (primitive roads are currently considered to have no effect). Although a road effect is applied after HSI has been calculated based on FV, CV, and HDV (if part of a particular species model); FV, CV, and HDV are adjusted post hoc so that model formulae always appear to be computed cor-rectly.
The HSI for a single polygon multiplied by the area of the polygon yields Habitat Units (U.S. Fish and Wildlife Service 1980b). Habitat Units can be compared directly; thus, an area of 10 ha with an HSI of 1.0 provides habitat equal to an area of 20 ha and an HSI of 0.5. ArcHSI calculates an overall HSI by summing Habitat Units and dividing by the area of the project. It is appropriate to manage using project-wide Habitat Units or project-wide HSI for a species but not appropriate to aggregate HSI for several species.
Files and Data Requirements of ArcHSI
All of the files that comprise an ArcHSI model may be edited, and files may be added to define new models. We have simplified these processes by making files for models editable in text editors like Notepad and spreadsheets like Excel. The following describes the exact file naming conventions, file locations, and data structures composing ArcHSI models.
Species FileThe wildlife species that ArcHSI models habitat for are contained in a file
named SPECIES.DBF. This file contains tables of coefficients that rate the relative value for feed and cover, from zero to one, of the vegetation cover types and structural stages for a particular species and season (table 2). Table 2 details cover types and structural stages for ponderosa pine (Buttery and Gillam 1983).
Table 2. Matrix display of vegetation structural stages combinations for ponderosa pine cover type in the ArcHSI model.1
Number Description DBH2 (in) CC³ Height (ft) Age (yr)
1 Grass-forb 0 0 0 02 Shrub-seedling < 1 0 < 4 6-103a Sapling-pole 1-9 < 40% 10-50 6-503b Sapling-pole 1-9 40%-70% 10-50 6-503c Sapling-pole 1-9 > 70% 10-50 6-504a Mature 9-24 < 40% > 50 51-1594b Mature 9-24 40%-70% > 50 51-1594c Mature 9-24 > 70% > 50 51-1595 Old-growth > 16 > 160
1 Vegetation classification modified from Buttery and Gillam (1983) following criteria from RMRIS data dictionary (USDA Forest Service, Rocky Mountain Region) and Black Hills National Forest Phase II, Forest Plan Amendment.
2 Diameter-at-breast height.³ Percent overstory canopy cover.

6 USDA Forest Service RMRS-GTR-180WWW. 2006
Other recognized vegetation cover types in the Rocky Mountain Region of the USDA Forest Service include lodgepole pine (Pinuscontorta), white spruce (Piceaglauca), Douglas-fir (Pseudotsugamenziesii), pinyon (P.edulis)‑juniper (Juniperus spp.), quaking aspen (Populustremuloides), cottonwood (Populusdel‑toides), bur oak (Quercusmacrocarpa), high elevation riparian, mountain shrub, sagebrush (Artemesia spp.), mountain grassland and wet meadow. Other vegeta-tion types, structural stages, and appropriate coefficients for FV and CV can be added to the SPECIES.DBF file. SPECIES.DBF can be edited conveniently in Excel (or another spreadsheet that can read DBF files) but must be imported to an INFO file of the same name using the Arc Workstation DBASEINFO command (from the Arc Workstation window, type: DBASEINFO SPECIES SPECIES).
SPECIES.DBF contains two columns that are used to name ArcHSI output: SP_ABBR and S_ABBR. These columns contain three-letter abbreviations for species and season, respectively. ArcHSI concatenates the first three letters of the input vegetation coverage to the species and season abbreviations to produce the output coverage name. Entire species and seasons, as well as cover types and structural stages, may be added to the SPECIES.DBF file.
Types FileAnother way to add a vegetation type to ArcHSI is to cross-reference it to one
already in SPECIES.DBF. TYPES.DBF provides the cross-reference. The prima-ry value of this file is to allow users to use project-specific vegetation attributes in the input GIS coverage without editing SPECIES.DBF. The default table contains the vegetation cover types that occur in SPECIES.DBF cross-referenced to themselves (TYPES.DBF is a required file; without it, ArcHSI will not recognize any vegetation type). To add a new vegetation cover type, place its three-letter code for vegetation type in the CT column and the cover type to which it will be mapped in the CVTP column (table 3).
Table 3. Example of TYPES.DBF table in ArcHSI that crosswalks vegetation cover types (CT) on to cover types recognized by ArcHSI (CVTP). Kentucky blue grass (GPO) and little bluestem (GLB) are mapped to grasslands (GRA), and Englemann spruce (TES) is mapped to white spruce (TWS).
Vegetation cover types in GIS input Vegetation cover types that are coverage (CT) to ArcHSI recognized by ArcHSI in the SPECIES.DBF table (CVTP)
GPO GRA GLB GRA TAA TAA TPB TPB TBO TBO TCW TCW TDF TDF RIP RIP TLP TLP GRA GRA SHR SHR TPJ TPJ TPP TPP SSA SSA GWE GWE TWS TWS TES TWS

USDA Forest Service RMRS-GTR-180WWW. 2006 �
Editing may be done in Excel (or another spreadsheet that can read DBF files) and the edited file may be imported to an INFO file of the same name using the Arc Workstation DBASEINFO command (from the Arc Workstation window, type: DBASEINFO TYPES TYPES). Table items are CT and CVTP, both charac-ter type of width 3.
Vegetation cover types not included in SPECIES.DBF, or cross-referenced to it in TYPES.DBF files, will be treated as having zero habitat value and will be excluded from project-wide summaries. Mismatches in vegetation cover type between input coverages and these two DBF files are likely sources of error (0 values) in ArcHSI analysis.
Vegetation Type Classification Threshold FilesText files containing minimum values of forage and cover coefficients
for classifying a land unit as FEED, COVER, or BOTH are contained in the subdirectory, THRESHOLDS. Files are named by species-season combinations and must conform to those found in the SP and SEASON columns of SPECIES.DBF. A DEFAULT.TXT table is provided. The first line of each file contains the FV that must be attained for a land unit to be classified as forage. The second line contains the threshold for CV. Values must be numbers less than one, ex-pressed to a precision of two decimal places. Text files can be edited in Notepad, Wordpad, and most word processors; however, files must be saved as .TXT type and not forms with internal formatting information (for example, .RTF and .DOC). ArcHSI searches the THRESHOLDS subdirectory for a file that matches the species and season selected by the user. If such a file is found, ArcHSI uses its classification thresholds; if not, ArcHSI uses those in the DEFAULT.TXT file.
Habitat Distribution FilesThe geographic relation between forage and cover for various species and
seasons are in text files found in the PROXIMITY subdirectory. File names correspond to species and seasons identical to those for classification thresholds. These files contain distance thresholds in meters and corresponding HDVs. Each line in the table contains four values (fig. 2). The first value is the distance into areas classified as forage from adjacent land units classified as cover (or both), the second value is the corresponding HDV, the third value is the distance into
Figure 2. Diagram illustrating how information located in files in the PROXIMITY subdirectory is interpreted in setting habitat distribution values for forage and cover polygons. Note that dis-tances are cumulative. The first two lines are for illustration only and are not actually found in any file in the PROXIMITY subdirectory.

8 USDA Forest Service RMRS-GTR-180WWW. 2006
areas classified as cover from adjacent land units classified as feed (or both), and the fourth value is the corresponding HDV. Subsequent lines represent distances and HDV values for intervals beginning at the outside of the previous interval. Order is important, and values are additive! Areas classified as feed ≥100 m from the boundary of land units classified as cover are assigned HDV = 0.5; areas classified as cover ≥100 m from the boundary of land units classified feed are assigned HDV = 0.65. Areas classified as feed ≥300 m (values are additive) from land units classified as cover are assigned HDV = 0.1. Areas classified as cover ≥200 m from land units classified as cover are assigned HDV = 0.25. There may be as many lines as are required. There is no default table, and ArcHSI does not include HDV in the calculations if a species-season.txt file match is not found.
Formula FilesThe subdirectory, FORMULAS, contains species-season specific and default
text files containing HSI formulae. File names are identical to those described for classification threshold files. The following is the elk formula: (3 * FV + CV + HDV) / 5. Formulae must contain spaces between operators, variables, parenthe-ses, and constants or they will not be read correctly. The exponentiation operator is **. The ArcHSI engine searches for and uses a file matching the user selected species and season; otherwise, the geometric average, (FV * CV) ** 0.5, is used in the DEFAULT.TXT file.
Roads FilesSpatial modeling of road effects is controlled by files in the ROADS subdirec-
tory. Files are named by species-season as for classification threshold files. There is no default table. The first line of the text file contains a coefficient that is ap-plied to HSI to model road effects. As discussed above, model components (FV, CV, & HDV) are also adjusted so that formulae always appear to compute cor-rectly. Subsequent lines contain the road class first and the distance over which road effects apply second. The following entries in a table represent a road effect of reducing the HSI by 50 percent at a 300 m from roads of type P (primary) and 260 m from roads of type S (secondary). There is no distance effect for PR (primitive) type roads.
0.50A,0
P,300PR,0S,260
All files in the ROADS subdirectory must have A,0 as the second line. This is a device used to prevent roads in the input coverage that do not match an entry in the file from exerting a road effect. The roads classification file must be sorted alphabetically. User-defined values for the coefficient, classification types, and distances can be used, but the classifications codes must match those contained in the item, TYPES, in the GIS road coverage.
The ArcHSI road component may be used to model effects other than those of roads; for example, attractions to linear features such as streams and riparian zones.
USDA Forest Service RMRS-GTR-180WWW. 2006 �
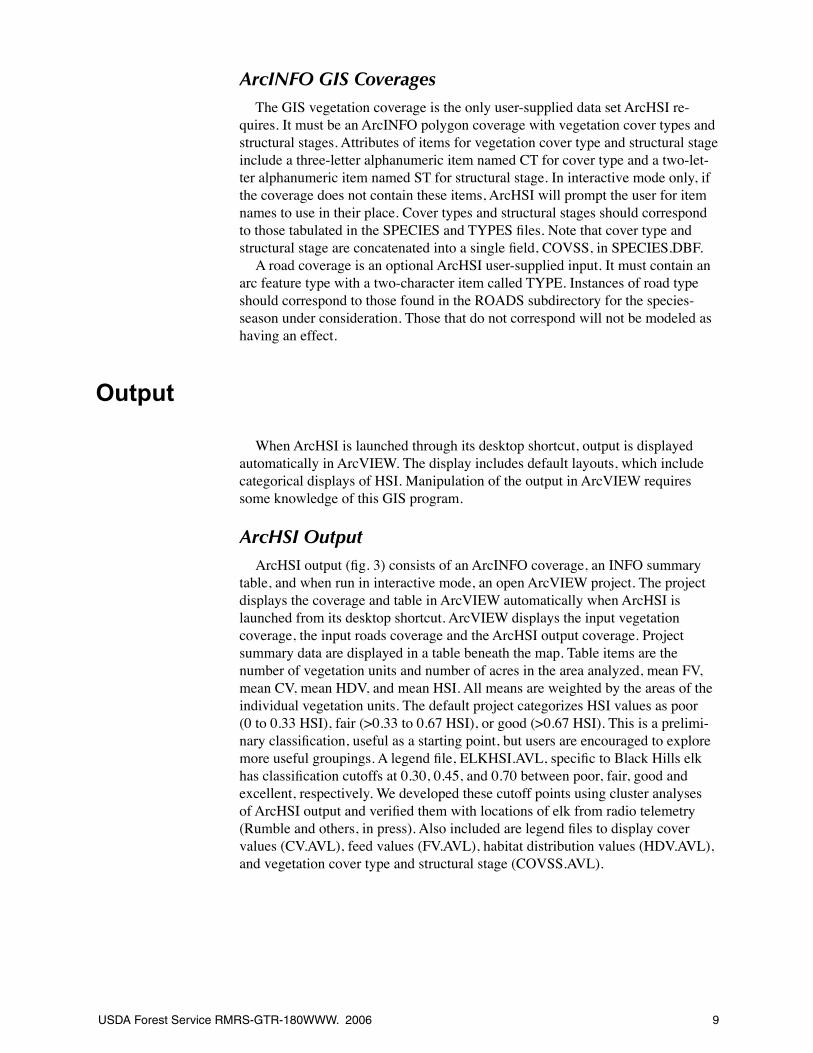
ArcINFO GIS CoveragesThe GIS vegetation coverage is the only user-supplied data set ArcHSI re-
quires. It must be an ArcINFO polygon coverage with vegetation cover types and structural stages. Attributes of items for vegetation cover type and structural stage include a three-letter alphanumeric item named CT for cover type and a two-let-ter alphanumeric item named ST for structural stage. In interactive mode only, if the coverage does not contain these items, ArcHSI will prompt the user for item names to use in their place. Cover types and structural stages should correspond to those tabulated in the SPECIES and TYPES files. Note that cover type and structural stage are concatenated into a single field, COVSS, in SPECIES.DBF.
A road coverage is an optional ArcHSI user-supplied input. It must contain an arc feature type with a two-character item called TYPE. Instances of road type should correspond to those found in the ROADS subdirectory for the species-season under consideration. Those that do not correspond will not be modeled as having an effect.
Output
When ArcHSI is launched through its desktop shortcut, output is displayed automatically in ArcVIEW. The display includes default layouts, which include categorical displays of HSI. Manipulation of the output in ArcVIEW requires some knowledge of this GIS program.
ArcHSI OutputArcHSI output (fig. 3) consists of an ArcINFO coverage, an INFO summary
table, and when run in interactive mode, an open ArcVIEW project. The project displays the coverage and table in ArcVIEW automatically when ArcHSI is launched from its desktop shortcut. ArcVIEW displays the input vegetation coverage, the input roads coverage and the ArcHSI output coverage. Project summary data are displayed in a table beneath the map. Table items are the number of vegetation units and number of acres in the area analyzed, mean FV, mean CV, mean HDV, and mean HSI. All means are weighted by the areas of the individual vegetation units. The default project categorizes HSI values as poor (0 to 0.33 HSI), fair (>0.33 to 0.67 HSI), or good (>0.67 HSI). This is a prelimi-nary classification, useful as a starting point, but users are encouraged to explore more useful groupings. A legend file, ELKHSI.AVL, specific to Black Hills elk has classification cutoffs at 0.30, 0.45, and 0.70 between poor, fair, good and excellent, respectively. We developed these cutoff points using cluster analyses of ArcHSI output and verified them with locations of elk from radio telemetry (Rumble and others, in press). Also included are legend files to display cover values (CV.AVL), feed values (FV.AVL), habitat distribution values (HDV.AVL), and vegetation cover type and structural stage (COVSS.AVL).

10 USDA Forest Service RMRS-GTR-180WWW. 2006
ArcHSI output files are named from SP_ABBR and S_ABBR fields in the SPECIES.DBF table. To name the ArcINFO output, three-letter abbreviations for species and seasons respectively are concatenated to the first three letters of the input ArcINFO vegetation coverage.
Figure 3. ArcHSI output for a typical project. The map displays HSI categories and roads. The table lists mean weighted FV, CV, HDV, and HSI for the entire area.
NOTE: ArcINFO does not allow coverages to be overwirtten, but we caution
that ArcHSI will overwrite existing files with the same name. ArcHSI checks for
a coverage with the same name as the one it will create and deletes it. The
rationale for this is to keep the model and ArcINFO from crashing during a batch
run. Therefore, if it is desirable to keep the output coverages used to assess land
management alternatives on the same area, the input coverages must differ in the
first three letters of the input coverage. The ArcVIEW project created by ArcHSI will
be named ARCHSI.APR and will be located in the directory under which ArcHSI is
installed. To prevent overwriting the ARCHSI.APR file, the user must use SAVE AS
(FILE dropdown menu) to save to another name.

USDA Forest Service RMRS-GTR-180WWW. 2006 11
GenTab OutputGenTab produces HSI information in tabular form only but simultaneously for
all species defined in the SPECIES.DBF. Output is not spatially explicit and the two-component geometric mean formula is used to calculate HSI for all species. This program was included in the ArcHSI suite by specific request from some users to provide planners with a quick assessment method for many species.
Output from GenTab is in the form of INFO tables and an ArcVIEW project (fig. 4). ArcVIEW displays the tables automatically if GenTab is launched from its desktop shortcut. GenTab generates three tables: summarized area for cover type-structural stage combinations, HSI values by species by season and cover type-structural stage, and mean area-weighted HSI for each species.
The INFO tables are located in the same ArcINFO workspace (subdirectory) as the input coverage. Tables are named by appending TAB, TAB1, and TAB2 to the input coverage name. The ArcVIEW project name is GENTAB.APR and is located in the directory under which ArcHSI was installed. The ArcVIEW project must be changed using the SAVE AS command (FILE dropdown menu) or it will be overwritten the next time GenTab is run.
Figure 4. GenTab output for a typical project. Mean weighted HSI is listed for every species mod-eled. Additional tables summarize area by vegetation types and structural stages and HSI by species, season, and vegetation type-structural stage.

12 USDA Forest Service RMRS-GTR-180WWW. 2006
Operation
ArcHSI OperationArcHSI can be run interactively or in batch mode. Interactive mode is the
point-and-click style familiar to Windows users. Batch mode operates from the DOS or UNIX command line. Batch mode is not as user-friendly as interactive mode, but it does allow multiple species, multiple input coverages, or both to be processed with a single command.
Interactive
Double-click the ArcHSI shortcut on your desktop or, if you are using the UNIX platform, pull up the Applications menu and click ArcHSI.
You will be prompted to select a vegetation coverage (fig. 5). The dialog box allows either typing a path in the text box at the top of the dialog box or navigating to the directory. Below the text box are two scrolling lists. The left list presents options for drilling down into the directory structure (using the UP button to the right of the text box will cause the text displayed in the text box to move up one level in the directory structure). The right list contains ArcINFO polygon coverages in the current directory.
•
Figure 5. ArcHSI interactive mode vegetation coverage dialog box. The text box displays path infor-mation. Subdirectories under the path are displayed in the list on the left and valid ArcINFO poly-gon coverages in the list on the right.
Highlight the desired coverage and click OK.
The HELP button displays context sensitive help. The MANUAL button will display the online manual in a pop-up box.
Clicking the CANCEL button will terminate the program. If the selected veg-etation coverage does not contain items (variables) named CT and ST, the user will be prompted to select items that represent them.
A dialog box similar to the one for selecting the input coverage will prompt users for the workspace (subdirectory) for ArcHSI output (fig. 6). The output
•

USDA Forest Service RMRS-GTR-180WWW. 2006 1�
coverage is named automatically by concatenating the first three letters of the input coverage and three-letter abbreviations for species and season.
After selecting the input source, select the species and season for which to run ArcHSI (figs. 7, 8).
If the model for the species selected includes road effects (a file named for the species exists in the ROADS subdirectory), the user will be prompted to select a road coverage from a dialog box (fig. 9).
The CANCEL button will stop modeling road effects although called for in the model. HSI will be based on FV, CV, and HDV. If a road coverage is selected, but does not include an item named TYPES, the user will be prompted for the item that contains the road classification.
Output from ArcHSI will automatically be displayed in ArcVIEW (see fig. 3). HSI values are categorized by default as poor (0.00 to 0.33), fair (0.34 to 0.66), and good (0.67 to 1.00).
•
Figure 6. ArcHSI interactive mode workspace dialog box. The text box displays path information. Subdirectories under the path are displayed in the list on the left.
Figure 7. ArcHSI interactive mode species dialog box.
Figure 8. ArcHSI interactive mode season dialog box.

1� USDA Forest Service RMRS-GTR-180WWW. 2006
Double-clicking the output coverage name on the legend will call up the legend editor and alternate legends may be loaded or created. The roads coverage, if used, is also displayed.
An outline of the polygons in the input coverage can be displayed by clicking the box adjacent to the input coverage name in the legend.
Two ArcVIEW layouts for printing the map on plotters and letter-size printers are also included. The area of the project (acres), mean FV, mean CV, mean HDV, and mean HSI are displayed in a table beneath the map. All means are weighted by area. Users may customize legends and layouts (see ArcVIEW HELP for as-sistance).
An ArcVIEW project, ARCHSI.APR, located in the ArcHSI directory stores the display information. This project is created every time ArcHSI runs and any existing projects will be overwritten unless renamed. A convenient way to rename files is through the SAVE AS command (FILE dropdown menu).
Batch processing multiple species-seasons and/or multiple input vegetation coverages
Batch processing allows users to run ArcHSI with input information in files rather than selected from dialog boxes. Three files contain the batch AMLs for ArcHSI: COVERS.AML for multiple input coverages on a single species-season, SPECIES.AML for multiple species-seasons on a single input coverage and COVS_SPP.AML for multiple input coverages and multiple species-seasons. These AMLs read data from text files and pass the data to ArcHSI through its command-line interface:
&run <path>archsi <Species> <Season> <veg coverage> <workspace> <roads coverage>
replacing text in angle brackets with actual parameters. For example,
&run c:\ArcHSI\archsi Elk Summer c:\wrksp\my_cover c:\wrksp\c:\wrksp\my_roads
•
•
Figure 9. ArcHSI interactive mode roads coverage dialog box. The text box displays path information. Subdirectories under the path are displayed in the list on the left and valid ArcINFO arc coverages in the list on the right.

USDA Forest Service RMRS-GTR-180WWW. 2006 1�
This command instructs ArcHSI to (1) run the elk-summer model on an input coverage, my_cover (located in c:\wrksp); (2) place the output cover in c:\wrksp; and (3) use the cover, my_roads also located in c:\wrksp for road effects input. Parameters may be omitted from right to left. For example, the user that did not want road effects modeled would omit the last parameter. If the workspace parameter is omitted, the current workspace is assumed. If path information is incomplete, the current workspace is assumed. For example:
&run c:\ArcHSI\archsi Elk Summer my_cover. my_roads
is equivalent to the previous example if the workspace is c:\wrksp. This example uses Windows syntax. UNIX is slightly different:
<path>/archsi.ksh <Species> <Season> <veg coverage> <workspace> <roads coverage>
Output from batch-processed runs includes an ArcINFO coverage, summary INFO table, and an ArcVIEW project file for each run. These files are saved in the chosen workspace (subdirectory) using the same file naming protocol as for interactive runs. ArcVIEW does not start automatically.
Windows
To run ArcHSI for several species-seasons on the same input coverage, first create a text file with one species and season on each line. For example:
Elk, Summer
Elk, Winter
Members of species-seasons must be separated by commas and species/season names must be exactly as they occur in SPECIES.DBH. Species-seasons are case sensitive.Save the text file.
Launch the Arc Workstation and type: workspace <my input workspace> replacing text in angle brackets with the actual path to the input. Press ENTER.
From Windows, type:
&run <path>\species <text file> <veg coverage> <workspace> <roads coverage>
The equivalent UNIX syntax is:
<path>species.ksh <text file> <veg coverage> <workspace> <roads coverage>
The key word, species, calls up SPECIES.AML. The AML reads the text file and runs the elk-summer and elk-winter models using the specified vegetation coverage and roads coverage and places the output in the specified workspace.
Running several input coverages for a single species-season is similar. The text file should contain one vegetation and one road coverage separated by commas per line. For example:
•
•

16 USDA Forest Service RMRS-GTR-180WWW. 2006
myveg,myroad
my1veg,myroad
Save the text file.
From the Windows Arc Workstation, type:
&run <path>\covers <text file name> <Species> <Season> < workspace>
Or from the UNIX Arc Workstation, type:
<path>/covers.ksh <covers text file> <Species> <Season> < workspace>
The key word, covers, calls up COVERS.AML, which runs ArcHSI for the specified species-season using the coverages in the text file and places output in the specified workspace.
Finally, the AML, covs_spp, allows runs of multiple coverages and multiple species-seasons.
The Windows command syntax is:
&run <path>\covs_spp <list> <workspace>
The UNIX command syntax is:
&run <path>/covs_spp.ksh <list> <workspace>
The list text file must have the name of a second list for species-seasons on the first line as described above and a list of vegetation and roads coverages on subsequent lines. For example:
species.txt
demo_veg,demo_rd
2demo_veg,demo_rd
GenTab OperationTo generate tabular output for all species in modeled (GENTAB):Double-click the GenTab shortcut on your desktop (PC) or pull up the Applications menu and click GenTab (UNIX).Users will be prompted to select a vegetation coverage (fig. 5).Output will be displayed in ArcVIEW (fig. 4) as a project, GENTAB.APR, located in the ArcHSI directory.Before exiting ArcVIEW the project should be renamed by using the SAVE AS option.
•
•
•
•
•

USDA Forest Service RMRS-GTR-180WWW. 2006 1�
Installation
PC Installation
Download the installation file from http://www.fs.fed.us/rm/rapidcity/ArcHSI.htm.
Click the link to ArcHSI-PC. The download dialog will appear.
Click open. The unzip dialog will appear.
Click browse and navigate to the convenient temporary location.
Click Unzip.
Using Windows Explorer, navigate to the temporary location where you unzipped the installation files.
Double-click the file, SETUP.BAT. (NOT SETUP.AML) The Arc Workstation window will open.
In the dialog box (fig. 10), navigate to the directory under which you will install ArcHSI.
Append \ArcHSI (or a name of your choice) to the directory path.
Click OK.
A box indicating installation is complete comes up. Click OK.
Open Windows Explorer.
Navigate to the ArcHSI installation directory.
•
•
•
•
•
•
•
•
•
•
•
•
•
Figure 10. ArcHSI installation dialog box. Users may use the scrolling list to navigate to an area to install ArcHSI or type directly in the Workspace box (DIRECTORY NAMES CONTAINING SPACES ARE NOT AL-LOWED). The UP button backtracks the directory structure. The online MANUAL and HELP buttons are NOT OPERABLE.

18 USDA Forest Service RMRS-GTR-180WWW. 2006
Create shortcuts to ArcHSI by clicking the right mouse button on ARCHSI.BAT, dragging it to your desktop and selecting CREATE SHORTCUT HERE from the dialog box. Repeat this and the remaining steps for GENTAB.BAT.
Right-click the shortcut icon.
Select properties from the pop-up menu.
Click the CHANGE ICON button. Click OK.
Click the Browse button.
Navigate to the ArcHSI installation directory.
Double-click ARCHSI.ICO (GENTAB.ICO if creating a shortcut for GenTab).
Click OK.Note: If you have a workspace (subdirectory structure) that you use customar-
ily, edit the TARGET line to reflect this. This is optional.Click OK.
UNIX Server/Workstation InstallationThis procedure is specific to USDA Forest Service Unix server network.
Installation on a Unix server should probably be done by a system administrator. Other applications may require modification of the installation routine.
Open an Exceed XDMCP-Broadcast Window
Click START.
Click PROGRAMS.
Click HUMMINBIRD CONNECTIVITY.
Click EXCEED.
Click EXCEED (XDMCP-BROADCAST).
Choose the UNIX server to which you copied files from the installation Disk.
Logon.
Click the up arrow above the computer monitor icon.
Click AIX TERMINAL.
Navigate to the directory under which you wish to install ArcHSI.
Type ARC <return>.
Type CREATEWORKSPACE ArcHSI <return>.
Type WORKSPACE ArcHSI <return>.
Open File Explorer (the icon with the file folder and magnifying glass).
Double-click HUMMINGBIRD NEIGHBORHOOD.
•
•
•
•
•
•
•
•
•
•
•
•
•
•
•
•
•
•
•
•
•
•
•
•

USDA Forest Service RMRS-GTR-180WWW. 2006 1�
If a directory in the path to ArcHSI doesn’t appear, contact computer support to obtain assistance in making the path visible.
Navigate to the ArcHSI directory.
Insert the UNIX installation disk into the PC CD drive or follow the instructions for internet download given under PC installation.
In File Explorer, navigate to the CD drive.
Click on the right pane.
Press CTRL-A.
Drag the files to the ArcHSI folder.
Return to Exceed.
Make the data folders read only: Type &SYS chmod a+r formulas proximity roads thresholds <return>.
Make the korn shell scripts executable. Type. sys chmod a+x archsi.ksh gentab.ksh.Note: the korn shell scripts, ARCHSI.KSH and GENTAB.KSH may need to
be modified to correct the path to your license server and version of ArcVIEW. Contact your ISM (IT) staff for this information.
Note: The preceding instructions install ArcHSI on the server. Each user should create actions as described below under his/her own profile.
User Defined Create Actions
Click the up arrow above the icon with the asterisk on the control panel.
Click APPLICATION MANAGER from the pull-up menu.
Double-click DESKTOP APPS from the pop-up window.
Double-click CREATE ACTION from the pop-up window.
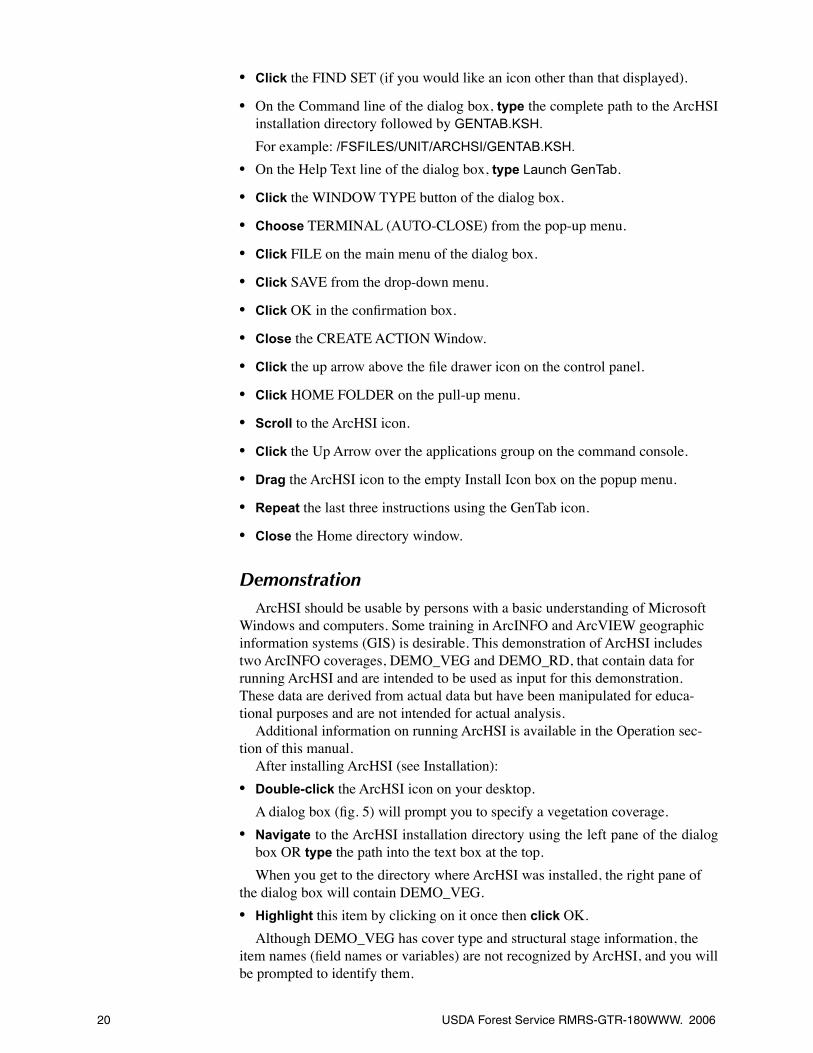
Type ArcHSI in the dialog box line labeled “Action Name.”
Click FIND SET (if you would like an icon other than that displayed).
On the Command line of the dialog box, type the complete path to the ArcHSI (the installation directory followed by ARCHSI.KSH). For example: /FSFILES/UNIT/ARCHSI/ARCHSI.KSH.
On the Help Text line of the dialog box, type: Launch ArcHSI.
Click the WINDOW TYPE button of the dialog box.
Choose TERMINAL (AUTO-CLOSE) from the pop-up menu.
Click FILE on the main menu of the dialog box.
Click SAVE from the drop-down menu.
Click OK in the confirmation box.
Type GenTab in the dialog box line labeled “Action Name.”
•
•
•
•
•
•
•
•
•
•
•
•
•
•
•
•
•
•
•
•
•
•
•
20 USDA Forest Service RMRS-GTR-180WWW. 2006
Click the FIND SET (if you would like an icon other than that displayed).
On the Command line of the dialog box, type the complete path to the ArcHSI installation directory followed by GENTAB.KSH.
For example: /FSFILES/UNIT/ARCHSI/GENTAB.KSH.
On the Help Text line of the dialog box, type Launch GenTab.
Click the WINDOW TYPE button of the dialog box.
Choose TERMINAL (AUTO-CLOSE) from the pop-up menu.
Click FILE on the main menu of the dialog box.
Click SAVE from the drop-down menu.
Click OK in the confirmation box.
Close the CREATE ACTION Window.
Click the up arrow above the file drawer icon on the control panel.
Click HOME FOLDER on the pull-up menu.
Scroll to the ArcHSI icon.
Click the Up Arrow over the applications group on the command console.
Drag the ArcHSI icon to the empty Install Icon box on the popup menu.
Repeat the last three instructions using the GenTab icon.
Close the Home directory window.
DemonstrationArcHSI should be usable by persons with a basic understanding of Microsoft
Windows and computers. Some training in ArcINFO and ArcVIEW geographic information systems (GIS) is desirable. This demonstration of ArcHSI includes two ArcINFO coverages, DEMO_VEG and DEMO_RD, that contain data for running ArcHSI and are intended to be used as input for this demonstration. These data are derived from actual data but have been manipulated for educa-tional purposes and are not intended for actual analysis.
Additional information on running ArcHSI is available in the Operation sec-tion of this manual.
After installing ArcHSI (see Installation):Double-click the ArcHSI icon on your desktop.A dialog box (fig. 5) will prompt you to specify a vegetation coverage.Navigate to the ArcHSI installation directory using the left pane of the dialog box OR type the path into the text box at the top.When you get to the directory where ArcHSI was installed, the right pane of
the dialog box will contain DEMO_VEG.Highlight this item by clicking on it once then click OK.Although DEMO_VEG has cover type and structural stage information, the
item names (field names or variables) are not recognized by ArcHSI, and you will be prompted to identify them.
•
•
•
•
•
•
•
•
•
•
•
•
•
•
•
•
•
•
•

USDA Forest Service RMRS-GTR-180WWW. 2006 21
Click on COVER_TYPE and HAB_STRUC respectively; then click OK.The next prompt will be for the directory/subdirectory where you want the
output to be stored (fig. 8). The default in ArcHSI is the workspace (ArcINFO terminology for directory) that contains the vegetation coverage. This is usually what you will want.
Click OK or navigate to where the output should be stored.A dialog box will prompt for species:Select ELK and click OK.A second dialog box will prompt for the season to be modeled.Select SUMMER and click OK.A dialog box will prompt for a road coverage (fig. 9).Choose DEMO_RD and click OK.DEMO_RD contains an item called TYPE that contains the P (Primary), S
(Secondary), PR (Primitive) road classification that ArcHSI expects. At present, ArcHSI will request a road coverage only for elk, mule deer and whitetail deer models. For these species, text files named for species and season are located in the ROADS subdirectory of the ArcHSI installation directory. These files contain the information used by ArcHSI to model road effects. If a road coverage is not provided ArcHSI will still run but will not account for effects of roads.
After selecting the road coverage and clicking OK, the model will run. You will see lines scrolling through the ArcHSI window as the Arc Macro Language (AML) code is executed. When finished, ArcHSI will automatically call up ArcVIEW and load the output in an ArcVIEW project.
Viewing the OutputArcVIEW displays a map (fig. 3) that classifies habitat by Habitat Suitability
Index (HSI) as No Habitat (HSI = 0), Poor (HSI <0.33), Fair (HSI >0.33 & <0.67), and Good (HSI >0.67).
An alternative classification that we believe is better can be loaded by:Double-clicking the Good-Fair-Poor key in the legend area at the left of the map. This brings up the LEGEND EDITOR.
Click LOAD to display a list of alternative keys.These keys can be explored later or new ones created, but for now:Highlight ELKHSI.AVL and click OK.
Click OK in the next dialog to apply the key to the HSI item.The HSI ranges corresponding to each category are listed to the right of the
color bars. A value of one is the maximum HSI and indicates fully suitable habitat.
Click APPLY in the LEGEND EDITOR and close it (click on the X at the upper right of its window).The map now has five habitat categories: Excellent (light green), Good (dark
green), Fair (yellow), Poor (red), and No Habitat (black).The road system appears as light blue lines visible on the map.
•
•
•
•
•
•
•
•
•
•

22 USDA Forest Service RMRS-GTR-180WWW. 2006
Locate the area in the right-central part of the map where the road system is surrounded by Fair HSI values (yellow) that transect a large area of Good HSI (dark green) from north-to-south.
Click the zoom-in tool (magnifying glass icon with the plus sign on the top toolbar). Zoom in that area by holding the left mouse button down and dragging a rectangle around the part of the map indicated above.There are small regions of Excellent habitat on the edges of this area. In these
areas, forage and cover are in close proximity. In the center is a large meadow, providing forage, surrounded by ponderosa pine and aspen forest, providing cover. ArcHSI analyzes cover-forage proximity by creating three buffer zones within areas classified as forage when bordered by areas classified as cover. The same is true for areas classified as cover when bordered by areas classified as forage. These buffer zones do not currently appear on the map.
To make proximity buffering visible, double-click the No Habitat·Poor·Fair· Good key to open the LEGEND EDITOR.
Double-click the red icon representing Poor HSI. This will display the FILL PALETTE window.
Click the PAINTBRUSH tool to display the COLOR PALETTE window.
Click the DROPDOWN arrow on the COLOR line and choose OUTLINE from the list.
Click BLACK in the palette.
Repeat this process with the other colors in the key.
Click the X at the upper right of the COLOR PALETTE window to close.
Click APPLY in the LEGEND EDITOR and close this window.Now buffer outlines appear on the map in black. The elk-summer model uses
two 100-m and one 300-m buffers to analyze habitat proximity. Within 100 m of a forage-cover boundary the proximity rating is 1.0. At distances between 100 m and 200 m the forage-cover proximity rating drops to 0.5, between 200 m and 500 m the forage-cover proximity is 0.1, and beyond 500 m the forage-cover rating is 0.01.
ArcHSI has two types of elements. One is the ArcINFO AML code that executes the HSI models. The other is the parameters for HSI model components, specific for species and season. The ArcINFO AML code should not be altered by end users. We have, however, commented the AML code extensively to make it possible for programmers to modify it. The parameters for various species-season models are contained in files that are easily modified by end users. Detailed infor-mation about these files is found in the Files and Data Requirements of ArcHSI section of this manual.
The files containing the forage-cover proximity distances and coefficients are in the PROXIMITY subdirectory under the ArcHSI directory. Values for the elk summer model are in the file, ELKSUMMER.TXT, and can be viewed or edited with NOTEPAD. Other text files describing the elk-summer model are located within subdirectories: FORMULAS, THRESHOLDS, and ROADS—all with the name, ELKSUMMER.TXT.
ArcHSI output includes a summary table displayed below the map. The sum-mary table includes project-wide means weighted by area for forage value (FV),
•
•
•
•
•
•
•
•
•
•

USDA Forest Service RMRS-GTR-180WWW. 2006 2�
cover value (CV), habitat distribution value (HDV), and habitat suitability index (HSI). HSI for the elk-summer model is computed from a formula,
3FV+CV+HDVHSI= _______________ 5
located in a file named, ELKSUMMER.TXT inside the FORMULAS subdirec-tory. FV and CV are extracted from a lookup table using cover type and structural stage as keys, and range in value from zero to one. The table is contained within a file named SPECIES.DBF. HDV is calculated as described above for forage-cover proximity using parameters contained in ELKSUMMER.TXT and located in the PROXIMITY subdirectory. The coefficient of three for FV indicates that this model parameter is weighted heavily relative to other parameters.
On the map, HSI quality declines near some roads. Road effects are modeled with a text file. ELKSUMMER.TXT from the ROADS subdirectory is duplicated below:
0.5A,0P,350PR,0S,260
The letters on the second through fifth lines are abbreviations for a road clas-sification system: All others (A), Primary (P), Primitive (PR) and Secondary (S). The numbers following the abbreviations are the widths in meters of road effects buffers. The HSI of habitat within the specified distances is multiplied by the coefficient found on the first line, 0.5. To make HSI as calculated by the formula correct, FV, CV, and HDV are also multiplied by 0.5. If a user wanted to add a 50 m road buffer for primitive roads he/she would simply edit the PR line to PR,60.
Identifying and Correcting Problems
There are areas of the map colored black indicating No Habitat (HSI = 0). There are several ways for an area to be classified No Habitat:
Road or proximity buffering beyond the edge of the vegetation coverage
Missing habitat type or structural stage information in the vegetation coverage
Mismatch between habitat type or structural stage between vegetation coverage and SPECIES.DBF.
Areas that really have no habitat value. For example, bodies of water for elk.For example, at the edge of the map there are black areas surrounding roads
(light blue). These result from road buffering into areas not included in vegeta-tion coverage. ArcHSI assigns a default HSI value of zero when it encounters missing information. Areas with HSI = 0 do not enter into the tabulated statistics discussed above, so users don’t have to worry about these areas artificially lowering HSI. There are also some black-colored areas within the boundary of the vegetation coverage. To learn about them, click the IDENTIFY tool (the i icon on the toolbar). Be sure that the active coverage (highlighted in the legend
-
-
-
-

2� USDA Forest Service RMRS-GTR-180WWW. 2006
area) is DEMO_VEG and place the crosshair over the large, black, dendritic shape toward the bottom of the map and click the left mouse button. The popup window lists cover type as WRE. WRE stands for Water-Reservoir. Water is not elk habitat, so its HSI should be zero.
Click on the black polygon at the upper center of the map.The popup window shows its cover type as GLB (grass-little bluestem). This
cover type should be elk habitat. The reason this area appears black (No Habitat) is discussed below. Cover types and structural stages recognized by ArcHSI are contained in the file, SPECIES.DBF (table 1).
To view this table, open the Excel spreadsheet program and choose OPEN from the FILE menu. Navigate to the ArcHSI directory.
Click the downward facing arrow at the right side of the “Files of type” line (fig. 11). Scroll down until you see “dBase files” and click that item.Two files appear in the upper pane: SPECIES and TYPES.Select the SPECIES.DBF file and click OPEN.
Click EDIT from the toolbar and select SEARCH from the dropdown menu.
Type ELK as the search term, click OK, then click the ESC key to close the search dialog.
•
•
•
•
•
•
Figure 11. Excel “Open” dialog box showing “Files of Type” PULLDOWN list with dBase (*.dbf) type selected.

USDA Forest Service RMRS-GTR-180WWW. 2006 2�
Scroll down the spreadsheet looking for GLB in the COVSS column.It’s not there; consequently, ArcHSI doesn’t recognize this cover type and as-
signs a default HSI of zero. GLB could be added to the table and coefficients for forage (FV) and cover (CV) supplied. However, SPECIES.DBF may have been made READ-ONLY by your information technology staff.
There is another way to make ArcHSI recognize GLB.Open the TYPES.DBF file in Excel (table 3).This file maps cover types that are not included in the SPECIES.DBF to ones
that are included.Add a new line with GLB in the left column and GRA in the right column.This causes GLB to be treated as if it was GRA, which is in SPECIES.DBF.
In practice you would save this file; however, that would cause this part of the demonstration to fail for the next user, so don’t save.
ArcHSI uses INFO files, not dBase (*.dbf) files. For the modified TYPES.DBF to be recognized by ArcHSI, it needs to be converted to an INFO file. You will not find INFO files listed with WINDOWS EXPLORER. These files are main-tained by the ArcINFO workstation that you will now use to convert TYPES.DBF to its INFO equivalent.
Start the Arc Workstation (seek help from your GIS coordinator if you have not used this program).
Set the current workspace to the ArcHSI directory. For example, by typing WORKSPACE C:\ARCHSI. (assuming this is where you actually installed ArcHSI).
Remove the old TYPES file (the one produced during ArcHSI installation) by typing KILLINFO TYPES then press ENTER.
Now type DBASEINFO TYPES TYPES then press ENTER.Had you saved the modified TYPES.DBF, ArcHSI would now assign FV and
CV for GLB as it does for GRA.Black areas can also result from errors in the vegetation coverage.Click the PANNING tool (hand icon on the toolbar).
Pan by dragging the map to the left until the right edge of the coverage appears.You should see a small black area at the right center of the map and within the
boundaries of the vegetation coverage.Use the IDENTIFY tool to display data for this area (if you get more than one entry, zoom in and try again).In the results window, the cover type is TPP, ponderosa pine, but the structural
stage is blank. ArcHSI concatenates cover type and structural stage to form COVSS (bottom of the table). There are no coefficients in the SPECIES table for COVSS = TPP. DEMO_VEG needs to be edited to supply the correct structural stage.
•
•
•
•
•
•
•
•
•
•
26 USDA Forest Service RMRS-GTR-180WWW. 2006
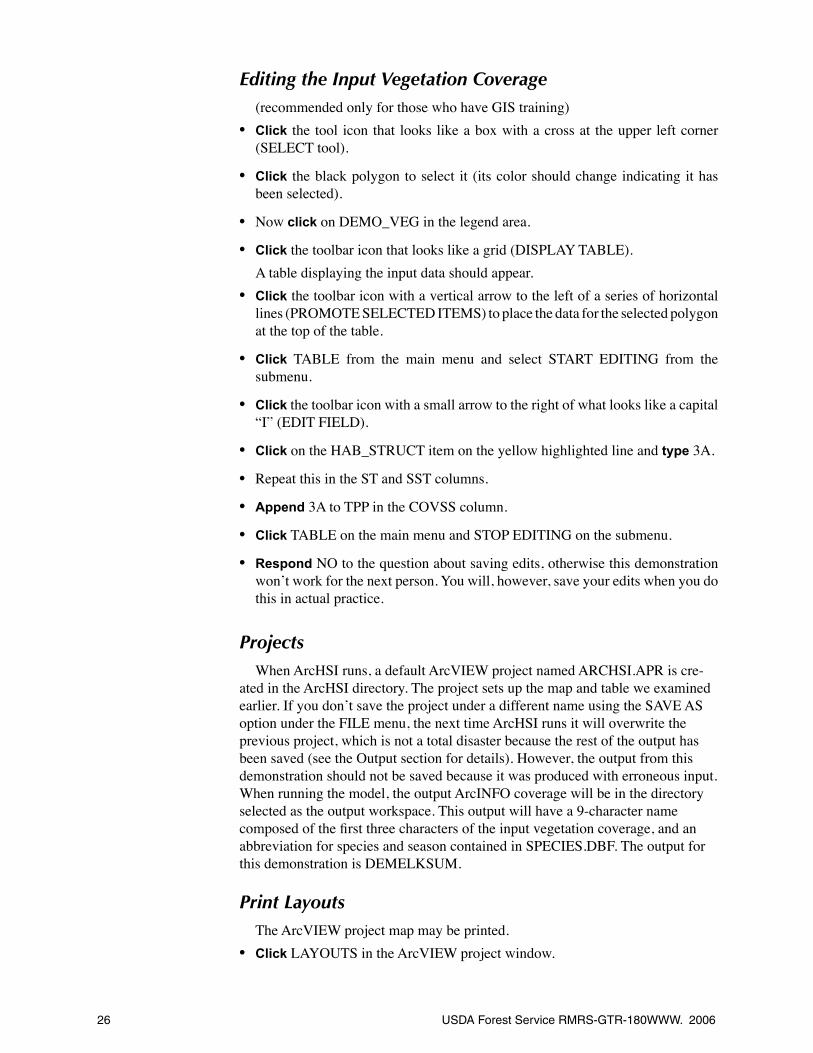
Editing the Input Vegetation Coverage(recommended only for those who have GIS training)Click the tool icon that looks like a box with a cross at the upper left corner (SELECT tool).
Click the black polygon to select it (its color should change indicating it has been selected).
Now click on DEMO_VEG in the legend area.
Click the toolbar icon that looks like a grid (DISPLAY TABLE).A table displaying the input data should appear.Click the toolbar icon with a vertical arrow to the left of a series of horizontal lines (PROMOTE SELECTED ITEMS) to place the data for the selected polygon at the top of the table.
Click TABLE from the main menu and select START EDITING from the submenu.
Click the toolbar icon with a small arrow to the right of what looks like a capital “I” (EDIT FIELD).
Click on the HAB_STRUCT item on the yellow highlighted line and type 3A.
Repeat this in the ST and SST columns.
Append 3A to TPP in the COVSS column.
Click TABLE on the main menu and STOP EDITING on the submenu.
Respond NO to the question about saving edits, otherwise this demonstration won’t work for the next person. You will, however, save your edits when you do this in actual practice.
ProjectsWhen ArcHSI runs, a default ArcVIEW project named ARCHSI.APR is cre-
ated in the ArcHSI directory. The project sets up the map and table we examined earlier. If you don’t save the project under a different name using the SAVE AS option under the FILE menu, the next time ArcHSI runs it will overwrite the previous project, which is not a total disaster because the rest of the output has been saved (see the Output section for details). However, the output from this demonstration should not be saved because it was produced with erroneous input. When running the model, the output ArcINFO coverage will be in the directory selected as the output workspace. This output will have a 9-character name composed of the first three characters of the input vegetation coverage, and an abbreviation for species and season contained in SPECIES.DBF. The output for this demonstration is DEMELKSUM.
Print LayoutsThe ArcVIEW project map may be printed.Click LAYOUTS in the ArcVIEW project window.
•
•
•
•
•
•
•
•
•
•
•
•
•
USDA Forest Service RMRS-GTR-180WWW. 2006 2�
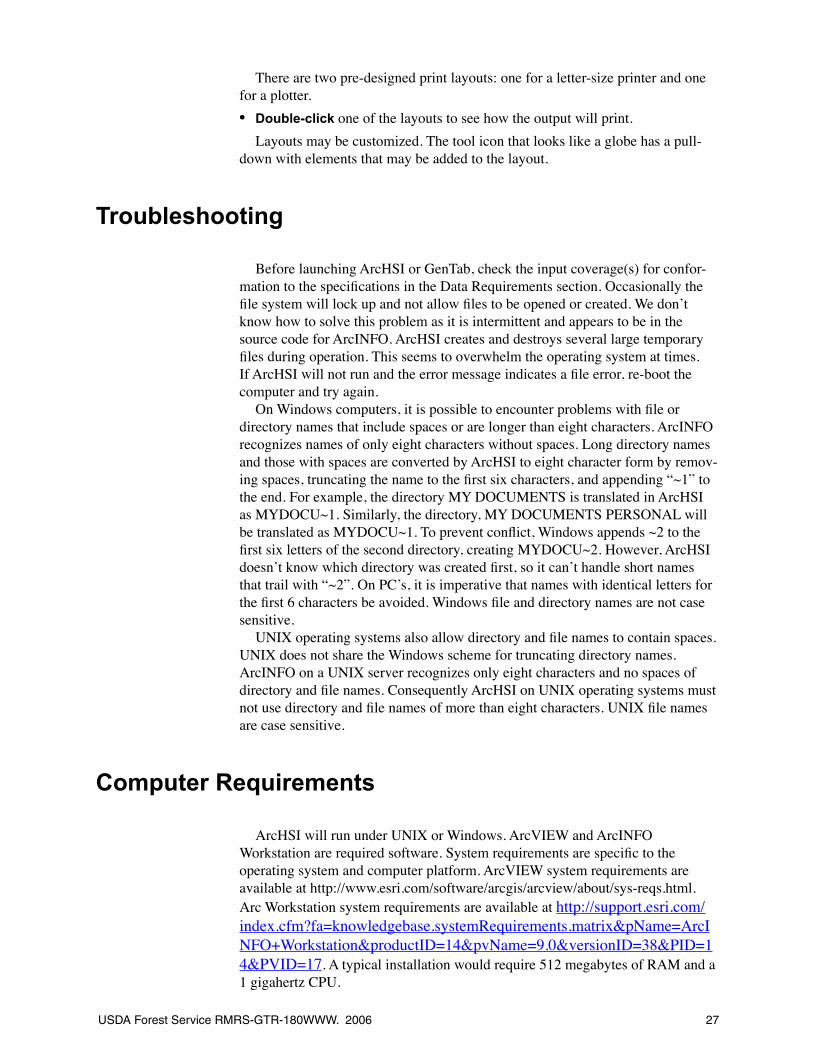
There are two pre-designed print layouts: one for a letter-size printer and one for a plotter.
Double-click one of the layouts to see how the output will print.Layouts may be customized. The tool icon that looks like a globe has a pull-
down with elements that may be added to the layout.
Troubleshooting
Before launching ArcHSI or GenTab, check the input coverage(s) for confor-mation to the specifications in the Data Requirements section. Occasionally the file system will lock up and not allow files to be opened or created. We don’t know how to solve this problem as it is intermittent and appears to be in the source code for ArcINFO. ArcHSI creates and destroys several large temporary files during operation. This seems to overwhelm the operating system at times. If ArcHSI will not run and the error message indicates a file error, re-boot the computer and try again.
On Windows computers, it is possible to encounter problems with file or directory names that include spaces or are longer than eight characters. ArcINFO recognizes names of only eight characters without spaces. Long directory names and those with spaces are converted by ArcHSI to eight character form by remov-ing spaces, truncating the name to the first six characters, and appending “~1” to the end. For example, the directory MY DOCUMENTS is translated in ArcHSI as MYDOCU~1. Similarly, the directory, MY DOCUMENTS PERSONAL will be translated as MYDOCU~1. To prevent conflict, Windows appends ~2 to the first six letters of the second directory, creating MYDOCU~2. However, ArcHSI doesn’t know which directory was created first, so it can’t handle short names that trail with “~2”. On PC’s, it is imperative that names with identical letters for the first 6 characters be avoided. Windows file and directory names are not case sensitive.
UNIX operating systems also allow directory and file names to contain spaces. UNIX does not share the Windows scheme for truncating directory names. ArcINFO on a UNIX server recognizes only eight characters and no spaces of directory and file names. Consequently ArcHSI on UNIX operating systems must not use directory and file names of more than eight characters. UNIX file names are case sensitive.
Computer Requirements
ArcHSI will run under UNIX or Windows. ArcVIEW and ArcINFO Workstation are required software. System requirements are specific to the operating system and computer platform. ArcVIEW system requirements are available at http://www.esri.com/software/arcgis/arcview/about/sys-reqs.html. Arc Workstation system requirements are available at http://support.esri.com/index.cfm?fa=knowledgebase.systemRequirements.matrix&pName=ArcINFO+Workstation&productID=14&pvName=9.0&versionID=38&PID=14&PVID=17. A typical installation would require 512 megabytes of RAM and a 1 gigahertz CPU.
•

28 USDA Forest Service RMRS-GTR-180WWW. 2006
References
Benkobi, L., M. A. Rumble, G. C. Brundige and J. J. Millspaugh. 2004. Refinement of the Arc-Habcap model to predict habitat effectiveness for elk. Research Paper RMRS-RP-51. Ft. Collins, CO: U.S. Department of Agriculture, Forest Service, Rocky Mountain Forest and Range Experiment Station. 18 p.
Benkobi, L, M. A Rumble, C.H. Stubblefield, R. S. Gamo and J.J. Millspaugh. 2005. Seasonal migration by female elk in the Black Hills of South Dakota and Wyoming. Prairie Naturalist. 37: 151-166.
British Colombia Wildlife Habitat Rating Standards. 1999. Ministry of Sustainable Resource Management Terrestrial Information Branch for the Resources Inventory Committee. Available: Ministry of Environment, Lands and Parks Resources Inventory Branch, Integrated Land Management Bureau Home Page, http://ilmbwww.gov.bc.ca/risc/pubs/teecolo/index.htm.
Buttery, R. F., and B. C. Gillam. 1983. Ecosystem descriptions. Pages 43-71 in: R. L. Hoover, and D. L. Wills, eds. Managing forested lands for wildlife. Colorado Division of Wildlife in cooperation with USDA Forest Service, Rocky Mountain Region, Denver, CO.
Hitchcock, M. and A. Ager. 1992. Microcomputer software for calculating an elk habitat effectiveness index on Blue Mountain winter ranges. Gen. Tech. Rep. GTR-PNW-301. Portland, OR: U.S. Department of Agriculture, Forest Service, Pacific Northwest Research Station. 13 p.
Lyon, L. J. and A. G. Christiansen. 1992. A partial glossary of elk management terms. Gen. Tech. Rep. INT-288. Ogden, UT: U.S. Department of Agriculture, Forest Service, Intermountain Research Station. 6 p.
Mills, T. R., M. A. Rumble and L. D. Flake. 1996. Evaluation of a habitat capability model for the nongame birds in the Black Hills, South Dakota. Research Paper RM-RP-323. U.S. Department of Agriculture, Forest Service, Rocky Mountain Forest and Range Experiment Station. 30 p.
RMRIS Data Dictionary. 1988. U.S. Department of Agriculture, Forest Service, Rocky Mountain Region. Lakewood, CO. 329 p.
Rumble, M. A. and S. H. Anderson. 1995. Evaluating the habitat capability model for Merriam’s turkeys. Research Paper RM-RP-320. U.S. Department of Agriculture, Forest Service, Rock Mountain Forest and Range Experiment Station. 8 p.
Rumble, M. A., L. Benkobi, G. C. Brundige and J. J. Millspaugh. 2001. Winter elk dispersion patterns relative to the predictions of a spatially explicit habitat model. Pages 40-48 in: J. A. Mortenson, D. G. Whitaker, E. C. Meslow, D. H. Jackson, M. J. Hendrick and B. K. Johnson, eds. Proceedings of the 2001 Western States and Provinces Deer and Elk Workshop. Wilsonville, OR. Aug 1-3, 2001.
Rumble, M.A., Benkobi, L., and R. S. Gamo. In press. A different time and place test of a spatially explicit habitat model for elk in the Black Hills. Research Paper. Ft. Collins, CO: U.S. Department of Agriculture, Forest Service, Rocky Mountain Research Station.
Thomas, J. W., D. A. Keckenby, M. Henjum, R. J. Pedersen, and L. D. Bryant. 1988. Habitat-effectiveness-index for elk on Blue Mountain Winter Ranges. Gen. Tech. Rep. PNW-GTR-218. Portland, OR: U.S. Department of Agriculture, Forest Service, Pacific Northwest Research Station. 28 p.
Towry, R. K., Jr. 1983. Wildlife habitat requirements. Pages 73-210 in: R. L. Hoover, and D. L. Wills, eds. Managing forested lands for wildlife. Colorado Division of Wildlife in cooperation with USDA Forest Service, Rocky Mountain Region, Denver, CO.
U.S. Fish and Wildlife Service 1980a. Habitat evaluation procedures (HEP). Division of Ecological Services. ESM-102. Washington, DC.
U.S. Fish and Wildlife Service 1980b. Habitat as a basis for environmental assessment. Division of Ecological Services. ESM-101. Washington, DC.
USDA Forest Service RMRS-GTR-180WWW. 2006 2�
Wisdom, M. J., L. R. Bright, C. G. Carey, W. W. Hines, R. J. Peterson, D. A. Smithey, J. W. Thomas, and G.W. Witmer. 1986. A model to evaluate elk habitat in western Oregon. R6-F&WL-216. Portland, OR: U.S. Department of Agriculture, Forest Service, Pacific Northwest Region. 35 p.

�0 USDA Forest Service RMRS-GTR-180WWW. 2006
Appendix 1. Glossary
ArcINFO Workstation Software that provides for creation, editing, updating, analysis and display of coverages. The ArcINFO workstation user interface is a command-line.
ArcVIEW Software that provides for editing, analysis and display of coverages. The ArcVIEW user interface is point-and-click.
Arithmetic Mean The sum of the observed values divided by the number of observations.
Attribute In ArcINFO, an information category equivalent to a field in a database.
Buffer In GIS, an area around a point, line or perimeter.Carrying Capacity The maximum population density a habitat will support
sustainably.Compensation The ability of increases in one habitat dimension to offset
decreases in another habitat dimension.Cover Landscape elements that shelter wildlife from biotic or abiotic
components of their environment.Cover Value (CV) The ArcHSI component that rates the value of the habitat
for cover.Cover Polygon A habitat area in which the principal value to a species is for
cover.Coverage In ArcINFO, a geographical database consisting of elements
referencing map-type elements and information regarding those elements.Exceed Broadcast Software that allows a PC to emulate a Forest Service
UNIX terminal.Forage or Food That which provides nourishment to wildlife. Note that food
and forage are used interchangeably here even though forage strictly applies only to the food of herbivores.
Forage Value (FV) The ArcHSI component that rates the value of the habitat for food.
Geographic Information System A collection of computer software and data that enables natural resource managers to associate information with place.
Geometric Mean The nth root of the product of the observed values where n is the number of observations.
Habitat Distribution Value (HDV) The ArcHSI component that rates how well forage and cover are distributed on the landscape.
Habitat Capability The ability of a habitat to provide a species life requisites under optimal conditions. This term is related to carrying capacity, but is not expressed as a population density.
Habitat Effectiveness The proportion of habitat actually available to a species. For elk this applies only outside the hunting season.
Habitat Suitability The ability of a habitat to provide a species life requisites under current conditions.

USDA Forest Service RMRS-GTR-180WWW. 2006 �1
Habitat Suitability Index A numeric (0 to 1.0) estimation of overall habitat quality relative to the best possible habitat.
Info Table In ArcINFO, a file with items composing the attributes of a coverage. These tables can also stand alone without being combined with location data.
Item In ArcINFO, a specific type of attribute information equivalent. The items in a coverage compose its attributes.
Hummingbird Neighborhood Networking software that makes it possible for computers running the Windows operating system to share data with computers running the UNIX operating system.
Layout In ArcVIEW, a group of visual elements to be printed.Seral Stage A member of the classification sequence of the temporal
development of a plant community.Server A computer that warehouses data and software.Structural Stage A categorical representation of the overstory canopy cover of
a timber stand.UNIX A computer operating system usually found on high-end servers and
workstations.Vegetation Type A classification of a vegetative land form on the basis of its
dominant species.View In ArcVIEW, a window displaying the data layers belonging to a project.Windows A computer operating system usually found on PC and laptop
computers.X Windows The graphical user interface available on computers running
UNIX operating systems.

The use of trade or firm names in this publication is for reader information and does not imply endorsement by the U.S. Department of Agriculture of any
production or service

Federal Recycling Program Printed on Recycled Paper
RMRSROCKY MOUNTAIN RESEARCH STATION
The Rocky Mountain Research Station develops scientific information and technology to improve management, pro-tection, and use of the forests and rangelands. Research is designed to meet the needs of the National Forest managers, Federal and State agencies, public and private organizations, academic institutions, industry, and individuals.
Studies accelerate solutions to problems involving ecosys-tems, range, forests, water, recreation, fire, resource inventory, land reclamation, community sustainability, forest engineering technology, multiple use economics, wildlife and fish habitat, and forest insects and diseases. Studies are conducted coop-eratively, and applications may be found worldwide.
Research Locations
Flagstaff, Arizona Reno, NevadaFort Collins, Colorado* Albuquerque, New MexicoBoise, Idaho Rapid City, South DakotaMoscow, Idaho Logan, UtahBozeman, Montana Ogden, UtahMissoula, Montana Provo, Utah
*Station Headquarters, Natural Resources Research Center, 2150 Centre Avenue, Building A, Fort Collins, CO 80526.
The U.S. Department of Agriculture (USDA) prohibits discrimination in all its programs and activities on the basis of race, color, national origin, age, disability, and where applicable, sex, marital status, familial status, parental status, religion, sexual orientation, genetic information, political beliefs, reprisal, or because all or part of an individual’s income is derived from any public assistance program. (Not all prohibited bases apply to all programs.) Persons with disabilities who require alternative means for communication of program information (Braille, large print, audiotape, etc.) should contact USDA’s TARGET Center at (202) �20-2600 (voice and TDD). To file a complaint of discrimination, write to USDA, Director, Office of Civil Rights, 1�00 Independence Avenue, S.W., Washington, DC 202�0-��10, or call (800) ���-�2�2 (voice) or (202) �20-6�82 (TDD). USDA is an equal opportunity pro-vider and employer.