ARC DOCUMENT SOLUTIONS, INC.s2.q4cdn.com/561634008/files/doc_financials/2014/18acf7b1-1964-41... ·...
49
ARC DOCUMENT SOLUTIONS, INC. FORM 10-Q (Quarterly Report) Filed 11/07/14 for the Period Ending 09/30/14 Address 1981 N. BROADWAY, SUITE 385 WALNUT CREEK, CA 94596 Telephone 925 949-5100 CIK 0001305168 Symbol ARC SIC Code 7330 - Mailing, Reproduction, Commercial Art And Industry Business Services Sector Services Fiscal Year 12/31 http://www.edgar-online.com © Copyright 2014, EDGAR Online, Inc. All Rights Reserved. Distribution and use of this document restricted under EDGAR Online, Inc. Terms of Use.
Transcript of ARC DOCUMENT SOLUTIONS, INC.s2.q4cdn.com/561634008/files/doc_financials/2014/18acf7b1-1964-41... ·...
ARC DOCUMENT SOLUTIONS, INC.
FORM 10-Q(Quarterly Report)
Filed 11/07/14 for the Period Ending 09/30/14
Address 1981 N. BROADWAY, SUITE 385
WALNUT CREEK, CA 94596Telephone 925 949-5100
CIK 0001305168Symbol ARC
SIC Code 7330 - Mailing, Reproduction, Commercial Art AndIndustry Business Services
Sector ServicesFiscal Year 12/31
http://www.edgar-online.com© Copyright 2014, EDGAR Online, Inc. All Rights Reserved.
Distribution and use of this document restricted under EDGAR Online, Inc. Terms of Use.
UNITED STATES SECURITIES AND EXCHANGE COMMISSION
Washington, D.C. 20549 _______________________________________
Form 10-Q _______________________________________
(Mark One)
For the quarterly period ended September 30, 2014
or
For the transition period from to
Commission File Number: 001-32407 _______________________________________
ARC DOCUMENT SOLUTIONS, INC. (Exact name of Registrant as specified in its Charter)
_______________________________________
1981 N. Broadway, Suite 385 Walnut Creek, California 94596
(925) 949-5100 (Address, including zip code, and telephone number, including area code, of Registrant’s principal executive offices)
_______________________________________
Indicate by check mark whether the registrant (1) has filed all reports required to be filed by Section 13 or 15(d) of the Securities Exchange Act of 1934 during the preceding 12 months (or for such shorter period that the registrant was required to file such reports), and (2) has been subject to such filing requirements for the past 90 days. Yes � No �
Indicate by check mark whether the registrant has submitted electronically and posted on its corporate Web site, if any, every Interactive Data File required to be submitted and posted pursuant to Rule 405 of Regulation S-T (§ 232.405 of this chapter) during the preceding 12 months (or for such shorter period that the registrant was required to submit and post such files). Yes � No �
Indicate by check mark whether the registrant is a large accelerated filer, an accelerated filer, a non-accelerated filer, or a smaller reporting company. See the definitions of “large accelerated filer,” “accelerated filer” and “smaller reporting company” in Rule 12b-2 of the Exchange Act. (Check one):
Indicate by check mark whether the registrant is a shell company (as defined in Rule 12b-2 of the Act). Yes � No �
As of October 31, 2014 , there were 46,723,728 shares of the issuer’s common stock outstanding.
� QUARTERLY REPORT PURSUANT TO SECTION 13 OR 15(d) OF THE SECURITIES EXCHANGE ACT OF 1934
� TRANSITION REPORT PURSUANT TO SECTION 13 OR 15(d) OF THE SECURITIES EXCHANGE ACT OF 1934
Delaware 20-1700361 (State or other jurisdiction of incorporation or organization)
(I.R.S. Employer Identification No.)
Large accelerated filer � Accelerated filer �
Non-accelerated filer � (Do not check if a smaller reporting company) Smaller reporting company �

ARC DOCUMENT SOLUTIONS, INC.
Form 10-Q
For the Quarter Ended September 30, 2014
Table of Contents
2
PART I—FINANCIAL INFORMATION 4
Item 1. Condensed Consolidated Financial Statements 4
Condensed Consolidated Balance Sheets as of September 30, 2014 and December 31, 2013 (Unaudited) 4
Condensed Consolidated Statements of Operations for the three and nine months ended September 30, 2014 and 2013 (Unaudited) 5
Condensed Consolidated Statements of Comprehensive Income for the three and nine months ended September 30, 2014 and 2013 (Unaudited) 6
Condensed Consolidated Statements of Equity for the nine months ended September 30, 2014 and 2013 (Unaudited) 7
Condensed Consolidated Statements of Cash Flows for the three and nine months ended September 30, 2014 and 2013 (Unaudited) 8
Notes to Condensed Consolidated Financial Statements (Unaudited) 9
Item 2. Management’s Discussion and Analysis of Financial Condition and Results of Operations 19
Item 3. Quantitative and Qualitative Disclosures About Market Risk 36
Item 4. Controls and Procedures 36
PART II—OTHER INFORMATION 38
Item 1. Legal Proceedings 38
Item 1A. Risk Factors 38
Item 6. Exhibits 39
Signatures 40
Exhibit Index 41
Exhibit 31.1
Exhibit 31.2
Exhibit 32.1
Exhibit 32.2

FORWARD-LOOKING STATEMENTS
This Quarterly Report on Form 10-Q contains statements that are “forward-looking statements” within the meaning of the Private Securities Litigation Reform Act of 1995. When used in this Form 10-Q, the words “believe,” “expect,” “anticipate,” “estimate,” “intend,” “plan,”“project,” “target,” “likely,” “will,” “would,” “co uld,” and variations of such words and similar expressions as they relate to our management or to ARC Document Solutions, Inc. (the “Company”) are intended to identify forward-looking statements. These forward-looking statements involve risks and uncertainties that could cause actual results to differ materially from those contemplated herein. We have described in Part II, Item 1A-“Risk Factors” a number of factors that could cause our actual results to differ from our projections or estimates. These factors and other risk factors described in this Form 10-Q are not necessarily all of the important factors that could cause actual results to differ materially from those expressed in any of our forward-looking statements. Other unknown or unpredictable factors also could harm our results. Consequently, there can be no assurance that the actual results or developments anticipated by us will be realized or, even if substantially realized, that they will have the expected consequences to, or effects on, us. Given these uncertainties, you are cautioned not to place undue reliance on such forward-looking statements.
Except where otherwise indicated, the statements made in this Form 10-Q are made as of the date we filed this report with the Securities and Exchange Commission and should not be relied upon as of any subsequent date. All future written and verbal forward-looking statements attributable to us or any person acting on our behalf are expressly qualified in their entirety by the cautionary statements contained or referred to in this section. We undertake no obligation, and specifically disclaim any obligation, to publicly update or revise any forward-looking statements, whether as a result of new information, future events or otherwise. You should, however, consult further disclosures we make in future filings of our Forms 10-K, Forms 10-Q, and Forms 8-K, and any amendments thereto, as well as our proxy statements.
3

PART I—FINANCIAL INFORMATION
Item 1. Condensed Consolidated Financial Statements
ARC DOCUMENT SOLUTIONS, INC. CONDENSED CONSOLIDATED BALANCE SHEETS
(Unaudited)
September 30, December 31,
(In thousands, except per share data) 2014 2013
Assets
Current assets:
Cash and cash equivalents $ 24,835 $ 27,362 Accounts receivable, net of allowances for accounts receivable of $2,507 and $2,517 64,056 56,328 Inventories, net 16,167 14,047 Deferred income taxes 347 356 Prepaid expenses 5,208 4,324 Other current assets 3,466 4,013
Total current assets 114,079 106,430 Property and equipment, net of accumulated depreciation of $215,606 and $206,636 59,515 56,181 Goodwill 212,608 212,608 Other intangible assets, net 24,682 27,856 Deferred financing fees, net 2,575 3,242 Deferred income taxes 976 1,186 Other assets 2,356 2,419
Total assets $ 416,791 $ 409,922 Liabilities and Equity
Current liabilities:
Accounts payable $ 25,427 $ 23,363 Accrued payroll and payroll-related expenses 14,733 11,497 Accrued expenses 23,369 21,365 Current portion of long-term debt and capital leases 11,394 21,500
Total current liabilities 74,923 77,725 Long-term debt and capital leases 194,238 198,228 Deferred income taxes 33,110 31,667 Other long-term liabilities 3,059 3,163
Total liabilities 305,330 310,783 Commitments and contingencies (Note 7)
Stockholders’ equity:
ARC Document Solutions, Inc. stockholders’ equity:
Preferred stock, $0.001 par value, 25,000 shares authorized; 0 shares issued and outstanding — — Common stock, $0.001 par value, 150,000 shares authorized; 46,790 and 46,365 shares issued and
46,721 and 46,320 shares outstanding 46 46 Additional paid-in capital 109,690 105,806 Retained deficit (5,026 ) (14,628 )
Accumulated other comprehensive income 229 634 104,939 91,858
Less cost of common stock in treasury, 69 and 45 shares 319 168 Total ARC Document Solutions, Inc. stockholders’ equity 104,620 91,690
Noncontrolling interest 6,841 7,449 Total equity 111,461 99,139 Total liabilities and equity $ 416,791 $ 409,922

The accompanying notes are an integral part of these condensed consolidated financial statements.
4
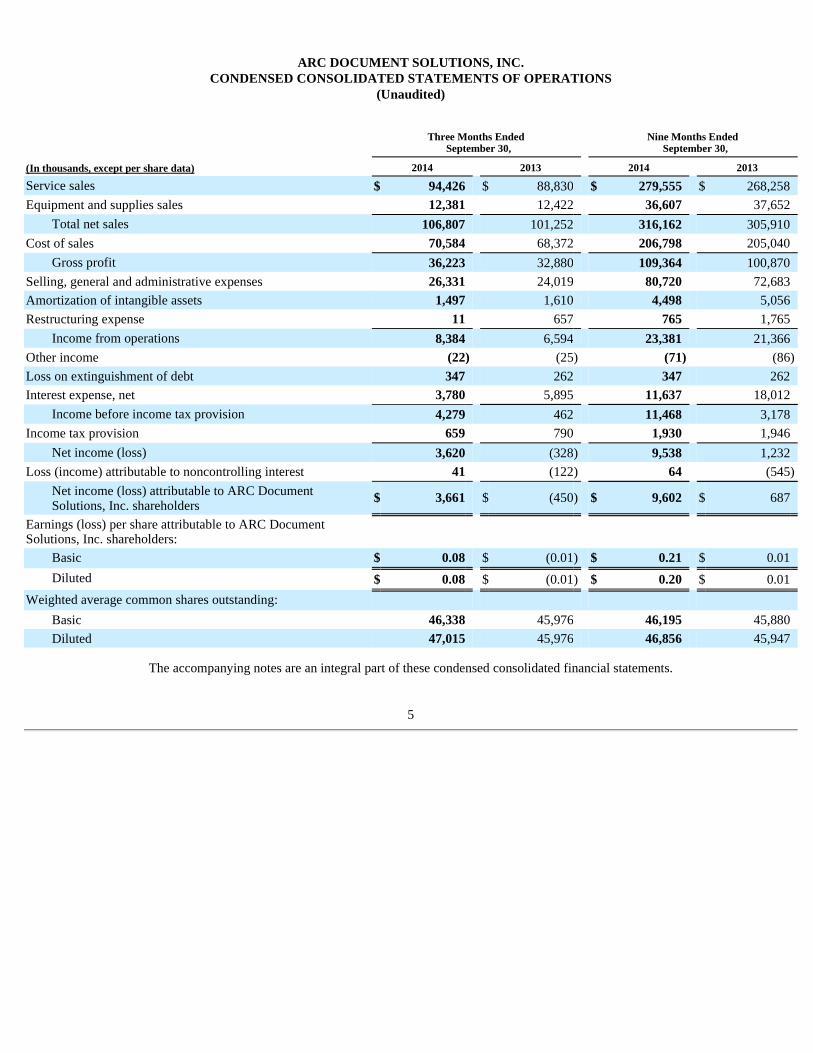
ARC DOCUMENT SOLUTIONS, INC. CONDENSED CONSOLIDATED STATEMENTS OF OPERATIONS
(Unaudited)
The accompanying notes are an integral part of these condensed consolidated financial statements.
5
Three Months Ended
September 30, Nine Months Ended
September 30,
(In thousands, except per share data) 2014 2013 2014 2013
Service sales $ 94,426 $ 88,830 $ 279,555 $ 268,258 Equipment and supplies sales 12,381 12,422 36,607 37,652
Total net sales 106,807 101,252 316,162 305,910 Cost of sales 70,584 68,372 206,798 205,040
Gross profit 36,223 32,880 109,364 100,870 Selling, general and administrative expenses 26,331 24,019 80,720 72,683 Amortization of intangible assets 1,497 1,610 4,498 5,056 Restructuring expense 11 657 765 1,765
Income from operations 8,384 6,594 23,381 21,366 Other income (22 ) (25 ) (71 ) (86 )
Loss on extinguishment of debt 347 262 347 262 Interest expense, net 3,780 5,895 11,637 18,012
Income before income tax provision 4,279 462 11,468 3,178 Income tax provision 659 790 1,930 1,946
Net income (loss) 3,620 (328 ) 9,538 1,232 Loss (income) attributable to noncontrolling interest 41 (122 ) 64 (545 )
Net income (loss) attributable to ARC Document Solutions, Inc. shareholders
$ 3,661
$ (450 )
$ 9,602
$ 687
Earnings (loss) per share attributable to ARC Document Solutions, Inc. shareholders:
Basic $ 0.08 $ (0.01 ) $ 0.21 $ 0.01 Diluted $ 0.08 $ (0.01 ) $ 0.20 $ 0.01
Weighted average common shares outstanding:
Basic 46,338 45,976 46,195 45,880 Diluted 47,015 45,976 46,856 45,947

ARC DOCUMENT SOLUTIONS, INC. CONDENSED CONSOLIDATED STATEMENTS OF COMPREHENSIVE INCOME
(Unaudited)
The accompanying notes are an integral part of these condensed consolidated financial statements.
6
Three Months Ended
September 30, Nine Months Ended
September 30,
(In thousands) 2014 2013 2014 2013
Net income (loss) $ 3,620 $ (328 ) $ 9,538 $ 1,232 Other comprehensive (loss) income, net of tax
Foreign currency translation adjustments (428 ) 385 (463 ) 259 Other comprehensive (loss) income, net of tax (428 ) 385 (463 ) 259 Comprehensive income 3,192 57 9,075 1,491 Comprehensive (loss) income attributable to noncontrolling interest (43 ) 182 (122 ) 757 Comprehensive income (loss) attributable to ARC Document Solutions, Inc. shareholders $ 3,235 $ (125 ) $ 9,197 $ 734
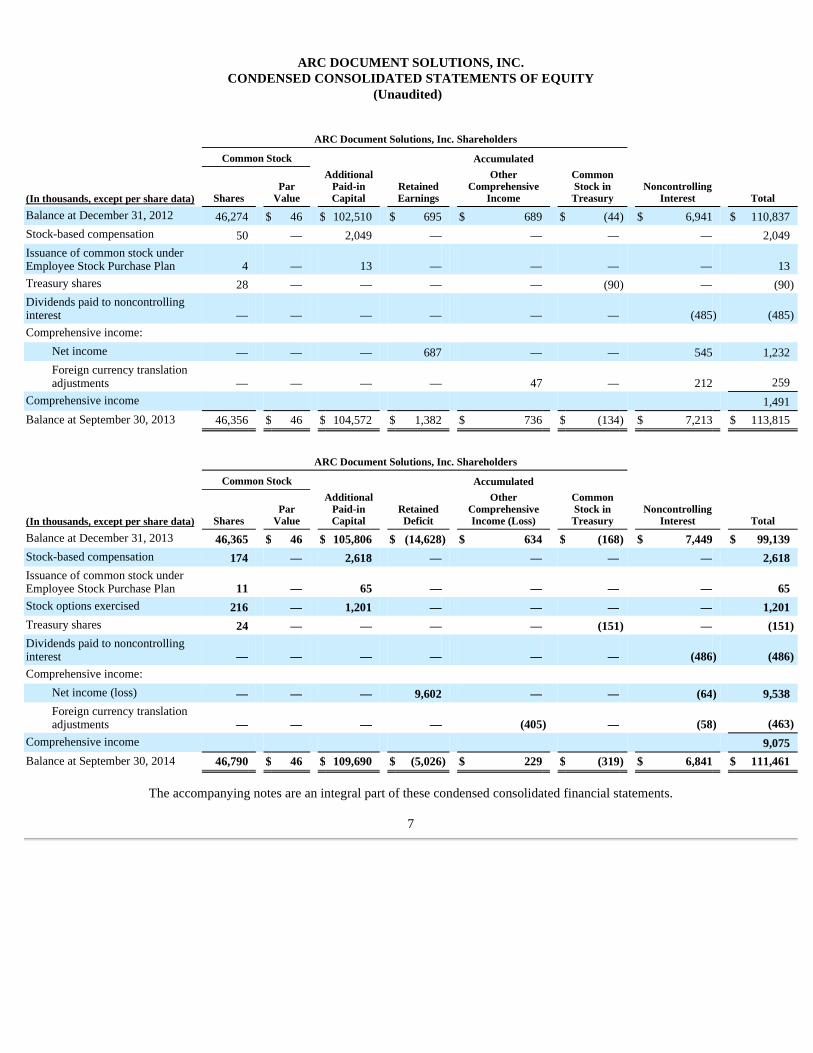
ARC DOCUMENT SOLUTIONS, INC. CONDENSED CONSOLIDATED STATEMENTS OF EQUITY
(Unaudited)
The accompanying notes are an integral part of these condensed consolidated financial statements.
7
ARC Document Solutions, Inc. Shareholders
Common Stock Accumulated
(In thousands, except per share data) Shares Par
Value
Additional Paid-in Capital
Retained Earnings
Other Comprehensive
Income
Common Stock in Treasury
Noncontrolling Interest Total
Balance at December 31, 2012 46,274 $ 46 $ 102,510 $ 695 $ 689 $ (44 ) $ 6,941 $ 110,837 Stock-based compensation 50 — 2,049 — — — — 2,049 Issuance of common stock under Employee Stock Purchase Plan 4 — 13 — — — — 13 Treasury shares 28 — — — — (90 ) — (90 )
Dividends paid to noncontrolling interest — — — — — — (485 ) (485 )
Comprehensive income: Net income — — — 687 — — 545 1,232 Foreign currency translation adjustments — — — — 47 — 212 259
Comprehensive income 1,491 Balance at September 30, 2013 46,356 $ 46 $ 104,572 $ 1,382 $ 736 $ (134 ) $ 7,213 $ 113,815
ARC Document Solutions, Inc. Shareholders
Common Stock Accumulated
(In thousands, except per share data) Shares Par
Value
Additional Paid-in Capital
Retained Deficit
Other Comprehensive Income (Loss)
Common Stock in Treasury
Noncontrolling Interest Total
Balance at December 31, 2013 46,365 $ 46 $ 105,806 $ (14,628 ) $ 634 $ (168 ) $ 7,449 $ 99,139 Stock-based compensation 174 — 2,618 — — — — 2,618 Issuance of common stock under Employee Stock Purchase Plan 11 — 65 — — — — 65 Stock options exercised 216 — 1,201 — — — — 1,201 Treasury shares 24 — — — — (151 ) — (151 ) Dividends paid to noncontrolling interest — — — — — — (486 ) (486 ) Comprehensive income:
Net income (loss) — — — 9,602 — — (64 ) 9,538 Foreign currency translation adjustments — — — — (405 ) — (58 ) (463 )
Comprehensive income 9,075 Balance at September 30, 2014 46,790 $ 46 $ 109,690 $ (5,026 ) $ 229 $ (319 ) $ 6,841 $ 111,461

ARC DOCUMENT SOLUTIONS, INC. CONDENSED CONSOLIDATED STATEMENTS OF CASH FLOWS
(Unaudited)
Three Months Ended
September 30, Nine Months Ended
September 30,
(In thousands) 2014 2013 2014 2013
Cash flows from operating activities Net income (loss) $ 3,620 $ (328 ) $ 9,538 $ 1,232 Adjustments to reconcile net income (loss) to net cash provided by operating activities:
Allowance for accounts receivable 197 105 444 551 Depreciation 7,039 7,059 21,063 21,034 Amortization of intangible assets 1,497 1,610 4,498 5,056 Amortization of deferred financing costs 190 270 587 831 Amortization of discount on long-term debt 207 168 656 500 Stock-based compensation 956 728 2,618 2,049 Deferred income taxes 2,100 182 6,272 918 Deferred tax valuation allowance (1,615 ) 386 (4,652 ) 560 Restructuring expense, non-cash portion — 70 — 363 Loss on early extinguishment of debt 347 262 347 262 Other non-cash items, net (401 ) (68 ) (337 ) (363 )
Changes in operating assets and liabilities: Accounts receivable (930 ) 4,491 (8,424 ) (7,358 )
Inventory (142 ) 441 (2,071 ) 721 Prepaid expenses and other assets (946 ) (1,102 ) (309 ) 1,988 Accounts payable and accrued expenses 3,192 5,745 6,819 11,666
Net cash provided by operating activities 15,311 20,019 37,049 40,010 Cash flows from investing activities Capital expenditures (3,430 ) (4,814 ) (10,027 ) (14,856 )
Payments related to business acquisitions — — (342 ) — Other 105 83 505 622 Net cash used in investing activities (3,325 ) (4,731 ) (9,864 ) (14,234 )
Cash flows from financing activities Proceeds from stock option exercises 191 — 1,201 — Proceeds from issuance of common stock under Employee Stock Purchase Plan 17 4 65 13 Share repurchases, including shares surrendered for tax withholding — — (151 ) (90 )
Proceeds from borrowings on long-term debt agreements — — — 402 Payments of debt extinguishment costs — (66 ) — (66 )
Early extinguishment of long-term debt (5,000 ) (7,000 ) (12,500 ) (7,000 )
Payments on long-term debt agreements and capital leases (5,497 ) (2,988 ) (16,437 ) (9,395 )
Net repayments under revolving credit facilities (532 ) (228 ) (828 ) (438 )
Payment of deferred financing costs — — (454 ) — Dividends paid to noncontrolling interest (486 ) (485 ) (486 ) (485 )
Net cash used in financing activities (11,307 ) (10,763 ) (29,590 ) (17,059 )
Effect of foreign currency translation on cash balances (50 ) 152 (122 ) 316 Net change in cash and cash equivalents 629 4,677 (2,527 ) 9,033 Cash and cash equivalents at beginning of period 24,206 32,377 27,362 28,021 Cash and cash equivalents at end of period $ 24,835 $ 37,054 $ 24,835 $ 37,054 Supplemental disclosure of cash flow information Noncash investing and financing activities
Capital lease obligations incurred $ 5,506 $ 2,491 $ 14,909 $ 6,737 Contingent liabilities in connection with business acquisitions $ 186 $ — $ 1,110 $ —

The accompanying notes are an integral part of these condensed consolidated financial statements.
8
ARC DOCUMENT SOLUTIONS, INC. NOTES TO CONDENSED CONSOLIDATED FINANCIAL STATEMENT S
(In thousands, except per share data or where otherwise noted) (Unaudited)
1. Description of Business and Basis of Presentation
ARC Document Solutions, Inc. (“ARC Document Solutions,” “ARC” or the “Company”) is the nation's leading document solutions provider for the architectural, engineering and construction (“AEC”) industry while also providing document solutions to businesses of all types. ARC offers a variety of services including: Onsite Services, Digital Services, Color Services, and Traditional Reprographics Services. In addition, ARC also sells Equipment and Supplies. The Company conducts its operations through its wholly-owned operating subsidiary, ARC Document Solutions, LLC, a Texas limited liability company, and its affiliates.
Basis of Presentation
The accompanying interim Condensed Consolidated Financial Statements are prepared in accordance with accounting principles generally accepted in the United States of America (“GAAP”) for interim financial information and in conformity with the requirements of the SEC. As permitted under those rules, certain footnotes or other financial information required by GAAP for complete financial statements have been condensed or omitted. In management’s opinion, the accompanying interim Condensed Consolidated Financial Statements presented reflect all adjustments of a normal and recurring nature that are necessary to fairly present the interim Condensed Consolidated Financial Statements. All material intercompany accounts and transactions have been eliminated in consolidation. The operating results for the three and nine months ended September 30, 2014 are not necessarily indicative of the results that may be expected for the year ending December 31, 2014 .
The preparation of financial statements in conformity with GAAP requires management to make estimates and assumptions that affect the amounts reported in the interim Condensed Consolidated Financial Statements and accompanying notes. The Company evaluates its estimates and assumptions on an ongoing basis and relies on historical experience and various other factors that it believes to be reasonable under the circumstances to determine such estimates. Actual results could differ from those estimates, and such differences may be material to the interim Condensed Consolidated Financial Statements.
These interim Condensed Consolidated Financial Statements and accompanying notes should be read in conjunction with the consolidated financial statements and notes included in the Company’s 2013 Form 10-K.
Recent Accounting Pronouncements
In May 2014, the Financial Accounting Standards Board (“FASB”) issued Accounting Standards Update (“ASU”) 2014-09 which supersedes the existing revenue recognition requirements in “Revenue Recognition (Topic 605).” The new guidance requires entities to recognize revenues when promised goods or services are transferred to customers in an amount that reflects the consideration that is expected to be received in exchange for those goods or services. ASU 2014-09 is effective for annual reporting periods beginning after December 15, 2016, including interim periods within that reporting period. Early adoption is not permitted. The Company is currently in the process of evaluating the impact of the adoption of ASU 2014-09 on its condensed consolidated financial statements.
In April 2014, the FASB issued ASU 2014-08. The new guidance raises the threshold for a disposal to qualify as a discontinued operation and requires new disclosures of both discontinued operations and certain other disposals that do not meet the definition of a discontinued operation. It is effective for annual periods beginning on or after December 15, 2014. Early adoption is permitted but only for disposals that have not been reported in financial statements previously issued. The Company is currently in the process of evaluating the impact of the adoption on its condensed consolidated financial statements.
In March 2013, the FASB issued ASU 2013-05. The new guidance covers the accounting for a cumulative translation adjustment on the parent entity upon de-recognition of a subsidiary or group of assets within a foreign entity. This new guidance requires that the parent release any related cumulative translation adjustment into net income only if the sale or transfer results in the complete or substantially complete liquidation of the foreign entity in which the subsidiary or group of assets had resided. The adoption of ASU 2013-05 had no impact to the Company’s condensed consolidated financial statements.
Segment Reporting
The provisions of Accounting Standards Codification (“ASC”) 280, Disclosures about Segments of an Enterprise and Related Information , require public companies to report financial and descriptive information about their reportable operating segments. The Company identifies operating segments based on the various business activities that earn revenue and incur expense and whose operating results are reviewed by the Company's Chief Executive Officer, who is the Company's chief operating decision
9
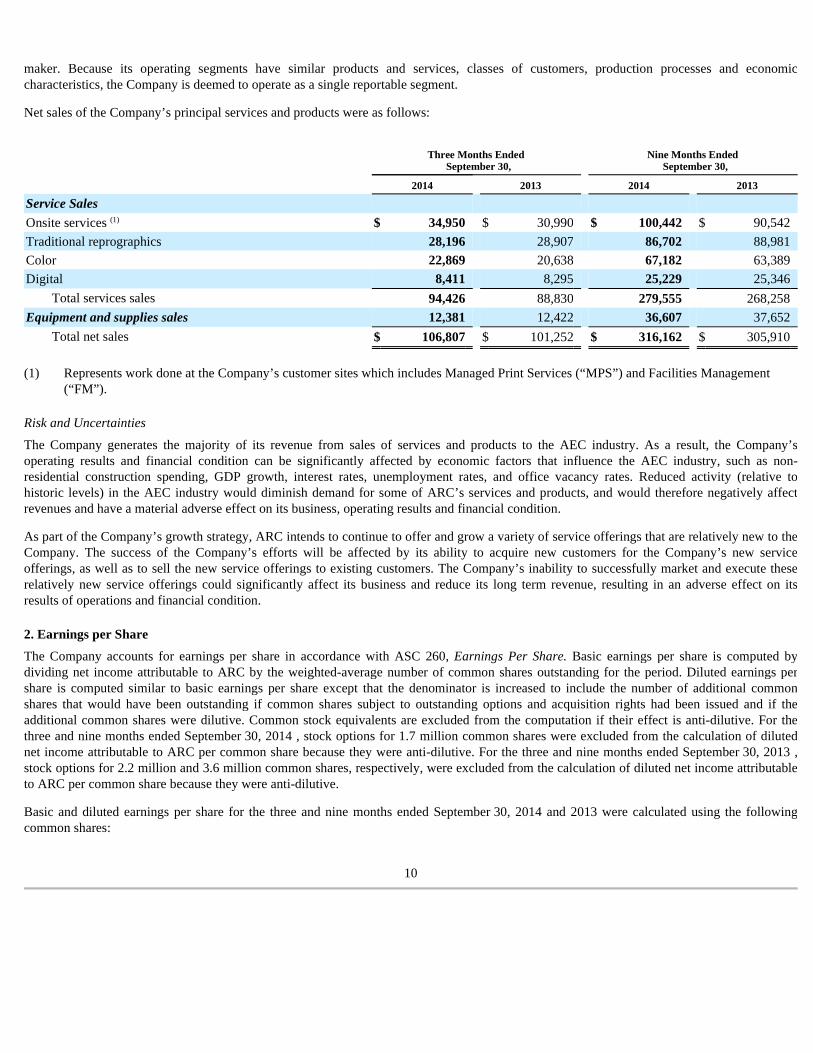
maker. Because its operating segments have similar products and services, classes of customers, production processes and economic characteristics, the Company is deemed to operate as a single reportable segment.
Net sales of the Company’s principal services and products were as follows:
Risk and Uncertainties
The Company generates the majority of its revenue from sales of services and products to the AEC industry. As a result, the Company’s operating results and financial condition can be significantly affected by economic factors that influence the AEC industry, such as non-residential construction spending, GDP growth, interest rates, unemployment rates, and office vacancy rates. Reduced activity (relative to historic levels) in the AEC industry would diminish demand for some of ARC’s services and products, and would therefore negatively affect revenues and have a material adverse effect on its business, operating results and financial condition.
As part of the Company’s growth strategy, ARC intends to continue to offer and grow a variety of service offerings that are relatively new to the Company. The success of the Company’s efforts will be affected by its ability to acquire new customers for the Company’s new service offerings, as well as to sell the new service offerings to existing customers. The Company’s inability to successfully market and execute these relatively new service offerings could significantly affect its business and reduce its long term revenue, resulting in an adverse effect on its results of operations and financial condition.
2. Earnings per Share
The Company accounts for earnings per share in accordance with ASC 260, Earnings Per Share. Basic earnings per share is computed by dividing net income attributable to ARC by the weighted-average number of common shares outstanding for the period. Diluted earnings per share is computed similar to basic earnings per share except that the denominator is increased to include the number of additional common shares that would have been outstanding if common shares subject to outstanding options and acquisition rights had been issued and if the additional common shares were dilutive. Common stock equivalents are excluded from the computation if their effect is anti-dilutive. For the three and nine months ended September 30, 2014 , stock options for 1.7 million common shares were excluded from the calculation of diluted net income attributable to ARC per common share because they were anti-dilutive. For the three and nine months ended September 30, 2013 , stock options for 2.2 million and 3.6 million common shares, respectively, were excluded from the calculation of diluted net income attributable to ARC per common share because they were anti-dilutive.
Basic and diluted earnings per share for the three and nine months ended September 30, 2014 and 2013 were calculated using the following common shares:
10
Three Months Ended
September 30, Nine Months Ended
September 30,
2014 2013 2014 2013
Service Sales
Onsite services (1) $ 34,950 $ 30,990 $ 100,442 $ 90,542 Traditional reprographics 28,196 28,907 86,702 88,981 Color 22,869 20,638 67,182 63,389 Digital 8,411 8,295 25,229 25,346
Total services sales 94,426 88,830 279,555 268,258 Equipment and supplies sales 12,381 12,422 36,607 37,652
Total net sales $ 106,807 $ 101,252 $ 316,162 $ 305,910
(1) Represents work done at the Company’s customer sites which includes Managed Print Services (“MPS”) and Facilities Management (“FM”).

3. Restructuring Expenses
To ensure that the Company’s costs and resources were in line with demand for its current portfolio of services and products, management initiated a restructuring plan in the fourth quarter of 2012. Restructuring activities associated with the plan concluded in the fourth quarter of 2013. Through December 31, 2013 , the restructuring plan included the closure or downsizing of 56 of the Company’s service centers, which represented more than 25% of its total number of service center locations. In addition, as part of the restructuring plan, the Company reduced headcount and middle management associated with its service center locations, streamlined the senior operational management team, and allocated more resources into growing sales categories such as Onsite services. The reduction in headcount totaled approximately 300 full-time employees, which represented approximately 10% of the Company’s total workforce. To date, the Company has incurred $6.6 million of expense related to its restructuring plan.
Restructuring expenses include employee termination costs, estimated lease termination and obligation costs, and other restructuring expenses. Restructuring expenses for the three and nine months ended September 30, 2014 primarily consisted of revised estimated lease termination and obligation costs resulting from facilities closed in 2013.
The following table summarizes restructuring expenses incurred in the three and nine months ended September 30, 2014 and 2013 :
The changes in the restructuring liability from December 31, 2013 through September 30, 2014 are summarized as follows:
4. Goodwill and Other Intangibles Resulting from Business Acquisitions
Goodwill
In connection with acquisitions, the Company applies the provisions of ASC 805, Business Combinations , using the acquisition method of accounting. The excess purchase price over the assessed fair value of net tangible assets and identifiable intangible assets acquired is recorded as goodwill.
In accordance with ASC 350, Intangibles—Goodwill and Other , the Company assesses goodwill for impairment annually as of September 30, and more frequently if events and circumstances indicate that goodwill might be impaired. At September 30, 2014, the Company performed its assessment and determined that goodwill was not impaired.
Goodwill impairment testing is performed at the reporting unit level. Goodwill is assigned to reporting units at the date the goodwill is initially recorded. Once goodwill has been assigned to reporting units, it no longer retains its association with a particular
11
Three Months Ended
September 30, Nine Months Ended
September 30,
2014 2013 2014 2013
Weighted average common shares outstanding—basic 46,338 45,976 46,195 45,880 Effect of dilutive impact on equity-based compensation awards 677 — 661 67 Weighted average common shares outstanding—diluted 47,015 45,976 46,856 45,947
Three Months Ended September 30, Nine Months Ended September
30,
2014 2013 2014 2013
Employee termination costs $ — $ 1 $ — $ 12 Estimated lease termination and obligation costs 7 395 540 1,361 Other restructuring expenses 4 261 225 392
Total restructuring expenses $ 11 $ 657 $ 765 $ 1,765
Nine Months Ended September 30, 2014
Balance, December 31, 2013 $ 539 Restructuring expenses 765 Payments (1,194 )
Balance, September 30, 2014 $ 110

acquisition, and all of the activities within a reporting unit, whether acquired or internally generated, are available to support the value of the goodwill.
Goodwill impairment testing is a two-step process. Step one involves comparing the fair value of the reporting units to its carrying amount. If the carrying amount of a reporting unit is greater than zero and its fair value is greater than its carrying amount, there is no impairment. If the reporting unit’s carrying amount is greater than the fair value, the second step must be completed to measure the amount of impairment, if any. Step two involves calculating the implied fair value of goodwill by deducting the fair value of all tangible and intangible assets, excluding goodwill, of the reporting unit from the fair value of the reporting unit as determined in step one. The implied fair value of goodwill determined in this step is compared to the carrying value of goodwill. If the implied fair value of goodwill is less than the carrying value of goodwill, an impairment loss is recognized equal to the difference.
The Company determines the fair value of its reporting units using an income approach. Under the income approach, the Company determined fair value based on estimated discounted future cash flows of each reporting unit. The cash flows are discounted by an estimated weighted-average cost of capital, which is intended to reflect the overall level of inherent risk of a reporting unit. Determining the fair value of a reporting unit is judgmental in nature and requires the use of significant estimates and assumptions, including revenue growth rates and EBITDA margins, discount rates and future market conditions, among others. The Company considered market information in assessing the reasonableness of the fair value under the income approach outlined above.
Given the current economic environment, the changing document and printing needs of the Company’s customers, and the uncertainties regarding the related impact on the Company’s business, there can be no assurance that the estimates and assumptions made for purposes of the Company’s goodwill impairment testing in 2014 will prove to be accurate predictions of the future. If the Company’s assumptions, including forecasted EBITDA of certain reporting units, are not achieved, the Company may be required to record additional goodwill impairment charges in future periods, whether in connection with the Company’s next annual impairment testing in the third quarter of 2015, or on an interim basis, if any such change constitutes a triggering event (as defined under ASC 350, Intangibles—Goodwill and Other ) outside of the quarter when the Company regularly performs its annual goodwill impairment test. It is not possible at this time to determine if any such future impairment charge would result or, if it does, whether such charge would be material.
There was no change to the carrying amount of goodwill from January 1, 2013 through September 30, 2014 .
Long-lived Assets
The Company periodically assesses potential impairments of its long-lived assets in accordance with the provisions of ASC 360, Accounting for the Impairment or Disposal of Long-lived Assets . An impairment review is performed whenever events or changes in circumstances indicate that the carrying value of the assets may not be recoverable. The Company groups its assets at the lowest level for which identifiable cash flows are largely independent of the cash flows of the other assets and liabilities.
Factors considered by the Company include, but are not limited to, significant underperformance relative to historical or projected operating results; significant changes in the manner of use of the acquired assets or the strategy for the overall business; and significant negative industry or economic trends. When the carrying value of a long-lived asset may not be recoverable based upon the existence of one or more of the above indicators of impairment, the Company estimates the future undiscounted cash flows expected to result from the use of the asset and its eventual disposition. If the sum of the expected future undiscounted cash flows and eventual disposition is less than the carrying amount of the asset, the Company recognizes an impairment loss. An impairment loss is reflected as the amount by which the carrying amount of the asset exceeds the fair value of the asset, based on the fair value if available, or discounted cash flows, if fair value is not available.
Other intangible assets that have finite lives are amortized over their useful lives. Customer relationships are amortized using the accelerated method, based on customer attrition rates, over their estimated useful lives of 13 (weighted average) years. The Company acquired three businesses during the nine months ended September 30, 2014 and recorded customer relationship intangibles of $1.4 million related to the acquisitions. Consideration for the purchase of the three businesses included cash payments of $0.3 million for the nine months ended September 30, 2014 , and earnout liabilities of $0.2 million and $1.1 million for the three and nine months ended September 30, 2014 , respectively. The Company's requirement to pay these earnout liabilities is contingent upon the future financial growth of the three acquired businesses.
12

The following table sets forth the Company’s other intangible assets resulting from business acquisitions as of September 30, 2014 and December 31, 2013 which continue to be amortized:
Based on current information, estimated future amortization expense of amortizable intangible assets for the remainder of the 2014 fiscal year, each of the subsequent four fiscal years and thereafter are as follows:
5. Income Taxes
On a quarterly basis, the Company estimates its effective tax rate for the full fiscal year and records a quarterly income tax provision based on the anticipated rate in conjunction with the recognition of any discrete items within the quarter.
The Company recorded an income tax provision of $0.7 million and $1.9 million in relation to pretax income of $4.3 million and $11.5 million for the three and nine months ended September 30, 2014 , respectively. The income tax provision was primarily due to the impact of amortization of tax basis goodwill in a deferred tax liability position.
In accordance with ASC 740-10, Income Taxes , the Company evaluates its deferred tax assets to determine if a valuation allowance is required based on the consideration of all available evidence using a “more likely than not” standard, with significant weight being given to evidence that can be objectively verified. This assessment considers, among other matters, the nature, frequency and severity of current and cumulative losses, forecasts of future profitability; the length of statutory carryover periods for operating losses and tax credit carryovers; and available tax planning alternatives. As of June 30, 2011, the Company determined that cumulative losses for the preceding twelve quarters constituted sufficient objective evidence (as defined by ASC 740-10) that a valuation allowance on certain deferred assets was needed. As of September 30, 2014 , the Company has a $80.9 million valuation allowance against certain of its deferred tax assets.
Based on the Company’s assessment, the remaining net deferred tax assets of $1.3 million as of September 30, 2014 , which relate to foreign entities, are considered more likely than not to be realized. The valuation allowance of $80.9 million may be increased or decreased as conditions change or if the Company is unable to implement certain available tax planning strategies. The realization of the Company’s net deferred tax assets ultimately depend on future taxable income, reversals of existing taxable temporary differences or through a loss carry back. The Company has income tax receivables of $0.2 million as of September 30, 2014 included in other current assets in its condensed consolidated balance sheet primarily related to income tax refunds for prior years.
13
September 30, 2014 December 31, 2013
Gross Carrying Amount
Accumulated Amortization
Net Carrying Amount
Gross Carrying Amount
Accumulated Amortization
Net Carrying Amount
Amortizable other intangible assets
Customer relationships $ 99,033 $ 74,892 $ 24,141 $ 97,775 $ 70,495 $ 27,280 Trade names and trademarks 20,369 19,828 541 20,375 19,799 576
$ 119,402 $ 94,720 $ 24,682 $ 118,150 $ 90,294 $ 27,856
2014 (excluding the nine months ended September 30, 2014) $ 1,473 2015 5,531 2016 4,728 2017 4,180 2018 3,781 Thereafter 4,989
$ 24,682

6. Long-Term Debt
Long-term debt consists of the following:
Term Loan Credit Agreement On December 20, 2013, the Company entered into a Term Loan Credit Agreement (the “Term Loan Credit Agreement”) among the Company, as borrower, JPMorgan Chase Bank., N.A, as administrative agent and as collateral agent, and the lenders party thereto.
The credit facility provided under the Term Loan Credit Agreement consists of an initial term loan facility of $200.0 million , the entirety of which was disbursed in order to pay for the purchase of the Company's then outstanding 10.5% senior unsecured notes due 2016 (the “Notes”) that were accepted under a cash tender offer and the subsequent redemption of the remaining outstanding Notes and to pay associated fees and expenses in connection with the cash tender offer and redemption. The Company has the right to request increases to the aggregate amount of term loans by an amount not to exceed $50.0 million in the aggregate. The Term Loan Credit Agreement maturity date, with respect to the initial $200.0 million term loan, is December 20, 2018. Under the Term Loan Credit Agreement, the Company is required to make regularly scheduled principal payments of $2.5 million each quarter, with all remaining unpaid principal due at maturity. During the nine months ended September 30, 2014 , the Company made its scheduled principal payments of $7.5 million and voluntarily prepaid $12.5 million of its scheduled principal payments due through December 31, 2015.
The term loan extended under the Term Loan Credit Agreement can be maintained in different tranches consisting of Eurodollar loans or as base rate loans. It is expected that the borrowings under the Term Loan Credit Agreement will be maintained in Eurodollars and therefore will bear interest, for any interest period, at a rate per annum equal to (i) the higher of (A) the LIBOR rate for U.S. dollar deposits for a period equal to the applicable interest period as determined by the administrative agent in accordance with the Term Loan Credit Agreement and (B) with respect to the initial term loans only, 1.00% , plus (ii) an applicable margin of 5.25% . The Company pays certain recurring fees with respect to the credit facility, including administration fees to the administrative agent.
In accordance with the Term Loan Credit Agreement, the Company is required to maintain an Interest Expense Coverage Ratio (as defined in the Term Loan Credit Agreement) greater than or equal to 2.00 :1.00 as of the end of each fiscal quarter. In addition, the Company is required to maintain a Total Leverage Ratio less than or equal to (i) 4.50 :1.00 for any fiscal quarter ending through December 31, 2014; (ii) 4.25 :1.00 for any fiscal quarter ending between March 31, 2015 and December 31, 2015; (iii) 4.00 :1.00 for any fiscal quarter ending between March 31, 2016 and December 31, 2016; (iv) 3.75 :1.00 for any fiscal quarter ending between March 31, 2017 and December 31, 2017; and (v) 3.50 :1.00 for any fiscal quarter ending March 31, 2018 and thereafter. The Company was in compliance with the Term Loan Credit Agreement covenants as of September 30, 2014 . Subject to certain exceptions, the term loan extended under the Term Loan Credit Agreement is subject to customary mandatory prepayment provisions with respect to: the net cash proceeds from certain asset sales; the net cash proceeds from certain issuances
14
September 30,
2014 December 31, 2013
Term loan credit agreement maturing 2018, net of original issue discount of $3,135 and $4,000 ; 6.25% interest rate at September 30, 2014 and December 31, 2013, respectively. $ 176,865 $ 196,000 Various capital leases; weighted average interest rate of 7.0% and 7.5% at September 30, 2014 and December 31, 2013, respectively; principal and interest payable monthly through November 2019 27,563 21,516 Borrowings from foreign revolving credit facilities; 0.6% interest rate at September 30, 2014 and December 31, 2013 971 1,811 Various other notes payable with a weighted average interest rate of 6.5% and 6.4% at September 30, 2014 and December 31, 2013, respectively; principal and interest payable monthly through June 2016 233 401 205,632 219,728 Less current portion (11,394 ) (21,500 )
$ 194,238 $ 198,228

or incurrences of debt (other than debt permitted to be incurred under the terms of the Term Loan Credit Agreement); a portion (with stepdowns based upon the achievement of a financial covenant linked to the total leverage ratio) of annual excess cash flow of the Company and certain of its subsidiaries, and with such required prepayment amount to be reduced dollar-for-dollar by the amount of voluntary prepayments of term loans made with internally generated funds; and, the net cash proceeds in excess of a certain amount from insurance recovery (other than business interruption insurance) and condemnation events of the Company and certain of its subsidiaries, subject to certain reinvestment rights.
The Term Loan Credit Agreement contains customary representations and warranties, subject to limitations and exceptions, and customary covenants restricting the ability (subject to various exceptions) of the Company and certain of its subsidiaries to: incur additional indebtedness (including guarantee obligations); incur liens; engage in mergers or other fundamental changes; sell certain property or assets; pay dividends of other distributions; consummate acquisitions; make investments, loans and advances; prepay certain indebtedness; change the nature of their business; engage in certain transactions with affiliates; and, incur restrictions on the ability of the Company’s subsidiaries to make distributions, advances and asset transfers.
The Term Loan Credit Agreement contains customary events of default, including with respect to: nonpayment of principal, interest, fees or other amounts; material inaccuracy of a representation or warranty when made; failure to perform or observe covenants; cross-default to other material indebtedness; bankruptcy and insolvency events; inability to pay debts; monetary judgment defaults; actual or asserted invalidity or impairment of any definitive loan documentation; and a change of control.
The obligations of the Company under the Term Loan Credit Agreement are guaranteed by each United States domestic subsidiary of the Company. The Term Loan Credit Agreement and any interest rate protection and other hedging arrangements provided by any lender party to the Senior Secured Credit Facilities or any affiliate of such a lender are secured on a first priority basis by a perfected security interest in substantially all of the Company’s and each guarantor’s assets (subject to certain exceptions), except that such lien is second priority in the case of inventory, receivables and related assets that are subject to a first priority security interest under the 2012 Credit Agreement (as defined below).
2012 Credit Agreement
On January 27, 2012, the Company entered into a Credit Agreement (the “2012 Credit Agreement”). The 2012 Credit Agreement was amended on December 20, 2013 in connection with the Company's entry into the Term Loan Credit Agreement for the principal purpose of making the 2012 Credit Agreement consistent with the Term Loan Credit Agreement. The 2012 Credit Agreement, as amended, provides revolving loans in an aggregate principal amount not to exceed $40.0 million with a Canadian sublimit of $5.0 million , based on inventory and accounts receivable of the Company’s subsidiaries organized in the US ("United States Domestic Subsidiaries") and Canada ("Canadian Domestic Subsidiaries") that meet certain eligibility criteria. The 2012 Credit Agreement has a maturity date of January 27, 2017 . Amounts borrowed in US dollars under the 2012 Credit Agreement bear interest, in the case of LIBOR loans, at a per annum rate equal to LIBOR plus the LIBOR Rate Margin (as defined in the 2012 Credit Agreement), which may range from 1.75% to 2.25% , based on Average Daily Net Availability (as defined in the 2012 Credit Agreement). All other amounts borrowed in US dollars that are not LIBOR loans bear interest at a per annum rate equal to (i) the greatest of (A) the Federal Funds rate plus 0.5% , (B) the LIBOR (calculated based upon an interest period of three months and determined on a daily basis), plus 1.0% per annum, and (C) the rate of interest announced, from time to time, within Wells Fargo Bank, National Association at its principal office in San Francisco as its “prime rate,” plus (ii) the Base Rate Margin (as defined in the 2012 Credit Agreement), which may range from 0.75% to 1.25% , based on Average Daily Net Availability (as defined in the 2012 Credit Agreement). Amounts borrowed in Canadian dollars bear interest at a per annum rate equal to the Canadian Base Rate (as defined in the 2012 Credit Agreement) plus the LIBOR Margin, which may range from 1.75% to 2.25% , based on Average Daily Net Availability. The 2012 Credit Agreement contains various loan covenants that restrict the Company’s ability to take certain actions, including restrictions on incurrence of indebtedness, creation of liens, mergers or consolidations, dispositions of assets, repurchase or redemption of capital stock, making certain investments, entering into certain transactions with affiliates or changing the nature of the Company’s business. In addition, at any time when Excess Availability (as defined in the 2012 Credit Agreement) is less than $8.0 million , the Company is required to maintain a Fixed Charge Coverage Ratio (as defined in the 2012 Credit Agreement) of at least 1.0 . The Company’s obligations under the 2012 Credit Agreement are secured by substantially all of the Company’s and its United States Domestic Subsidiaries’ assets. The Company's United States Domestic Subsidiaries have also guaranteed all of the Company’s obligations under the 2012 Credit Agreement. The obligations of the Company’s Canadian Domestics Subsidiaries which are borrowers under the 2012 Credit Agreement are secured by substantially all of the assets of the Company’s Canadian Domestic Subsidiaries.
15

As of and during the nine months ended September 30, 2014 , the Company did no t have any outstanding debt under the 2012 Credit Agreement, other than contingent reimbursement obligations for undrawn standby letters of credit described below that were issued under the 2012 Credit Agreement.
As of September 30, 2014 , based on inventory and accounts receivable of the Company’s subsidiaries organized in the US and Canada, the Company’s borrowing availability under the 2012 Credit Agreement was $40.0 million . Standby letters of credit totaling $2.3 million reduced the Company’s borrowing availability under the 2012 Credit Agreement to $37.7 million as of September 30, 2014 .
Foreign Credit Agreement
In the third quarter of 2013, in conjunction with its Chinese operations, UNIS Document Solutions Co. Ltd. (“UDS”), the Company’s Chinese business venture with Beijing-based Unisplendour, entered into a revolving credit facility with a term of 18 months . The facility provides for a maximum credit amount of 20.0 million Chinese Yuan Renminbi, which translates to U.S. $3.2 million as of September 30, 2014 . Draws on the facility are limited to 30 day periods and incur a fee of 0.05% of the amount drawn and no additional interest is charged.
Other Notes Payable
Includes notes payable collateralized by equipment previously purchased and subordinated seller notes payable related to prior acquisitions.
7. Commitments and Contingencies
Operating Leases. The Company has entered into various non-cancelable operating leases primarily related to facilities, equipment and vehicles used in the ordinary course of business.
Contingent Transaction Consideration. The Company is subject to earnout obligations entered into in connection with acquisitions. If acquired businesses generate sales and/or operating profits in excess of predetermined targets, the Company is obligated to make additional cash payments in accordance with the terms of such earnout obligations. As of September 30, 2014 , the Company has potential future earnout obligations for acquisitions consummated before the adoption of ASC 805, Business Combinations, of approximately $1.5 million through 2014 if predetermined financial targets are met or exceeded. Earnout payments prior to the adoption of ASC 805 are recorded as additional purchase price (as goodwill) when the contingent payments are earned and become payable. The Company does not believe payment of such earnouts to be probable. As of September 30, 2014 , the Company recorded liabilities related to future earnout payments consummated subsequent to the adoption of ASC 805 of $1.1 million . In accordance with ASC 805, changes to the liability are recognized in the company's consolidated statement of operations.
Legal Proceedings. On October 21, 2010, a former employee, individually and on behalf of a purported class consisting of all non-exempt employees who work or worked for American Reprographics Company, L.L.C. and American Reprographics Company in the State of California at any time from October 21, 2006 through the present, filed an action against the Company in the Superior Court of California for the County of Orange. The complaint alleges, among other things, that the Company violated the California Labor Code by failing to (i) provide meal and rest periods, or compensation in lieu thereof, (ii) timely pay wages due at termination, and (iii) that those practices also violate the California Business and Professions Code. The relief sought includes damages, restitution, penalties, interest, costs, and attorneys’ fees and such other relief as the court deems proper. On March 15, 2013, the Company participated in a private mediation session with claimants’ counsel which did not result in resolution of the claim. Subsequent to the mediation session, the mediator issued a proposal that was accepted by both parties. The Company has received preliminary court approval of the settlement, and awaits final court approval. The Company has a liability of $0.9 million as of September 30, 2014 related to the claim, which represents management's best estimate based on information available. On February 1, 2013, ARC filed a civil complaint against a competitor and a former employee in the Superior Court of California for Orange County, which alleged, among other claims, the misappropriation of ARC trade secrets; namely, proprietary customer lists that were used to communicate with ARC customers in an attempt to unfairly acquire their business. In prior litigation with the competitor based on related facts, in 2007 the competitor entered into a settlement agreement and stipulated judgment, which included an injunction. ARC instituted this suit to stop the defendant from using similar unfair business practices against it in the Southern California market. The case proceeded to trial in May 2014, and a jury verdict was entered for the defendants. In August 2014, the Company filed a Notice of Appeal. Legal fees associated with the litigation totaled $0.3 million and $2.8 million for the three and nine months ended September 30, 2014 , respectively, and are recorded within selling, general and administrative expenses in the condensed consolidated statement of operations.
16

In addition to the matters described above, the Company is involved in various additional legal proceedings and other legal matters from time to time in the normal course of business. The Company does not believe that the outcome of any of these matters will have a material effect on its consolidated financial position, results of operations or cash flows.
8. Stock-Based Compensation
At the Company's annual meeting of stockholders held on May 1, 2014, the Company's stockholders approved the Company's 2014 Stock Plan (the “2014 Stock Plan”) as adopted by the Company's board of directors. The 2014 Stock Plan replaces the American Reprographics Company 2005 Stock Plan (the "2005 Plan"). The 2014 Stock Plan provides for the grant of incentive and non-statutory stock options, stock appreciation rights, restricted stock, restricted stock units, stock bonuses and other forms of awards granted or denominated in the Company's common stock or units of the Company's common stock, as well as cash bonus awards to employees, directors and consultants of the Company. The 2014 Stock Plan authorizes the Company to issue up to 3.5 million shares of common stock. As of September 30, 2014 , 2.9 million shares remain available for issuance under the Stock Plan.
Stock options granted under the 2014 Stock Plan generally expire no later than ten years from the date of grant. Options generally vest and become fully exercisable over a period of three to four years from date of award, except that options granted to non-employee directors may vest over a shorter time period. The exercise price of options must be equal to at least 100% of the fair market value of the Company’s common stock on the date of grant. The Company allows for cashless exercises of vested outstanding options.
During the nine months ended September 30, 2014 , the Company granted options to acquire a total of 518 thousand shares of the Company's common stock to certain key employees with an exercise price equal to the fair market value of the Company’s common stock on the date of grant. These stock options will vest annually over three years and expire 10 years after the date of grant. In addition, the Company granted options to acquire a total of 48 thousand and 13 thousand shares of the Company’s common stock to its Chief Operating Officer and its Chief Financial Officer, respectively, with an exercise price equal to the fair market value of the Company’s common stock on the date of grant. These stock options will vest annually over four years and expire 10 years after the date of grant.
During the nine months ended September 30, 2014 , the Company granted 144 thousand shares of restricted stock to the Company's Chief Executive Officer. The restricted stock vests annually over four years after the date of grant. In addition, the Company granted 9 thousand shares of restricted stock to each of the Company's six non-employee members of its board of directors at a price per share equal to the closing price of the Company's common stock on the date the restricted stock was granted. The restricted stock vests on the one-year anniversary of the grant date.
The impact of stock-based compensation before income taxes on the interim Condensed Consolidated Statements of Operations was $1.0 million and $0.7 million for the three months ended September 30, 2014 and 2013 , respectively.
The impact of stock-based compensation before income taxes on the interim Condensed Consolidated Statements of Operations was $2.6 million and $2.0 million for the nine months ended September 30, 2014 and 2013 , respectively.
As of September 30, 2014 , total unrecognized compensation cost related to unvested stock-based payments totaled $4.6 million and is expected to be recognized over a weighted-average period of 2.0 years.
9. Fair Value Measurements
Fair Values of Financial Instruments. The following methods and assumptions were used by the Company in estimating the fair value of its financial instruments for disclosure purposes:
Cash equivalents: Cash equivalents are time deposits with maturity of three months or less when purchased, which are highly liquid and readily convertible to cash. Cash equivalents reported in the Company’s Condensed Consolidated Balance Sheets were $8.6 million and $12.9 million as of September 30, 2014 and December 31, 2013 , respectively, and are carried at cost and approximate fair value due to the relatively short period to maturity of these instruments.
Contingent Liabilities: The Company recognizes liabilities for future earnout obligations on business acquisitions at their fair value based on discounted projected payments on such obligations. The inputs to the valuation, which are level 3 inputs within the fair value hierarchy, are projected sales to be provided by the acquired businesses based on historical sales trends for which earnout amounts are contractually based. Liabilities for future earnout obligations totaled $1.1 million as of September 30, 2014 .
Short- and long-term debt: The carrying amount of the Company’s capital leases reported in the Condensed Consolidated Balance Sheets approximates fair value based on the Company’s current incremental borrowing rate for similar types of borrowing
17

arrangements. The carrying amount reported in the Company’s Condensed Consolidated Balance Sheet as of September 30, 2014 for borrowings under its Term Loan Credit Agreement is $176.9 million . The Company has determined, utilizing observable market quotes, that the fair value of borrowings under its Term Loan Credit Agreement is $181.4 million as of September 30, 2014 .
18

Item 2 . Management’s Discussion and Analysis of Financial Condition and Results of Operations
The following discussion should be read in conjunction with our interim Condensed Consolidated Financial Statements and the related notes and other financial information appearing elsewhere in this report as well as Management’s Discussion and Analysis of Financial Condition and Results of Operations included in our 2013 Form 10-K and this Quarterly Report on Form 10-Q for the quarter ended September 30, 2014 .
Business Summary
ARC Document Solutions, Inc. (“ARC Document Solutions,” “ARC,” “we,” “us,” or “our”) is the nation's leading document solutions provider for the architectural, engineering and construction (“AEC”) industry while also providing document solutions to businesses of all types.
We help our customers reduce their costs and improve productivity of their documents, improve their access and control over documents, and offer a wide variety of ways to print, produce, distribute, collaborate on, and store documents.
We have categorized our service and product offerings to report distinct sales recognized from our Onsite Services, Color Services, Digital Services, Traditional Reprographics Services, and Equipment and Supplies Sales.
Onsite Services consists of placement, management, and optimization of print and imaging equipment in our customers' facilities, relieving them of the burden of owning and managing print devices and print networks, and shifting their costs to a “per-use” basis. Onsite Services sales are driven by the ongoing print needs of our customers, and are less exposed to the episodic large-format printing needs associated with construction projects.
Color Services consists of specialized color printing and finishing services to marketing departments, regional and national retailers, and our traditional AEC customer base. This includes services provided under our Riot Creative Imaging brand.
Digital Services consists of digital document management services of all kinds, including archiving and information management (“AIM”), “digital shipping” and managed file transfer, software licensing, and technology consulting services.
Traditional Reprographics consists of the management, distribution, and print-on-demand of black and white construction drawings (frequently referred to as “blueprints”) and specification books. It derives a majority of its revenue from large-format black and white printing.
Equipment and Supplies consists of reselling printing, imaging, and related equipment to customers primarily in the AEC industry.
We have expanded our business beyond the services we traditionally provided to the AEC industry in the past and are currently focused on growing managed print services, technology-based document management services, and digital color imaging, as we believe the mix of services demanded by the AEC industry continues to shift toward document management at customer locations (represented primarily by our Onsite Services revenue line), and away from its historical emphasis on printing of large-format black and white construction drawings “offsite” in our service centers (represented primarily by our Traditional Reprographics revenue line). This belief is supported by the fact that our Onsite Services in the third quarter of 2014 are 33% of our total sales as compared to 26% for Traditional Reprographics. Onsite Services is our largest service offering and continues to grow at a rate of more than 10% on a year-over-year basis. In comparison, our revenue mix for the third quarter of 2013 consisted of 31% of our sales coming from Onsite Services as compared to 29% for Traditional Reprographics.
We deliver our services through a nationwide network of service centers, regionally-based technical specialists, locally-based sales executives, and a national/regional sales force known as Global Solutions.
Acquisition activity during the last three years has been minimal and did not materially affect our overall business.
We believe we offer a distinct portfolio of services within the AEC industry that include our legacy reprographics business as well as our newer offerings in Onsite Services, Color Services, and Digital Services. Our customer base for these services, however, is still primarily the AEC industry. Based on our analysis of our operating results, we estimate that sales to the AEC industry accounted for approximately 77% of our net sales for the nine months ended September 30, 2014 , with the remaining 23% consisting of sales to non-AEC industries.
We identify operating segments based on the various business activities that earn revenue and incur expense. Since our operating segments have similar products and services, classes of customers, production processes and economic characteristics, we are
19

deemed to operate as a single reportable segment. See Note 1 “Description of Business and Basis of Presentation” for further information.
Costs and Expenses
Our cost of sales consists primarily of materials (paper, toner and other consumables), labor, and “indirect costs” which consist primarily of expenses for service center ("offsite") facilities and equipment. Facilities and equipment expenses include maintenance, repairs, rents, insurance, and depreciation. Paper is the largest component of our material cost; however, paper pricing typically does not significantly affect our operating margins due, in part, to our efforts to pass increased costs on to our customers. We closely monitor material cost as a percentage of net sales to measure volume and waste. We also track labor utilization, or net sales per employee, to measure productivity and determine staffing levels.
We maintain low levels of inventory. Historically, our capital expenditure requirements have varied due to the cost and availability of capital lease lines of credit. During most of 2013, we were more frequently electing to purchase equipment for our facilities and onsite service installations rather than lease equipment due to the availability of cash to fund capital expenditures and the interest savings thereby. As we continue to foster our relationships with credit providers and obtain attractive lease rates, we are increasingly choosing to lease rather than purchase equipment.
Research and development costs consist mainly of the salaries, leased building space, and computer equipment that comprises our data storage and development centers in Fremont, California and Kolkata, India. Such costs are primarily recorded to cost of sales.
We believe customers are increasingly (1) adopting technology and digital document management practices, and (2) changing their workflow patterns and thereby their document and printing needs. While there were some indications that the non-residential construction market strengthened in 2012, we believe that there was a growing body of evidence by the third quarter of 2012 that demonstrated Traditional Reprographics sales would not likely recover at the same pace due to these factors. To ensure that the Company’s costs and resources were in line with demand for our current portfolio of services and products, management initiated a restructuring plan in October of 2012 that was completed by the fourth quarter of 2013. The restructuring plan included the closure or downsizing of 33 of the Company’s service centers in 2012, which represented more than 10% of our total number of service center locations, and an additional 23 service centers in 2013. In addition, as part of the restructuring plan, we reduced headcount and middle management associated with our service center locations, streamlined the senior operational management team, and allocated more resources into growing sales categories such as Onsite Services and Digital Services. The reduction in headcount totaled approximately 300 full-time employees, which represented approximately 10% of our total workforce.
In the nine months ended September 30 2014 , our gross margins improved by 160 basis points compared to the same period in 2013 .We attribute this improvement primarily to our restructuring efforts initiated in October 2012 and ongoing margin improvement programs, both of which suggest continuing, though abated, year-over-year margin expansion in future periods.
Non-GAAP Financial Measures
EBIT, EBITDA and related ratios presented in this report are supplemental measures of our performance that are not required by or presented in accordance with accounting principles generally accepted in the United States of America (“GAAP”). These measures are not measurements of our financial performance under GAAP and should not be considered as alternatives to net income, income from operations, or any other performance measures derived in accordance with GAAP or as an alternative to cash flows from operating, investing or financing activities as a measure of our liquidity.
EBIT represents net income before interest and taxes. EBITDA represents net income before interest, taxes, depreciation and amortization. EBIT margin is a non-GAAP measure calculated by dividing EBIT by net sales. EBITDA margin is a non-GAAP measure calculated by dividing EBITDA by net sales.
We present EBIT, EBITDA and related ratios because we consider them important supplemental measures of our performance and liquidity. We believe investors may also find these measures meaningful, given how our management makes use of them. The following is a discussion of our use of these measures.
We use EBIT and EBITDA to measure and compare the performance of our operating segments. Our operating segments’ financial performance includes all of the operating activities except debt and taxation which are managed at the corporate level for U.S. operating segments. As a result, we believe EBIT is the best measure of operating segment profitability and the most useful metric by which to measure and compare the performance of our operating segments. We also use EBIT to measure performance for determining operating segment-level compensation and we use EBITDA to measure performance for determining consolidated-level compensation. In addition, we use EBIT and EBITDA to evaluate potential acquisitions and potential capital expenditures.
20

EBIT, EBITDA and related ratios have limitations as analytical tools, and should not be considered in isolation, or as a substitute for analysis of our results as reported under GAAP. Some of these limitations are as follows:
Because of these limitations, EBIT, EBITDA, and related ratios should not be considered as measures of discretionary cash available to us to invest in business growth or to reduce our indebtedness. We compensate for these limitations by relying primarily on our GAAP results and using EBIT, EBITDA and related ratios only as supplements.
Our presentation of adjusted net income and adjusted EBITDA over certain periods is an attempt to provide meaningful comparisons to our historical performance for our existing and future investors. The unprecedented changes in our end markets over the past several years have required us to take measures that are unique in our history and specific to individual circumstances. Comparisons inclusive of these actions make normal financial and other performance patterns difficult to discern under a strict GAAP presentation. Each non-GAAP presentation, however, is explained in detail in the reconciliation tables below.
Specifically, we have presented adjusted net income attributable to ARC and adjusted earnings per share attributable to ARC shareholders for the three and nine months ended September 30, 2014 and 2013 to reflect the exclusion of loss on extinguishment of debt, restructuring expense, trade secret litigation costs, and changes in the valuation allowances related to certain deferred tax assets and other discrete tax items. This presentation facilitates a meaningful comparison of our operating results for the three and nine months ended September 30, 2014 and 2013 . We believe these charges were the result of the current macroeconomic environment, our capital restructuring, or other items which are not indicative of our actual operating performance.
We presented adjusted EBITDA in the three and nine months ended September 30, 2014 and 2013 to exclude loss on extinguishment of debt, trade secret litigation costs, stock-based compensation expense, and restructuring expense. The adjustment of EBITDA for non-cash adjustments is consistent with the definition of adjusted EBITDA in our credit agreement; therefore, we believe this information is useful to investors in assessing our financial performance.
21
• They do not reflect our cash expenditures, or future requirements for capital expenditures and contractual commitments;
• They do not reflect changes in, or cash requirements for, our working capital needs;
• They do not reflect the significant interest expense, or the cash requirements necessary, to service interest or principal payments on our debt;
• Although depreciation and amortization are non-cash charges, the assets being depreciated and amortized will often have to be replaced in the future, and EBITDA does not reflect any cash requirements for such replacements; and
• Other companies, including companies in our industry, may calculate these measures differently than we do, limiting their usefulness as comparative measures.

The following is a reconciliation of cash flows provided by operating activities to EBIT, EBITDA, and net income (loss) attributable to ARC Document Solutions, Inc. shareholders:
The following is a reconciliation of net income (loss) attributable to ARC Document Solutions, Inc. to EBIT, EBITDA and adjusted EBITDA:
22
Three Months Ended
September 30, Nine Months Ended
September 30,
(In thousands) 2014 2013 2014 2013
Cash flows provided by operating activities $ 15,311 $ 20,019 $ 37,049 $ 40,010 Changes in operating assets and liabilities, net of effect of business acquisitions (1,174 ) (9,575 ) 3,985 (7,017 )
Non-cash expenses, including depreciation, amortization and restructuring (10,517 ) (10,772 ) (31,496 ) (31,761 )
Income tax provision 659 790 1,930 1,946 Interest expense, net 3,780 5,895 11,637 18,012 Loss (income) attributable to the noncontrolling interest 41 (122 ) 64 (545 )
EBIT 8,100 6,235 23,169 20,645 Depreciation and amortization 8,536 8,669 25,561 26,090
EBITDA 16,636 14,904 48,730 46,735 Interest expense, net (3,780 ) (5,895 ) (11,637 ) (18,012 )
Income tax provision (659 ) (790 ) (1,930 ) (1,946 )
Depreciation and amortization (8,536 ) (8,669 ) (25,561 ) (26,090 )
Net income (loss) attributable to ARC Document Solutions, Inc. shareholders $ 3,661 $ (450 ) $ 9,602 $ 687
Three Months Ended
September 30, Nine Months Ended
September 30,
(In thousands) 2014 2013 2014 2013
Net income (loss) attributable to ARC Document Solutions, Inc. shareholders $ 3,661 $ (450 ) $ 9,602 $ 687
Interest expense, net 3,780 5,895 11,637 18,012 Income tax provision 659 790 1,930 1,946
EBIT 8,100 6,235 23,169 20,645 Depreciation and amortization 8,536 8,669 25,561 26,090
EBITDA 16,636 14,904 48,730 46,735 Loss on extinguishment of debt 347 262 347 262 Trade secret litigation costs (1) 306 — 2,787 — Restructuring expense 11 657 765 1,765 Stock-based compensation 956 728 2,618 2,049
Adjusted EBITDA $ 18,256 $ 16,551 $ 55,247 $ 50,811
(1) See “ Selling, General and Administrative Expenses ” in Management’s Discussion and Analysis of Financial Condition and Results of Operations for further information regarding trade secret litigation.

The following is a reconciliation of net income margin attributable to ARC to EBIT margin, EBITDA margin and adjusted EBITDA margin:
The following is a reconciliation of net income (loss) attributable to ARC Document Solutions, Inc. to unaudited adjusted net income attributable to ARC Document Solutions, Inc.:
23
Three Months Ended
September 30, Nine Months Ended
September 30,
2014 (1) 2013 (1) 2014 (1) 2013 (1)
Net income margin attributable to ARC 3.4 % (0.4 )% 3.0 % 0.2 %
Interest expense, net 3.5 5.8 3.7 5.9 Income tax provision 0.6 0.8 0.6 0.6
EBIT margin 7.6 6.2 7.3 6.7 Depreciation and amortization 8.0 8.6 8.1 8.5
EBITDA margin 15.6 14.7 15.4 15.3 Loss on extinguishment of debt 0.3 0.3 0.1 0.1 Trade secret litigation costs (2) 0.3 — 0.9 — Restructuring expense — 0.6 0.2 0.6 Stock-based compensation 0.9 0.7 0.8 0.7
Adjusted EBITDA margin 17.1 % 16.3 % 17.5 % 16.6 %
(1) Column does not foot due to rounding (2) See “ Selling, General and Administrative Expenses ” in Management’s Discussion and Analysis of Financial Condition and Results of
Operations for further information regarding trade secret litigation.
Three Months Ended
September 30, Nine Months Ended
September 30,
(In thousands, except per share amounts) 2014 2013 2014 2013
Net income (loss) attributable to ARC Document Solutions, Inc. $ 3,661 $ (450 ) $ 9,602 $ 687 Loss on extinguishment of debt 347 262 347 262 Restructuring expense 11 657 765 1,765 Trade secret litigation costs (1) 306 — 2,787 — Income tax benefit related to above items (258 ) (359 ) (1,519 ) (790 )
Deferred tax valuation allowance and other discrete tax items (1,172 ) 685 (2,798 ) 1,073 Unaudited adjusted net income attributable to ARC Document Solutions, Inc. $ 2,895 $ 795 $ 9,184 $ 2,997 Actual: Earnings (loss) per share attributable to ARC Document Solutions, Inc. shareholders:
Basic $ 0.08 $ (0.01 ) $ 0.21 $ 0.01 Diluted $ 0.08 $ (0.01 ) $ 0.20 $ 0.01
Weighted average common shares outstanding: Basic 46,338 45,976 46,195 45,880 Diluted 47,015 45,976 46,856 45,947
Adjusted: Earnings per share attributable to ARC Document Solutions, Inc. shareholders:
Basic $ 0.06 $ 0.02 $ 0.20 $ 0.07 Diluted $ 0.06 $ 0.02 $ 0.20 $ 0.07
Weighted average common shares outstanding: Basic 46,338 45,976 46,195 45,880 Diluted 47,015 46,487 46,856 45,947
(1) See “ Selling, General and Administrative Expenses ” in Management’s Discussion and Analysis of Financial Condition and Results of Operations for further information regarding trade secret litigation.

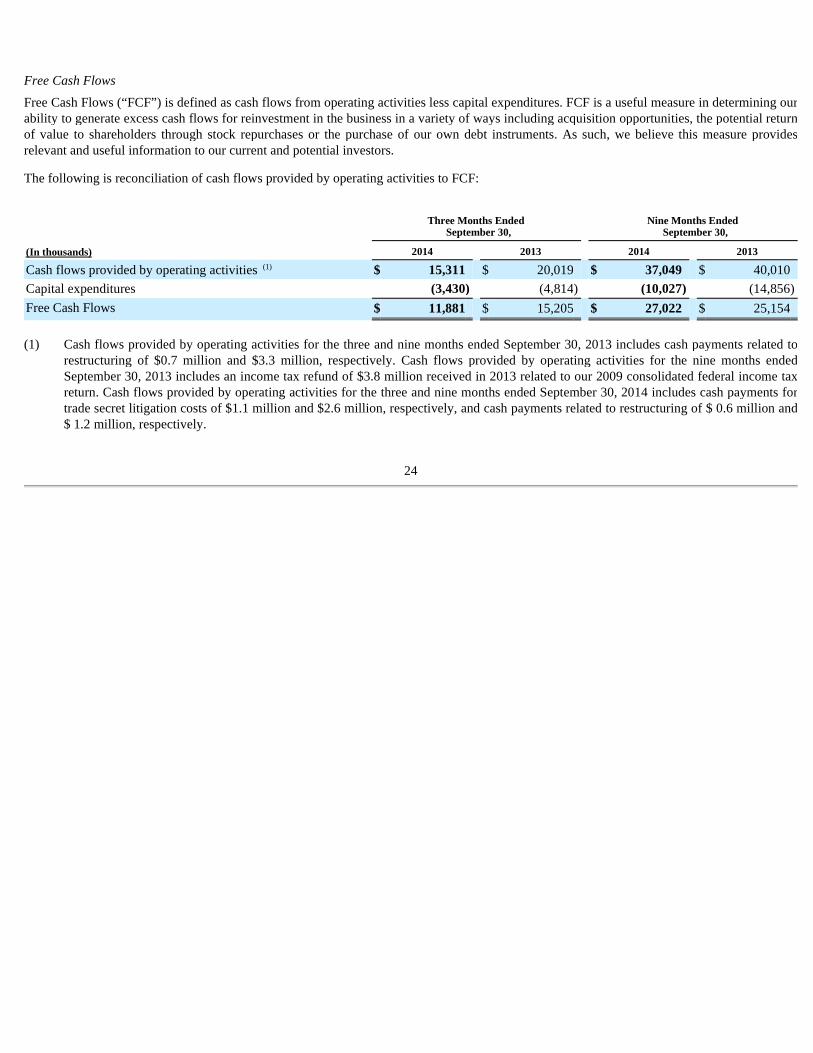
Free Cash Flows
Free Cash Flows (“FCF”) is defined as cash flows from operating activities less capital expenditures. FCF is a useful measure in determining our ability to generate excess cash flows for reinvestment in the business in a variety of ways including acquisition opportunities, the potential return of value to shareholders through stock repurchases or the purchase of our own debt instruments. As such, we believe this measure provides relevant and useful information to our current and potential investors.
The following is reconciliation of cash flows provided by operating activities to FCF:
24
Three Months Ended
September 30, Nine Months Ended
September 30,
(In thousands) 2014 2013 2014 2013
Cash flows provided by operating activities (1) $ 15,311 $ 20,019 $ 37,049 $ 40,010 Capital expenditures (3,430 ) (4,814 ) (10,027 ) (14,856 )
Free Cash Flows $ 11,881 $ 15,205 $ 27,022 $ 25,154
(1) Cash flows provided by operating activities for the three and nine months ended September 30, 2013 includes cash payments related to restructuring of $0.7 million and $3.3 million, respectively. Cash flows provided by operating activities for the nine months ended September 30, 2013 includes an income tax refund of $3.8 million received in 2013 related to our 2009 consolidated federal income tax return. Cash flows provided by operating activities for the three and nine months ended September 30, 2014 includes cash payments for trade secret litigation costs of $1.1 million and $2.6 million, respectively, and cash payments related to restructuring of $ 0.6 million and $ 1.2 million, respectively.

Results of Operations
25
Three Months Ended
September 30, Increase (decrease) Nine Months Ended
September 30, Increase (decrease)
(In millions, except percentages) 2014 (1) 2013 (1) $ % 2014 (1) 2013 $ %
Onsite services (2) $ 35.0 $ 31.0 $ 4.0 12.8 % $ 100.4 $ 90.5 $ 9.9 10.9 %
Traditional reprographics 28.2 28.9 (0.7 ) (2.5 )% 86.7 89.0 (2.3 ) (2.6 )%
Color 22.9 20.6 2.2 10.8 % 67.2 63.4 3.8 6.0 %
Digital 8.4 8.3 0.1 1.4 % 25.2 25.3 (0.1 ) (0.5 )%
Equipment and supplies sales 12.4 12.4 — (0.3 )% 36.6 37.7 (1.0 ) (2.8 )%
Total net sales $ 106.8 $ 101.3 $ 5.6 5.5 % $ 316.2 $ 305.9 $ 10.3 3.4 %
Gross profit $ 36.2 $ 32.9 $ 3.3 10.2 % $ 109.4 $ 100.9 $ 8.5 8.4 %
Selling, general and administrative expenses $ 26.3 $ 24.0 $ 2.3 9.6 % $ 80.7 $ 72.7 $ 8.0 11.1 %
Amortization of intangibles $ 1.5 $ 1.6 $ (0.1 ) (7.0 )% $ 4.5 $ 5.1 $ (0.6 ) (11.0 )%
Restructuring expense $ — $ 0.7 $ (0.6 ) (98.3 )% $ 0.8 $ 1.8 $ (1.0 ) (56.7 )%
Loss on extinguishment of debt $ 0.3 $ 0.3 $ 0.1 32.4 % $ 0.3 $ 0.3 $ — — %
Interest expense, net $ 3.8 $ 5.9 $ (2.1 ) (35.9 )% $ 11.6 $ 18.0 $ (6.4 ) (35.4 )%
Income tax provision $ 0.7 $ 0.8 $ (0.1 ) (16.6 )% $ 1.9 $ 1.9 $ — (0.8 )%
Net income (loss) attributable to ARC $ 3.7 $ (0.5 ) $ 4.1 (913.6 )% $ 9.6 $ 0.7 $ 8.9 1,297.7 %
Adjusted net income attributable to ARC $ 2.9 $ 0.8 $ 2.1 264.2 % $ 9.2 $ 3.0 $ 6.2 206.4 %
EBITDA $ 16.6 $ 14.9 $ 1.7 11.6 % $ 48.7 $ 46.7 $ 2.0 4.3 %
Adjusted EBITDA $ 18.3 $ 16.6 $ 1.7 10.3 % $ 55.2 $ 50.8 $ 4.4 8.7 %
(1) Column does not foot due to rounding (2) Represents services provided at our customers’ sites, which includes both Managed Print Services (MPS) and Facilities Management
(FM).

The following table provides information on the percentages of certain items of selected financial data as a percentage of net sales for the periods indicated:
Three and Nine Months Ended September 30, 2014 Compared to Three and Nine Months Ended September 30, 2013
Net Sales
Net sales for the three and nine months ended September 30, 2014 increase d by 5.5% and 3.4% , respectively, compared to the same periods in 2013 . The increase for the three and nine months ended September 30, 2014 was primarily due to higher sales activity for Onsite Services and Color Services, which was partially offset by lower sales activity in our Traditional Reprographics Services. The overall net sales for the nine months ended September 30, 2014 were also negatively affected by the inclement weather conditions through much of the United States during the first quarter of 2014. While actual service center closings due to weather were few, customer activity (both at our service centers as well as at customer locations) dropped considerably during the weeks when large parts of the country were affected by below freezing temperatures and heavy snows during the first quarter of 2014. We estimate related sales decreases for the period to be in the range of $1.0 million and $1.5 million. The decreases were experienced in all business lines, including Onsite Services, where entire office buildings were closed due to the inclement weather.
In the three and nine months ended September 30, 2014 , Onsite Services generated the largest percentage of net sales, and it produced the highest percentage change from the prior year at 12.8% and 10.9% , respectively. Declines in Traditional Reprographics sales remain influenced by lower project volume and the continuing trend of a greater use of digital processes for document workflow and less reliance on print.
Onsite Services . Year-over-year sales of Onsite Services increase d by $4.0 million , or 12.8% , and $9.9 million , or 10.9% , for the three and nine months ended September 30, 2014 , respectively. Revenues from Onsite Services sales represented 33% and 32% of total net sales for the three and nine months ended September 30, 2014 , respectively, compared to 31% and 30% for the three and nine months ended September 30, 2013 , respectively. Onsite Services revenue is derived from two sources: 1) an engagement with the customer to place primarily large-format equipment that we own or lease at a construction site or in our customers’ offices, typically referred to as a facilities management engagement or “traditional FM,” and 2) an arrangement by which our customers outsource their printing function to us, including all office printing, copying, and reprographics printing, typically referred to as managed print services, or “MPS.” In both cases we are paid a single cost per unit of material used, often referred to as a “click charge.”
26
As Percentage of Net Sales As Percentage of Net Sales
Three Months Ended September 30, Nine Months Ended September 30,
2014 2013 (1) 2014 (1) 2013 (1)
Net Sales 100.0 % 100.0 % 100.0 % 100.0 %
Cost of sales 66.1 67.5 65.4 67.0 Gross profit 33.9 32.5 34.6 33.0
Selling, general and administrative expenses 24.7 23.7 25.5 23.8 Amortization of intangibles 1.4 1.6 1.4 1.7 Restructuring expense — 0.6 0.2 0.6
Income from operations 7.8 6.5 7.4 7.0 Loss on extinguishment of debt 0.3 0.3 0.1 0.1 Interest expense, net 3.5 5.8 3.7 5.9
Income before income tax provision 4.0 0.5 3.6 1.0 Income tax provision 0.6 0.8 0.6 0.6
Net income (loss) 3.4 (0.3 ) 3.0 0.4 Loss (income) attributable to the noncontrolling interest — (0.1 ) — (0.2 )
Net income attributable to ARC 3.4 % (0.4 )% 3.0 % 0.2 %
EBITDA 15.6 % 14.7 % 15.4 % 15.3 %
Adjusted EBITDA 17.1 % 16.3 % 17.5 % 16.6 %
(1) Column does not foot due to rounding

The number of Onsite Services accounts has grown to approximately 8,330 as of September 30, 2014 , an increase of approximately 830 locations compared to September 30, 2013 , due primarily to growth in new MPS placements. We believe Onsite Services is a high growth area for us as demonstrated by the adoption of our MPS services by large, multi-national firms in the AEC space over the past several years. We intend to continue the expansion of our Onsite Service offering through our regional sales force and through Global Solutions, our national accounts group. Our Global Solutions sales force has established long-term contract relationships with approximately 20 of the largest 50 AEC firms. As our Onsite Services, and more specifically MPS services, become a larger percentage of our sales, our overall sales will be less exposed to the seasonality associated with construction projects. MPS services are driven primarily by the number of customer employees at an office and largely by non-construction project related work such as office printing and copying.
Traditional Reprographics . Year-over-year sales of Traditional Reprographics Services decrease d $0.7 million , or 2.5% , and $2.3 million , or 2.6% , during the three and nine months ended September 30, 2014 , respectively. Revenues from Traditional Reprographics represented 26% and 27% of total net sales for the three and nine months ended September 30, 2014 , respectively, as compared to 29% during the same periods in 2013 . Overall Traditional Reprographics Services sales nationwide were negatively affected by lower project volume, poor weather conditions over much of the US during the early part of the first quarter, as well as the lower volume of printed construction drawings due to the adoption of technology referenced above, and increased production of documents on customer sites as opposed to documents being produced at our service centers.
Color Services . Year-over-year sales of Color Services increase d $2.2 million or 10.8% and $3.8 million or 6.0% , for the three and nine months ended September 30, 2014 , respectively. The increase in sales from Color Services is primarily due to additional sales realized from the acquisition of two businesses in the United Kingdom during the second quarter of 2014. Also contributing to our color sales growth is our continued focus on the expansion and enhancement of our Color Services offerings through our Riot Creative Imaging brand and to our AEC industry customer base.
Digital Services . Year-over-year sales of Digital Services increase d by $0.1 million , or 1.4% , for the three months ended September 30, 2014 , and decrease d by $0.1 million , or 0.5% , for the nine months ended September 30, 2014 . Revenues from Digital Services sales remained consistent at 8% of total net sales for the three and nine months ended September 30, 2014 , as compared to the same period in 2013 . Year-over-year sales of Digital Services has remained relatively unchanged due to a decline in those services related to project-based work performed at our service centers, offset in part by sales of our AIM services which were introduced into the market in 2013. Currently, the revenue generating activities included in Digital Services consist of both construction project and non-construction project related services, but do not include revenues generated by Abacus, our onsite services technology, which is sold as part of our overall MPS offering.
Equipment and Supplies Sales . Year-over-year sales of Equipment and Supplies were flat for the three months ended September 30, 2014 , and decrease d by $1.0 million , or 2.8% , for the nine months ended September 30, 2014 . The decrease during the nine months ended September 30, 2014 was primarily due to a decline in equipment sales in our operations in China partially offset by increased equipment sales in the United States during the second and third quarters of 2014. Revenues from Equipment and Supplies Sales represented approximately 12% of total net sales for both the three and nine months ended September 30, 2014 , as well as for the same periods in 2013 . The decrease in Equipment and Supplies Sales in China was driven by a softening Chinese economy and a corresponding decrease in capital expenditures from several of our largest customers in China. Chinese operations had sales of equipment and supplies of $3.9 million and $12.3 million for the three and nine months ended September 30, 2014 , respectively, as compared to $4.6 million and $13.9 million for the three and nine months ended September 30, 2013 . To date, the Chinese market has shown a preference for owning print and imaging related equipment as opposed to using equipment through an onsite services arrangement. The growth of equipment sales in the United States in the second and third quarters of 2014 was driven by large equipment purchases from customers who prefer to own their own equipment. Quarterly movements in Equipment and Supplies Sales are largely driven by the timing of replacements of aging equipment fleets for customers who prefer to own their equipment. In the long term we do not anticipate growth in Equipment and Supplies Sales in the United States, as we are placing more focus on growth in our Onsite Services and converting sales contracts to Onsite Services agreements.
Gross Profit
During the three months ended September 30, 2014 , gross profit and gross margin increased to $36.2 million , and 33.9% , compared to $32.9 million , and 32.5% , during the same periods in 2013 , on a sales increase of $5.6 million .
During the nine months ended September 30, 2014 , gross profit and gross margin increased to $109.4 million , and 34.6% , compared to $100.9 million , and 33.0% , during the same periods in 2013 , on a sales increase of $10.3 million .
We were able to achieve expansion of our gross margins of 140 and 160 basis points for the three and nine months ended September 30, 2014 , respectively, due primarily to (1) increased sales, (2) margin expansion programs at our service centers and customer onsite locations, and (3) related initiatives that began with the Company's restructuring in 2012. Specifically, year-over-year overhead costs as a percentage of sales decreased by approximately 100 basis points for the three and nine months ended
27

September 30, 2014 , primarily due to savings from facility closures and related cost reductions in response to the declining sales in our service centers. We believe the savings from these efforts are sustainable, and we believe the effect of these measures coupled with leveraging our fixed costs in an environment of increasing sales should result in continued margin expansion in 2014, though at an abated level from both this quarter and 2013 levels.
A shift in our business mix also contributed to the year-over-year increase in gross margins for the three and nine months ended September 30, 2014 . Due to ongoing margin expansion initiatives and a decline in lower-margin equipment and supplies sales, material costs as a percentage of consolidated sales for the three and nine months ended September 30, 2014 were 30 and 70 basis points lower, respectively, as compared to the same periods in 2013 .
Selling, General and Administrative Expenses
Selling, marketing, general and administrative expenses increased $2.3 million and $8.0 million , during the three and nine months ended September 30, 2014 , respectively, compared to the same periods in 2013 .
Sales and marketing expenses increased $0.5 million and $2.5 million , for the three and nine months ended September 30, 2014 , respectively, driven by increased sales commissions resulting from an increase in sales year-over-year, as well as our continued investment in our sales team which included: (1) hiring of new sales and sales administrative personnel, and (2) expanded training of new and existing sales personnel to implement specific sales initiatives supporting our digital services, onsite, and color offerings.
General and administrative expenses for the three and nine months ended September 30, 2014 increased $1.8 million or 13.2% , and $5.5 million or 13.1% , compared to the same periods in 2013 , respectively. The rise in expenses was primarily due to legal fees related to trade secret litigation during 2014, as well as an increase in accrued incentive bonuses due to an improvement in the Company's financial performance in 2014. On February 1, 2013, we filed a civil complaint against a competitor and a former employee in the Superior Court of California for Orange County, which alleged, amongst other claims, the misappropriation of ARC trade secrets; namely, proprietary customer lists that were used to communicate with our customers in an attempt to unfairly acquire their business. In prior litigation with the competitor based on related facts, in 2007 the competitor entered into a settlement agreement and stipulated judgment, which included an injunction. We instituted this suit to stop the defendant from using similar unfair business practices against us in the Southern California market. The case proceeded to trial in May 2014, and a jury verdict was entered for the defendants. In August 2014, we filed a Notice of Appeal. Legal fees associated with the litigation totaled $0.3 million and $2.8 million for the three and nine months ended September 30, 2014, respectively.
Amortization of Intangibles
Amortization of intangibles of $1.5 million and $4.5 million for the three and nine months ended September 30, 2014 , decreased by $0.1 million or 7.0% , and $0.6 million or 11.0% , compared to the same periods in 2013 , primarily due to the complete amortization of certain customer relationships related to historical acquisitions.
Restructuring expense
Restructuring expenses for the nine months ended September 30, 2014 totaled $0.8 million , primarily consisting of revised estimated lease termination and obligation costs resulting from facilities closed in 2013.
For further information, please see Note 3 “Restructuring Expenses” to our Condensed Consolidated Financial Statements.
Loss on extinguishment of debt
As of September 30, 2014, we have paid $20.0 million in aggregate principal amount of our $200.0 million Term Loan Credit Agreement, which was $12.5 million more than the mandatory principal payments. The $12.5 million early pay down of the term loan resulted in a loss on extinguishment of debt of $0.3 million for the three and nine months ended September 30, 2014 .
Interest Expense, Net
Net interest expense was $3.8 million and $11.6 million during the three and nine months ended September 30, 2014 , respectively, compared to $5.9 million and $18.0 million , in the same periods in 2013 . The year-over-year decrease in interest expense for the three and nine months ended September 30, 2014 was primarily due to the purchase and redemption of all our outstanding 10.5% senior notes in 2013, and the replacement of the notes with a Term Loan Credit Agreement. By refinancing the 10.5% senior notes with the Term Loan Credit Agreement in December of 2013, we were able to reduce our effective interest rate on our long-term debt from 10.5% (or $21.0 million of interest per year on our then outstanding $200 million of principal) to 6.25% (or $12.5 million of interest per year on our then outstanding $200 million of principal).
28

Income Taxes
We recorded an income tax provision of $0.7 million and $1.9 million in relation to pretax income of $4.3 million and $11.5 million for the three and nine months ended September 30, 2014 , respectively.
For the three and nine months ended September 30, 2014 , our income tax provision was primarily due to the impact of amortization of tax basis goodwill in a deferred tax liability position. Our gross deferred tax assets remain available to us for use in future years until they fully expire. As of September 30, 2014 , we had approximately $91.0 million of consolidated federal and approximately $94.4 million of consolidated state net operating loss carryforwards available to offset future taxable income. The federal net operating loss carryforward will begin to expire in varying amounts between 2031 and 2033. The state net operating loss carryforwards expire in varying amounts between 2015 and 2033.
Noncontrolling Interest
Net income attributable to noncontrolling interest represents 35% of the income of UDS and its subsidiaries, which together comprise our Chinese joint-venture operations.
Net Income Attributable to ARC
Net income attributable to ARC was $3.7 million and $9.6 million , during the three and nine months ended September 30, 2014 , respectively, as compared to net (loss) income attributable to ARC of $(0.5) million and $0.7 million in the same periods in 2013 . The increase in net income attributable to ARC in 2014 versus prior year period is primarily due to the increase sales and gross margins and a reduction in interest expense in 2014 . This increase was partially offset by the increase in selling, general and administrative expenses, as noted above.
EBITDA
EBITDA margin increased to 15.6% and 15.4% for the three and nine months ended September 30, 2014 , respectively from 14.7% and 15.3% for the same periods of 2013 . Excluding the effect of stock-based compensation, loss on extinguishment of debt, legal fees associated with trade secret litigation, and restructuring expense, adjusted EBITDA margin increased to 17.1% and 17.5% during the three and nine months ended September 30, 2014 , as compared to 16.3% and 16.6% during the same periods in 2013 . The increase in adjusted EBITDA was due primarily to the increase in gross margins, as noted above.
Impact of Inflation
We believe inflation has not had a significant effect on our operations. Price increases for raw materials, such as paper and fuel charges, typically have been, and we expect will continue to be, passed on to customers in the ordinary course of business.
Liquidity and Capital Resources
Our principal sources of cash have been operations and borrowings under our debt and lease agreements. Our recent historical uses of cash have been for ongoing operations, payment of principal and interest on outstanding debt obligations, and capital expenditures. In December 2013, we entered into a $200.0 million Term Loan Credit Agreement, and the related proceeds were used to repurchase and redeem all of our remaining outstanding 10.5% senior unsecured notes. Total cash and cash equivalents as of September 30, 2014 was $24.8 million . Of this amount, $12.4 million was held in foreign countries, with $10.8 million held in China.
Supplemental information pertaining to our historical sources and uses of cash is presented as follows and should be read in conjunction with our interim Condensed Consolidated Statements of Cash Flows and notes thereto included elsewhere in this report.
Operating Activities
Cash flows from operations are primarily driven by sales and net profit generated from these sales, excluding non-cash charges.
29
Three Months Ended
September 30, Nine Months Ended
September 30,
(In thousands) 2014 2013 2014 2013
Net cash provided by operating activities $ 15,311 $ 20,019 $ 37,049 $ 40,010 Net cash used in investing activities $ (3,325 ) $ (4,731 ) $ (9,864 ) $ (14,234 )
Net cash used in financing activities $ (11,307 ) $ (10,763 ) $ (29,590 ) $ (17,059 )

The overall reduction in cash flows from operations during the three and nine months ended September 30, 2014 over the same periods in 2013 were primarily due to: an income tax refund of $3.8 million received in 2013 related to our 2009 consolidated federal income tax return; cash payments for trade secret litigation costs of $1.1 million and $2.6 million for the three and nine months ended September 30, 2014 , respectively; cash interest payments on borrowings under our Term Loan Credit Agreement which have interest due quarterly compared to our 10.5% senior unsecured notes outstanding in 2013 for which interest payments were due semi-annually; and an increase in accounts receivable driven by increasing sales as noted above. These reductions were partially offset by: the increase in our net income driven by our expansion of adjusted EBITDA as described above; a reduction in our interest expense resulting from the repurchases of our 10.5% senior unsecured notes in 2013; and cash payments related to our restructuring plan of $ 1.2 million for the nine months ended September 30, 2014 compared to $3.3 million for the same period in 2013. Days sales outstanding (“DSO”) increased to 54 days as of September 30, 2014 compared to 52 as of September 30, 2013 . We continue our focus on the timely collection of our accounts receivable.
Investing Activities
Net cash used in investing activities was primarily related to capital expenditures. We incurred capital expenditures totaling $10.0 million and $14.9 million for the nine months ended September 30, 2014 and 2013 , respectively. As we continue to foster our relationships with credit providers and obtain attractive lease rates, we increasingly choose to lease rather than purchase equipment to meet the demand driven by the growth in Onsite Services.
Financing Activities
Net cash of $29.6 million used in financing activities during the nine months ended September 30, 2014 primarily relates to payments on our debt agreements and capital leases. As of September 30, 2014, we have paid $20.0 million in aggregate principal amount of our $200.0 million Term Loan Credit Agreement, which was $12.5 million above our mandatory payment amount.
Our cash position, working capital, and debt obligations as of September 30, 2014 , and December 31, 2013 , are shown below and should be read in conjunction with our Condensed Consolidated Balance Sheets and notes thereto contained elsewhere in this report.
The increase of $10.5 million in working capital in 2014 was primarily due to an increase in accounts receivable of $ 7.7 million , and a decrease in the current portion of long-term debt and capital leases of $10.1 million . These variances were partially offset by an increase in accrued payroll and payroll-related expenses of $3.2 million and a decrease in cash of $ 2.5 million . The increase in accounts receivable was due primarily to the increase in sales of 5.5% during the third quarter of 2014, as compared to the same period in prior year. The decrease in the current portion of long-term debt and cash was primarily due to the $20.0 million principal payment towards our $200.0 million Term Loan Credit Agreement, of which $12.5 million was a prepayment towards the minimum required principal payments due for the next five quarters. The increase in accrued payroll and payroll-related expenses was due to the timing of payments and accrued incentive bonuses for 2014. To manage our working capital, we chiefly focus on our number of days sales outstanding and monitor the aging of our accounts receivable, as receivables are the most significant element of our working capital.
We believe that our current cash balance of $24.8 million , availability under our revolving credit facility, availability under our equipment lease lines, and additional cash flows provided by operations should be more than adequate to cover the next twelve months of working capital needs, debt service requirements consisting of scheduled principal and interest payments, and planned capital expenditures, to the extent such items are known or are reasonably determinable based on current business and market conditions. In addition, we may elect to finance certain of our capital expenditure requirements through borrowings under our senior secured revolving credit facility, which had no debt outstanding as of September 30, 2014 , other than contingent
30
(In thousands) September 30, 2014 December 31, 2013
Cash and cash equivalents $ 24,835 $ 27,362 Working capital $ 39,156 $ 28,705
Borrowings from term loan facility and senior secured credit facility (1) $ 176,865 $ 196,000 Other debt obligations 28,767 23,728 Total debt obligations $ 205,632 $ 219,728
(1) Net of original issue discount of $ 3,135 and $ 4,000 at September 30, 2014 and December 31, 2013 , respectively.

reimbursement obligations for undrawn standby letters of credit described below. See “Debt Obligations” section for further information related to our current credit facility.
We generate the majority of our revenue from sales of services and products to the AEC industry. As a result, our operating results and financial condition can be significantly affected by economic factors that influence the AEC industry, such as non-residential and residential construction spending. Additionally, a general economic downturn may adversely affect the ability of our customers and suppliers to obtain financing for significant operations and purchases, and to perform their obligations under their agreements with us. We believe that credit constraints in the financial markets could result in a decrease in, or cancellation of, existing business, could limit new business, and could negatively affect our ability to collect our accounts receivable on a timely basis.
While we have not been actively seeking growth through acquisition during the last three years, management continues to selectively evaluate potential acquisitions.
Debt Obligations
Term Loan Credit Agreement
On December 20, 2013, we entered into a Term Loan Credit Agreement (the “Term Loan Credit Agreement”) among ARC, as borrower, JPMorgan Chase Bank., N.A, as administrative agent and as collateral agent, and the lenders party thereto. The credit facility provided under the Term Loan Credit Agreement consists of an initial term loan facility of $200.0 million, the entirety of which was disbursed in order to pay for the purchase of our then outstanding 10.5% senior unsecured notes due 2016 (the "Notes") that were accepted under a cash tender offer and the subsequent redemption of the remaining outstanding Notes and to pay associated fees and expenses in connection with the cash tender offer and redemption. We have the right to request increases to the aggregate amount of term loans by an amount not to exceed $50.0 million in the aggregate. By refinancing the Notes with this Term Loan Credit Agreement, we were able to reduce the effective interest rate on our long-term debt from 10.5% (or $21.0 million of interest per year on $200.0 million of principal) to 6.25% (or $12.5 million of interest per year on $200.0 million of principal). In addition, it moved the principal portion of our long-term debt into a structure that is efficiently pre-payable without a premium. This allows us to use our cash flow to efficiently deliver value to our stockholders. The Term Loan Credit Agreement maturity date, with respect to the initial $200.0 million term loan, is December 2018. Under the Term Loan Credit Agreement, we are required to make regularly scheduled principal payments of $2.5 million each quarter, with all remaining unpaid principal due at maturity. The term loan extended under the Term Loan Credit Agreement can be maintained in different tranches consisting of Eurodollar loans or as base rate loans. It is expected that the term loan will be maintained in Eurodollars and therefore will bear interest, for any interest period, at a rate per annum equal to (i) the higher of (A) the LIBOR rate for U.S. dollar deposits for a period equal to the applicable interest period as determined by the administrative agent in accordance with the Term Loan Credit Agreement and (B) with respect to initial term loans only, 1.00%, plus (ii) an applicable margin of 5.25%. We pay certain recurring fees with respect to the credit facility, including administration fees to the administrative agent.
In accordance with the term loan facility agreement, we are required to maintain an Interest Expense Coverage Ratio (as defined in the Term Loan Credit Agreement) greater than or equal to 2.00:1.00 as of the end of each fiscal quarter. In addition, we are required to maintain a Total Leverage Ratio less than or equal to (i) 4.50:1.00 for any fiscal quarter ending through December 31, 2014; (ii) 4.25:1.00 for any fiscal quarter ending between March 31, 2015 and December 31, 2015; (iii) 4.00:1.00 for any fiscal quarter ending between March 31, 2016 and December 31, 2016; (iv) 3.75:1.00 for any fiscal quarter ending between March 31, 2017 and December 31, 2017; and (v) 3.50:1.00 for any fiscal quarter ending March 31, 2018 and thereafter. As of September 30, 2014 , our Interest Expense Coverage Ratio was 3.37:1.00, and our Total Leverage Ratio was 2.99:1.00. We were in compliance with the Term Loan Credit Agreement covenants as of September 30, 2014 .
Subject to certain exceptions, the term loan extended under the Term Loan Credit Agreement is subject to customary mandatory prepayments provisions with respect to: the net cash proceeds from certain asset sales; the net cash proceeds from certain issuances or incurrences of debt (other than debt permitted to be incurred under the terms of the Term Loan Credit Agreement); a portion (with stepdowns based upon the achievement of a financial covenant linked to the total leverage ratio) of annual excess cash flow of the Company and certain of its subsidiaries, and with such required prepayment amount to be reduced dollar-for-dollar by the amount of voluntary prepayments of term loans made with internally generated funds; and, the net cash proceeds in excess of a
31
certain amount from insurance recovery (other than business interruption insurance) and condemnation events of the Company and certain of its subsidiaries, subject to certain reinvestment rights. The Term Loan Credit Agreement contains customary representations and warranties, subject to limitations and exceptions, and customary covenants restricting our ability (subject to various exceptions) and certain of our subsidiaries' ability to: incur additional indebtedness (including guarantee obligations); incur liens; engage in mergers or other fundamental changes; sell certain property or assets; pay dividends of other distributions; consummate acquisitions; make investments, loans and advances; prepay certain indebtedness; change the nature of their business; engage in certain transactions with affiliates; and, incur restrictions on the ability of our subsidiaries to make distributions, advances and asset transfers. The Term Loan Credit Agreement contains customary events of default, including with respect to: nonpayment of principal, interest, fees or other amounts; material inaccuracy of a representation or warranty when made; failure to perform or observe covenants; cross-default to other material indebtedness; bankruptcy and insolvency events; inability to pay debts; monetary judgment defaults; actual or asserted invalidity or impairment of any definitive loan documentation; and a change of control.
Our obligations under the Term Loan Credit Agreement are guaranteed by each of our United States domestic subsidiaries. The Term Loan Credit Agreement and any interest rate protection and other hedging arrangements provided by any lender party to the Senior Secured Credit Facilities or any affiliate of such a lender are secured on a first priority basis by a perfected security interest in substantially all of our and each of our guarantor’s assets (subject to certain exceptions), except that such lien is second priority in the case of inventory, receivables and related assets that are subject to a first priority security interest under the 2012 Credit Agreement (as defined below).
2012 Credit Agreement
On January 27, 2012, we entered into a Credit Agreement (the “2012 Credit Agreement”). The 2012 Credit Agreement was amended on December 20, 2013 in connection with our entry into the Term Loan Credit Agreement for the principal purpose of making the 2012 Credit Agreement consistent with the Term Loan Credit Agreement. The 2012 Credit Agreement, as amended, provides revolving loans in an aggregate principal amount not to exceed $40.0 million, with a Canadian sublimit of $5.0 million, based on inventory and accounts receivable of our subsidiaries organized in the US (“United States Domestic Subsidiaries”) and Canada (“Canadian Domestic Subsidiaries”) that meet certain eligibility criteria. The 2012 Credit Agreement has a maturity date of January 27, 2017.
Amounts borrowed in US dollars under the 2012 Credit Agreement bear interest, in the case of LIBOR loans, at a per annum rate equal to LIBOR plus the LIBOR Rate Margin (as defined in the 2012 Credit Agreement), which may range from 1.75% to 2.25%, based on Average Daily Net Availability (as defined in the 2012 Credit Agreement). All other amounts borrowed in US dollars that are not LIBOR loans bear interest at a per annum rate equal to (i) the greatest of (A) the Federal Funds rate plus 0.5%, (B) the LIBOR rate (calculated based upon an interest period of three months and determined on a daily basis), plus 1.0% per annum, and (C) the rate of interest announced, from time to time, within Wells Fargo Bank, National Association at its principal office in San Francisco as its “prime rate,” plus (ii) the Base Rate Margin (as defined in the 2012 Credit Agreement), which may range from 0.75% to 1.25% percent, based on Average Daily Net Availability (as defined in the 2012 Credit Agreement). Amounts borrowed in Canadian dollars bear interest at a per annum rate equal to the Canadian Base Rate (as defined in the 2012 Credit Agreement) plus the LIBOR Rate Margin, which may range from 1.75% to 2.25%, based on Average Daily Net Availability.
The 2012 Credit Agreement contains various loan covenants that restrict our ability to take certain actions, including restrictions on incurrence of indebtedness, creation of liens, mergers or consolidations, dispositions of assets, repurchase or redemption of capital stock, making certain investments, entering into certain transactions with affiliates or changing the nature of our business. In addition, at any time when Excess Availability (as defined in the 2012 Credit Agreement) is less than $8.0 million we are required to maintain a Fixed Charge Coverage Ratio (as defined in the 2012 Credit Agreement) of at least 1.0. Our obligations under the 2012 Credit Agreement are secured by substantially all of the Company’s and its United States Domestic Subsidiaries’ assets. Our United States Domestic Subsidiaries have also guaranteed all of the Company’s obligations under the 2012 Credit Agreement. The obligations of the Company’s Canadian Domestics Subsidiaries which are borrowers under the 2012 Credit Agreement are secured by substantially all of the assets of the Company’s Canadian Domestic Subsidiaries.
As of and during the nine months ended September 30, 2014 , we did not have any outstanding debt under the 2012 Credit Agreement, other than contingent reimbursement obligations for undrawn standby letters of credit described below that were issued under the 2012 Credit Agreement.
As of September 30, 2014 , based on inventory and accounts receivable of our subsidiaries organized in the US and Canada, our borrowing availability under the 2012 Credit Agreement was $40.0 million ; however, outstanding standby letters of credit issued
32

under the 2012 Credit Agreement totaling $2.3 million further reduced our borrowing availability under the 2012 Credit Agreement to $37.7 million as of September 30, 2014 .
Foreign Credit Agreement
In the third quarter of 2013, UDS, ARC’s Chinese operations, entered into a revolving credit facility with a term of 18 months . The facility provides for a maximum credit amount of $20.0 million Chinese Yuan Renminbi, which translates to U.S. $3.2 million as of September 30, 2014 . Draws on the facility are limited to 30 day periods and incur a fee of 0.05% of the amount drawn and no additional interest is charged. As of September 30, 2014 , there was $1.0 million in outstanding debt drawn on our foreign credit facility.
Capital Leases
As of September 30, 2014 , we had $27.6 million of capital lease obligations outstanding, with a weighted average interest rate of 7.0% and maturities between 2014 and 2019.
Other Notes Payable
As of September 30, 2014 , we had $0.2 million of notes payable outstanding, with an interest rate of 6.5% and maturities through 2016. These notes include notes payable collateralized by equipment previously purchased and subordinated seller notes payable related to prior acquisitions.
Off-Balance Sheet Arrangements
As of September 30, 2014 , we did not have any off-balance-sheet arrangements as defined in Item 303(a)(4)(ii) of Regulation S-K.
Contractual Obligations and Other Commitments
Operating Leases. We have entered into various non-cancelable operating leases primarily related to facilities, equipment and vehicles used in the ordinary course of business.
Contingent Transaction Consideration. We have entered into earnout obligations in connection with prior acquisitions. If the acquired businesses generate sales and/or operating profits in excess of predetermined targets, we are obligated to make additional cash payments in accordance with the terms of such earnout obligations. As of September 30, 2014 , we have potential future earnout obligations for acquisitions consummated before the adoption of ASC 805, Business Combinations, of approximately $1.5 million through 2014 if predetermined financial targets are met or exceeded. Earnout payments prior to the adoption of ASC 805 are recorded as additional purchase price (as goodwill) when the contingent payments are earned and become payable. We do not believe payment of such earnouts to be probable. As of September 30, 2014 , we recorded liabilities related to future earnout payments consummated subsequent to the adoption of ASC 805 of $1.1 million . In accordance with ASC 805, changes to the liability are recognized in our consolidated statement of operations.
Legal Proceedings. On October 21, 2010, a former employee—individually and on behalf of a purported class consisting of all non-exempt employees who work or worked for American Reprographics Company, LLC and American Reprographics Company in the State of California at any time from October 21, 2006 through the present—filed an action against us in the Superior Court of California for the County of Orange. The complaint alleges, among other things, that the Company violated the California Labor Code by failing to (i) provide meal and rest periods, or compensation in lieu thereof, (ii) timely pay wages due at termination, and (iii) that those practices also violate the California Business and Professions Code. The relief sought includes damages, restitution, penalties, interest, costs, and attorneys’ fees and such other relief as the court deems proper. On March 15, 2013, we participated in a private mediation session with claimants’ counsel which did not result in resolution of the claim. Subsequent to the mediation session, the mediator issued a proposal that was accepted by both parties. We have received preliminary court approval of the settlement, and we await final court approval. We recorded a liability of $0.9 million as of September 30, 2014 related to the claim, which represents management's best estimate of the probable outcome based on information available. On February 1, 2013, we filed a civil complaint against a competitor and a former employee in the Superior Court of California for Orange County, which alleged, among other claims, the misappropriation of ARC trade secrets; namely, proprietary customer lists that were used to communicate with our customers in an attempt to unfairly acquire their business. In prior litigation with the competitor based on related facts, in 2007 the competitor entered into a settlement agreement and stipulated judgment, which included an injunction. We instituted this suit to stop the defendant from using similar unfair business practices against us in the Southern California market. The case proceeded to trial in May 2014, and a jury verdict was entered
33

for the defendants. In August 2014, we filed a Notice of Appeal. Legal fees associated with the litigation totaled $0.3 million and $2.8 million for the three and nine months ended September 30, 2014, respectively.
In addition to the matters described above, we are involved in various additional legal proceedings and other legal matters from time to time in the normal course of business. We do not believe that the outcome of any of these matters will have a material effect on our consolidated financial position, results of operations or cash flows.
Critical Accounting Policies Critical accounting policies are those accounting policies that we believe are important to the portrayal of our financial condition and results and require our most difficult, subjective or complex judgments, often as a result of the need to make estimates about the effect of matters that are inherently uncertain. Our 2013 Annual Report on Form 10-K includes a description of certain critical accounting policies, including those with respect to impairment of long-lived assets, goodwill, revenue recognition, income taxes, allowance for doubtful accounts, and stock-based compensation. There have been no material changes to our critical accounting policies described in our 2013 Annual Report on Form 10-K.
Goodwill Impairment
In connection with acquisitions, we apply the provisions of ASC 805, Business Combinations , using the acquisition method of accounting. The excess purchase price over the fair value of net tangible assets and identifiable intangible assets acquired is recorded as goodwill.
In accordance with ASC 350, Intangibles – Goodwill and Other , we assess goodwill for impairment annually as of September 30, and more frequently if events and circumstances indicate that goodwill might be impaired. At September 30, 2014, we performed our assessment and determined that goodwill was not impaired.
Goodwill impairment testing is performed at the reporting unit level. Goodwill is assigned to reporting units at the date the goodwill is initially recorded. Once goodwill has been assigned to reporting units, it no longer retains its association with a particular acquisition, and all of the activities within a reporting unit, whether acquired or internally generated, are available to support the value of the goodwill. The continued decline in the number of reporting units reflects our ongoing efforts to centralize management of our operations. During the third quarter of 2014, in connection with an operationally focused reorganization of our business into a regional format, we realigned our management and reporting structure. The reorganization was implemented to (1) better align our operations and sales territories to that of our customers, (2) quickly respond to the evolving needs of companies operating in the AEC industry, our primary market, (3) eliminate redundant business practices, and (4) realize operational economies of scale by combining operational staff, sales staff, back-office functions and streamlining our management structure. The reorganization resulted in a decrease in the number of reporting units identified for purposes of evaluating goodwill for impairment from 25 as of September 30, 2013 to 12 as of September 30, 2014. In summary, the reduction in the number of reporting units identified for purposes of evaluating goodwill for impairment reflects our ongoing efforts to further integrate and centralize management of our operations in response to the evolving needs of our customers and to realize efficiencies.
Goodwill impairment testing is a two-step process. Step one involves comparing the fair value of our reporting units to their carrying amount. If the carrying amount of a reporting unit is greater than zero and its fair value is greater than its carrying amount, there is no impairment. If the reporting unit’s carrying amount is greater than the fair value, the second step must be completed to measure the amount of impairment, if any. Step two involves calculating the implied fair value of goodwill by deducting the fair value of all tangible and intangible assets, excluding goodwill, of the reporting unit from the fair value of the reporting unit as determined in step one. The implied fair value of goodwill determined in this step is compared to the carrying value of goodwill. If the implied fair value of goodwill is less than the carrying value of goodwill, an impairment loss is recognized equal to the difference.
We determine the fair value of our reporting units using an income approach. Under the income approach, we determined fair value based on estimated discounted future cash flows of each reporting unit. Determining the fair value of a reporting unit is judgmental in nature and requires the use of significant estimates and assumptions, including revenue growth rates and EBITDA margins, discount rates and future market conditions, among others.
Our projections are driven, in part, by industry data gathered from third parties, including projected growth rates of the AEC industry by segment (i.e., residential and non-residential) and anticipated GDP growth rates, as well as company-specific data such as estimated composition of our customer base (i.e. non-AEC vs. AEC, residential vs. non- residential), historical revenue trends, and EBITDA margin performance of our reporting units. Our revenue projections for each of ARC’s reporting units include the estimated respective customer composition for each reporting unit, year-to-date revenue at the time of the goodwill impairment
34

analysis, and projected growth rates for the related customer types. Although we rely on a variety of internal and external sources in projecting revenue, our relative reliance on each source or trend changes from year to year. In 2012 and into 2013, we noted a continued divergence between our historic revenue growth rates and AEC non-residential construction growth rates, as well as the “dilution” of traditional reprographics as the Company’s dominant business line. Therefore, we increased our reliance upon internal sources for our short-term and long-term revenue forecasts. Once the forecasted revenue was established for each of the reporting units based on the process noted above, using the current year EBITDA margin as a base line, we forecasted future EBITDA margins. In general, our EBITDA margins are significantly affected by (1) revenue trends and (2) cost management initiatives. Revenue trends impact our EBITDA margins because a significant portion of our cost of sales are considered relatively fixed therefore an increase in forecasted revenue (particularly when combined with any cost management or productivity enhancement initiatives) would result in meaningful gross margin expansion. Similarly, a significant portion of our selling, general, and administrative expenses are considered fixed. Hence, in forecasting EBITDA margins, significant reliance was placed on the historical impact of revenue trends on EBITDA margin.
The estimated fair value of our reporting units were based upon their respective projected EBITDA margin, which was anticipated to increase between 0 and 200 basis points from 2014 to 2015, followed by year-over-year increases of approximately 100 to 200 basis points in 2016 through 2018, with stabilization expected in 2017. These cash flows were discounted using a weighted average cost of capital ranging from 11% to 13%, depending upon the size and risk profile of the reporting unit. We considered market information in assessing the reasonableness of the fair value under the income approach described above. The results of step one of the goodwill impairment test, as of September 30, 2014, were as follows:
Based upon a sensitivity analysis, a reduction of approximately 50 basis points of projected EBITDA in 2014 and beyond, assuming all other assumptions remain constant, would result in no reporting unit proceeding to step two of the analysis.
Based upon a separate sensitivity analysis, a 50 basis point increase to the weighted average cost of capital would result in no reporting unit proceeding to step two of the analysis.
Given the current economic environment and the changing document and printing needs of our customers and the uncertainties regarding the effect on our business, there can be no assurance that the estimates and assumptions made for purposes of our goodwill impairment testing in 2014 will prove to be accurate predictions of the future. If our assumptions, including forecasted EBITDA of certain reporting units, are not achieved, we may be required to record additional goodwill impairment charges in future periods, whether in connection with our next annual impairment testing in the third quarter of 2014, or on an interim basis, if any such change constitutes a triggering event (as defined under ASC 350, Intangibles – Goodwill and Other ) outside of the quarter when we regularly perform our annual goodwill impairment test. It is not possible at this time to determine if any such future impairment charge would result or, if it does, whether such charge would be material.
Income Taxes
Deferred tax assets and liabilities reflect temporary differences between the amount of assets and liabilities for financial and tax reporting purposes. Such amounts are adjusted, as appropriate, to reflect changes in tax rates expected to be in effect when the temporary differences reverse. A valuation allowance is recorded to reduce our deferred tax assets to the amount that is more likely than not to be realized. Changes in tax laws or accounting standards and methods may affect recorded deferred taxes in future periods.
When establishing a valuation allowance, we consider future sources of taxable income such as future reversals of existing taxable temporary differences, future taxable income exclusive of reversing temporary differences and carryforwards and tax planning strategies. A tax planning strategy is an action that: is prudent and feasible; an enterprise ordinarily might not take, but would take to prevent an operating loss or tax credit carryforward from expiring unused; and would result in realization of deferred tax assets. In the event we determine the deferred tax assets, more likely than not, will not be realized in the future, the valuation adjustment to the deferred tax assets will be charged to earnings in the period in which we make such a determination.
35
(Dollars in thousands)
Number of Reporting
Units Representing Goodwill of
No goodwill balance 6 $ — Reporting units failing step one that continue to carry a goodwill balance — — Fair value of reporting unit exceeds its carrying value by 25%—30% 1 7,285 Fair value of reporting unit exceeds its carrying value by more than 75% 5 205,323 12 $ 212,608
As of June 30, 2011, we determined that cumulative losses for the preceding twelve quarters constituted sufficient objective evidence (as defined by ASC 740-10, Income Taxes ) that a valuation allowance was needed. As of September 30, 2014 , the valuation allowance against certain deferred tax assets was $80.9 million .
In future quarters we will continue to evaluate our historical results for the preceding twelve quarters and our future projections to determine whether we will generate sufficient taxable income to utilize our deferred tax assets, and whether a partial or full valuation allowance is still required. Should we generate sufficient taxable income, however, we may reverse a portion or all of the then current valuation allowance.
We calculate our current and deferred tax provision based on estimates and assumptions that could differ from the actual results reflected in income tax returns filed in subsequent years. Adjustments based on filed returns are recorded when identified.
Income taxes have not been provided on certain undistributed earnings of foreign subsidiaries because such earnings are considered to be permanently reinvested.
The amount of taxable income or loss we report to the various tax jurisdictions is subject to ongoing audits by federal, state and foreign tax authorities. Our estimate of the potential outcome of any uncertain tax issue is subject to management’s assessment of relevant risks, facts, and circumstances existing at that time. We use a more-likely-than-not threshold for financial statement recognition and measurement of tax positions taken or expected to be taken in a tax return. We record a liability for the difference between the benefit recognized and measured and tax position taken or expected to be taken on our tax return. To the extent that our assessment of such tax positions changes, the change in estimate is recorded in the period in which the determination is made. We report tax-related interest and penalties as a component of income tax expense.
For further information regarding the accounting policies that we believe to be critical accounting policies and that affect our more significant judgments and estimates used in preparing our interim Condensed Consolidated Financial Statements see our 2013 Annual Report on Form 10-K.
Recent Accounting Pronouncements
See Note 1, “Description of Business and Basis of Presentation” to our interim Condensed Consolidated Financial Statements for disclosure on recent accounting pronouncements.
Item 3. Quantitative and Qualitative Disclosures About Market Risk
Our primary exposure to market risk is interest rate risk associated with our debt instruments. We use both fixed and variable rate debt as sources of financing. In 2013, we entered into a $200.0 million Term Loan Credit Agreement. Borrowings under the Term Loan Credit Agreement bear interest at a rate equal to an applicable margin plus a variable rate (subject to a fixed floor of 1.00%). As such, our Term Loan Credit Agreement exposes us to market risk for changes in interest rates.
As of September 30, 2014 , we had $205.6 million of total debt, net of discount, and capital lease obligations, of which approximately 14% was at a fixed rate, with the remainder at variable rates. Given our debt position at September 30, 2014 and the 1.00% LIBOR floor on our Term Loan Credit Agreement, the effect of a 100 basis point increase in LIBOR on our interest expense would be approximately $0.3 million annually.
As of September 30, 2014 , we were not party to any derivative or hedging transactions; however, we have entered into derivative instruments in the past to manage our exposure to changes in interest rates. These instruments allowed us to raise funds at floating rates and effectively swap them into fixed rates, without the exchange of the underlying principal amount. We have not, and do not plan to, enter into any derivative financial instruments for trading or speculative purposes.
Although we have international operating entities, our exposure to foreign currency rate fluctuations is not significant to our financial condition or results of operations.
Item 4. Controls and Procedures
Disclosure Controls and Procedures
We maintain disclosure controls and procedures that are designed to ensure that information required to be disclosed in our reports under the Securities Exchange Act of 1934 are recorded, processed, summarized, and reported within the time periods specified in the Securities and Exchange Commission’s rules and forms, and that such information is accumulated and communicated to our management, including our Chief Executive Officer and our Chief Financial Officer, as appropriate, to allow timely decisions regarding required disclosures.
36

Under the supervision and with the participation of our management, including our Chief Executive Officer and Chief Financial Officer, we conducted an evaluation of the effectiveness of our disclosure controls and procedures (as defined in Rule 13a-15(e) and 15d-15(e) under the Securities Exchange Act of 1934) as of September 30, 2014 . Based on that evaluation, our Chief Executive Officer and our Chief Financial Officer concluded that as of September 30, 2014 , our disclosure controls and procedures were effective.
Changes in Internal Control over Financial Reporting
There were no changes to internal control over financial reporting during the three months ended September 30, 2014 , that have materially affected, or are reasonably likely to materially affect, our internal control over financial reporting.
37

PART II—OTHER INFORMATION
Item 1. Legal Proceedings
This information is included under the caption “Legal Proceedings” in Note 7 to our Condensed Consolidated Financial Statements in Part 1, Item 1 of this Quarterly Report on Form 10-Q.
Item 1A. Risk Factors
Information concerning certain risks and uncertainties appears in Part I, Item 1A “Risk Factors” of our Annual Report on Form 10-K for the fiscal year ended December 31, 2013 . You should carefully consider those risks and uncertainties, which could materially affect our business, financial condition and results of operations. There have been no material changes to the risk factors disclosed in our Annual Report on Form 10-K for the year ended December 31, 2013 .
38

Item 6. Exhibits
39
Exhibit Number Description
31.1
Certification of Principal Executive Officer pursuant to Rule 13a-14(a) and Rule 15d-14(a) under the Securities Exchange Act of 1934, as adopted pursuant to Section 302 of the Sarbanes-Oxley Act of 2002.*
31.2
Certification of Principal Financial Officer pursuant to Rule 13a-14(a) and Rule 15d-14(a) under the Securities Exchange Act of 1934, as adopted pursuant to Section 302 of the Sarbanes-Oxley Act of 2002.*
32.1
Certification of Chief Executive Officer pursuant to 18 U.S.C. Section 1350, as adopted pursuant to Section 906 of the Sarbanes-Oxley Act of 2002.*
32.2
Certification of Chief Financial Officer pursuant to 18 U.S.C. Section 1350, as adopted pursuant to Section 906 of the Sarbanes-Oxley Act of 2002.*
101.INS XBRL Instance Document *
101.SCH XBRL Taxonomy Extension Schema *
101.CAL XBRL Taxonomy Extension Calculation Linkbase *
101.DEF XBRL Taxonomy Extension Definition Linkbase *
101.LAB XBRL Taxonomy Extension Label Linkbase *
101.PRE XBRL Taxonomy Extension Presentation Linkbase *
* Filed herewith

SIGNATURES
Pursuant to the requirements of the Securities Exchange Act of 1934, the registrant has duly caused this report to be signed on its behalf by the undersigned thereunto duly authorized.
Date: November 7, 2014
40
ARC DOCUMENT SOLUTIONS, INC.
/s/ KUMARAKULASINGAM SURIYAKUMAR
Kumarakulasingam Suriyakumar
Chairman, President and Chief Executive Officer
/s/ JOHN E.D. TOTH
John E.D. Toth
Chief Financial Officer
EXHIBIT INDEX
41
Exhibit Number Description
31.1
Certification of Principal Executive Officer pursuant to Rule 13a-14(a) and Rule 15d-14(a) under the Securities Exchange Act of 1934, as adopted pursuant to Section 302 of the Sarbanes-Oxley Act of 2002.*
31.2
Certification of Principal Financial Officer pursuant to Rule 13a-14(a) and Rule 15d-14(a) under the Securities Exchange Act of 1934, as adopted pursuant to Section 302 of the Sarbanes-Oxley Act of 2002.*
32.1
Certification of Chief Executive Officer pursuant to 18 U.S.C. Section 1350, as adopted pursuant to Section 906 of the Sarbanes-Oxley Act of 2002.*
32.2
Certification of Chief Financial Officer pursuant to 18 U.S.C. Section 1350, as adopted pursuant to Section 906 of the Sarbanes-Oxley Act of 2002.*
101.INS XBRL Instance Document *
101.SCH XBRL Taxonomy Extension Schema *
101.CAL XBRL Taxonomy Extension Calculation Linkbase *
101.DEF XBRL Taxonomy Extension Definition Linkbase *
101.LAB XBRL Taxonomy Extension Label Linkbase *
101.PRE XBRL Taxonomy Extension Presentation Linkbase *
* Filed herewith

Exhibit 31.1 CERTIFICATION OF PRINCIPAL EXECUTIVE OFFICER
PURSUANT TO RULE 13A-14(A) AND RULE 15D-14(A) OF THE SECURITIES EXCHANGE ACT OF 1934,
AS ADOPTED PURSUANT TO SECTION 302 OF THE SARBANES-OXLEY ACT OF 2002
I, Kumarakulasingam Suriyakumar, certify that:
Date: November 7, 2014
1. I have reviewed this quarterly report on Form 10-Q of ARC Document Solutions, Inc.;
2. Based on my knowledge, this report does not contain any untrue statement of a material fact or omit to state a material fact necessary to make the statements made, in light of the circumstances under which such statements were made, not misleading with respect to the period covered by this report;
3. Based on my knowledge, the financial statements, and other financial information included in this report, fairly present in all material respects the financial condition, results of operations and cash flows of the registrant as of, and for, the periods presented in this report;
4. The registrant’s other certifying officer(s) and I are responsible for establishing and maintaining disclosure controls and procedures (as defined in Exchange Act Rules 13a-15(e) and 15d-15(e)) and internal control over financial reporting (as defined in Exchange Act Rules 13a-15(f) and 15d-15(f)) for the registrant and have:
a) Designed such disclosure controls and procedures or caused such disclosure controls and procedures to be designed under our supervision, to ensure that material information relating to the registrant, including its consolidated subsidiaries, is made known to us by others within those entities, particularly during the period in which this report is being prepared;
b) Designed such internal control over financial reporting, or caused such internal control over financial reporting to be designed under our supervision, to provide reasonable assurance regarding the reliability of financial reporting and the preparation of financial statements for external purposes in accordance with generally accepted accounting principles;
c) Evaluated the effectiveness of the registrant’s disclosure controls and procedures and presented in this report our conclusions about the effectiveness of the disclosure controls and procedures, as of the end of the period covered by this report based on such evaluation; and
d) Disclosed in this report any change in the registrant’s internal control over financial reporting that occurred during the registrant’s most recent fiscal quarter (the registrant’s fourth fiscal quarter in the case of an annual report) that has materially affected, or is reasonably likely to materially affect, the registrant’s internal control over financial reporting; and
5. The registrant’s other certifying officer(s) and I have disclosed, based on our most recent evaluation of internal control over financial reporting, to the registrant’s auditors and the audit committee of the registrant’s board of directors (or persons performing the equivalent functions):
a) All significant deficiencies and material weaknesses in the design or operation of internal control over financial reporting which are reasonably likely to adversely affect the registrant’s ability to record, process, summarize and report financial information; and
b) Any fraud, whether or not material, that involves management or other employees who have a significant role in the registrant's internal controls over financial reporting.
/s/ KUMARAKULASINGAM SURIYAKUMAR
Kumarakulasingam Suriyakumar
Chairman, President and Chief Executive Officer (Principal Executive Officer)

Exhibit 31.2 CERTIFICATION OF PRINCIPAL EXECUTIVE OFFICER
PURSUANT TO RULE 13A-14(A) AND RULE 15D-14(A) OF THE SECURITIES EXCHANGE ACT OF 1934,
AS ADOPTED PURSUANT TO SECTION 302 OF THE SARBANES-OXLEY ACT OF 2002
I, John E.D. Toth, certify that:
Date: November 7, 2014
1. I have reviewed this quarterly report on Form 10-Q of ARC Document Solutions, Inc.;
2. Based on my knowledge, this report does not contain any untrue statement of a material fact or omit to state a material fact necessary to make the statements made, in light of the circumstances under which such statements were made, not misleading with respect to the period covered by this report;
3. Based on my knowledge, the financial statements, and other financial information included in this report, fairly present in all material respects the financial condition, results of operations and cash flows of the registrant as of, and for, the periods presented in this report;
4. The registrant’s other certifying officer(s) and I are responsible for establishing and maintaining disclosure controls and procedures (as defined in Exchange Act Rules 13a-15(e) and 15d-15(e)) and internal control over financial reporting (as defined in Exchange Act Rules 13a-15(f) and 15d-15(f)) for the registrant and have:
a) Designed such disclosure controls and procedures or caused such disclosure controls and procedures to be designed under our supervision, to ensure that material information relating to the registrant, including its consolidated subsidiaries, is made known to us by others within those entities, particularly during the period in which this report is being prepared;
b) Designed such internal control over financial reporting, or caused such internal control over financial reporting to be designed under our supervision, to provide reasonable assurance regarding the reliability of financial reporting and the preparation of financial statements for external purposes in accordance with generally accepted accounting principles;
c) Evaluated the effectiveness of the registrant’s disclosure controls and procedures and presented in this report our conclusions about the effectiveness of the disclosure controls and procedures, as of the end of the period covered by this report based on such evaluation; and
d) Disclosed in this report any change in the registrant’s internal control over financial reporting that occurred during the registrant’s most recent fiscal quarter (the registrant’s fourth fiscal quarter in the case of an annual report) that has materially affected, or is reasonably likely to materially affect, the registrant’s internal control over financial reporting; and
5. The registrant’s other certifying officer(s) and I have disclosed, based on our most recent evaluation of internal control over financial reporting, to the registrant’s auditors and the audit committee of the registrant’s board of directors (or persons performing the equivalent functions):
a) All significant deficiencies and material weaknesses in the design or operation of internal control over financial reporting which are reasonably likely to adversely affect the registrant’s ability to record, process, summarize and report financial information; and
b) Any fraud, whether or not material, that involves management or other employees who have a significant role in the registrant's internal controls over financial reporting.
/s/ JOHN E.D. TOTH
John E.D. Toth
Chief Financial Officer (Principal Financial Officer)

Exhibit 32.1 CERTIFICATION
PURSUANT TO 18 U.S.C. SECTION 1350, AS ADOPTED PURSUANT TO
SECTION 906 OF THE SARBANES-OXLEY ACT OF 2002 I, Kumarakulasingam Suriyakumar, certify, pursuant to 18 U.S.C. Section 1350, as adopted pursuant to Section 906 of the Sarbanes-Oxley Act of 2002, that the Quarterly Report of ARC Document Solutions, Inc. (the “Company”) on Form 10-Q for the period ended September 30, 2014 fully complies with the requirements of Section 13(a) or 15(d) of the Securities Exchange Act of 1934 and that the information contained in such report fairly presents in all material respects the financial condition and results of operations of the Company. Date: November 7, 2014
/s/ KUMARAKULASINGAM SURIYAKUMAR
Kumarakulasingam Suriyakumar
Chairman, President and Chief Executive Officer (Principal Executive Officer)
Exhibit 32.2 CERTIFICATION
PURSUANT TO 18 U.S.C. SECTION 1350, AS ADOPTED PURSUANT TO
SECTION 906 OF THE SARBANES-OXLEY ACT OF 2002 I, John E.D. Toth, certify, pursuant to 18 U.S.C. Section 1350, as adopted pursuant to Section 906 of the Sarbanes-Oxley Act of 2002, that the Quarterly Report of ARC Document Solutions, Inc. (the “Company”) on Form 10-Q for the period ended September 30, 2014 fully complies with the requirements of Section 13(a) or 15(d) of the Securities Exchange Act of 1934 and that the information contained in such report fairly presents, in all material respects, the financial condition and results of operations of the Company. Date: November 7, 2014
/s/ JOHN E.D. TOTH
John E.D. Toth
Chief Financial Officer (Principal Financial Officer)


![[XLS] · Web view647 213 4574 1014 388 2126 706 1530 275 1744 540 629 210 3300 784 347 2032 596 1326 262 0.54463130659767145 421 773 0.44067796610169491 104 236 1363 509 607 22.443609022556391](https://static.fdocuments.us/doc/165x107/5ac218677f8b9a5a4e8de555/xls-view647-213-4574-1014-388-2126-706-1530-275-1744-540-629-210-3300-784-347.jpg)