
Arbuckle-Simpson Hydrology Study INTRODUCTION The Arbuckle-Simpson Hydrology Study (Study) is a...
51
i
Transcript of Arbuckle-Simpson Hydrology Study INTRODUCTION The Arbuckle-Simpson Hydrology Study (Study) is a...

i

Arbuckle-Simpson Hydrology Study 2007 Annual Report Oklahoma Water Resources Board
In Cooperation With: U.S. Bureau of Reclamation U.S. Geological Survey U.S. Environmental Protection Agency Oklahoma State University University of Oklahoma Oklahoma Climatological Survey Oklahoma Geological Survey Chickasaw and Choctaw Nations The Nature Conservancy Hydrosphere Resource Consultants Report prepared by Noel Osborn, Arbuckle-Simpson Hydrology Study Coordinator February 2008
ii

CONTENTS Contents .......................................................................................................................................... ii Introduction..................................................................................................................................... 1
Background................................................................................................................................. 2 Study overview ............................................................................................................................... 2
Purpose and Objectives............................................................................................................... 2 Study Area .................................................................................................................................. 3 Hydrogeologic Setting ................................................................................................................ 4 Scope and Approach ................................................................................................................... 6 Participants.................................................................................................................................. 6
2007 Activities and accomplishments ............................................................................................ 7 Public Involvement ..................................................................................................................... 7 Monitoring .................................................................................................................................. 8 Research.................................................................................................................................... 15
Problems ....................................................................................................................................... 15 Anschutz Seismic Data ............................................................................................................. 15 Modeling Efforts....................................................................................................................... 16
Plans.............................................................................................................................................. 16 Project Funding............................................................................................................................. 17 Published Reports ......................................................................................................................... 17 Appendix A: Research Summaries ............................................................................................... 19
Geochemical Investigation........................................................................................................ 21 Ground-Water Flow Modeling ................................................................................................. 27 Groundwater Hydrology of the Arbuckle-Simpson Aquifer .................................................... 30 Instream Flow Assessment of Streams Draining the Arbuckle-Simpson Aquifer: Instream Flow Modeling.......................................................................................................................... 33 Application of Indicators of Hydrologic Alteration Software to Characterization of Environmental Flows in Selected Streams Underlain by the Arbuckle-Simpson Aquifer....... 35 Modeling Surface Water Rights................................................................................................ 37 Stream Hydrology and Water Balance of the Arbuckle-Simpson Aquifer............................... 38 Geologic Framework of the Arbuckle-Simpson Aquifer.......................................................... 39 Preliminary results of airborne and ground resistivity surveys for subsurface mapping in the Hunton anticline, south-central Oklahoma ............................................................................... 40 Gravity and magnetic characterization of faults in the Hunton anticline of the Arbuckle uplift, south-central Oklahoma ............................................................................................................ 42 3-D Seismic Survey at Spears Ranch........................................................................................ 43 Three-dimensional geohydrologic modeling of the Hunton anticline, Arbuckle Mountains, south-central Oklahoma ............................................................................................................ 44 Characterization of water-producing zones in the Arbuckle-Simpson aquifer......................... 45 Hydroclimatic Reconstruction of the Arbuckle-Simpson Aquifer using Tree Rings ............... 47
ii

1
INTRODUCTION
The Arbuckle-Simpson Hydrology Study (Study) is a five-year, comprehensive investigation of the Arbuckle-Simpson aquifer and associated springs and streams in south-central Oklahoma. A multidisciplinary team of researchers from various agencies and universities is employing several methods to obtain information necessary to understand the hydrologic system and to assess the consequences of groundwater withdrawals on the environment and water users.
Initiated in October 2003, the five-year investigation is scheduled for completion by the end of 2008. While the first three years of the study were devoted to monitoring efforts and conducting field investigations, the primary focus of the fourth year (2007) was developing methods to assess impacts of groundwater withdrawals on streamflow.
Climatologically, 2007 was a very wet year, with 43.6 inches of rainfall recorded at the Fittstown Mesonet weather station on top of the aquifer. In contrast to the previous year’s drought conditions, Oklahoma experienced one of the wettest Junes on record. In the Arbuckles, dry streambeds became roaring torrents of water, and groundwater levels rebounded. Following a very wet June and July, the study area avoided the brunt of Tropical Storm Erin that hit central Oklahoma August 18-19. While some areas of the state received up to 8-10 inches of rainfall in a few hours, the Fittstown Mesonet station recorded only 1.60 inches. The study area remained fairly dry during the rest of the year. Water levels in December were similar to those a year ago.
Several noteworthy accomplishments were made in 2007: • An instream flow assessment was initiated to quantify fish habitat in spring runs of the
Blue River and Pennington Creek. • A river-basin network model was developed to assess the impact of groundwater
withdrawals on downstream surface water rights. • A three-dimensional geologic framework model was developed to gain a better
understanding of the hydrologic connectedness of the water bearing units across fault zones and provide the geologic framework for groundwater flow models.
• Rainfall-runoff modeling of the Blue River and Clear Boggy Creek watersheds was conducted to identify components of the hydrologic water balance, especially streamflow and recharge. The model results, which simulate the runoff component of the stream hydrograph, will be coupled with the groundwater flow model to simulate the total streamflow hydrograph.
• Digital groundwater flow models of the eastern portion of the aquifer were developed to test our understanding of the aquifer and predict the consequences of aquifer-scale groundwater withdrawals on streamflow.
• A 300-year tree-ring chronology was developed and used to reconstruct streamflow, precipitation, and temperature of the region.
• Several geophysical techniques (including gravity and magnetic surveys, seismic testing, electrical resistivity imaging, and helicopter electromagnetic surveys) were used to characterize the subsurface geology and evaluate groundwater flow through the highly faulted, structurally complex, carbonate aquifer.
• An investigation of the geochemistry of the Arbuckle-Simpson aquifer was completed. Analyses of water samples collected from 32 wells and springs were used to characterize

the groundwater in the aquifer and to improve understanding of the groundwater flow system.
• Potentiometric surface maps of the aquifer were created from water-level measurements. Subsurface watersheds (the area within the aquifer that contributes groundwater to a certain point) were then delineated from the potentiometric maps, revealing that some subsurface watersheds are substantially different from the surface watersheds.
• The Arbuckle Data Viewer was launched. This online mapping application allows study participants and the public to examine and download data from more than 45 datasets compiled for the Study.
This report describes progress through 2007, preliminary findings, problems, and upcoming activities. For more information regarding the Arbuckle-Simpson Hydrology Study, refer to the project website: http://www.owrb.ok.gov/studies/groundwater/arbuckle_simpson/arbuckle_study.php.
Background The Arbuckle-Simpson aquifer provides water for municipal, irrigation, industrial, mining, fisheries, recreation, and wildlife conservation purposes. The aquifer is the source of a number of important springs in the region, including Byrds Mill Spring, Ada’s primary drinking water source, and springs in the Chickasaw National Recreation Area. Several headwater streams, including Blue River and Pennington, Honey, and Travertine Creeks, originate in the aquifer, and are sustained throughout the year by groundwater discharge to springs and seeps.
A controversial proposal to pump as much as 80,000 acre-feet of water per year from the aquifer and transport it to central Oklahoma generated concern that large-scale withdrawals of groundwater would result in declining flow in streams and springs. Because of this concern, the State Legislature passed Senate Bill 288 in May 2003. The bill imposes a moratorium on the proposed groundwater permits until the Oklahoma Water Resources Board (OWRB) completes a hydrologic investigation of the Arbuckle-Simpson aquifer and approves a maximum annual yield that will not reduce the natural flow of water from springs or streams emanating from the aquifer. The Arbuckle-Simpson aquifer will be the first groundwater basin for which the impact on surface water will be considered in the allocation of groundwater rights.
STUDY OVERVIEW Purpose and Objectives The purpose of the Arbuckle-Simpson Hydrology Study is to acquire understanding of the region’s hydrology to enable development and implementation of an effective water resource management plan that protects the region’s springs and streams. Specific objectives are:
1. Characterize the aquifer in terms of geologic setting, aquifer boundaries, hydraulic properties (hydraulic conductivity, transmissivity, storage coefficient), water levels, groundwater flow, recharge, discharge, and water budget.
2. Characterize the study area’s surface hydrology, including stream and spring discharge, runoff, and base flow, and the relationship of surface water to groundwater.
2

3. Construct a digital groundwater/surface water flow model of the aquifer system to be used in evaluating the allocation of water rights and in simulating management options.
4. Determine the chemical quality of the aquifer and principal streams; identify potential sources of natural contamination as well as areas most vulnerable to contamination.
5. Construct network stream models for the Clear Boggy Creek, Blue River and Lower Washita River stream systems for use in the allocation of water rights.
6. Propose water management options, consistent with state groundwater and stream water laws, which address water rights issues, pumping impacts on springs and stream base flows and water quality, and water supply development.
Study Area The study area for the Arbuckle-Simpson Hydrology Study consists of the aquifer outcrop and adjacent areas in the Arbuckle Mountains in south-central Oklahoma (Figure 1). The outcrop of the aquifer encompasses about 500 square miles, but the full extent of the aquifer is unknown. In some places, such as near Sulphur, the aquifer extends into the subsurface beneath shallower formations.
Figure 1. Study area for the Arbuckle-Simpson Hydrology Study.
3

Major streams emanating from the aquifer are within four watersheds: Honey and Hickory Creeks are in the Middle Washita watershed; Mill, Pennington, and Oil Creeks are in the Lower Washita; Blue River is in the Blue watershed; and Byrds Mill and Delaware Creeks are in the Clear Boggy watershed (Figure 2).
Figure 2. Watersheds in the area of investigation for the Arbuckle-Simpson Hydrology Study.
Hydrogeologic Setting The Arbuckle-Simpson aquifer occurs within three major rock units of Upper Cambrian to Middle Ordovician age: the Simpson, Arbuckle, and Timbered Hills Groups. The Simpson Group is the youngest, uppermost geologic unit of the aquifer and is comprised of layers of sandstone, limestone and dolomite, and some shale. Water in the Simpson Group is obtained primarily from pore spaces between the sand grains in the sandstones. The Arbuckle Group, which comprises the major portion of the aquifer, consists of a thick sequence of carbonate rocks (limestone and dolomite) with minor layers of sandstone and shale. The Arbuckle Group ranges in thickness from 6,700 feet in the western portion of the aquifer to less than 4,000 feet in the eastern portion. Water is obtained from cavities, solution channels, fractures, and intercrystalline porosity present in the limestone and dolomite rocks. The Timbered Hills Group crops out in small areas within the study area and consists of up to 700 feet of limestone, dolomite, and
4

sandstone. The Timbered Hills is believed to be in hydrologic connection with the Arbuckle Group, and for the purposes of this Study, it is considered part of the Arbuckle-Simpson aquifer. The rocks of the Simpson, Arbuckle, and Timbered Hills Groups were deformed during Pennsylvanian time, when extensive tectonic activity resulted in complex folding and faulting. Today, these rocks are exposed at the land surface in three uplifted areas: the Arbuckle, Tishomingo, and Hunton Anticlines (Figure 3).
Figure 3. Generalized surface geology and outcrop areas of the Arbuckle-Simpson aquifer.
About two-thirds of the aquifer consists of carbonate rocks (limestones and dolomites), which are soluble. Infiltrating water slowly dissolves the rock, leading to the formation of solution channels and cavities along bedding planes, fractures, and faults. Karst (solution) features, such as sinkholes and caverns have developed in some areas of the aquifer.
The Arbuckle-Simpson aquifer receives water primarily from infiltration of precipitation on the outcrop area. Most of the water discharges naturally to streams, rivers, and springs. Presently, only a small portion discharges artificially through pumping and flowing wells. Generally, groundwater flows from topographically high areas to low areas, where it discharges to springs and streams.
5

Scope and Approach The Study is designed as a regional assessment of water resources for the allocation of water rights, and is not designed to address site-specific issues. This is due to the spatial scale of available data that can be obtained within the budget and time frame of the Study and to the nature of Oklahoma water law, which appropriates equal proportionate shares of groundwater over the entire aquifer, or groundwater “basin”.
For a number of hydrologic and practical reasons, most of the data collection and modeling efforts have been focused on the Hunton Anticline area. The Arbuckle and Tishomingo Anticline areas will be addressed using methods that are more general.
Understanding the hydrology of the Arbuckle-Simpson aquifer requires information on the climate, geology, groundwater, and streamflow. Climatic factors, such as precipitation, evaporation, and soil moisture, determine the amount of water available for recharging the aquifer. Geologic information is necessary to evaluate groundwater flow through the highly faulted, structurally complex, carbonate aquifer. Stratigraphy, structure, fracture properties, karst features, diagenesis, burial history, and migration of fluids can affect aquifer storage and how water moves through the aquifer. Groundwater movement through the aquifer is affected by the distribution of hydraulic head and aquifer hydraulic properties. Continuous streamflow measurements are necessary to establish baseline conditions and to determine volumes attributed to base flow, recharge, and runoff.
Not only do we need to understand the hydrologic system, we also need information regarding ecosystems and critical habitat for flora and fauna. In addition, we need to understand the range of climatic variability and consider the potential long-term changes in climate to sustain water availability for water use and the environment in times of drought. Historical patterns of water supply (drought and flood cycles and period of recurrence) should be examined, as well as the water rights and priority of use.
Participants Coordinated by the OWRB, research is being conducted by several state and federal agencies and universities.
Cooperators: U.S. Bureau of Reclamation (Bureau) U.S. Geological Survey (USGS) U.S. Environmental Protection Agency (U.S. EPA) Chickasaw and Choctaw Nations Oklahoma State University (OSU) University of Oklahoma (OU) Oklahoma Geological Survey (OGS) The Oklahoma Climatological Survey (OCS) Nature Conservancy (TNC) Hydrosphere Resource Consultants
Participants: National Park Service (NPS) U.S. Fish and Wildlife Service (FWS) Oklahoma Department of Environmental Quality (ODEQ)
6

Oklahoma Department of Wildlife Conservation Oklahoma Corporation Commission (OCC) Oklahoma Conservation Commission OSU Extension Service Citizens for the Protection of the Arbuckle-Simpson Aquifer (CPASA)
In addition to the cooperators and participants listed above, many organizations, municipalities, and water users have assisted in various ways. We are particularly grateful for the many landowners who have allowed access to their property.
A technical peer review team consisting of experts from various agencies reviews the scope of work and provides advice to ensure the use of sound science and appropriate methods. The team consists of Scott Christenson (USGS), Dr. Todd Halihan (OSU), Dr. Neil Suneson (OGS), and Dr. Randall Ross (EPA). Serving as liaisons between the team and various stakeholders are Dick Scalf, representing CPASA and Clayton Jack, representing landowners over the aquifer.
A surface water committee was created January 2006 to evaluate potential instream flow regimes of major streams that could be implemented in accordance with Senate Bill 288. Chaired by Derek Smithee, chief of the OWRB’s Water Quality Division, the committee includes representatives of the USGS, NPS, OSU, TNC, ODEQ, Oklahoma Department of Wildlife Conservation, FWS, and area landowners. 2007 ACTIVITIES AND ACCOMPLISHMENTS
Public Involvement The OWRB is committed to keep various cooperators and stakeholders informed of the Study’s progress. Information has been distributed through a variety of media including a project website, newsletters, press releases, videos, field trips, and presentations.
In December 2007, the OWRB launched the Arbuckle Data Viewer. This online mapping application allows study participants and the public to examine and download data collected for the Study. The data viewer can be accessed through the OWRB’s Water Information Mapping System (WIMS) webpage at www.owrb.ok.gov/maps/server/wims.php. The initial view consists of a map of the study area that users can customize by selecting an area of interest and one or more of the 45 currently available map layers to display, including groundwater and surface water monitoring sites, gages, geology, watersheds, springs, weather stations, surface and groundwater permits, and roads and highways (Figure 4).
Data from the study’s monitoring sites, including real-time stream gage data and groundwater-level information from the USGS and OWRB, can also be viewed and retrieved from the site. In addition, GIS layers (in ESRI shapefile format) associated with the Arbuckle-Simpson Hydrology Study are available for download through the OWRB Data webpage at www.owrb.ok.gov/maps/data/owrbdata.php. Additional layers and datasets will be added as they become available.
7

Figure 4. Arbuckle-Simpson Hydrology Study map and data viewer. The OWRB published an Arbuckle-Simpson Hydrology Study newsletter in March. All OWRB newsletters are available on the OWRB website: http://www.owrb.ok.gov/studies/groundwater/arbuckle_simpson/arbuckle_study.php.
Several researchers gave presentations at scientific conferences and to the general public during 2007. Of special note was the Oklahoma Water Resources Research Institute (OWRRI) Symposium in October, where team members presented eight papers on the Arbuckle-Simpson Hydrology Study. Abstracts are on the conference website at http://environ.okstate.edu/OKWATER/ under the proceedings for sessions 1a and 1b.
Monitoring The monitoring program encompasses climatic, groundwater, and stream variables. Active project monitoring stations in 2007 include one Mesonet weather station, 10 wells for monitoring continuous water levels, and three stream gages. The locations of these and other active monitoring stations are shown on Figure 5. In addition to the measurements collected at these stations, discharge from streams and water levels in wells were measured during quarterly synoptic events.
8

Figure 5. Monitoring stations in the Arbuckle-Simpson Hydrology Study area in 2007. Climate Climatic factors such as precipitation, evaporation, temperature, wind speed, soil temperature, and soil moisture affect groundwater recharge and streamflow, and are thus necessary in evaluating the hydrologic budget. Regionally, these parameters are monitored by the Oklahoma Mesonet. To provide additional precipitation data for the Study, the USGS installed rain gages at the Pennington Creek, Honey Creek, Byrds Mill Spring, and Blue River gage stations.
The Oklahoma Mesonet, established in 1994, is a network of over 110 automated measuring stations covering Oklahoma. The system is designed to measure the environment at the size and duration of mesoscale weather events, which range in size from a few kilometers to a few hundred kilometers and last from several minutes to several hours. At each site, the environment is monitored by a set of instruments located on or near a 10-meter-tall tower. Measurements include precipitation, temperature, barometric pressure, relative humidity, wind speed and direction, solar radiation, soil temperature, and soil moisture. Mesonet stations in the study area are Sulphur, Tishomingo, and Fittstown.
The Fittstown Mesonet weather station was commissioned on May 12, 2005, to collect climatic data for the Study. Maintained by OCS, the Fittstown station is the only Mesonet station on the outcrop area of the Arbuckle-Simpson aquifer. Climatic data are transmitted to a central facility every 15 minutes and can be viewed on the Mesonet website www.mesonet.org. These data provide researchers with information essential to understanding the aquifer and how it responds to variations in precipitation and other climatic factors.
9

Groundwater Continuous groundwater-level measurements provide information on how the aquifer responds to various stresses, such as precipitation and pumping. These measurements are recorded with pressure transducers and data loggers that are installed in observation wells. In 2007, OWRB staff monitored water levels in 11 observation wells. Water-level measurements are downloaded monthly and entered into the OWRB database. In order to assist with the analysis of groundwater fluctuations induced by earth tides, water-level measurements have been recorded at 15-minute intervals since October 2007. OWRB water-level data are available either through the Arbuckle Data Viewer at www.owrb.ok.gov/maps/server/wims.php or the Water Well Record Search at http://www.owrb.state.ok/wd/search/search.php.
In October 2005, OWRB installed an observation well at the Fittstown Mesonet weather station, and equipped the well with a continuous water-level recorder. Real-time graphs of water-level elevation and precipitation can be viewed on the Mesonet website www.mesonet.org. Water-level data can also be retrieved through the OWRB Well Record Search or Arbuckle Data Viewer. The OWRB Well ID for the Fittstown Mesonet well is 97451.
Figure 6 shows a graph obtained from the Mesonet website of the water-level elevation and precipitation recorded at the Fittstown Mesonet station in 2007. As illustrated in the graph, the water level at the site rose 42 feet after 13 inches of rainfall were recorded in June. The water level then declined 60 feet by the end of the year. Although the station recorded 1.60 inches August 18-19 from Tropical Storm Erin, the water level did not respond to this event-largely because of low soil moisture and high evaporation rates.
Tropical Storm Erin
Figure 6. Water-level hydrograph and precipitation at the Fittstown Mesonet weather station (January 1-December 31, 2007). Water-level elevations (feet) are plotted in blue. Red bars indicate daily rainfall totals (inches) according to the scale on the right side of the diagram. (www.mesonet.org).
The USGS maintains three continuous, real-time groundwater-observation wells that are in addition to the project wells. Of primary importance is the USGS Fittstown groundwater-
10

observation well. Monitored since 1959, the well holds the longest record of continuous water-level measurements in the study area. The USGS also maintains two groundwater-observation wells near the Town of Mill Creek. These monitoring stations are part of a monitoring and management plan for Meridian Aggregates Co. (Meridian). Real-time and historic data are available on the USGS website: http://waterdata.usgs.gov/ok/nwis/current/?type=gw.
Locations of wells equipped with continuous recorders are shown in Figure 7, and hydrographs showing average daily depth to water through December 2007 are displayed in Figure 8.
Water levels in wells respond to various stresses on the aquifer such as recharge from precipitation and pumping from nearby wells. As illustrated in Figure 8, water-level response to recharge events varies from well to well. For example, many wells show a rapid or “flashy” response to recharge, with a sudden increase in water level after the beginning of a recharge event, and others show a slower response with a smaller rise in water level. Several factors affect the variability of water-level rise in these wells: hydraulic characteristics (such as transmissivity and storage coefficient), depth to water, location of the well relative to low (discharge) areas or upland (recharge) areas, degree to which the well is connected to the aquifer through fractures intercepted by the well, and spatial variability of rainfall. Note that many of the wells with small water-level rises and slow response times are completed in the Simpson Group, which has different hydraulic characteristics than the Arbuckle Group.
Streamflow The USGS maintains three stream gages specifically for the Study: Pennington Creek near Reagan, Blue River near Connerville, and Honey Creek below Turner Falls. These are in addition to other USGS gages at Byrds Mill Spring, Antelope Spring, and Rock Creek at Sulphur. The USGS maintains two stream gages for Meridian’s monitoring and management plan: one on Mill Creek near the town of Mill Creek and the other on Pennington Creek east of the town of Mill Creek. All USGS gage data are available in real time through the USGS NWIS website: http://waterdata.usgs.gov/nwis. Figure 9, downloaded from the USGS website, shows daily average flow at the Blue River near Connerville gage for 2007.
From April 2004 to August 2006, OWRB staff conducted periodic monitoring of 12 stream stations on Blue River and Delaware, Honey, Mill, Oil, and Pennington Creeks. Nine stations were equipped with wire-weight gages installed on bridges, and three stations were equipped with staff gages or tape-down points. One of the stations, located on the upper reach of Blue River, was upgraded for continuous monitoring in February 2005. Point discharge measurements and field parameters were measured during a variety of flow conditions, and rating curves were developed for most stations. Three of these sites now have USGS stream gages: Honey Creek below Turner Falls, Mill Creek near the town of Mill Creek, and Pennington Creek east of the town of Mill Creek. The rest of the OWRB stream monitoring stations were decommissioned in 2006. Data collected from these stations are available through the online Arbuckle Data Viewer at www.owrb.ok.gov/maps/server/wims.php (select “SWQ Monitoring Sites” layer).
11

!
!
!
!
!
!
!
!
!
!!
!(
!(
!(
85152
85190
85192
86266
86267
86822
86824
91008
92475
97451
89386
9247792479
85182
0 2 4 6 8 101Miles
LegendArbuckle Outcrop Geology
Timbered Hills GroupArbuckle GroupSimpson Group
FittstownMesonet
OWRB MaintainedUSGS Maintained
USGSFittstown
Figure 7. Map of the Hunton anticline area showing geologic groups and location and OWRB well ID of continuous water-level stations that were active in 2007.
6/22/04 10/20/04 2/17/05 6/17/05 10/15/05 2/12/06 6/12/06 10/10/06 2/7/07 6/7/07 10/5/07 2/2/08
160
120
80
40
0
Dep
th-to
-wat
er (f
eet)
85152851828519085192851938626686267868228682489386910089247597451
Arbuckle-Simpson AquiferAverage Daily Water Levels
Figure 8. Hydrographs showing daily average depth-to-water in representative observation wells.
12

Figure 9. Daily mean discharge at the USGS gage at Blue River near Connerville for 2007 (http://waterdata.usgs.gov/nwis/dv/?site_no=07332390&agency_cd=USGS&referred_module=sw; January 15, 2008).
Synoptic Measurements In addition to the continuous and periodic measurements, OWRB staff conducted synoptic measurements of water levels and stream discharge. The synoptics were conducted over short time periods during base-flow conditions when there was no surface runoff. Data obtained from the synoptics provide a “snapshot” of the water table and streamflow for a specific time and are being used to construct potentiometric maps, determine change in aquifer storage, determine recharge rates, and calibrate the groundwater-flow model.
Eight quarterly stream and groundwater synoptics were conducted between January 2004 and February 2007. Three of the stream synoptics were conducted over the entire aquifer during winter months, when discharge and water quality measurements were collected from 90 sites on streams emanating from the Arbuckle, Tishomingo, and Hunton anticlines. The other stream synoptics and all of the groundwater synoptics focused primarily on the Hunton Anticline area. Water levels for all quarterly synoptics were measured only in the Hunton Anticline area from a network consisting of about 100 used and unused wells.
In addition to the quarterly synoptics, three stream synoptics were conducted to gain additional information on Honey Creek, Washita River, and Blue River. Table 1 lists the synoptic events conducted for the Study.
Stream discharge measurements collected February 19-22, 2007, are displayed in Figure 10. As indicated in the bubble plot, the largest measured flows occurred along Blue River. The flows represent groundwater discharge, because streams were measured during base flow conditions when there was no runoff from rainfall.
13

Table 1. Synoptic measurement events conducted for the Arbuckle-Simpson Hydrology Study.
Date Area Type January 15-16, 2004 Hunton Anticline Stream July 23, 2004 Honey Creek Stream September 13-14, 2004 Washita River Stream January 17-26, 2005 Aquifer-Wide Stream March 23-24, 2005 Hunton Anticline Groundwater March 28-30, 2005 Blue River Stream June 22-23, 2005 Hunton Anticline Groundwater September 21-25, 2005 Hunton Anticline Stream September 22-24, 2005 Hunton Anticline Groundwater December 11-17, 2005 Aquifer-Wide Stream December 12-13, 2005 Hunton Anticline Groundwater March 24-29, 2006 Hunton Anticline Groundwater March 28-30, 2006 Hunton Anticline Stream June 21-22, 2006 Hunton Anticline Groundwater June 19-21, 2006 Hunton Anticline Stream September 5-7, 2006 Hunton Anticline Stream September 7-8, 2006 Hunton Anticline Groundwater December 18-19, 2006 Hunton Anticline Groundwater February 19-22, 2007 Aquifer-Wide Stream
Figure 10. Bubble plot showing stream flow measured February 19-22, 2007.
14

Research A multidisciplinary team of researchers from various agencies and universities is employing several methods to obtain information necessary to understand the hydrologic system and to assess the consequences of groundwater withdrawals on the environment and water users.
Currently underway are several research efforts to quantify the various components necessary to understanding the hydrology of the aquifer system: the hydrologic budget, aquifer characteristics, streamflow, and the geologic framework. For example, analysis of long-term streamflow records is being conducted to estimate monthly aquifer recharge and evapotranspiration rates. Chemistry of the aquifer provides information on how groundwater flows from recharge areas to discharge in streams and springs, and age-dating tracers are used to calculate the amount of time that water resided in the aquifer. Methods to characterize the aquifer include using earth-tides and regional water-level changes to estimate aquifer storage.
Several efforts are underway to characterize the geologic framework and hydrogeology of the aquifer. Geophysical methods such as electrical resistivity, gravity, magnetic, and seismic surveys were conducted to characterize faults and to map the subsurface geology. Geophysical data, along with outcrop geology, existing maps, and data from the petroleum industry, were integrated into a three-dimensional geologic model that will define the hydrogeologic boundaries of the aquifer.
To assess the impacts of proposed water-use strategies on streamflow, researchers and managers are employing a variety of methods. A river-basin network model was developed to assess the impact of groundwater withdrawals on downstream surface-water rights. Instream flow studies are being conducted to characterize the natural flow regime of major streams and to assess flow requirements of selected fishes. A 300-year tree-ring chronology was developed and used to reconstruct the precipitation, temperature, and streamflow of the region. This information will be used to investigate the occurrence and frequency of periods of rainfall deficit or surfeit and to place climatic variability during the instrumental period in a long-term climatic perspective. Finally, a groundwater flow model, in conjunction with a rainfall-runoff model, will be used to predict the consequences of various groundwater withdrawal scenarios on streamflow.
Brief summaries of research activities conducted by the Study team during 2007 are provided in Appendix A. The summaries are from abstracts and reports submitted by the principal investigators. PROBLEMS
Anschutz Seismic Data In November 2005, Dr. Surinder Sahai (OSU) purchased from Anschutz Exploration digital data from a seismic line shot over the northern portion of the Hunton anticline. Dr. Sahai contracted with Western Geophysical to reprocess the line, which resulted in much improved quality. The reprocessed line suggests highly faulted basement and overlying carbonate units, and indicates a possible collapse feature near Blue River. Dr. Sahai had planned to evaluate the data to determine the depth to bedrock and the location of faults and collapse features, but unfortunately, he left OSU in May 2007 before he had evaluated the data.
15

Dr. Sahai’s departure from OSU left in question the status of the license agreement and access to the data by other cooperators. After discussing the issue with OWRB legal staff, Anschutz agreed to grant cooperating researchers associated with the Arbuckle-Simpson Hydrology Study the same right of usage of the seismic data and derivatives as the Licensee (OSU), provided that the cooperators are bound by the terms of the original license:
1. Cooperators must request authorization from Anschutz to publish information obtained from the data (and not the data itself) on a case-by-case basis.
2. At the conclusion of the Arbuckle-Simpson Hydrology Study all rights of usage by the cooperators in the data and derivatives shall immediately cease and any copies of the data and derivatives in the possession shall be returned to the Licensee.
Copies of the license agreement and a supplement for cooperators to sign were mailed to the researchers who requested access to the seismic data.
In compliance with the license agreement, Dr. Roger Young (OU) has received data copies of all files from OSU to continue processing, analysis, and interpretation of the seismic data.
Modeling Efforts Some geologic discrepancies in the 3-D geologic framework model necessitated additional refinements in the model. Because the geologic model will provide the framework on which the groundwater flow model is built, progress on the groundwater-flow model has stalled. Modeling efforts cannot continue until refinements to the geologic model are complete and layers from the model successfully incorporated into the groundwater flow model. The final, calibrated version of the groundwater model will be used to simulate different ground-water withdrawal management options and to determine the effects of the withdrawals on stream and spring flows.
PLANS The Arbuckle-Simpson Hydrology Study remains on schedule to be completed by the end of 2008. The last year of the investigation will be devoted to writing reports, conducting computer simulations, evaluating various water-management options, disseminating information, and soliciting input from stakeholders.
Scott Christenson, in coordination with Baxter Vieux and OWRB, will conduct predictive simulations with the groundwater and rainfall-runoff models. OWRB plans to meet with various stakeholders to present initial results of the simulations and to solicit input on various management options. After reviewing the study results and soliciting input from stakeholders, OWRB staff will submit management recommendations to the Oklahoma Water Resources Board members (Board) for determination of the allocation of water rights. As directed by SB 288, the Board must approve a maximum annual yield that will not reduce the natural flow of water from springs or streams emanating from the aquifer.
16

PROJECT FUNDING The proposed budget for the five-year Arbuckle Simpson Hydrology Study was $5.15 million, funded through a 50/50 state/federal cost-share agreement with the Bureau of Reclamation. A total of $4.1 million has been allocated to the Study through Federal FY 2008 by State and Federal funding sources. PUBLISHED REPORTS Calderon, Camilo, 2006, Spatio-Temporal Variability of Evapotranspiration Rates and Its Effect
on Distributed Hydrologic Modeling of a Regional Water Balance: Master of Science thesis, University of Oklahoma, Norman, OK, 93 p.
Cole, S.R., 2006, Evaluation of the Geochemistry in the Arbuckle-Simpson Aquifer: Finding Flow Paths: Master of Science thesis, Oklahoma State University, Stillwater, OK, 76 p.
Mouri, Sassan, 2006, Using Streams and Faults as Lineaments to Delineate Aquifer Characteristics: Master of Science thesis, Oklahoma State University, Stillwater, OK, 63 p.
Riley, Mathew E., 2007, Investigation of Fault Properties Using Electrical Resistivity Imaging: Master of Science thesis, Oklahoma State University, Stillwater, OK, 56 p.
Scheirer, D. S. and Aboud, E., 2008, Preliminary gravity and ground magnetic data in the Arbuckle Uplift near Sulphur, Oklahoma: U.S. Geological Survey Open-File Report 2008-1003, 34 p. [available at http://pubs.usgs.gov/of/2008/1003/]
Scheirer, D. S. and Scheirer, A. H., 2006, Gravity investigations of Chickasaw National Recreation Area, south-central Oklahoma: U.S. Geological Survey Open-File Report 2006-1803, 40 p. [available at http://pubs.usgs.gov/of/2006/1083/]
17

18

APPENDIX A: RESEARCH SUMMARIES Summaries of research activities conducted by the Study team during 2007, from abstracts and reports submitted by the principal investigators.
19

20

Geochemical Investigation Scott Christenson (U.S. Geological Survey, Oklahoma Water Science Center, Oklahoma City, Oklahoma), Dr. Andrew Hunt (U.S. Geological Survey, Crustal Imaging and Characterization Team, Denver, Colorado), and David Parkhurst (U.S. Geological Survey, National Research Program, Denver, Colorado)
Objectives and Approach A geochemical reconnaissance investigation of the Arbuckle-Simpson aquifer was
initiated in 2004 to characterize the ground-water quality at an aquifer scale, describe the chemical evolution of ground water as it flows from recharge areas to discharge in streams and springs, and to determine the residence time of ground water in the aquifer. Characterization of aquifer-scale ground-water quality was accomplished by: (1) collecting water samples from wells and springs distributed across the aquifer for chemical analysis of major ions, trace elements, isotopes of oxygen and hydrogen, dissolved gases, and age-dating tracers; and (2) calculating descriptive statistics using the results of the chemical analyses of the water samples. The chemical analyses also were used as input to geochemical models to describe the chemical evolution of the water as it moves through the aquifer. Age-dating tracers were used to determine the approximate time of recharge and residence time of ground water in the aquifer.
Results Water samples were collected and analyzed from 30 wells and springs distributed across
the Arbuckle-Simpson aquifer in order to assess the ground-water quality at a regional scale (table 1). In addition, 6 water samples were collected and analyzed to answer specific questions about the geochemistry of the aquifer.
In general, the waters from wells and springs in the Arbuckle-Simpson aquifer are chemically suitable for all regulated uses, such as public supplies. Dissolved solids concentrations are low, with a median of 347 and an inter-quartile range of 331 to 384 milligrams per liter (table 1). Two domestic wells produced water with nitrate concentrations that exceeded the U.S. Environmental Protection Agency’s nitrate maximum contaminant level (MCL) of 10 mg/L (U.S. Environmental Protection Agency, 2006). Samples from two wells , sites 6 and 15 (fig. 1), exceeded the secondary maximum contaminant level (SMCL) for chloride of 250 mg/L. Samples from these same two wells also exceeded the SMCL of 500 mg/L for dissolved solids. Water from these two wells is not representative of water from the other wells and springs sampled, and both wells consistently are exceptional when considering most aspects of the geochemistry of the Arbuckle-Simpson aquifer. Both sites are flowing wells from confined parts of the aquifer. No other water samples from the Arbuckle-Simpson geochemical reconnaissance exceeded SMCLs, although not every chemical constituent for which the U.S. Environmental Protection Agency has established a maximum contaminant level or secondary maximum contaminant level was analyzed as part of the Arbuckle-Simpson geochemical investigation (U.S. Environmental Protection Agency, 2006).
The major ion chemistry of 28 of the 30 samples collected to characterize the aquifer-scale water quality indicates the water is a calcium bicarbonate or calcium magnesium bicarbonate water type (fig.1). Calcium bicarbonate water type is found in the western part of the aquifer, where the Arbuckle Group is predominantly limestone, of which the primary mineral is
21

22 22

calcium carbonate. Calcium magnesium bicarbonate water is found in the eastern part of the aquifer, where the Arbuckle Group is predominantly a dolomite, which consists of calcium magnesium carbonate. The major ion chemistry for the 28 samples is consistent with precipitation that falls on the aquifer infiltrating into the soil zone, where uptake of carbon dioxide gas occurs and dissolution of the host rock, limestone or dolomite, accounts for the major ion chemistry (Christenson and others, in progress).
The major ion chemistry of 2 samples (sites 6 and 15) indicates the water is a sodium chloride type, which is different from the other water samples. The composition of these samples appears to be a mixture of typical Arbuckle-Simpson calcium magnesium bicarbonate water mixed with a small amount of the sodium chloride brine that resides in the aquifer just beyond the freshwater zone (Christenson and others, in progress).
Analysis of dissolved gases and ground-water age dating provided insight into the recharge and ground-water flow rates in the Arbuckle-Simpson aquifer. Based on multiple age-dating tracers, all the water samples collected to characterize the aquifer-scale water quality recharged the aquifer after 1950, except water from sites 6 and 15. Ground-water ages determined at these two sites by using carbon-14 are 33,000 years (site 6) and 9,000 years (site 15) (Christenson and others, in progress). These two flowing wells produce water from the confined part of the aquifer and are not representative of the fresh water part of the aquifer. The fact that most of the sampled ground water was modern (less than 55 years) indicates that water is moving quickly from recharge areas to discharge to streams and springs.
Excess terrigenic helium-4 was measured in samples from some wells and springs. Excess helium-4 in water samples from the Arbuckle-Simpson aquifer is probably derived by the uptake of helium from crustal rocks, such as the Precambrian igneous rocks that underlie the aquifer, as ground water travels along long flow paths deep in the aquifer prior to arriving at the sampled site. Excess helium-4 is in high concentrations from samples from sites 6 and 15. The amounts of excess helium-4 observed in these two samples are several orders of magnitude higher than atmospheric solubility, and the presence of long flow paths at sites 6 and 15 are confirmed by the old carbon-14 ages of water samples from these wells. Five sites with excess helium concentrations are springs in the Hunton Anticline part of the aquifer. Multiple flow paths often converge at springs, and although the water samples from these sites had modern ground-water ages it seems likely from the excess helium in these samples that at least some fraction of the water from these springs has flowed along a long, deep flow path before being discharged at the spring.
Concentrations of dissolved argon, neon, and xenon in water samples were used to determine the temperature of the water when it recharged the aquifer. Analysis of dissolved gases for sites 6 and 15 indicate that the recharge temperature for these two samples was much cooler than the recharge temperature for other samples. The recharge temperature determined for sample 6 was 8.2 oC and for sample 15 was 6.6 oC, which is consistent with the recharge for these two samples occurring at a much earlier time when mean annual temperatures were lower than at the present. The mean recharge temperature for the other water samples was 14.3 oC, which is very close to the estimated weighted annual recharge temperature of 14.5 oC, based on calculated mean monthly recharge rates from hydrograph separation techniques of stream gage data at Blue River at the Connerville gage and mean monthly air temperature.
23

24

25 25

Plans for 2008 Data collection and analysis of the data were completed in 2007. A draft of the report,
including all text, figures, and tables is complete. The authors are making final changes and the report will be submitted to the U.S. Geological Survey’s review process early in 2008.
Planned Report Christenson, Scott, Hunt, A.G., and Parkhurst, D.L., (in progress), Geochemical investigation of
the Arbuckle-Simpson aquifer, South-Central Oklahoma: U.S. Geological Survey Scientific Investigations Report.
References Christenson, Scott, Hunt, A.G., and Parkhurst, D.L., (in progress), Geochemical investigation of
the Arbuckle-Simpson aquifer, South-Central Oklahoma: U.S. Geological Survey Scientific Investigations Report.
Fairchild, R.W., Hanson, R.L., and Davis, R.E., 1990, Hydrology of the Arbuckle Mountains area, south-central Oklahoma: Oklahoma Geological Survey Circular 91, 112 p., 2 plates, scale 1:100,000.
U.S. Environmental Protection Agency, 2006, List of Drinking Water Contaminants & MCLs, accessed September 25, 2006, from: http://www.epa.gov/safewater/mcl.html - mcls.
From: Arbuckle-Simpson Hydrology Study U.S. Geological Survey Oklahoma Water Science Center Annual Summary 2007, by Scott Christenson
26

Ground-Water Flow Modeling Scott Christenson (U.S. Geological Survey, Oklahoma Water Science Center, Oklahoma City, Oklahoma)
Ground-water flow models of the Arbuckle-Simpson aquifer were constructed using the U.S. Geological Survey, MODFLOW-2000 finite-difference model (Harbaugh and others, 2000). The purposes of the models are to test conceptual models of the aquifer and to predict the consequences of aquifer-scale ground-water withdrawals on stream and spring flows. The MODFLOW models simulate the distribution of hydraulic head and the base flow (ground-water discharge) component of stream hydrographs. The models are designed to work at a regional scale and are not intended to simulate the effects of individual wells or well fields.
The geologic framework for the ground-water flow models of the Hunton Anticline was obtained by exporting geologic data (elevations of tops and thickness of the geologic units) from a geologic model produced from earthVision software (Dynamic Graphics, Inc., 2007) and importing that data to the MODFLOW models in order to accurately represent the geology of the Hunton Anticline. The MODFLOW models were discretized by using 200-meter node spacing in the X and Y directions and multiple layers in order to simulate the 3-dimensional movement of ground water in the aquifer (fig. 2).
An initial, preliminary steady-state model of the Hunton Anticline part of the aquifer used synoptic measurements of depth to water in wells and streamflow collected in August 1995 as head and flow observations. The observation, sensitivity, and parameter-estimation features of MODFLOW-2000 were used, with parameterization based on geologic units. Nonlinear regression was used to determine model parameters. Substantial differences existed between the Arbuckle and Simpson Group hydraulic parameters. Hydraulic conductivity and recharge calculated for the Arbuckle Group were an order of magnitude greater than equivalent parameters in the Simpson Group, which is consistent with geohydrologic observations that the Simpson Group is not as prolific an aquifer as the Arbuckle Group (Fairchild, Hanson, and Davis, 1990). The model-derived ratio of horizontal to vertical hydraulic conductivity (Kh/Kv) in the Simpson Group was orders of magnitude greater than in the Arbuckle Group. The high ratio of horizontal to vertical hydraulic conductivity is consistent with the geology of the Simpson Group, which consists of interlayered limestone, sandstone, and shale. A preliminary transient-flow model was constructed to simulate a time period starting on January 1, 2004. This time period was selected because of the availability of data from stream gages installed in the fall of 2003. Recharge for the transient model was determined using hydrograph separation methods of baseflow on mean-daily streamflow data from Blue River at the Connerville gage. Blue River was selected because it usually has the largest measured discharge of any stream originating in the study area. The direct-runoff component of streamflow, which was not simulated by the MODFLOW model, was obtained by hydrograph separation analysis, which allowed the baseflow component to be determined.
The transient model used daily time steps in order to compare model-computed base flows to mean daily flows at stream gages. Aquifer hydraulic parameters for the transient model were those derived from the steady-state model. Different values of specific storage in the transient model were tested to match model-computed flows to daily stream-gage data. Flows calculated by the transient flow model reproduced the measured flow at the Connerville stream
27

gage when specific storage was adjusted to values consistent with a fractured-bedrock aquifer such as the Arbuckle Group.
The aquifer hydraulic parameters derived from the steady-state and transient models are similar to aquifer hydraulic parameters determined for the Arbuckle-Simpson aquifer independently by other methods, such as aquifer tests, analyses of ground-water and surface-water hydrographs, and age dating. Agreement of model and independently derived parameters indicates the model is a reasonable representation of the ground-water flow system. In particular, the storage coefficient derived from the transient ground-water flow model is similar to independent analyses of storage coefficients (Fairchild, Hanson, and Davis, 1990). The small storage coefficient means that only small volumes of water are available from aquifer storage.
The MODFLOW models will be used during the final year of the Arbuckle-Simpson Hydrology Study to estimate the effects of potential ground-water withdrawals on streamflow. The MODFLOW models will simulate the base-flow component of stream hydrographs and will be coupled with a rainfall-runoff model, which will simulate the runoff component, and thus simulate the total streamflow hydrograph.
Plans for 2008 Additional refinements to the geologic framework on which the MODFLOW model is
built are in progress. When the geologic refinements are incorporated, the model will be recalibrated by using the same procedure as the preliminary model. When the final version of the model is calibrated, different ground-water withdrawal management options will be simulated to determine the effects of withdrawals on stream and spring flows.
Planned Report Christenson, Scott, and others, (in progress), Simulation of ground-water flow in the Arbuckle-
Simpson aquifer, South-Central Oklahoma: U.S. Geological Survey Scientific Investigations Report.
References Dynamic Graphics, Inc., 2007, earthVision, software for 3-D modeling and visualization:
Dynamic Graphics, Inc., accessed at http://www.dgi.com/earthvision/index.shtml
Harbaugh, A.W., Banta, E.R., Hill, M.C., and McDonald, M.G., 2000, MODFLOW-2000, the U.S. Geological Survey modular ground-water model -- User guide to modularization concepts and the Ground-Water Flow Process: U.S. Geological Survey Open-File Report 00-92, 121 p.
28

From: Arbuckle-Simpson Hydrology Study U.S. Geological Survey Oklahoma Water Science Center Annual Summary 2007, by Scott Christenson
29

Groundwater Hydrology of the Arbuckle-Simpson Aquifer Scott Christenson (USGS), Noel I. Osborn (OWRB), and Christopher R. Neel (OWRB)
For purposes of the Arbuckle-Simpson Hydrology Study, the Arbuckle-Simpson aquifer was subdivided into three areas: the Hunton, Tishomingo, and Arbuckle Anticlines, based on the predominant geologic structure in the sub-area. Geologic and hydrologic features separate the three areas and thus they were considered to be three distinct groundwater flow systems.
The median thicknesses of the Arbuckle and Simpson Groups in the Hunton Anticline are about 3,500 and 230 feet, respectively. The maximum depth of freshwater is not known. A test well drilled as part of this investigation was completed in the Hunton Anticline in the Arbuckle Group at a depth of over 1,800 feet. The concentrations of dissolved constituents in water produced at the maximum depth of the test well were very similar to water produced at the shallowest depth, indicating that the base of freshwater is deeper than 1,800 feet below land surface at this location.
Aquifer hydraulic characteristics were determined using multiple, independent methods, including aquifer tests, analysis of groundwater and surface-water hydrographs, and flow-model analysis. Regional-scale determinations of transmissivity, derived from analysis of hydrographs, ranged from 5,000 to 19,000 square feet per day with an average of 11,000 square feet per day. Regional-scale determinations of storage coefficients, also from hydrograph analysis, ranged from 0.002 to 0.014.
Several lines of evidence indicate the Simpson Group is not as prolific an aquifer as the Arbuckle Group and may function as a confining layer: (1) hydraulic gradients are steeper in the Simpson Group than in the Arbuckle Group, (2) the presence of flowing wells in the eastern portion of the Hunton Anticline within a large outcrop of Simpson Group; and (3) baseflow of the Blue River increases immediately before it flows over the Simpson Group near Connerville. The interlayed sandstones, limestones, and shales that comprise the Simpson Group are consistent with a confining layer.
Potentiometric-surface maps for the Hunton Anticline show three prominent subregional groundwater flow systems. Groundwater in the areally largest flow system flows from the northwest to the southeast. Groundwater discharges from this subregional system to streams and springs in the southeast part of the aquifer, sustaining baseflow to Blue River and Pennington Creek. The two other prominent subregional groundwater flow systems are the northeastern part of the Hunton Anticline, where groundwater flows east and discharges primarily to Byrds Mill Spring, and a flow system that discharges to the west to Rock and Travertine Creeks. Subsurface watersheds, delineated on potentiometric-surface maps of the Hunton Anticline, are substantially different from the surface drainage basins.
Water in the aquifer originates as diffuse infiltration of precipitation through soil and recharges the aquifer. Recharge varies temporally and spatially. During months when evapotranspiration is minimal, water levels rise quickly in many wells after a rainfall event, indicating that recharge reaches the water table quickly in much of the aquifer. Monthly recharge, computed from stream hydrographs at Blue River at Connerville for 2004 through 2006, ranged from 0.15 to 3.78 inches. Synoptic stream-discharge measurements on Delaware Creek, for which the drainage basin is located entirely on the Simpson Group, indicate that recharge to the Simpson Group is less than that of the Arbuckle Group.
30

Chemical analyses of water samples from 24 wells and 6 springs show that the major ion chemistry from the aquifer generally is either calcium bicarbonate or calcium magnesium bicarbonate. The major ion chemistry of most of these samples can be explained as water that originated as precipitation, infiltrated through the soil zone and acquired carbon dioxide, then dissolved the host rock, either limestone or dolomite. Age-dating tracers were used to calculate the amount of time that water resided in the aquifer. Most samples were considered to be modern groundwater, meaning the water that was sampled was last in contact with the atmosphere after about 1952. Samples from two wells, located near the edge of the aquifer, were different from the other 28 samples. Samples from these two wells had significant concentrations of sodium and chloride and were over 10,000 years old. These two samples are thought to represent waters from the periphery of the aquifer, where freshwater is mixing with connate brines that surround the aquifer. Analysis of the geochemistry of the aquifer supports and enhances the conceptual model of the flow within and recharge to the aquifer: Water in the aquifer originates as diffuse recharge from precipitation that falls on the outcrop of the aquifer, and flows relatively quickly through the aquifer, and discharges to streams and springs, with the majority of the discharge near the periphery of the aquifer.
From: Oklahoma Water Research Symposium 2007 Presentation Abstracts, Cox Convention Center, Oklahoma City, October 23-25, 2007.
31

Subsurface watersheds in the Hunton Anticline area delineated with ArcMap.
Surface watersheds delineated to USGS gages (and a point on Delaware Creek) utilizing the StreamStats program developed by the USGS.
32

Instream Flow Assessment of Streams Draining the Arbuckle-Simpson Aquifer: Instream Flow Modeling Titus S. Seilheimer and William L. Fisher (Oklahoma Cooperative Fish and Wildlife Research Unit; Oklahoma State University)
We are using the Instream Flow Incremental Methodology and the Physical Habitat Simulation (PHABSIM) model to quantify fish habitat in spring runs of the Blue River and Pennington Creek, which drain the Arbuckle-Simpson aquifer. The PHABSIM model requires three separate data components: channel structure, habitat suitability criteria, and hydraulics. We have completed the field portions for all three components. We have measured channel structure, including water depth, velocity, and substrate, and cover, along multiple transects across three reaches in the upper Blue River and adjacent springs and a single reach of Spring Creek, a tributary of Pennington Creek. Habitat suitability criteria are under development for four target species: least darter, southern redbelly dace, redspot chub, and orangethroat darter. We used a combination of underwater observation and electrofishing to develop the suitability criteria.
Separate suitability curves will be developed for depth, velocity, and channel index (cover and substrate) for each species, which will then be used in the modeling to quantify the suitability of habitat under altered hydrologic regimes. We are also working to develop hydrologic time-series for each study site based on available USGS gage stations or other methods. We have been collecting depth data at Spring 2, Spring 3, and Spring Creek, but this a limited time period. A simulated time-series will provide a greater understanding of long term fluctuations in spring flow of the Arbuckle-Simpson and insight into their impacts on fish habitat. The modeling portion of the project will begin soon and allow us to produce a table to demonstrate the relationship between reduced flow and available fish habitat.
We deployed temperature logging probes in Spring 2 and Spring 3 in the Blue River watershed, and Spring Creek in the Pennington Creek watershed. Water temperature in the study sites varied little during the summer months and ranged between 15 to 20 °C (Figure 1). The mean daily water temperatures range was highest in Spring 3 (1.8 °C), intermediate in Spring 2 (1.3 °C), and lowest in Spring Creek (1.0 °C). Elevated temperatures in late June and early July in Springs 2 and 3 resulted from infiltration of warmer Blue River water into the springs during high flow events. The Spring Creek site exhibited elevated temperatures when data collection began in August but fell to temperatures comparable to the other spring sites by mid-September (Figure 1). The downward trend in temperature was a result of reduced surface flow from the watershed. By early December, the study site in Spring Creek had no water entering from the watershed and was completely groundwater dependent. Modified from: Oklahoma Water Research Symposium 2007 Presentation Abstracts, Cox Convention Center, Oklahoma City, October 23-25, 2007, and January 2008 Quarterly Report to the OWRB.
33

Figure 1: Daily mean temperature (°C) of Spring 2 and Spring 3 in the the Blue River watershed and Spring Creek in the Pennington Creek watershed.
34

Application of Indicators of Hydrologic Alteration Software to Characterization of Environmental Flows in Selected Streams Underlain by the Arbuckle-Simpson Aquifer Ellen Tejan1 and C. Stephen Haase2 (The Nature Conservancy) 1Aquatic Ecologist, Oklahoma Field Office
2 Sr. Biohydrologist, Southern US Conservation Region
The data record for the gaging station at Blue, Oklahoma extends from water years 1937
through 2006 and provides the longest and most comprehensive record of the available data sets, thereby providing a baseline to assess flow regime alteration within the Blue River watershed, at least since 1937. Information provided on the USGS website for the gaging station at Blue OK indicates that, since 1981 annual instantaneous peak flows at this locality may be influenced to an undetermined degree by flow diversion or regulation within the watershed upstream of the gaging station. Based on this information, the data record was stratified around 1981, and the pre- and post-1981 periods of record were compared to evaluate alteration to the flow regime resulting from water diversion or flow regulation activities.
Subsequent to analysis of data from the gage at Blue, Oklahoma, statistical analysis of available hydrologic data from USGS gaging stations on streams and rivers within the region underlain by the Arbuckle-Simpson aquifer has been completed. Many gaging stations of interest within the study area have periods of record that are either too short or too fragmented to fully satisfy the data requirements of the IHA software. To address such data deficiencies, synthetic hydrographs generated by Dr. Baxter Vieux (University of Oklahoma) for the Connersville OK and Milburn OK gaging stations on the Blue River will be incorporated into the study when they become available in January 2007. For other localities, several hydrograph extrapolation techniques (e.g., correlation cross-plots with nearby gaging stations) have been evaluated to create synthetic hydrographs for ungaged or infrequently monitored streams within the study area (e.g. Pennington Creek, Honey Creek, and Travertine Creek).
Analysis of the flow record for the Blue River at Blue, Oklahoma suggests a complex pattern of change between the periods before and after 1981, that likely reflects both short-term climatic variability and anthropogenic influences. Of potential interest to ecologically sustainable water management is the observation that median monthly flows for May through August, and the annual 1-, 3-, and 7-day minimum flows for a given water year all exhibited statistically significant decreasing trends for the post-1981 period, while no such trends were noted for the pre-1981 period. Additionally, the annual base flow metric for the pre-1981 period exhibits a statistically significant increasing trend, and no distinctly increasing or decreasing trend for this metric is observed in the post-1981 period.
The period of record (1966 through 1986) for the Milburn, Oklahoma locality on the Blue River is marginally adequate for analysis with the IHA software. Results of the analysis indicated no statistically significant trends in any of the 67 flow metrics evaluated. Because the Milburn, Oklahoma gaging station is located close to the edge of the outcrop area of the Arbuckle-Simpson aquifer, such results suggest that spring discharge to the portion of the Blue River upstream of the gaging station did not experience significant changes during the period of record. Unfortunately, records are not available for the past 20-year period, when water use pressures on the aquifer likely have increased.
35

Analysis of the flow record for Byrds Mill Spring near Fittstown, Oklahoma indicates few statistically significant trends for the period of record (1960 through 2007). Median monthly flows for February the number of hydrograph reversals (from rising to falling trend or vice versa), and the annual number of high-flow events (periods when flows exceeding the 75th percentile of all flows) all increase, and the duration of annual high flow events decreases. Though statistically significant, the magnitude of all trends noted is not great and cannot be readily attributed to any distinct event. In general, the analysis suggests a general lack of significant changes in the discharge pattern Byrds Mill Spring over the period of record.
During the first quarter of 2008, development of synthetic hydrographs will be completed. The IHA software will be used to determine flow regime characteristics of the hybrid (combined nature and synthetic) hydrographs to obtain best estimates of the ranges of variability for the 67 ecologically-important parameters calculated by the IHA software. During the second quarter of 2008, results of all flow analysis will be collated and summarized to develop a set of recommendations, based on past streamflow characteristics, for ecologically sustainable management the Arbuckle-Simpson aquifer streams considered in this study.
From: January 2008 Quarterly Report to the OWRB
36

Modeling Surface Water Rights Benjamin Harding, Principal Engineer, Hydrosphere Resource Consultants, Boulder, CO
The Arbuckle-Simpson Aquifer contributes base flow to the Blue River, the Clear Boggy River and parts of the Lower Washita River watersheds. Pumping from the Arbuckle-Simpson Aquifer is expected to reduce base flows in these watersheds. The Oklahoma Water Resources Board issues permits for water use and administers water rights within the state of Oklahoma. In order to determine the potential impact of groundwater withdrawals on downstream permit holders, the Board contracted with Hydrosphere Resource Consultants of Boulder, Colorado, to develop a network model of surface water and water rights along the three watersheds. A network flow model is used to simulate the allocation of water to water rights according to priority. Hydrosphere constructed the model to simulate the operation of all permitted water rights along the streams in priority. Over 190 water demands were represented, including 124 irrigators and 17 public water supplies. The model included 36 inflow points and 178 river reaches.
The model was constructed so that ground water inflows could be adjusted using either specific time series data from outside sources, such as from the Arbuckle Simpson ground water model, or using basin-wide adjustments to the base flow. The model also allows the user to adjust the length of the growing season and the consumptive use of agricultural water users, which could vary with climate in the future.
Initial results from the modeling study indicate that shortages currently occur infrequently and for relatively short periods of time. Increased levels of pumping will reduce stream inflows and therefore the amount of water available to satisfy senior water rights and can be expected to increase or prolong shortages to senior water rights. One alternative to allow increased water use is the use of reservoir storage to supplement natural streamflows at times when shortages occur. Determining the precise amount and locations of the storage required depends on the pattern of depletions to the river caused by extractions from the aquifer.
From: Oklahoma Water Research Symposium 2007 Presentation Abstracts, Cox Convention Center, Oklahoma City, October 23-25, 2007.
Watersheds with permit locations.
37

Stream Hydrology and Water Balance of the Arbuckle-Simpson Aquifer Dr. Baxter Vieux (Director, Center for Natural Hazards and Disaster Research;Professor, School of Civil Engineering and Environment Science, University of Oklahoma)
Stream hydrology is composed of two separate though linked responses to precipitation,
direct runoff and baseflow. Direct runoff to the stream occurs on the order of hours to days when the capacity of the soil to infiltrate is exceeded. Baseflow is discharge from the aquifer throughout the year, but ultimately derives from precipitation that recharges the aquifer. The change in storage of water in a stream-aquifer system for a specific time period is affected by precipitation, surface runoff, ground water recharge and discharge, evaporation, and transpiration. These components of the hydrologic water balance govern the amount of water that an aquifer receives as recharge and ultimately discharges to the receiving stream.
The study area includes the Arbuckle-Simpson aquifer located in South Central Oklahoma. The Arbuckle-Simpson aquifer provides water to streams and rivers as baseflow, including the 1200 km2 Blue River. The objective of this study is to identify components of the hydrologic water balance, especially streamflow and recharge. To accomplish this objective, a distributed hydrologic model of the surface drainage systems including the Blue River and components of the Arbuckle-Simpson aquifer, which receive recharge are simulated using spatially variable rainfall derived from radar and rain gauge information. Available streamflow and hydrometeorological records for the period, 1994-2007, are used to derive a climatological water budget through a combination of model simulations of direct runoff and synthetic generation of baseflow. Cumulative volume of direct runoff is simulated for this period at locations where stream gauging stations exist, and at other interior points supported by the distributed model. Validation of the model reveals that accurate estimates of the hydrologic water balance can be achieved through the combination of simulated direct runoff and synthetically generated baseflow From: Oklahoma Water Research Symposium 2007 Presentation Abstracts, Cox Convention Center, Oklahoma City, October 23-25, 2007.
38

Geologic Framework of the Arbuckle-Simpson Aquifer Todd Halihan, James Puckette, and Jason Faith (OSU School of Geology) Quantifying the water resources of the Arbuckle-Simpson aquifer requires understanding the distribution of the lithologic units. In that geologic framework, the hydraulic properties of the units need to be evaluated. We have constructed a three-dimensional (3-D) EarthVision™ (EV) geologic framework model that characterizes the distribution of the Arbuckle-Simpson aquifer within the Hunton anticline area. The model helps to visualize the hydrologic connectedness of the water bearing units across fault zones and allows the exploration of the inner geometries of fault blocks. This preliminary model contains five geologic layers, more than 40 major and minor faults, and depicts the basic shape and form of the aquifer from the surface to the igneous basement. The construction of the 3-D EV model involved integrating field studies that include outcrop geology, available geologic and geophysical data from existing maps, data from over 300 boreholes, and various geologic and hydrogeologic reports. Over 30 surface geologic contact points were extrapolated into the subsurface in areas lacking well control.
The storage of the aquifer was evaluated near the surface using direct push techniques and electrical resistivity imaging. This near surface zone of soil and rock is referred to as epikarst as it forms the outer layer of the karstic Arbuckle strata. The near surface epikarst zone consisted of sediments with high porosities whose storage capabilities rival that of deeper Arbuckle water-bearing units. The storage in the deeper portions of the aquifer is being evaluated using tidal analysis. The water-level changes induced by the movements of the sun and moon are being used to determine the storage and hydraulic conductance of the deeper Arbuckle hydrostratigraphic units.
In order to evaluate the effects of fracturing on the flow of fluids in the aquifer, several data sets were integrated. Mapped fault data was combined with stream lineament data to interpret areas of the aquifer which may behave similarly due to consistent fracture patterns. This was also evaluated using outcrop and geophysical data to develop an overall picture of fracturing in the aquifer. The aquifer appears to be fractured from the surface to depth, but the connectivity of the fractures is limited and many portions of the aquifer have few transmissive fractures providing confining portions of the aquifer.
From: Oklahoma Water Research Symposium 2007 Presentation Abstracts, Cox Convention Center, Oklahoma City, October 23-25, 2007.
OSU students preparing to collect EC log data for the Arbuckle-Simpson aquifer using the Geoprobe®.
39

Preliminary results of airborne and ground resistivity surveys for subsurface mapping in the Hunton anticline, south-central Oklahoma David V. Smith, Bruce D. Smith, Charles D. Blome (USGS, Earth Surface Processes Team and Crustal Imaging and Characterization Team, Denver), Todd Halihan (OSU), and Jennifer Back (NPS)
Airborne and ground electrical resistivity surveys have been conducted to map the subsurface geologic and hydrologic character of the Hunton Anticline area of the Arbuckle-Simpson aquifer. Four areas, with distinctly different geology, were flown with a helicopter electromagnetic system (HEM) in March 2007, with U.S. Geological Survey (USGS) and National Park Service (NPS) funding. The resistivity measurements were made at six different frequencies ranging from 400 Hz to 115,000 Hz. Total field magnetic and high precision (GPS and laser altimeter) location measurements were also made. A total area of about 1700 square kilometers were flown in blocks A through D mostly with a line spacing of 400 m. Block A extends from the Chickasaw National Recreational Area (CNRA) to Mill Creek on the west side of the anticline. Geology of this block consists of dolomitic limestone of the Arbuckle Group in fault contact with younger Paleozoic clastic rocks. The flight line spacing was 800 meters in the western half of the block and 400 meters in the eastern part. Airborne magnetic data indicate that the Sulphur fault bends south to merge with the Mill Creek fault, substantiating a hypothesis first made from interpretation of gravity data. Block B, which encompasses Byrds Mill Spring and the city of Ada's water supply wells, is located on the north side of the anticline. Geology in this block consists of mostly of Arbuckle and Simpson Group rocks. Block C, covering most of the Clarita horst on the east side of the anticline, consists of the Upper Ordovician Sylvan Shale to the Lower Pennsylvanian Springer and Wapanucka Formations. Block D, which was flown to include the Spears deep test well site, consisted of eight lines. This well is entirely within the Arbuckle Group. The resistivity survey has greatly helped to map major faults between dolomitic limestone and clastic rocks and within the dolomitic limestone. Ground resistivity surveys suggest that, in places, the faults within limestone are zones of lower resistivity and map low resistivity surficial epikarst a few meters thick. Airborne data will be analyzed in more detail to correlate with ground resistivity surveys.
From: Geological Society of America 2007 Abstracts with Programs, v. 39, no. 6.
This study is being funded by USGS (Earth Surface Processes Team and Crustal Imaging and Characterization Team, Denver) and the National Park Service.
40

Geologic map showing survey areas and flight lines of the March 2007 helicopter electromagnetic (HEM) and aeromagnetic survey.
Helicopter and geophysical system. The “bird” is nearly 30 ft long.
41

Gravity and magnetic characterization of faults in the Hunton anticline of the Arbuckle uplift, south-central Oklahoma Daniel Scheirer (USGS, Menlo Park California)
The geological configuration of the Arbuckle Uplift in the vicinity of Chickasaw National Recreation Area (CNRA) in south-central Oklahoma plays a governing role in the occurrence of fresh and mineral springs and artesian wells in and around the park. A confining layer of well-cemented conglomerate lies immediately below the surface of the recreation area, and groundwater migrates from an area of meteoric recharge where rocks of the Arbuckle-Simpson Aquifer crop out as close as two kilometers to the east of the park in the Hunton Anticline. Prominent, Pennsylvanian-aged faults are exposed in the aquifer outcrop, and two of the fault traces project beneath the conglomerate cover toward two groups of springs within the northern section of the park. We conducted gravity fieldwork and analysis to investigate the subsurface extensions of these major faults beneath CNRA. By defining gravity gradient signatures of the faults where they are exposed, we infer that the Sulphur and Mill Creek Faults bend to the southwest where they are buried. The South Sulphur Fault may project westward linearly if it juxtaposes rocks that have a density contrast opposite that of that fault's density configuration in the Sulphur Syncline area. The South Sulphur Fault dips steeply northward, and its normal sense of offset suggests that the Sulphur Syncline is part of a graben. The Mill Creek Fault is vertical, and the Reagan Fault dips southward, consistent with its being mapped as a thrust fault. The Sulphur and Mill Creek Synclines may have formed as pull-apart basins in a left-lateral, left-stepping strike-slip environment. The presence of relatively high-density Precambrian basement rocks in a broader region suggests that significant gravity anomalies may arise from variations in basement topography. High-resolution gravity and ground magnetic data recently (May 2007) collected between the Reagan and Sulphur Faults will improve our characterization of the geophysical signatures of these faults and our understanding of the importance of topography of the basement surface. Recently collected helicopter electromagnetic and aeromagnetic data provide complementary views of the structure and geology.
From: Geological Society of America 2007 Abstracts with Programs, v. 39, no. 6.
(A) Joseph Zume (OWRB) taking notes as he walks with the backpack-mounted magnetic and GPS system in the western Hunton Anticline. (B) Dan Scheirer (USGS), Joseph Zume, and Carlos Uribe (OWRB) configuring the GPS base station.
A report summarizing the fieldwork for this investigation is published as U.S. Geological Survey Open-File Report 2008-1003: Preliminary gravity and ground magnetic data in the Arbuckle Uplift near Sulphur, Oklahoma, by Daniel S. Scheirer and Essam Aboud. [available at http://pubs.usgs.gov/of/2008/1003/]
42

3-D Seismic Survey at Spears Ranch Roger Young (University of Oklahoma, School of Geology and Geophysics) Principal investigators: Randy Keller, Breanne Kennedy, Carlos Russian, Ha Mai (OU); Steve Harder (University of Texas, El Paso)
An experimental 3D seismic survey using dynamite charges and independently deployable (cableless) recorders was attempted in May 2007 at the Spears Ranch. This was a major survey effort made possible by Dr. Randy Keller’s association with EarthScope. Dawson Geophysical provided assistance in designing the survey, and Devon Energy provided financial support. The survey required the assistance of personnel from University of Texas, El Paso (UTEP), in drilling, acquisition, and GPS station location, field personnel from the PASSCAL instrument pool of IRIS at New Mexico Tech, and OU students and faculty.
Approximately 4000 traces were recorded using 110 recorders deployed along a pair of crossed lines, and this data was downloaded and assembled into SEG-Y records. The effort was plagued by difficulty in drilling shotholes to a depth of 10 feet using a rotary/percussion drill designed for hard rock, because the near-surface Arbuckle-Simpson is highly weathered and includes intervals of clay that prevent blowing out cuttings by high-pressure compressed air. Despite the difficulty in drilling shotholes, 2-D NS and an EW lines were recorded as well as a sparse 3-D coverage encompassing the Spears wells. Analysis of the 2-D lines and the 3-D data requires special processing to enhance reflections as strong groundroll and weak reflections characterize the data. The goal of the analysis is to define the depth to basement, image fractures in the carbonates, and identify the seismic signature of karst structures. Modified from: June 2007 and January 2008 Progress Reports for the Arbuckle-Simpson Project to the OWRB.
43
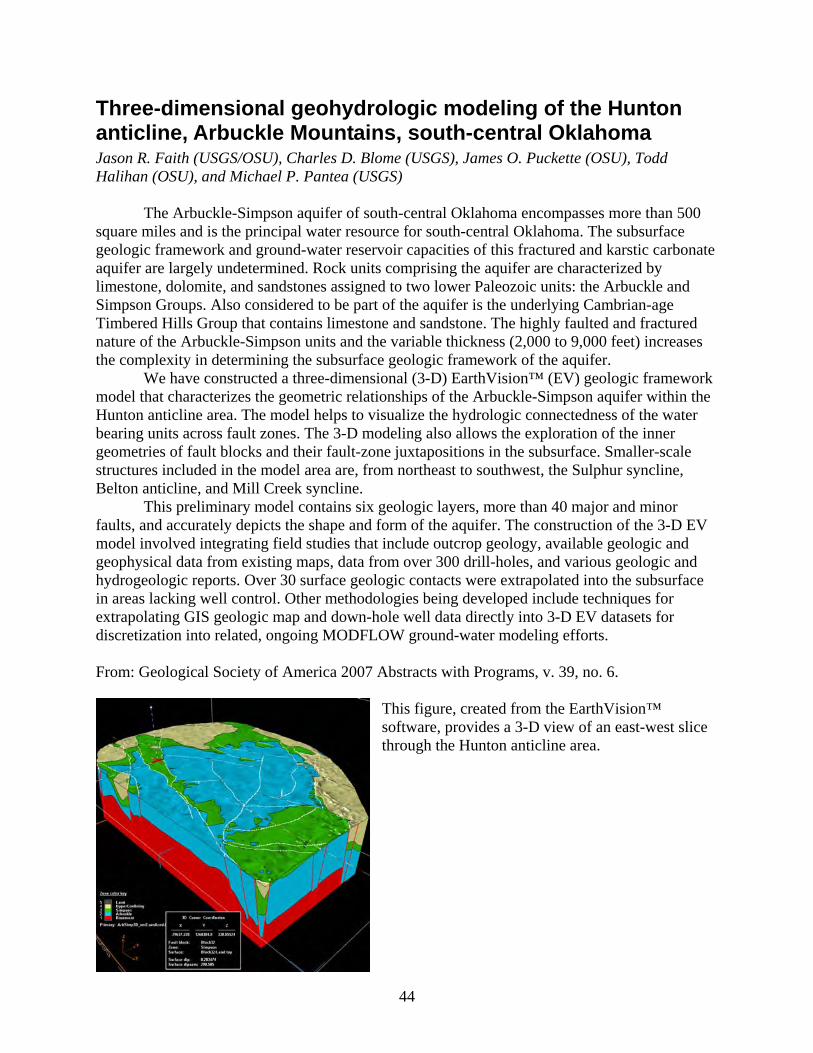
Three-dimensional geohydrologic modeling of the Hunton anticline, Arbuckle Mountains, south-central Oklahoma Jason R. Faith (USGS/OSU), Charles D. Blome (USGS), James O. Puckette (OSU), Todd Halihan (OSU), and Michael P. Pantea (USGS)
The Arbuckle-Simpson aquifer of south-central Oklahoma encompasses more than 500 square miles and is the principal water resource for south-central Oklahoma. The subsurface geologic framework and ground-water reservoir capacities of this fractured and karstic carbonate aquifer are largely undetermined. Rock units comprising the aquifer are characterized by limestone, dolomite, and sandstones assigned to two lower Paleozoic units: the Arbuckle and Simpson Groups. Also considered to be part of the aquifer is the underlying Cambrian-age Timbered Hills Group that contains limestone and sandstone. The highly faulted and fractured nature of the Arbuckle-Simpson units and the variable thickness (2,000 to 9,000 feet) increases the complexity in determining the subsurface geologic framework of the aquifer.
We have constructed a three-dimensional (3-D) EarthVision™ (EV) geologic framework model that characterizes the geometric relationships of the Arbuckle-Simpson aquifer within the Hunton anticline area. The model helps to visualize the hydrologic connectedness of the water bearing units across fault zones. The 3-D modeling also allows the exploration of the inner geometries of fault blocks and their fault-zone juxtapositions in the subsurface. Smaller-scale structures included in the model area are, from northeast to southwest, the Sulphur syncline, Belton anticline, and Mill Creek syncline.
This preliminary model contains six geologic layers, more than 40 major and minor faults, and accurately depicts the shape and form of the aquifer. The construction of the 3-D EV model involved integrating field studies that include outcrop geology, available geologic and geophysical data from existing maps, data from over 300 drill-holes, and various geologic and hydrogeologic reports. Over 30 surface geologic contacts were extrapolated into the subsurface in areas lacking well control. Other methodologies being developed include techniques for extrapolating GIS geologic map and down-hole well data directly into 3-D EV datasets for discretization into related, ongoing MODFLOW ground-water modeling efforts. From: Geological Society of America 2007 Abstracts with Programs, v. 39, no. 6.
This figure, created from the EarthVision™ software, provides a 3-D view of an east-west slice through the Hunton anticline area.
44

Characterization of water-producing zones in the Arbuckle-Simpson aquifer Henry Badra (OWRB/OU), James Puckette (OSU), and Doug Elmore (OU)
Analysis of the rock cuttings obtained from Spears Well #2 helped characterize the geology of the Arbuckle-Simpson aquifer. The majority of the cuttings examined from the well appeared as massive, finely crystalline dolostones with sporadic chert beds and oolitic grainstones. The latter became increasingly common towards the deeper portions of the well, suggesting a possible transition into the Cool Creek formation. However, the Kindblade formation could not be distinguished from the West Spring Creek or Cool Creek.
Analysis of thin sections made from bit cuttings revealed intercrystalline matrix porosity in limestones at shallow depths, as well as vuggy and fluid-induced fracture porosity towards the deeper portions of the well. The major water-producing zones were characterized by an increase in vugs, and an abundance of rhombic dolomite crystals along fractures and on the surface of more finely crystalline dolostones. The presence of sucrosic dolomite as cement between small grains of dolostone or rhombic dolomite crystals was termed “intercrystalline porosity”, and in abundance, it also appeared to suggest recent fluid activity.
A B
Thin section from 360 ft showing (A) dolomite with quartz grains and (B) dolomite with fluid-induced fractures.
CA B
Thin section from 710 ft showing (A) rhombic dolosparite with small vugs; (B) ooids with well-rounded to sub-rounded quartz grain cores, and (C) chert cement.
Modified from: Characterization of water-producing zones in the Arbuckle-Simpson aquifer, Senior thesis, University of Oklahoma, School of Geology and Geophysics, by Henry Badra, 2007.
45

46 46

Hydroclimatic Reconstruction of the Arbuckle-Simpson Aquifer using Tree Rings Aondover Tarhule (Department of Geography, University of Oklahoma)
Executive Summary The annual growth rings in some climate sensitive trees, such as post oaks, mimic the
year-to-year pattern of hydroclimatic variability. Thus, during good years (favorable moisture and temperature conditions) the trees put on wide growth rings, and during stressful years (below average precipitation and temperatures) the trees put on narrow rings. As a result, a statistical relationship developed between a hydroclimatic time series (e.g. seasonal precipitation or stream discharge) and the ring width indices for trees at a particular location permits us to derive estimates of the former using tree rings as proxy. This procedure allows us to extend the length of measured hydroclimatic data series because trees have been around for much longer than we have been measuring hydroclimatic variables. Such long term series are necessary in order to help scientists and policy makers place contemporary hydroclimatic dynamics in their proper historical perspective. Additionally, population growth, increased competition over available water resources, and uncertainty over the future pattern of climatic variability have combined to complicate water resources planning. To address these issues with confidence, scientists and policy makers need data on relevant variables that is much longer than the available instrumental records. Tree rings are especially useful in this regard because the data is annually resolved and precisely calendar dated.
This study developed a 229-year long (1775-2004) post oak (Quercus stellata) tree-ring chronology from living trees for the Arbuckle Simpson aquifer in south central Oklahoma. The chronology agrees very strongly (r=0.553, N=219, p<0.00001) with an existing chronology for the study area that extends from 1700-1995. Combining the two chronologies results in a new 304-year chronology from 1700-2004. This chronology was calibrated against instrumental monthly precipitation, streamflow, temperature, and PDSI data for the Arbuckle Simpson aquifer area. Correlation and response functions analysis was used to determine the specific months and seasons of the year to which tree ring growth corresponds. For each variable, the data for the appropriate months were averaged or combined depending on the variable and used to calibrate the tree ring chronology. After verification using various statistics, the calibration equation was used to reconstruct each variable back to 1700.
The reconstructed series suggests that multi-decadal wet and dry periods have been rare in south-central Oklahoma during the past 300 years. Using the average annual precipitation for the last 30 years (1975-2004) as threshold, the longest period with precipitation less than the threshold interval is 13 years (1854-1866). Other wet and dry periods (relative to the threshold) are on the order of 7-8 years but more common are the events 2-3 years in duration. These events alternate fairly randomly so that there appears to be no systematic pattern or trend in their occurrence. There also is no evidence for increased frequency or duration of wet or dry periods. Perhaps the most remarkable feature of the 304-year reconstructed series is the low variability of hydroclimatic events generally in the second half of the 19th century. Spectral analysis would provide more information about the time-frequency characteristics of wet and dry periods but such analysis is outside the scope of the present investigation.
47

0
2000
4000
6000
8000
10000
12000
14000
16000
18000
1700 1725 1750 1775 1800 1825 1850 1875 1900 1925 1950 1975 2000
Years
Stre
amflo
w (c
fs)
0.00
0.50
1.00
1.50
2.00
TRI
"streamflow""TRI"
0
2000
4000
6000
8000
10000
12000
14000
16000
18000
1700 1725 1750 1775 1800 1825 1850 1875 1900 1925 1950 1975 2000
Years
Stre
amflo
w (c
fs)
"Streamflow (cfs)5 per. Mov. Avg. ("Streamflow (cfs))
(a)
(b)
(a) The reconstructed Blue River streamflow (purple line, left axis) and Tree Ring Index (blue line, right axis). The data points from 1938-2004 are the measured streamflow data. (b) A 5-year moving average superimposed on the streamflow.
From: Hydroclimatic Reconstruction of the Arbuckle-Simpson Aquifer using Tree Rings, draft final report to the Oklahoma Water Resources Board, 2007, by Aondover Tarhule.
48