
AR82 Neutral
8
Considering current world events, the accurate measure- ment of the dynamic pressure associated with air-blast, as well as its effect on structures, is highly important. Yet, the accu- rate measurement of this pressure remains one of the biggest challenges that can be presented to the measurement engineer. This article attempts to provid e guidance to enhance the qual- ity of these measurements. In order to provide this guidance, a large body of the science of dynamic pressure measurement has been both summarized and organized. It is hoped that thi s work will also serve as a reference for other activities where the measurement of dynamic pressure has importance. An explosion in air is a process by which a rapid release of energy generates a pressure wave of finite amplitude. The en- ergy source can be anything that generates a violent reaction when initiated. This includes: chemical or nuclear materials, gases (high pressure gas-storage vessel s, steam boilers), or elec- tricity (spark gap, rapid vaporization of a metal). The proper- ties of air will cause the front of this pressure wave to “shock up” or steepen as the front moves. The result is a shock front moving supersonically , i.e., faster that the sound speed of the air ahead of it, with discontinuities in pressure, density, and particle velocity across the front. Unlike acoustic waves that move at sonic velocity, produce no finite change in particle velocity, and don’t “shock up,” air- blast is a nonlinear process involving nonlinear equations of motion. Air-blast can be encountered in freely expanding shocks in air or, if obstacles enclose the energy source, in di- rected shocks and contained shocks. Examples of all three are shown in Figure 1. A near-ideal explosion that is generated by a spherically sym- metric source, and that occurs in a still, homogeneous atmo- sphere, would result in a pressure-time history similar to the one illustrated in Figure 2. The pressure is at ambient until the air-blast arrives. At this time it instantaneously rises to its peak side-on overpressure, decays back to ambient, drops to a par- tial vacuum, and eventually returns to ambient. Deviations from this ideal waveform are to be expected. Rar- efaction waves occur at the contact surface between the explo- sion products and air; these waves result in modification of the positive shock phase. For caged explosives, any fragment that is generated may have an associated momentum adequate for it to outrun the blast-wave velocity and produce dist urbances before the wave’s arrival. Ground effects due to dust or heat-reflecting surfaces may form a precursor wave. Additionally, if the blast wave has low spe cific energy, it may travel a significant distance before “shocking up.” The inter- action of blast waves with a solid object can result in reflec- tions from the object or cause the waves to reflect from as well as diffract around the object. Figure 3 shows the reflection of strong shock waves from a reflective surface. I 1 , I 2 , and I 3 represent the expanding shock wave, while the R contours represent the respective reflections from the surface. When I 1 just touches the surface S, a reflec- tion occurs that is more than two times I 1 . As the shock wave continues to move outward, the intersection of each I and its corresponding R lies on the dashed line. The incident and re- flected shocks coalesce to form a Mach stem. As the shock expands, the Mach stem grows, eventually encompassing the 2-shock system above it. As the blast wave propagates to greater distances from its source, its magnitude lessens and it decreases in velocity un- til it propagates at the speed of sound. Theoretically, acousti- cal laws could then apply, but meteorological conditions tend to control its properties at long distances. The development of predictive codes and analytical tech- niques for the strength and directional characteristics of blast- waves is highly dependent on experimental measurements. Robust blast-pressur e transducers were not always available to make these measurements; they had to be developed. Much of the early development of these blast-pressure trans- ducers occurred at government laboratories such as the Ballis- tic Research Laboratory (BRL – United States) and Royal Ar- mament Research and Development Establishment (RARDE – United Kingdom) in the 1950s and 1960s. Among the early commercial pressure transducer developers were Atlantic Re- search Corporation, Kaman Nuclear Corporation, Kistler Instru- ment Corporation (where some of its founders subsequently formed PCB Piezotronics), and Shaevitz-Bytrex Corporation. To characterize the time signature of a blast-pressure event, transducers are required for two types of measurements. Side- on transducers (incident) are those that record free field pres- sure at varying distances from the blast source. Their design must minimize interference with the flow behind the shock front. Reflected-pressure transducers are used for measuring pressures reflected at normal or oblique incidence from a rigid surface. Flow and diffraction effects are no longer important. This type of transducer must be mounted so that its sensing surface is flush with the reflecting surface for the shock front. One of the notable pioneers in this field was Mr. Ben Granath who originally worked at BRL and subsequently founded Susquehanna Instruments, a development company for blast transducers. This company is now a part of PCB Piezotronics. Photographs of two transducers, which resulted from Mr. Granath’s work, are provided as Figure 4. In Figure 4A, the pencil probe, is obviously intended for side - on pressures. Its quartz acceleration compensated piezoelec- tric sensing element is built into the housing. The geometry of the contained piezoelectric element, as well as the velocity of the shock front of the blast wave passing over it, control its rise time. This transducer covers a pressure range extending to 1000 psi. The transducer in Figure 4B works on the principle of a pressure bar. Its sensing element is tourmaline, which is inter- faced to an internal bar. The bar is acoustically impedance- matched to the tourmaline, resulting in a 1.5-MHz resonant frequency for the transducer. This model transducer is used for reflected pressure measurements to 20,000 psi. A limitation of the early piezoelectric transducers developed by government labs and/or industry was the influence of the cable on their signal. In hazardous tests, such as those involv- ing explosives, cable lengths of hundreds to thousands of feet are typical. When these cable lengths were employed with charge-sensing circuits, a variety of deleterious effects would result; the principal problems were: Noise generated within the cable due to triboelectric effects. The high cost of special noise-treated cables to eliminate the above effects. A charge sensing amplifier’s noise level, which increases in proportion to cable capacitance, i.e., cable length. All of the aforementioned problems have subsequently been solved with integral-electronics piezoelectric (IEPE) transduc- ers. PCB Piezotronic’s equivalent registered trademark, which predates the IEPE designator , is ‘ICP ® .’ The IEPE configuration converts the transduce r’s output to low impedance , thus elimi- nating triboelectric effects, and it also permits the use of a va- Air-Blast and the Science of Dynamic Pressure Measurements Patrick L. Walter, PCB Piezotronics, Depew, New York and Texas Christian University Fort Worth, Texas T E C H N I C A L I N F O R M A T I O N AR_82 1
-
Upload
tim-stubbs -
Category
Documents
-
view
223 -
download
0
Transcript of AR82 Neutral
8/14/2019 AR82 Neutral
http://slidepdf.com/reader/full/ar82-neutral 1/7
Considering current world events, the accurate measure-ment of the dynamic pressure associated with air-blast, as wellas its effect on structures, is highly important. Yet, the accu-rate measurement of this pressure remains one of the biggestchallenges that can be presented to the measurement engineer.This article attempts to provide guidance to enhance the qual-ity of these measurements. In order to provide this guidance,a large body of the science of dynamic pressure measurementhas been both summarized and organized. It is hoped that thiswork will also serve as a reference for other activities wherethe measurement of dynamic pressure has importance.
An explosion in air is a process by which a rapid release of energy generates a pressure wave of finite amplitude. The en-ergy source can be anything that generates a violent reactionwhen initiated. This includes: chemical or nuclear materials,gases (high pressure gas-storage vessels, steam boilers), or elec-tricity (spark gap, rapid vaporization of a metal). The proper-ties of air will cause the front of this pressure wave to “shockup” or steepen as the front moves. The result is a shock frontmoving supersonically, i.e., faster that the sound speed of theair ahead of it, with discontinuities in pressure, density, andparticle velocity across the front.
Unlike acoustic waves that move at sonic velocity, produceno finite change in particle velocity, and don’t “shock up,” air-
blast is a nonlinear process involving nonlinear equations of motion. Air-blast can be encountered in freely expandingshocks in air or, if obstacles enclose the energy source, in di-rected shocks and contained shocks. Examples of all three areshown in Figure 1.
A near-ideal explosion that is generated by a spherically sym-metric source, and that occurs in a still, homogeneous atmo-sphere, would result in a pressure-time history similar to theone illustrated in Figure 2. The pressure is at ambient until theair-blast arrives. At this time it instantaneously rises to its peakside-on overpressure, decays back to ambient, drops to a par-tial vacuum, and eventually returns to ambient.
Deviations from this ideal waveform are to be expected. Rar-efaction waves occur at the contact surface between the explo-sion products and air; these waves result in modification of thepositive shock phase.
For caged explosives, any fragment that is generated mayhave an associated momentum adequate for it to outrun the blast-wave velocity and produce disturbances before the wave’sarrival. Ground effects due to dust or heat-reflecting surfacesmay form a precursor wave.
Additionally, if the blast wave has low specific energy, it maytravel a significant distance before “shocking up.” The inter-action of blast waves with a solid object can result in reflec-tions from the object or cause the waves to reflect from as wellas diffract around the object.
Figure 3 shows the reflection of strong shock waves from areflective surface. I 1, I 2, and I 3 represent the expanding shockwave, while the R contours represent the respective reflectionsfrom the surface. When I1 just touches the surface S, a reflec-tion occurs that is more than two times I 1. As the shock wave
continues to move outward, the intersection of eachI
and itscorresponding R lies on the dashed line. The incident and re-flected shocks coalesce to form a Mach stem. As the shockexpands, the Mach stem grows, eventually encompassing the2-shock system above it.
As the blast wave propagates to greater distances from itssource, its magnitude lessens and it decreases in velocity un-
til it propagates at the speed of sound. Theoretically, acousti-cal laws could then apply, but meteorological conditions tendto control its properties at long distances.
The development of predictive codes and analytical tech-niques for the strength and directional characteristics of blast-waves is highly dependent on experimental measurements.Robust blast-pressure transducers were not always available tomake these measurements; they had to be developed.
Much of the early development of these blast-pressure trans-ducers occurred at government laboratories such as the Ballis-tic Research Laboratory (BRL – United States) and Royal Ar-mament Research and Development Establishment (RARDE –
United Kingdom) in the 1950s and 1960s. Among the earlycommercial pressure transducer developers were Atlantic Re-search Corporation, Kaman Nuclear Corporation, Kistler Instru-ment Corporation (where some of its founders subsequentlyformed PCB Piezotronics), and Shaevitz-Bytrex Corporation.
To characterize the time signature of a blast-pressure event,transducers are required for two types of measurements. Side-on transducers (incident) are those that record free field pres-sure at varying distances from the blast source. Their designmust minimize interference with the flow behind the shockfront. Reflected-pressure transducers are used for measuringpressures reflected at normal or oblique incidence from a rigidsurface. Flow and diffraction effects are no longer important.This type of transducer must be mounted so that its sensingsurface is flush with the reflecting surface for the shock front.
One of the notable pioneers in this field was Mr. Ben Granathwho originally worked at BRL and subsequently foundedSusquehanna Instruments, a development company for blasttransducers. This company is now a part of PCB Piezotronics.Photographs of two transducers, which resulted from Mr.Granath’s work, are provided as Figure 4.
In Figure 4A, the pencil probe, is obviously intended for side-on pressures. Its quartz acceleration compensated piezoelec-tric sensing element is built into the housing. The geometry of the contained piezoelectric element, as well as the velocity of the shock front of the blast wave passing over it, control its risetime. This transducer covers a pressure range extending to 1000psi. The transducer in Figure 4B works on the principle of apressure bar. Its sensing element is tourmaline, which is inter-
faced to an internal bar. The bar is acoustically impedance-matched to the tourmaline, resulting in a 1.5-MHz resonantfrequency for the transducer. This model transducer is used forreflected pressure measurements to 20,000 psi.
A limitation of the early piezoelectric transducers developed by government labs and/or industry was the influence of thecable on their signal. In hazardous tests, such as those involv-ing explosives, cable lengths of hundreds to thousands of feetare typical. When these cable lengths were employed withcharge-sensing circuits, a variety of deleterious effects wouldresult; the principal problems were: Noise generated within the cable due to triboelectric effects. The high cost of special noise-treated cables to eliminate the
above effects. A charge sensing amplifier’s noise level, which increases in
proportion to cable capacitance, i.e., cable length.All of the aforementioned problems have subsequently beensolved with integral-electronics piezoelectric (IEPE) transduc-ers. PCB Piezotronic’s equivalent registered trademark, whichpredates the IEPE designator, is ‘ICP®.’ The IEPE configurationconverts the transducer’s output to low impedance, thus elimi-nating triboelectric effects, and it also permits the use of a va-
Air-Blast and the Science of
Dynamic Pressure MeasurementsPatrick L. Walter, PCB Piezotronics, Depew, New York and Texas Christian University Fort Worth, Texas
T E C H N I C A L I N F O R M A T I O N AR_82
1

8/14/2019 AR82 Neutral
http://slidepdf.com/reader/full/ar82-neutral 2/7
8/14/2019 AR82 Neutral
http://slidepdf.com/reader/full/ar82-neutral 3/7

8/14/2019 AR82 Neutral
http://slidepdf.com/reader/full/ar82-neutral 4/7
These equations show that there is one crystal axis of quartz(z-axis, 3rd equation) that produces no piezoelectric output
when stress is applied. Figure 10 contains a boule of quartzwith this axis (z) identified. It is possible to manufacture aplacebo blast transducer, i.e., one that produces no piezoelec-tric output, using z-cut quartz.
The placebo transducer can be applied in the test in the samemanner as any of the operational transducers, but it will notrespond to mechanical inputs (pressure, acceleration, strain).Any electrical output from it identifies signal contaminationdue to thermoelectric, photoelectric, electromagnetic, and/ortriboelectric effects. In reality, a signal from the placebo trans-ducer is typically caused by electrical or magnetic noise in-duced effects and indicates that the operational transducers areprobably also similarly contaminated. Triboelectric (i.e., fric-tionally generated) charge effects in cables can be ruled out asa noise source if integral electronics (ICP®) are included within
or at the transducer. This is because, as noted previously, ICP®
converts the transducer to an equivalent low-impedance volt-age source. Just as an electrical signal from a placebo transducerindicates signal contamination, no electrical signal from it in-dicates the effects responsible for the contamination to be ab-sent.
Light intensity should also have no influence on the trans-ducers discussed to date. Thermal effects will subsequently bediscussed as a separate topic.
It remains yet to determine whether strain and/or accelera-tion result in additional contamination of the signal from thepressure transducer. Strain and acceleration have a cause/ef-fect relationship. For example, under pressure induced accel-eration loading, flexural modes of vibration might be excitedin a plate in which a blast pressure transducer is mounted. Theplate’s motion elicits an acceleration response from the trans-ducer by inducing stress in the piezoelectric element of thetransducer, as does the resultant strain.
To identify the combined effect of acceleration and strain onthe piezoelectric element, we take an operational transducerand isolate it from the desired pressure environment. It be-comes a ‘check’ channel. The right-hand portion of Figure 11shows the field application of a ‘check’ transducer. An opera-tional transducer is mounted per the manufacturer’s specifi-cations in a hole dimensioned deep enough to prevent thetransducer from making contact. If necessary, a small weep-hole can be drilled into the hole from the back surface of theplate to assure that no pressure build-up occurs due to flexingunder pressure loads of the material in front of the transducer
diaphragm. Any signal output from the check channel in ex-cess of that produced by the placebo transducer is noise in-duced by strain and/or acceleration.
Under no circumstances can the undesired response fromeither the placebo transducer or ‘check’ channel be ‘subtracted’from the signal of the pressure measuring transducer(s) as adata correction scheme. This is because the undesired environ-ments contained in the pressure transducer(s) signals are spa-tially distributed across the test item. Thus, phasing errorswould occur. The next several paragraphs, up to and includ-ing Figure 11, outline the process(es) and analysis that must
be undertaken in order to replicate the effect of the ‘subtrac-tion’ if it could legitimately occur.
The combination of the placebo transducer and the ‘check’transducer allows us to document almost all of the aforemen-
tioned undesired responses with the noted exception of ther-mal effects due to transient temperature. The Model 134 BlastProbe (Figure 4) is principally used to define the fast-rise-timeshock front. Due to the acoustic wave-guide principle on whichthe probe operates, a thin layer of black tape on its front faceis required to mitigate thermal inputs to its very thin tourma-line crystal. This transducer is not intended to record the en-
tire pressure-time history of the blast pulse. Adding additionaltape at the probe’s front boundary will provide greater thermaldelay, but will also result in increased mechanical impedance,which degrades performance. Thus, its application is limitedto short record times. Longer record times, such as those re-quired for the total pressure impulse, necessitate a transducerwith a mechanical configuration like that shown in Figure 5.Fortunately a transducer made like Figure 5 produces a veryrecognizable signature when a transient thermal input createsa problem. A thermal transient initially couples into and causesvarious dimensional changes followed by expansion of thepreload sleeve containing the quartz crystal assembly. The
byproduct of this later expansion shows up as a positive (i.e.,nonreturn to zero) signal residing after the blast event is clearlyover.
Every manufacturer’s transducers will respond to these un-desired environments. However, some respond much less thanothers. The question is: “How do you manage or mitigate theseresponses?” Limited examples follow.
Thermal transient responses must be mitigated by applica-tion of ceramic or RTV coatings on the face of the transducerdiaphragm. These provide a thermal delay, hopefully until the
blast event is over. Reference 5 provides one such quantitativestudy of time delays that are achievable.
Figure 11 (left side) shows how a strain-induced signal can be eliminated as a noise source through mechanical isolation,in this case, via a concentric groove machined around the trans-ducer to interrupt the strain transmission path. Low-densityfoam can be used to fill this groove to prevent a discontinuityto the flow of the blast products.
Previously, Figure 5 showed how essentially building anaccelerometer within the pressure transducer, if its output isadded in opposition to the acceleration response of the pres-sure-sensing element, could minimize acceleration effects. If
the acceleration-compensation mass is further adjusted, thesensor’s frequency response is also enhanced. This is called“frequency tailoring.”
Elimination of those noise-induced signals uniquely identi-fied by the placebo transducer would likely occur through at-tention to proper grounding and shielding. It should be notedthat electrostatic shielding materials (e.g., copper, aluminum)
P d d d
P
xx xx yy zz yz zx xy
yy xx yy zz
= - + + + +
= + + +
11 11 140 0 0
0 0 0
s s s t t t
s s s 00 2
0 0 0 0 0 0
14 11t t t
s s s t t t
yz zx xy
zz xx yy zz yz zx xy
d d
P
- -
= + + + + +
(3)
Figure 10. Quartz boule with linear and rotational axes’ directions iden-tified.
Figure 11. Strain isolated pressure transducer left – isolated ‘check’ transducer right.
T E C H N I C A L I N F O R M A T I O N AR_82
4
8/14/2019 AR82 Neutral
http://slidepdf.com/reader/full/ar82-neutral 5/7
are very poor electromagnetic shielding materials.As can be seen, once documented, the various undesired
responses require individual noise-reduction solutions. Afteradditional tests in which both the placebo and ‘check’ trans-ducers produce no output, the pressure signals on the otherdata channels can be considered validated. That is, all the re-
corded data can now be considered to be the appropriate re-sponse of the pressure transducer(s) to the pressure environ-ment alone.
Getting the Signal Down the CableThus far, we have provided an understanding of the air blast
environment and the operation of transducers intended tomeasure it. We went on to describe how to mount these trans-ducers to optimize their dynamic response and how to validatethe resultant signal output from the transducers. These consid-erations alone don’t guarantee success unless we are able totransmit the signal down the cable with fidelity. Since, asmentioned previously, hundreds or thousands of feet of cablecan be involved, signal distortion can occur.
For the following discussion, the consideration of a lossless
transmission line (one whose resistance is ignored) will suf-fice. A voltage signal V going down the line is a function of bothspace (z) and time (t), i.e., v = v (z,t ). Its equation can be givenas:6
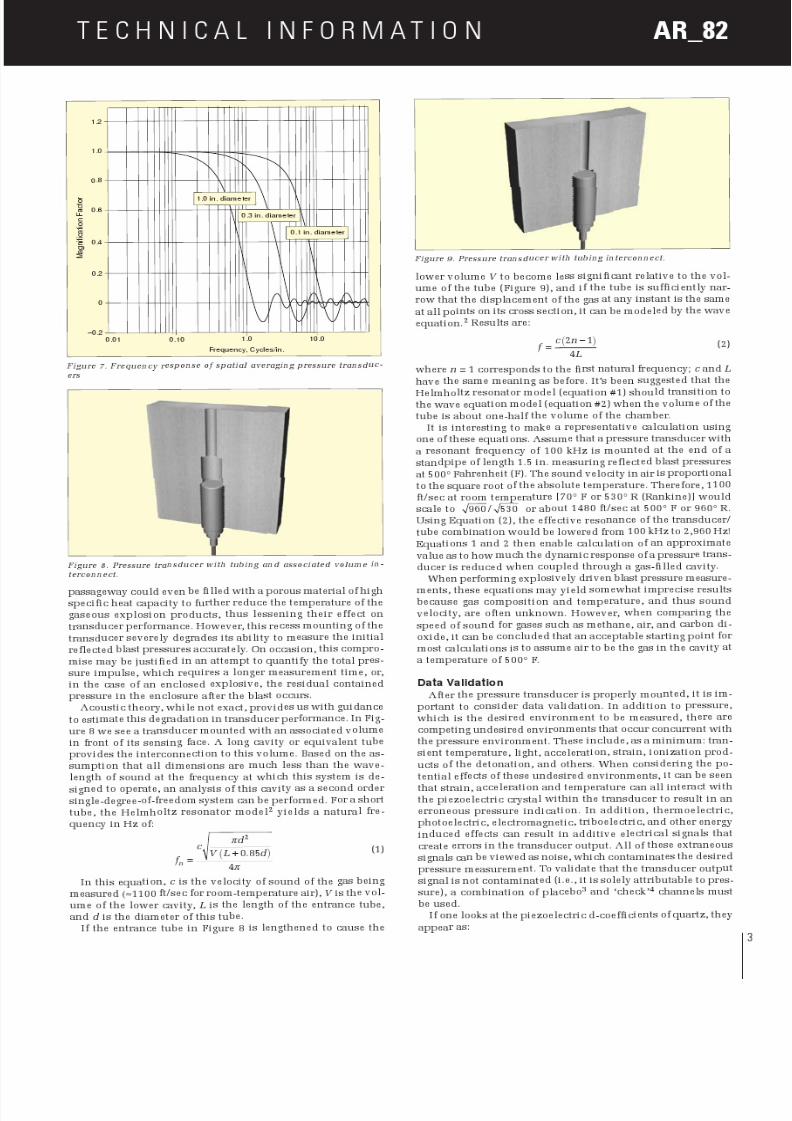
where l and c are the line inductance and capacitance per unitlength. This is the classical wave equation that governs manyother physical phenomena such as stress wave transmission ina bar and acoustic wave transmission in an organ pipe. Byanalogy, has a dimension of velocity.
Many facilities, where air-blast testing is performed, alsomeasure and record data from strain gages and other bridge typecircuits. Therefore, 4-wire shielded cable is typically used. Arepresentative instrumentation cable could be: Belden7 non-paired #82418, 4-conductor, 18 AWG, fluorinated ethylenepropylene insulation, Beldfoid® shielded, with an inductanceof 0.15 mH/ft and a conductor-to-conductor capacitance of 30pF/ft. Using the above equation ( ) to calculate the propa-gation velocity for this cable results in 0.47 ¥ 109 ft/sec orroughly 0.5 the speed of light.
The characteristic impedance for a lossless line is expressedas , which for the preceding cable can be calculated to be70.7 ohms. If the connecting cable is terminated properly( ), there will be no reflections at high frequen-cies. However, if the cable is not terminated properly (e.g., if it operates directly into a high impedance amplifier (typicallyR ≥ 1 MW)), reflections can occur. The first reflection will oc-cur at a frequency f corresponding to a wavelength l equal tofour (4) times the cable length.
As an example, arbitrarily pick the highest signal frequencyof interest to be 100,000 Hz. The corresponding wavelength is:
Thus, a cable length of (4700/4) or 1175 feet will result inoscillations at a frequency of 100,000 Hz. In addition, signalfidelity can only be maintained to approximately 20,000 Hz,which is one-fifth the frequency of oscillation.
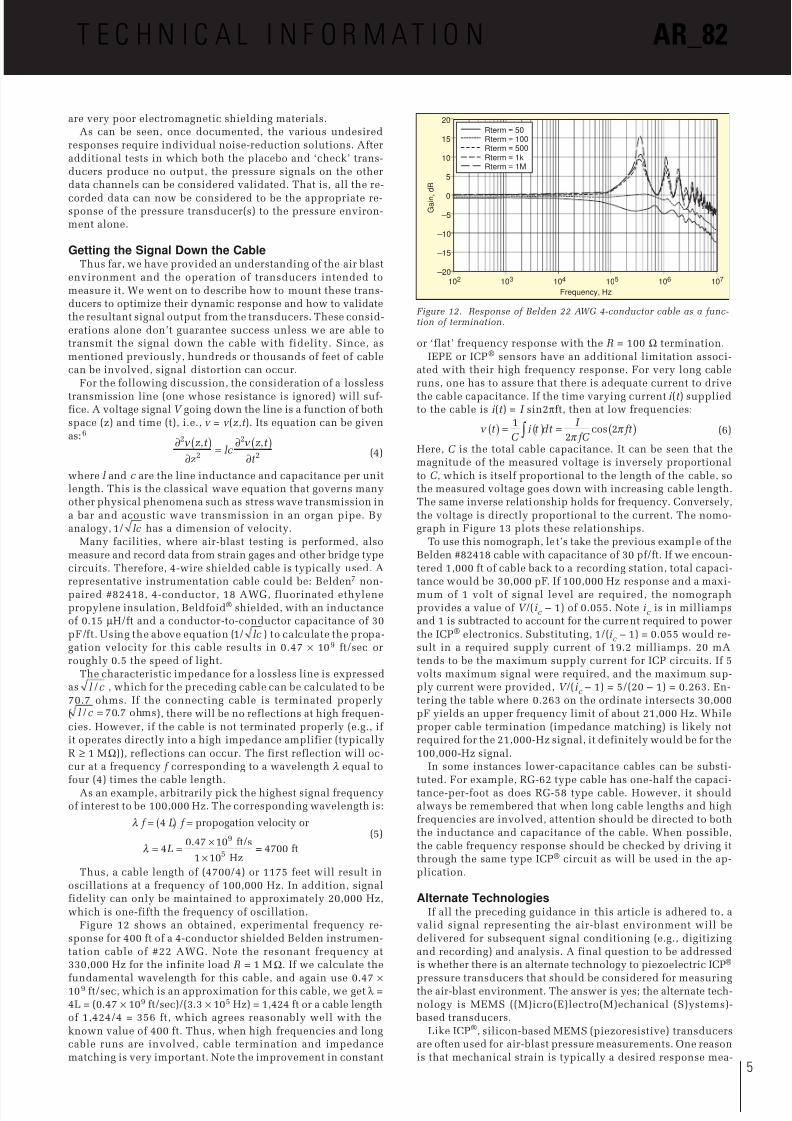
Figure 12 shows an obtained, experimental frequency re-sponse for 400 ft of a 4-conductor shielded Belden instrumen-tation cable of #22 AWG. Note the resonant frequency at330,000 Hz for the infinite load R = 1 MW. If we calculate the
fundamental wavelength for this cable, and again use 0.47 ¥109 ft/sec, which is an approximation for this cable, we get l =4L = (0.47 ¥ 109 ft/sec)/(3.3 ¥ 105 Hz) = 1,424 ft or a cable lengthof 1,424/4 = 356 ft, which agrees reasonably well with theknown value of 400 ft. Thus, when high frequencies and longcable runs are involved, cable termination and impedancematching is very important. Note the improvement in constant
or ‘flat’ frequency response with the R = 100 W termination.IEPE or ICP® sensors have an additional limitation associ-
ated with their high frequency response. For very long cableruns, one has to assure that there is adequate current to drive
the cable capacitance. If the time varying current i (t ) suppliedto the cable is i (t ) = I sin2pft, then at low frequencies:
Here, C is the total cable capacitance. It can be seen that themagnitude of the measured voltage is inversely proportionalto C , which is itself proportional to the length of the cable, sothe measured voltage goes down with increasing cable length.The same inverse relationship holds for frequency. Conversely,the voltage is directly proportional to the current. The nomo-graph in Figure 13 plots these relationships.
To use this nomograph, let’s take the previous example of theBelden #82418 cable with capacitance of 30 pf/ft. If we encoun-tered 1,000 ft of cable back to a recording station, total capaci-tance would be 30,000 pF. If 100,000 Hz response and a maxi-mum of 1 volt of signal level are required, the nomographprovides a value of V /(i c – 1) of 0.055. Note i c is in milliampsand 1 is subtracted to account for the current required to powerthe ICP® electronics. Substituting, 1/(i c – 1) = 0.055 would re-sult in a required supply current of 19.2 milliamps. 20 mAtends to be the maximum supply current for ICP circuits. If 5volts maximum signal were required, and the maximum sup-ply current were provided, V /(i c – 1) = 5/(20 – 1) = 0.263. En-tering the table where 0.263 on the ordinate intersects 30,000pF yields an upper frequency limit of about 21,000 Hz. Whileproper cable termination (impedance matching) is likely notrequired for the 21,000-Hz signal, it definitely would be for the100,000-Hz signal.
In some instances lower-capacitance cables can be substi-tuted. For example, RG-62 type cable has one-half the capaci-tance-per-foot as does RG-58 type cable. However, it shouldalways be remembered that when long cable lengths and highfrequencies are involved, attention should be directed to boththe inductance and capacitance of the cable. When possible,the cable frequency response should be checked by driving itthrough the same type ICP® circuit as will be used in the ap-plication.
Alternate TechnologiesIf all the preceding guidance in this article is adhered to, a
valid signal representing the air-blast environment will bedelivered for subsequent signal conditioning (e.g., digitizingand recording) and analysis. A final question to be addressedis whether there is an alternate technology to piezoelectric ICP®
pressure transducers that should be considered for measuringthe air-blast environment. The answer is yes; the alternate tech-nology is MEMS ((M)icro(E)lectro(M)echanical (S)ystems)-
based transducers.Like ICP®, silicon-based MEMS (piezoresistive) transducers
are often used for air-blast pressure measurements. One reasonis that mechanical strain is typically a desired response mea-
∂ ( )
∂=
∂ ( )
∂
2
2
2
2
n n z t
zlc
z t
t
, ,(4)
l
l
f L f
L
= ( ) =
= =¥
¥
4
40 47 10
1 10
9
5
propogation velocity or
ft/s
Hz
.== 4700 ft
(5)
1/ lc
1/ lc
l c/
l c/ .= 70 7 ohms
Figure 12. Response of Belden 22 AWG 4-conductor cable as a func-tion of termination.
–20
–15
–10
–5
0
5
10
15
20
102 103 104 105 106 107
Frequency, Hz
G a i n ,
d B
Rterm = 50Rterm = 100Rterm = 500Rterm = 1kRterm = 1M
v t C
i t dt I
fC ft ( ) = ( ) = ( )Ú
1
22
p p cos (6)
T E C H N I C A L I N F O R M A T I O N AR_82
5

8/14/2019 AR82 Neutral
http://slidepdf.com/reader/full/ar82-neutral 6/7
surement when structures are loaded by an air-blast. Therefore,strain-gage signal conditioning, i.e., differential amplifiers andpower supplies, are usually already in place at the test facil-ity, and these same signal conditioning devices can be applieddirectly to MEMS pressure transducers. This interoperability,not to mention the ease with which MEMS sensors can be stati-
cally calibrated, certainly encourages their utilization.This section attempts to objectively compare strengths and
weaknesses of MEMS and ICP® type pressure transducers fo-cused only on their applicability to the air-blast environment.The analysis considers erroneous responses to the undesiredstimuli that accompany air-blasts, which as previously noted,include as a minimum: thermal transients, light, acceleration/strain, and ionization products of the explosion. In addition,the transducer performance parameters of dynamic range, rug-gedness/survivability, frequency response, and self-check areexamined. We will deal with these issues one at a time in whatthis author considers their order of importance.
Thermal transients. Reference 8 discusses challenges en-countered due to thermal-transient sensitivity of MEMS pres-sure transducers. Heat transfer by conduction, convection, and
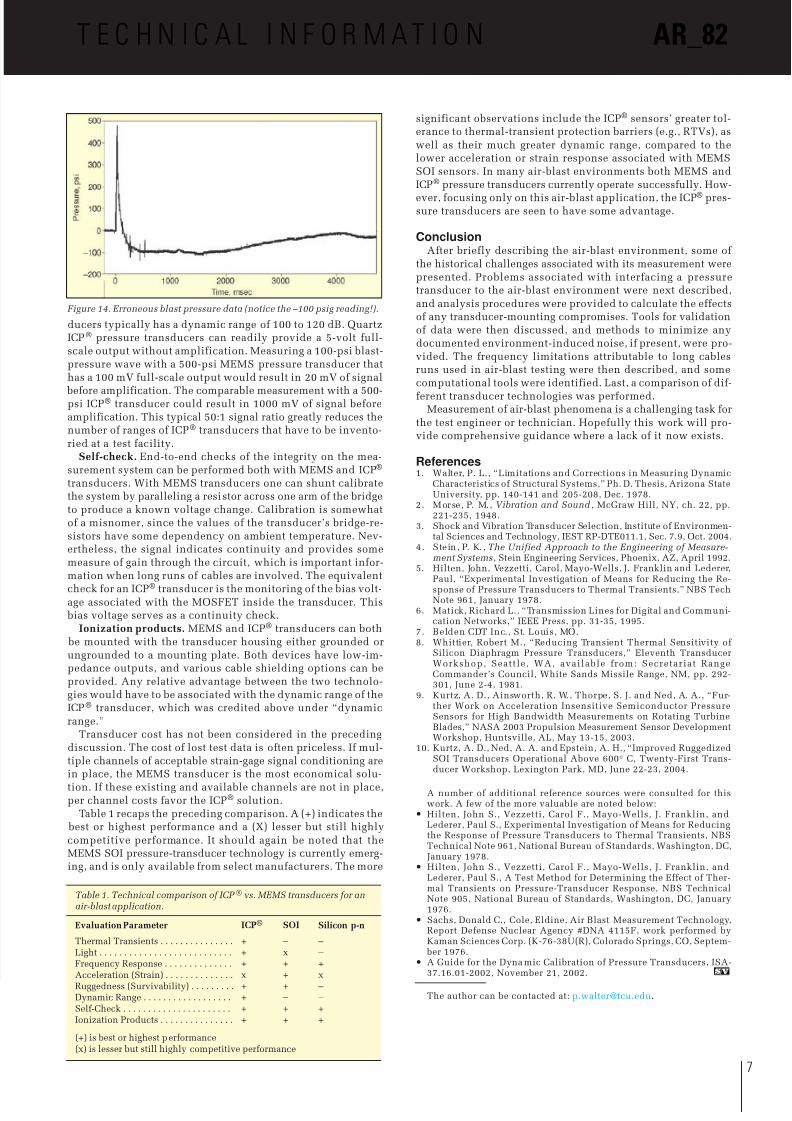
radiation results in the individual strain-elements of the pres-sure transducer’s diaphragm encountering spatially distributedtemperatures. These temperatures change with time and aredifferent than that of their supporting structure. In addition,thermally induced distortion (e.g., bending) of the diaphragmcan occur. The results of these combined effects are both a zero-shift and a change in sensitivity of the transducer. Figure 14shows a pressure-time record acquired from a MEMS trans-ducer in a contained explosive environment. This measurementwas affected by thermal-transient stimuli.
Methods to mitigate thermal-transient response (as describedin reference 8) include (1) a protective or shadowing screenover the diaphragm, (2) opaque grease in front of the dia-phragm, and (3) the addition of an opaque material that adheresto the diaphragm such as black tape or RTV. Metallic coatingscan also be added to the front of the diaphragm. All of these‘fixes’ degrade the frequency response (discussed below) of thetransducer to some extent as a byproduct of delaying the ther-mal transient.
References 9 and 10 describe recent advances using MEMS“silicon-on-insulator” (SOI) pressure transducer technology.This technology enables steady-state operation at temperaturesto greater than 1000° F, while also enhancing transducer per-formance in thermal-transient environments.
The initial effect of transient temperature on quartz ICP®
pressure transducers is to cause internal component dimen-sional changes (see Figure 5), which ultimately result in a par-tial release of the preload within the stack of quartz plates. Therelease of this preload results in an error in the pressure trans-
ducer output and a false indication of a positive pressure afterthe pressure event is over. A RTV coating is usually placed onthe diaphragm of the transducer to provide a barrier to ther-mal transients. Coatings , placed on either MEMS or ICP® trans-ducers, typically delay the thermal transient for no more thana few 10s of milliseconds.
Light. Reference 8 also discusses light-sensitivity of silicontransducers. This is of interest because light-intensity increaseswith proximity to the air-blast. Silicon-diaphragm pressuretransducers absorb short-wavelength electromagnetic radiationin the wavelength range between 3,000 to 10,000 A, most of which is in the visible spectrum. The temporary results arephotoconduction as well as a photo diode effect in the junc-tion isolation between the gages and the bulk material. Refer-ence 8 concludes, “flash sensitivities of silicon diaphragms
vary widely from unit to unit, and it is rather easy to obtain afull-scale output from a flash of light.”Again, since the publication of Reference 8, more recent SOI
technology9,10, used by select manufacturers, has greatly mini-mized transducer response attributable to light. By compari-son, quartz ICP® technology has no sensitivity to light.
Frequency Response. MEMS pressure transducers typically
possess a maximum resonant frequency of 100 to 200 kHz atpressures under 100 psi extending to a 1 MHz resonance at1,000 psi. Quartz ICP® transducers possess resonant frequen-cies of 300 to 400 kHz over this same pressure range. Frequencytailoring (mentioned previously in this article) extends theuseable frequency response of quartz ICP® transducers. In ad-dition, they do not require screens and are not influenced bythe addition of coatings or RTVs to their diaphragms. MEMStransducers, in ranges less than 100 psi, typically find theirfrequency response degraded by the addition of thermal pro-tective coatings to their diaphragms. This occurs due to the lowdensity of silicon and the thinner diaphragms necessitated atthe lower pressure-ranges. All quartz ICP® pressure transduc-ers are extremely rigid, so as to be virtually unaffected by coat-ings.
Acceleration (Strain). As noted earlier, blast loading of thehousing of a structure in which a pressure transducer ismounted creates motion of the structure and, additionally, in-
duces mechanical strain into it. The lower profile of the MEMSsilicon diaphragm assembly (< 0.015 in. thick), along with thehigh modulus/density ratio of silicon (approximately 3 timesthat of steel), minimizes the acceleration response of MEMSpressure transducers. In addition, some MEMS SOI technology,analogous to ICP® technology, incorporates a 2nd transducerfor acceleration compensation. When acceleration compensa-tion is provided, the acceleration sensitivity of ICP® transduc-ers is also very small; however, the larger, more complex struc-ture of their sensing element (Figure 5) makes them moresensitive to strain coupling.
Ruggedness (Survivability). MEMS pressure transducers arespecified with ranges to 30,000 psi, and, historically, withstated over-range capabilities of 2 or 3 times full-scale, with-out damage. Currently, select MEMS transducers9 are being
fabricated with mechanical over-range stops to increase thiscapability. Quartz ICP® transducers are specified with rangesto 200,000 psi, with over-range capability in some instances of 200 times full-scale.
Dynamic range. MEMS pressure transducers typically pro-vide an output signal of 100 to 200 millivolts without amplifi-cation. The basic piezoelectric sensing element in ICP® trans-
Figure 13. Nomograph showing effect of frequency and cable capaci-tance on ICP ® signal output.
1 0 0 p f 2 0 0 p f 3 0 0 p f
1 0 0 0 p f 2
0 0 0 p f 3 0 0 0 p f
5 0 0 0 p f 1 0 , 0 0 0 p f
2 0 , 0 0 0 p f
3 0 , 0 0 0 p f
5 0 , 0 0 0 p f
1 0 0 , 0 0 0 p f
5 0 0 p f
10.0
( R a t i o o f m a x o u t p u t v o l t a g e f r o m
s e n s o r t o a v a i l a b l e c o n s t a n t c u r r e n t )
V
I C
–1
Frequency, Hz
1.00
0.10
0.0101k 10k 100k 300k
fmax = Maximum frequency given the following characteristics
C = Cable capacitance (pF)V = Maximum output voltage from sensor (volts)I = Constant current level from power unit (mA)109 = Scalar factor to equate units
T E C H N I C A L I N F O R M A T I O N AR_82
6
8/14/2019 AR82 Neutral
http://slidepdf.com/reader/full/ar82-neutral 7/7
Figure 14. Erroneous blast pressure data (notice the –100 psig reading!).
ducers typically has a dynamic range of 100 to 120 dB. QuartzICP® pressure transducers can readily provide a 5-volt full-scale output without amplification. Measuring a 100-psi blast-pressure wave with a 500-psi MEMS pressure transducer thathas a 100 mV full-scale output would result in 20 mV of signal
before amplification. The comparable measurement with a 500-psi ICP® transducer could result in 1000 mV of signal beforeamplification. This typical 50:1 signal ratio greatly reduces thenumber of ranges of ICP® transducers that have to be invento-ried at a test facility.
Self-check. End-to-end checks of the integrity on the mea-surement system can be performed both with MEMS and ICP®
transducers. With MEMS transducers one can shunt calibratethe system by paralleling a resistor across one arm of the bridgeto produce a known voltage change. Calibration is somewhatof a misnomer, since the values of the transducer’s bridge-re-sistors have some dependency on ambient temperature. Nev-ertheless, the signal indicates continuity and provides somemeasure of gain through the circuit, which is important infor-mation when long runs of cables are involved. The equivalent
check for an ICP® transducer is the monitoring of the bias volt-age associated with the MOSFET inside the transducer. This
bias voltage serves as a continuity check.Ionization products. MEMS and ICP® transducers can both
be mounted with the transducer housing either grounded orungrounded to a mounting plate. Both devices have low-im-pedance outputs, and various cable shielding options can beprovided. Any relative advantage between the two technolo-gies would have to be associated with the dynamic range of theICP® transducer, which was credited above under “dynamicrange.”
Transducer cost has not been considered in the precedingdiscussion. The cost of lost test data is often priceless. If mul-tiple channels of acceptable strain-gage signal conditioning arein place, the MEMS transducer is the most economical solu-
tion. If these existing and available channels are not in place,per channel costs favor the ICP® solution.
Table 1 recaps the preceding comparison. A (+) indicates the best or highest performance and a (X) lesser but still highlycompetitive performance. It should again be noted that theMEMS SOI pressure-transducer technology is currently emerg-ing, and is only available from select manufacturers. The more
significant observations include the ICP® sensors’ greater tol-erance to thermal-transient protection barriers (e.g., RTVs), aswell as their much greater dynamic range, compared to thelower acceleration or strain response associated with MEMSSOI sensors. In many air-blast environments both MEMS andICP® pressure transducers currently operate successfully. How-
ever, focusing only on this air-blast application, the ICP® pres-sure transducers are seen to have some advantage.
Conclusion
After briefly describing the air-blast environment, some of the historical challenges associated with its measurement werepresented. Problems associated with interfacing a pressuretransducer to the air-blast environment were next described,and analysis procedures were provided to calculate the effectsof any transducer-mounting compromises. Tools for validationof data were then discussed, and methods to minimize anydocumented environment-induced noise, if present, were pro-vided. The frequency limitations attributable to long cablesruns used in air-blast testing were then described, and somecomputational tools were identified. Last, a comparison of dif-
ferent transducer technologies was performed.Measurement of air-blast phenomena is a challenging task for
the test engineer or technician. Hopefully this work will pro-vide comprehensive guidance where a lack of it now exists.
References1. Walter, P. L., “Limitations and Corrections in Measuring Dynamic
Characteristics of Structural Systems,” Ph. D. Thesis, Arizona StateUniversity, pp. 140-141 and 205-208, Dec. 1978.
2. Morse, P. M., Vibration and Sound , McGraw Hill, NY, ch. 22, pp.221-235, 1948.
3. Shock and Vibration Transducer Selection, Institute of Environmen-tal Sciences and Technology, IEST RP-DTE011.1, Sec. 7.9, Oct. 2004.
4. Stein, P. K., The Unified Approach to the Engineering of Measure-ment Systems, Stein Engineering Services, Phoenix, AZ, April 1992.
5. Hilten, John, Vezzetti, Carol, Mayo-Wells, J. Franklin and Lederer,Paul, “Experimental Investigation of Means for Reducing the Re-
sponse of Pressure Transducers to Thermal Transients,” NBS TechNote 961, January 1978.
6. Matick, Richard L., “Transmission Lines for Digital and Communi-cation Networks,” IEEE Press, pp. 31-35, 1995.
7. Belden CDT Inc., St. Louis, MO.8. Whittier, Robert M., “Reducing Transient Thermal Sensitivity of
Silicon Diaphragm Pressure Transducers,” Eleventh TransducerWorkshop, Seattle, WA, available from: Secretariat RangeCommander’s Council, White Sands Missile Range, NM, pp. 292-301, June 2-4, 1981.
9. Kurtz, A. D., Ainsworth, R. W., Thorpe, S. J. and Ned, A. A., “Fur-ther Work on Acceleration Insensitive Semiconductor PressureSensors for High Bandwidth Measurements on Rotating TurbineBlades,” NASA 2003 Propulsion Measurement Sensor DevelopmentWorkshop, Huntsville, AL, May 13-15, 2003.
10. Kurtz, A. D., Ned, A. A. and Epstein, A. H., “Improved RuggedizedSOI Transducers Operational Above 600° C, Twenty-First Trans-ducer Workshop, Lexington Park, MD, June 22-23, 2004.
A number of additional reference sources were consulted for thiswork. A few of the more valuable are noted below:
Hilten, John S., Vezzetti, Carol F., Mayo-Wells, J. Franklin, andLederer, Paul S., Experimental Investigation of Means for Reducingthe Response of Pressure Transducers to Thermal Transients, NBSTechnical Note 961, National Bureau of Standards, Washington, DC,
January 1978. Hilten, John S., Vezzetti, Carol F., Mayo-Wells, J. Franklin, and
Lederer, Paul S., A Test Method for Determining the Effect of Ther-mal Transients on Pressure-Transducer Response, NBS TechnicalNote 905, National Bureau of Standards, Washington, DC, January1976.
Sachs, Donald C., Cole, Eldine, Air Blast Measurement Technology,Report Defense Nuclear Agency #DNA 4115F, work performed byKaman Sciences Corp. (K-76-38U(R), Colorado Springs, CO, Septem-
ber 1976. A Guide for the Dyna mic Calibration of Pressure Transducers, ISA-
37.16.01-2002, November 21, 2002.
The author can be contacted at: [email protected].
Evaluation Parameter
Thermal Transients . . . . . . . . . . . . . . .Light . . . . . . . . . . . . . . . . . . . . . . . . . . .Frequency Response . . . . . . . . . . . . . .Acceleration (Strain) . . . . . . . . . . . . . .Ruggedness (Survivability) . . . . . . . . .Dynamic Range . . . . . . . . . . . . . . . . . .Self-Check . . . . . . . . . . . . . . . . . . . . . .Ionization Products . . . . . . . . . . . . . . .
ICP®
+++x++++
SOI
–x+++–++
Silicon p-n
––+x––++
(+) is best or highest performance(x) is lesser but still highly competitive performance
Table 1. Technical comparison of ICP ® vs. MEMS transducers for anair-blast application.
T E C H N I C A L I N F O R M A T I O N AR_82
7