AR7001-Financials11 7/10/07 8:34 PM Page 9 -...
80
Financial Section
Transcript of AR7001-Financials11 7/10/07 8:34 PM Page 9 -...

Financial Section
AR7001-Financials11 7/10/07 8:34 PM Page 9

This page is intentionally left blank.
AR7001-Financials12 7/10/07 8:34 PM Page 10

11M E T R O P O L I T A N T R A N S P O R T A T I O N A U T H O R I T Y
Independent Auditors’ Report
INDEPENDENT AUDITORS’ REPORT
To the Members of the Board ofMetropolitan Transportation AuthorityWe have audited the accompanying consolidated balance sheets of the Metropolitan Transportation Authority(the “MTA”), a component unit of the State of New York, as of December 31, 2006 and 2005, and theconsolidated statements of revenues, expenses and changes in net assets, and consolidated cash flows for theyears then ended. These consolidated financial statements are the responsibility of the MTA’s management. Ourresponsibility is to express an opinion on the consolidated financial statements based on our audits. We did notaudit the financial statements of the New York City Transit Authority (“MTA New York City Transit”), StatenIsland Rapid Transit Operating Authority (“MTA Staten Island Railway”), and the Metropolitan Suburban BusAuthority (“MTA Long Island Bus”), which represent 54 percent and 55 percent, and 43 percent and 42percent, of the assets and revenues of the MTA, respectively, as of and for the years ended December 31, 2006and 2005. Those financial statements were audited by other auditors whose reports thereon have been furnishedto us, and our opinion, insofar as it relates to the amounts included for MTA New York City Transit, MTAStaten Island Railway and MTA Long Island Bus, is based solely on the reports of the other auditors.We conducted our audits in accordance with auditing standards generally accepted in the United States ofAmerica. Those standards require that we plan and perform the audit to obtain reasonable assurance aboutwhether the consolidated financial statements are free of material misstatement. An audit includes considerationof internal control over financial reporting as a basis for designing audit procedures that are appropriate in thecircumstances, but not for the purpose of expressing an opinion on the effectiveness of the MTA’s internalcontrol over financial reporting. Accordingly, we express no such opinion. An audit also includes examining, ona test basis, evidence supporting the amounts and disclosures in the consolidated financial statements. An auditalso includes assessing the accounting principles used and significant estimates made by management, as wellas evaluating the overall consolidated financial statement presentation. We believe that our audits and thereports of other auditors provide a reasonable basis for our opinion.In our opinion, based on our audits and the reports of other auditors, the consolidated financial statementsreferred to above present fairly, in all material respects, the respective consolidated balance sheets of the MTA,as of December 31, 2006 and 2005, and the respective changes in the consolidated statements of revenues,expenses and changes in net assets, and consolidated cash flows, thereof for the years then ended in conformitywith accounting principles generally accepted in the United States of America.The Management’s Discussion and Analysis on pages 12 through 25 is not a required part of the basicconsolidated financial statements but is supplementary information required by the Governmental AccountingStandards Board. This supplementary information is the responsibility of the MTA’s management. We and theother auditors have applied certain limited procedures, which consisted principally of inquiries of managementregarding the methods of measurement and presentation of the supplementary information. However, we didnot audit the information and express no opinion on it.Our audits were conducted for the purpose of forming an opinion on the MTA’s basic consolidated financialstatements. The introductory section, statistical section, schedule of pension funding progress, schedule offinancial plan to financial statements reconciliation, schedule of consolidated reconciliation between financialplan and financial statements, and schedule of consolidated subsidy accrual reconciliation between financialplan and financial statements are presented for purposes of additional analysis and are not a required part of thebasic consolidated financial statements. This supplementary information is the responsibility of the MTA’smanagement. The schedule of pension funding progress has been subjected to the auditing procedures appliedby us and the other auditors in the audit of the basic consolidated financial statements and, in our opinion,based on our audits and the reports of other auditors, is fairly stated in all material respects in relation to thebasic consolidated financial statements taken as a whole. The introductory section, schedule of financial plan tofinancial statements reconciliation, schedule of consolidated reconciliation between financial plan and financialstatements, schedule of consolidated subsidy accrual reconciliation between financial plan and financialstatements, and the statistical section have not been subjected to the auditing procedures applied in the audits ofthe basic consolidated financial statements and, accordingly, we express no opinion on them.
April 20, 2007
AR7001-Financials13 7/10/07 8:35 PM Page 11

12 M E T R O P O L I T A N T R A N S P O R T A T I O N A U T H O R I T Y
1—Overview of the Financial Statements
Introduction
This report consists of four parts: Management’s Discussion and Analysis (“MD&A”), Consolidated FinancialStatements, Notes to the Consolidated Financial Statements, and Supplementary Information.
Consolidated Financial Statements include:
Consolidated Balance Sheets which provide information about the nature and amounts of investments in resources(assets) and the obligations to the Metropolitan Transportation Authority (the “MTA”) creditors (liabilities), with thedifference between the two reported as net assets.
Consolidated Statements of Revenues, Expenses and Changes in Net Assets which provide information about theMTA’s changes in net assets for the period then ended and accounts for all of the period’s revenues and expenses,measures the success of the MTA’s operations during the period and can be used to determine how the MTA hasfunded its costs.
The Consolidated Statements of Cash Flows provide information about the MTA’s cash receipts, cash payments and netchanges in cash resulting from operations, non-capital financing, capital and related financing and investing activities.
Notes to the Consolidated Financial Statements provide information that is essential to understanding the consolidated financial statements, such as the MTA’s accounting methods and policies, details of cash and investments,employee benefits, long-term debt, lease transactions, future commitments and contingencies of the MTA, and informa-tion about other events or developing situations that could materially affect the MTA’s financial position.
Required Supplementary Information provides information concerning the MTA’s progress in funding its obli-gation to provide pension benefits to its employees.
Management’s Discussion and Analysis provides a narrative overview and analysis of the financial activities ofthe MTA for the years ended December 31, 2006 and 2005. This management discussion and analysis is intended toserve as an introduction to the MTA’s consolidated financial statements. It provides an assessment of how the MTA’sposition has improved or deteriorated and identifies the factors that, in management’s view, significantly affected theMTA’s overall financial position. It may contain opinions, assumptions, or conclusions by the MTA’s management thatshould not be considered a replacement for, and must be read in conjunction with, the consolidated financial statements.
Management’s Discussion and AnalysisYears Ended December 31, 2006 and 2005($ millions)
AR7001-Financials14 7/10/07 8:35 PM Page 12

13M E T R O P O L I T A N T R A N S P O R T A T I O N A U T H O R I T Y
2—Financial Reporting Entity
The Metropolitan Transportation Authority was established under the New York Public Authorities Law and is a pub-lic benefit corporation and a component unit of the State of New York whose mission is to continue, develop, andimprove public transportation and to develop and implement a unified public transportation policy in the New Yorkmetropolitan area.
MTA Related Groups
• Headquarters (“MTAHQ”) — provides general oversight, planning and administration, including budget, cash man-agement, finance, legal, real estate, treasury, risk management and other functions to the related groups listed below.
• The Long Island Rail Road Company (“MTA Long Island Rail Road”) — provides passenger transportationbetween New York City and Long Island.
• Metro-North Commuter Railroad Company (“MTA Metro-North Railroad”) — provides passenger transportationbetween New York City and the suburban communities in Westchester, Dutchess, Putnam, Orange and Rocklandcounties in New York State and New Haven and Fairfield counties in Connecticut.
• Staten Island Rapid Transit Operating Authority (“MTA Staten Island Railway”) — provides passenger rail trans-portation on Staten Island.
• Metropolitan Suburban Bus Authority (“MTA Long Island Bus”) — provides public bus service in Nassau andQueens counties.
• First Mutual Transportation Assurance Company (“FMTAC”) — operates as a captive insurance company to pro-vide insurance coverage for property and primary liability.
• New York City Transit Authority (“MTA New York City Transit”) and its subsidiary, the Manhattan and BronxSurface Transit Operating Authority (“MaBSTOA”) — provide subway and public bus service within the five bor-oughs of New York City.
• Triborough Bridge and Tunnel Authority (“MTA Bridges and Tunnels”) — operates seven toll bridges, two tunnelsand the Battery Parking Garage.
• MTA Capital Construction Company (“MTA Capital Construction”) — provides oversight for the planning, designand construction of current and future major MTA system expansion projects.
• MTA Bus Company (“MTA Bus”) — operates certain bus routes in areas previously served by private bus operatorspursuant to franchises granted by the City of New York.
Management’s Discussion and AnalysisYears Ended December 31, 2006 and 2005
($ millions)
AR7001-Financials15 7/10/07 8:35 PM Page 13

14 M E T R O P O L I T A N T R A N S P O R T A T I O N A U T H O R I T Y
3—Condensed Financial Information
The following sections discuss the significant changes in the MTA’s financial position for the year ended December 31,2006. An analysis of major economic factors and industry trends that have contributed to these changes is provided. Itshould be noted that for purposes of the MD&A, the information contained within the summaries of the consolidatedfinancial statements and the various exhibits presented were derived from the MTA’s consolidated financial statements.All dollar amounts are in millions.
Total Assets, Distinguished Between Capital Assets, Net and Other AssetsDecember December December
2006 2005 2004
Capital assets, net (see Note 5) $38,307 $35,900 $33,654Other assets 11,778 10,726 10,183
Total assets $50,085 $46,626 $43,837
Capital Assets, Net
December 31, 2006 versus 2005
• Net capital assets increased at December 31, 2006 by $2,407. The most significant portion of the increase occurredin infrastructure, $1,316, followed by other (which includes work trains, service vehicles and other equipment,excluding passenger cars and locomotives and buses), $1,074; buildings and structures, $1,055, and passenger carsand locomotives, $483. These increases were partially offset by normal depreciation expenses, the decommissioningof 206 M-1 electric passenger cars and a locomotive from MTA Long Island Rail Road service, a total of 72 M-1,M-2, and M-3 cars, 79 MU cars and 1 dual mode locomotive from MTA Metro-North Railroad service and therecording of a loss on defective concrete ties. Some of the more significant projects contributing to the increaseincluded:
— Rehabilitation of the Dutch Kills Bridge and the East River tunnel, including safety improvements and ventilationprojects.
Management’s Discussion and AnalysisYears Ended December 31, 2006 and 2005($ millions)
� Construction and work-in-progress 14% 16%
� Buildings and structures 24% 24%
� Bridges and tunnels 4% 4%
� Passenger cars and locomotives 17% 18%
� Buses 2% 2%
� Infrastructure 24% 23%
� Other 15% 13%
� Land 0% 0%
2006 2005
2006 2005
AR7001-Financials16 7/10/07 8:35 PM Page 14

15M E T R O P O L I T A N T R A N S P O R T A T I O N A U T H O R I T Y
— Projects upgrading shops and yards and a new automated materials handling system in the Hillside Complex ofMTA Long Island Rail Road.
— The 2006 MTA Long Island Rail Road Track Program and various other line structure projects in addition topurchase of new track equipment.
— Passenger station rehabilitation including Atlantic Terminal.
— Placing in service 244 M-7 electric cars at MTA Long Island Rail Road and 76 at MTA Metro-North Railroadand the overhaul of 15 M-2 cars at MTA Metro-North Railroad.
— Maintaining mainline track replacement program on MTA New York City Transit subway lines.
— MTA New York City Transit switch replacements, tunnel lighting rehabilitation, ventilation facilities at variouslocations and rehabilitation of a fan plant at Stanton and Chrystie Streets.
— New Corona maintenance shop and car washer for subway cars and design and construction of new subwaydepot at Grand Avenue facility.
— Subway station reconstruction and rehabilitation at various locations.
— Purchase of new subway cars and buses.
— Additional milestone costs for construction, testing and quality assurance oversight associated with the continuedpurchase of new M-7 electric cars.
— Rehabilitation of the tunnel walls and roadway of the Brooklyn-Battery Tunnel.
— Replacement of the deck at the Triborough and Bronx-Whitestone Bridges, including span replacement on theBronx-Whitestone Bridge and rehabilitation of the electrical and mechanical systems at the Triborough Bridge.
• Other assets had a net increase of $1,052. The items contributing to this change include but are not limited to:
— A net increase in current and non-current investments and investments held under capital leases of $388 due inpart to the issuance of new bonds offset by use of funds for capital expenditures, debt service payments on bondsand lease obligations and operating expense.
— An increase of $54 in State and regional mass transit taxes receivable due to recording the accrual ofMetropolitan Mass Transit Operating assistance after the New York State budget was approved. The approvedbudget amount was increased by $322.5 in 2006 over 2005. In addition, the 2005 appropriation had beenreceived at December 31, 2005 while at December 31, 2006 there remained an outstanding receivable.
— Other subsidies receivable increased by $73 due to the increase in MTA New York City Transit urban tax subsidies.
— In 2006 an advance contribution was made to the MTA Defined Benefit Plans’ Master Trust in the amount of$365.1 and $60.0 to the MaBSTOA Pension Plan. No such advances were recorded in 2005.
— Prepaid expenses and other current assets increased a net $24. The increase includes prepaid rent, NYSLERSexpense, insurance premiums and farecard media related with ticket machines, WebTickets and AirTrain tickets.
— Material and supplies increased by $25 primarily at MTA New York City Transit, MTA Long Island Rail Roadand MTA Metro-North Railroad to insure availability of parts and supplies for emergency needs.
Management’s Discussion and AnalysisYears Ended December 31, 2006 and 2005
($ millions)
AR7001-Financials17 7/10/07 8:35 PM Page 15

16 M E T R O P O L I T A N T R A N S P O R T A T I O N A U T H O R I T Y
December 31, 2005 versus 2004
• Net capital assets increased at December 31, 2005 by $2,246. The most significant portion of the increase occurredin buildings and structures, $1,120, followed by infrastructure, $813, and passenger cars and locomotives, $632,and other, $623. These increases were partially offset by normal depreciation expenses, the decommissioning of 196M-1 electric passenger cars from MTA Long Island Rail Road service and the demolition of the ADA overpass inJamaica. Some of the more significant projects contributing to the increase included:
— Rehabilitation of the East River tunnel, including safety and ventilation improvement projects on MTA LongIsland Rail Road line.
— Rehabilitation of the Atlantic Terminal complex area.
— Construction of a new substation in Babylon yard of MTA Long Island Rail Road contributed to the increase inboth buildings and equipment. This project work will support MTA Long Island Rail Road’s future yard trackre-configuration efforts while the substation supplies power through the yard tracks and the adjacent main linetracks on the Montauk Branch.
— Placing 214 new M-7 electric cars into service on the MTA Long Island Rail Road system and 134 on the MTAMetro-North Railroad system and the incurring of additional costs for construction, testing and quality assur-ance oversight.
— Installation of an audio-visual paging system at the Jamaica Station and platform announcement systems for 121stations.
— Continuation of the Jamaica Station rehabilitation and the construction of an inter-modal transportation centerwhich links MTA Long Island Rail Road, JFK, AirTrain, and MTA New York City Transit subway and bus lines.
— Capitalization of the Stillwell Avenue reconstruction project in Coney Island and upgrade to the Police radiocommunication system.
— Various shop, yard and depot rehabilitations, upgrades and replacements, and road, track and infrastructureimprovements throughout the systems.
— Several passenger station rehabilitations on the MTA New York City Transit subway lines.
— Rehabilitation of the tunnel walls and roadway of the Brooklyn-Battery Tunnel.
— Replacement of the deck at the Triborough and Bronx-Whitestone Bridges, including span replacement on theBronx-Whitestone Bridge.
• Other assets had a net increase of $543.
• The major items contributing to this change include:
— A net increase in current and non-current investments and capital leases of $491 due to various reasons, includ-ing an increase in agency pool funds available, but not immediately required for operating expenses, MRTreceipts due to the increase in MRT funds collected by the State and remitted to the MTA, an increase inTransportation Revenue Bond proceeds due to new issuance at the end of the year (the proceeds of which werenot totally used), proceeds available from MTA Bridges and Tunnels Bonds not totally used, an increase in theTransportation Revenue Debt Service Fund and adjustment to fair market value and income received for capitalleases. These increases were partially offset by reductions in funds from bond and non-bond sources used to fundcapital expenditures and debt service payments.
— Other current receivables and prepaid expenses had a net increase of $19. Material and supplies increased by $18.Other non-current assets increased by $49, offset by a reduction of $48 in recoverables from New York State.
Management’s Discussion and AnalysisYears Ended December 31, 2006 and 2005($ millions)
AR7001-Financials18 7/10/07 8:35 PM Page 16
17M E T R O P O L I T A N T R A N S P O R T A T I O N A U T H O R I T Y
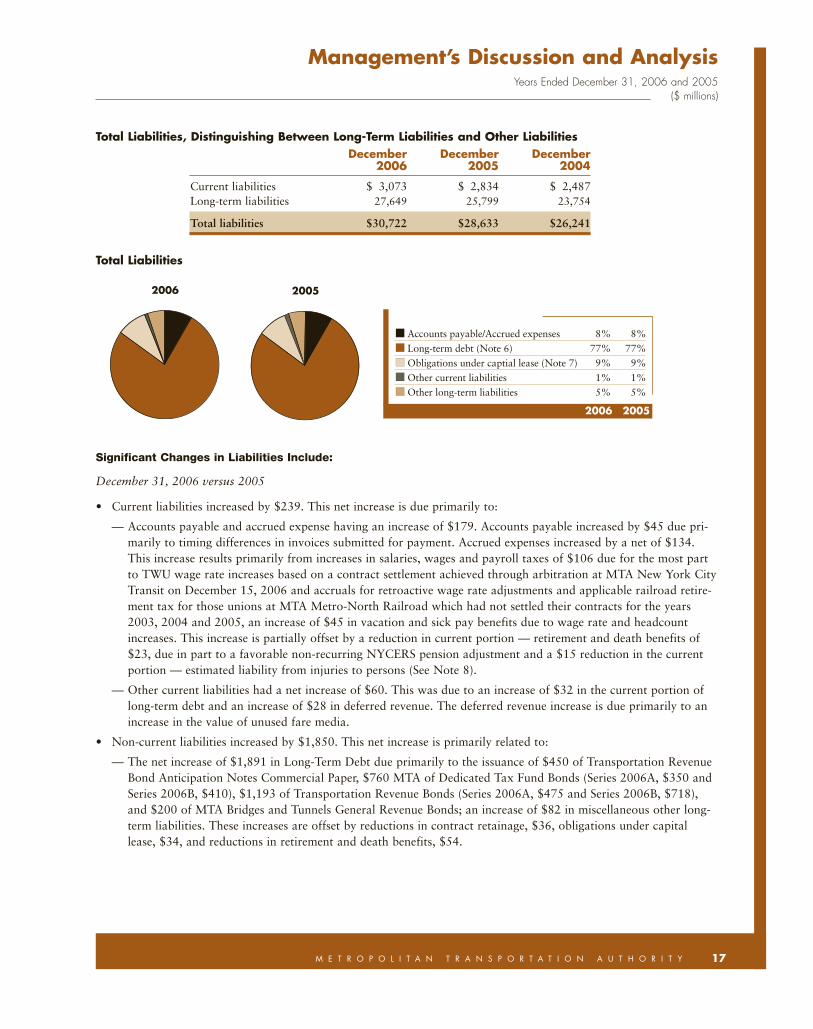
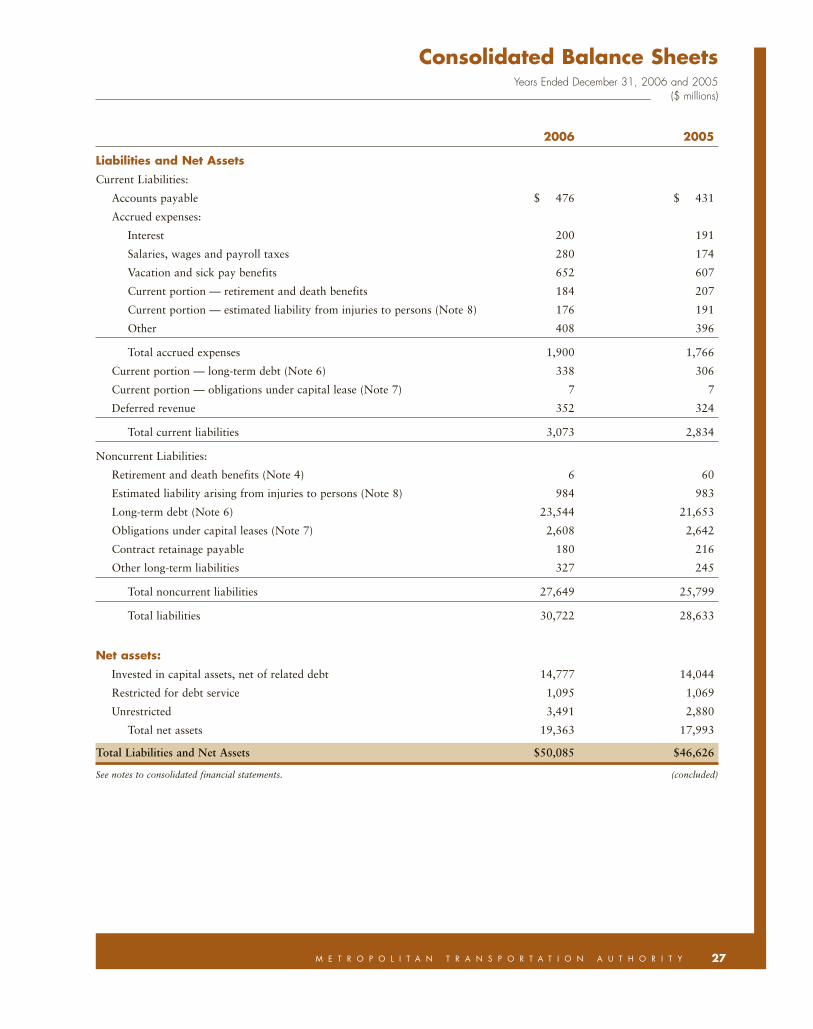
Total Liabilities, Distinguishing Between Long-Term Liabilities and Other LiabilitiesDecember December December
2006 2005 2004
Current liabilities $ 3,073 $ 2,834 $ 2,487Long-term liabilities 27,649 25,799 23,754
Total liabilities $30,722 $28,633 $26,241
Total Liabilities
Significant Changes in Liabilities Include:
December 31, 2006 versus 2005
• Current liabilities increased by $239. This net increase is due primarily to:
— Accounts payable and accrued expense having an increase of $179. Accounts payable increased by $45 due pri-marily to timing differences in invoices submitted for payment. Accrued expenses increased by a net of $134.This increase results primarily from increases in salaries, wages and payroll taxes of $106 due for the most partto TWU wage rate increases based on a contract settlement achieved through arbitration at MTA New York CityTransit on December 15, 2006 and accruals for retroactive wage rate adjustments and applicable railroad retire-ment tax for those unions at MTA Metro-North Railroad which had not settled their contracts for the years2003, 2004 and 2005, an increase of $45 in vacation and sick pay benefits due to wage rate and headcountincreases. This increase is partially offset by a reduction in current portion — retirement and death benefits of$23, due in part to a favorable non-recurring NYCERS pension adjustment and a $15 reduction in the currentportion — estimated liability from injuries to persons (See Note 8).
— Other current liabilities had a net increase of $60. This was due to an increase of $32 in the current portion oflong-term debt and an increase of $28 in deferred revenue. The deferred revenue increase is due primarily to anincrease in the value of unused fare media.
• Non-current liabilities increased by $1,850. This net increase is primarily related to:
— The net increase of $1,891 in Long-Term Debt due primarily to the issuance of $450 of Transportation RevenueBond Anticipation Notes Commercial Paper, $760 MTA of Dedicated Tax Fund Bonds (Series 2006A, $350 andSeries 2006B, $410), $1,193 of Transportation Revenue Bonds (Series 2006A, $475 and Series 2006B, $718),and $200 of MTA Bridges and Tunnels General Revenue Bonds; an increase of $82 in miscellaneous other long-term liabilities. These increases are offset by reductions in contract retainage, $36, obligations under capitallease, $34, and reductions in retirement and death benefits, $54.
Management’s Discussion and AnalysisYears Ended December 31, 2006 and 2005
($ millions)
� Accounts payable/Accrued expenses 8% 8%
� Long-term debt (Note 6) 77% 77%
� Obligations under captial lease (Note 7) 9% 9%
� Other current liabilities 1% 1%
� Other long-term liabilities 5% 5%
2006
2006 2005
2005
AR7001-Financials19 7/10/07 8:35 PM Page 17

18 M E T R O P O L I T A N T R A N S P O R T A T I O N A U T H O R I T Y
December 31, 2005 versus 2004
• Current liabilities increased by $347.
• This net increase is due primarily to:
— Accounts payable and accrued expense having a net increase of $327. Accounts payable increased by $157 dueprimarily to timing differences in invoices submitted for payment. Accrued expenses increased by a net of $170due primarily to an increase in retirement and death benefits of $105 due to an increase in pension accruals forpayments due in 2006 to the New York City Employees Retirement System, an increase of $26 in vacation andsick pay benefits, an increase of $19 in salaries, wages and payroll taxes due in part to the calculation ofRetroactive Wage Adjustments for Metro-North Railroad unions that have not settled their contracts. A reduc-tion in interest expense of $6, an increase in the current portion of estimated liability from injuries arising to per-sons of $9 and miscellaneous other of $17 account for the remaining increase.
— Other current liabilities had a net increase of $20. This was due to a reduction of $6 in the current portion oflong-term debt and an increase of $26 for deferred revenue due to an increase in the value of unusedMetroCards.
• Non-current liabilities increased by $2,045. This net increase is primarily related to:
— The net increase of $2,044 in Long-Term Debt — MTA is authorized to issue bonds to refund outstanding bondsand to finance transit and commuter capital projects. MTA Bridges and Tunnels is authorized to issue bonds tofinance its own bridge and tunnel capital projects and/or transit and commuter capital projects and to refundoutstanding bonds. During 2005, MTA and MTA Bridges and Tunnels issued the following bonds to financetransit and commuter capital projects, refund certain outstanding Bonds and to finance MTA Bridges andTunnels’ projects:
$350 MTA Dedicated Tax Fund Variable Rate Refunding Bonds, Series 2005A$650 MTA Transportation Revenue Bonds, Series 2005A$750 MTA Transportation Revenue Bonds, Series 2005B$150 MTA Transportation Revenue Bonds, Series 2005C$250 MTA Transportation Revenue Variable Rate Bonds, Series 2005D$250 MTA Transportation Revenue Variable Rate Bonds, Series 2005E$469 MTA Transportation Revenue Bonds, Series 2005F$250 MTA Transportation Revenue Variable Rate Bonds, Series 2005G$173 MTA Transportation Revenue Refunding Bonds, Series 2005H$150 MTA Bridges and Tunnels General Revenue Variable Rate Bonds, Series 2005A$800 MTA Bridges and Tunnels General Revenue Variable Rate Refunding Bonds, Series 2005B
Management’s Discussion and AnalysisYears Ended December 31, 2006 and 2005($ millions)
AR7001-Financials20 7/10/07 8:35 PM Page 18

19M E T R O P O L I T A N T R A N S P O R T A T I O N A U T H O R I T Y
Total Net Assets, Distinguishing Among Amounts Invested in Capital Assets, Net of Related Debt,Restricted Amounts and Unrestricted Amounts
2006 2005 2004
Invested in capital assets, net ofrelated debt $14,777 $14,044 $13,678
Restricted for debt service 1,095 1,069 828Unrestricted 3,491 2,880 3,090
Total assets $19,363 $17,993 $17,596
December 31, 2006 versus 2005
At December 31, 2006, the total net assets increased by $1,370 from December 31, 2005. This increase includes netnon-operating revenues of $3,953, and appropriations, grants and other receipts externally restricted for capital proj-ects of $1,260, offset by operating losses of $3,843.
Capital assets, net of related debt increased by $733 due to the fact that new capital expenditures net of depreciationand retirements were greater than the amount of new debt issued less debt retirement.
Funds restricted for debt service increased by $26 due to the issuance of new bonds.
December 31, 2005 versus 2004
At December 31, 2005, the total net assets increased by $397 from December 31, 2004. This increase includes net non-operating revenues of $2,901, and appropriations, grants and other receipts externally restricted for capital projects of$1,050, partially offset by operating losses of $3,554.
Capital assets net of related debt increased by $366.
Funds restricted for debt service increased by $241 due to the issuance of new bonds.
Management’s Discussion and AnalysisYears Ended December 31, 2006 and 2005
($ millions)
AR7001-Financials21 7/10/07 8:35 PM Page 19

20 M E T R O P O L I T A N T R A N S P O R T A T I O N A U T H O R I T Y
Condensed Statement of Revenues, Expenses and Changes in Net AssetsDecember December December
2006 2005 2004
Operating RevenuesPassenger and tolls $ 5,081 $ 4,811 $ 4,521Other 406 387 316
Total operating revenues 5,487 5,198 4,837
Nonoperating RevenuesGrants, appropriations and taxes 4,119 3,466 2,847Other 288 223 513
Total nonoperating revenues 4,407 3,689 3,360
Total Revenues 9,894 8,887 8,197
Operating ExpensesSalaries and wages 4,123 3,819 3,645Retirement and other employee benefits 1,623 1,618 1,403Depreciation and amortization 1,606 1,474 1,344Other expenses 1,978 1,841 1,621
Total operating expense 9,330 8,752 8,013
Nonoperating ExpenseInterest on long-term debt 1,039 984 819Other nonoperating expense 53 45 43
Total nonoperating expense 1,092 1,029 862
Total Expenses 10,422 9,781 8,875
Appropriations, grants and other receiptsexternally restricted for capital projects 1,898 1,291 761
Change in net assets 1,370 397 83Net assets, beginning of period 17,993 17,596 17,513
Net assets, end of period $19,363 $17,993 $17,596
Management’s Discussion and AnalysisYears Ended December 31, 2006 and 2005($ millions)
AR7001-Financials22 7/10/07 8:35 PM Page 20

21M E T R O P O L I T A N T R A N S P O R T A T I O N A U T H O R I T Y
Revenues and Expenses, by Major Source:
December 31, 2006 versus 2005
• Total operating revenues for the year ended December 31, 2006 were $289 higher than in the year endedDecember 31, 2005.
— Fare revenues and vehicle toll revenues were higher due to increased ridership and traffic and realization for thefull year in 2006 of the fare adjustment implemented for 30 day and 7 day Unlimited Ride MetroCards, and theexpress bus fare increases that went into effect on February 27, 2005 generated additional revenues of $134 atMTA New York City Transit; the commuter rail fares that went into effect on March 1, 2005 generated addi-tional revenues of $50; the full year effect of MTA Bus operation generating $96 additional revenues; and theincreased bridge and tunnel crossing charge schedule that went into effect on March 13, 2005 along with the onedollar per month E-ZPass account maintenance fee that went into effect on July 1, 2005 (which fee was termi-nated effective June 1, 2006) resulted in an additional $5 at MTA Bridges and Tunnels. MTA Long Island RailRoad attributed an increase in its ridership to the higher gasoline prices and job gains in New York City.
— Total operating expenses for the year ended December 31, 2006 were higher than the year ended December 31,2005 by $578.
— Labor costs, including retirement and other employee benefits, were higher by approximately $309. Wage rateincreases, including accrued estimated rate increases in anticipation of wage contract settlements, additional sickand vacation reserve requirements and the impact of MTA Bus operation of the additional bus routes acquired afterthe first nine months of 2005 are the primary reasons for the $304 labor cost increases; health and welfare costincreased by approximately $64 due primarily to escalating premium rates for health and welfare plans. Pensionexpense decreased by $46 due in large part to a NYCERS pension revaluation adjustment based on recently enactedlegislation affecting MTA New York City Transit, partially offset by increases at other agencies. The other fringebenefits increase of $15 is due in large part to the fringe benefit cost associated with MTA Bus operations includingworkers compensation insurance and other costs directly associated with wages at the other agencies.
— Non-labor operating costs were higher by approximately $269. Cost elements contributing to this increase weredepreciation resulting in part from new capital assets being placed into beneficial service, $132, traction andpropulsion power and fuel expense increases of $60 are due primarily to fuel price increases. Maintenance andother operating contracts increased by $67 due to increases in operating and facility repair and maintenancerequirements, facility heating fuel and power costs, bus tire and tube rental requirements, recycling costs, costassociated with Penn Station tunnel resurfacing and costs resulting from the discovery of chlordane contamina-tion. Materials and supplies costs increased by $43 primarily at MTA New York City Transit and MTA Bus forparts for fleet maintenance, including bus body structure parts, bus electrical systems, bus engines/cooling sys-tems, bus suspensions and springs, subway propulsion motors, and subway trucks, wheels and undercarriages.Professional service contracts decreased by $50. Paratransit Service Contract costs increased $26 primarily due toincreased trip volume.
• Total grants, appropriations and taxes were higher by approximately $653 for the year ended December 31, 2006compared to the year ended December 31, 2005. The major components of the increase are tax-supported subsidies-NYS, $389, and tax-supported subsidies-NYC and local, $288.
— The increase in tax-supported subsidies from New York State is due primarily to an increase of $329 inMetropolitan Mass Transportation Operating Assistance and an increase of $52 in Petroleum Business Tax.
Management’s Discussion and AnalysisYears Ended December 31, 2006 and 2005
($ millions)
AR7001-Financials23 7/10/07 8:35 PM Page 21

22 M E T R O P O L I T A N T R A N S P O R T A T I O N A U T H O R I T Y
— The increase in tax-supported subsidies — NYC and local is primarily due to an increase in the urban tax andother subsidies received by MTA New York City Transit of $147 and MTA Bus of $126, a net increase in theMortgage Recording Taxes of $15 partially offset by a reduction in the NYS special aid of $24. In additionMortgage Recording Tax 1 rate was increased from 25 cents per 100 dollars of mortgage recorded to 30 centsper 100 dollars of mortgage recorded effective June 1, 2005.
December 31, 2005 versus 2004
• Total operating revenues for the year ended December 31, 2005 were $361 higher than in the year endedDecember 31, 2004.
— Fare revenues and vehicle toll revenues were higher than in the prior year due to the fare adjustment implement-ed for 30-day and 7-day Unlimited Ride MetroCards, and the express bus fare increases that went into effect onFebruary 27, 2005; the commuter rail fares that went into effect on March 1, 2005; and the increased bridge andtunnel crossing charge schedule that went into effect on March 13, 2005. In addition, revenues of $45 from theMTA Bus Company that went into operation in 2005 are included for the first time. Revenues that could havebeen realized from the adjusted MTA New York City Transit fares were reduced by the effect of the holidaybonus fare program and the effect of the three-day strike in December 2005.
• Total operating expenses for the year ended December 31, 2005 were higher than the year ended December 31,2004 by $739.
— Labor costs, including retirement and other employee benefits, were higher by approximately $389. Contractualincreases are the primary reason for the $174 labor cost increases in addition to increased overtime due to serv-ice disruptions on the transit system, track and platform clearance during the winter snows, and a reduction incapital project reimbursable work at MTA Long Island Rail Road due to a delay in approval of funding for the2005 — 2009 Capital Program. Included for the first time are the labor and employee benefit costs of the MTABus Company which total $96. Rate increases have resulted in higher costs for health, welfare, pension and otherbenefit programs.
— Non-labor operating costs were higher by approximately $350. Cost elements contributing to this increase weredepreciation resulting in part from new capital assets being placed into service, $130, traction and propulsionpower, and fuel expense increases of $98 are due primarily to New York Power Authority rate increases andhigher fuel costs. Maintenance and other operating contracts increased by $52 primarily from higher facilitypower rate increases, real estate rentals and increased heating fuel costs and major maintenance and bridge paint-ing expense. Paratransit Service Contract cost increased $23 primarily due to increased trip volume.
• Total grants, appropriations and taxes were higher by approximately $619 for the year ended December 31, 2005compared to the year ended December 31, 2004. The major components of the increase are tax-supported subsidies-NYS and tax-supported subsidies-NYC and local. The increase in tax-supported subsidies from New York State isdue primarily to an increase in the appropriation of Metropolitan Mass Transportation Operating Assistance in2005 over 2004 of $231 (primarily due to increasing the regional sales tax from .25 of 1 percent to .375 of 1 per-cent effective June 1, 2005). The increase in tax-supported subsidies — NYC and local is primarily due to anincrease in the urban tax of $268 and an increase in the Mortgage Recording Tax 2 of $91. In addition MortgageRecording Tax 1 was increased from 25 cents per $100 of mortgage recorded to 30 cents per $100 of mortgagerecorded effective June 1, 2005. Operating subsidies-NYS contributed a net of $24 to the increase.
Management’s Discussion and AnalysisYears Ended December 31, 2006 and 2005($ millions)
AR7001-Financials24 7/10/07 8:35 PM Page 22

23M E T R O P O L I T A N T R A N S P O R T A T I O N A U T H O R I T Y
4—Overall Financial Position and Results of Operationsand Important Economic Conditions
Economic Conditions
Metropolitan New York is the most transit-intensive region in the United States. A financially sound and reliable trans-portation system is critical to the region’s economic well-being. The MTA’s business consists of urban subway and bussystems, suburban rail and bus systems, and bridge and tunnel facilities, all of which are affected by many differenteconomic forces. In order to achieve maximum efficiency and success in its operations, the MTA must identify econom-ic trends and continually implement strategies to adapt to changing economic conditions.
Through December 2006, system-wide utilization — excluding MTA Bus Company — continued to increase signifi-cantly, with 2006 MTA ridership 2.6 percent higher (60.9 million more trips) compared to 2005. In addition, MTABus Company carried 99.3 million revenue passengers in 2006, the first full year for which ridership data have beenavailable. Vehicle crossing levels at MTA Bridges and Tunnels facilities were 0.6 percent higher (1.7 million more cross-ings) through December 2006 when compared to the same period in 2005.
By the end of the fourth quarter of 2006 New York City had added nearly 60,000 new jobs compared to the numberof jobs existing during the fourth quarter of 2005. According to Coincident Economic Indicators (CEI’s) published bythe Federal Reserve Bank, the regional economy experienced modest growth during the quarter, while New York Cityitself grew robustly, stimulated in part by the rebuilding of the downtown infrastructure and the MTA’s multi-billion-dollar capital programs.
In spite of the city’s strong economic growth, the consumer price index in the New York metropolitan area increased byonly 2.75 percent in the fourth quarter of 2006 relative to the fourth quarter of 2005. The energy component of the con-sumer price index actually decreased by 6.0 percent, so the consumer price index excluding energy increased 3.5 percentin the same period. The New York Harbor spot price for conventional gasoline averaged $1.59 per gallon in the fourthquarter, a slight decrease of 0.3 percent compared to the average spot price in the fourth quarter of 2005. Because ofunusually mild winter weather, lower energy prices partly reflect a smaller than normal demand for home heating fuels.
As the national economy emerged from the recession of 2001-2003, the Federal Reserve Board adjusted its monetarypolicies in an effort to keep inflation under control. From the end of June 2003 — when the Federal Funds Rate was ata 46-year low of 1.0 percent — through September 2006, the Federal Reserve Board raised the Federal Funds Rate byone-quarter point on each of seventeen occasions. Five of the seventeen rate increases occurred during 2004, eightoccurred in 2005 and four occurred in 2006; the most recent increase occurred on June 29, 2006, when the Fedsincreased the Federal Funds Rate from 5.00 percent to 5.25 percent, its highest level since January of 2001. Theseincreases started to have an impact on 30-year conforming fixed-rate mortgage rates, which slowly rose during the firstand second quarter of this year, but Fed restraint since the end of June has led to falling mortgage rates in both thethird and fourth quarters. The behavior of mortgage rates is a matter of interest to the MTA, since mortgage rates canaffect the number of real estate transactions, impacting receipts from the mortgage recording tax and Urban Tax, twoprimary sources of MTA revenue.
Results of Operations
Paid MTA Bridges and Tunnels traffic level for the year ended December 31, 2006 reached 302.1 million vehicles, whichwas the second highest level in MTA Bridges and Tunnels’ history. Total volume was 0.6 percent greater in 2006 than in2005. Relatively unfavorable weather and higher gasoline prices suppressed traffic by 0.4% in total for the first threequarters of 2006, but the declines were more than offset by significant volume gains in the fourth quarter. Gasoline pricesbegan falling in October and the weather was much more favorable on a year-to-year basis throughout the quarter. The
Management’s Discussion and AnalysisYears Ended December 31, 2006 and 2005
($ millions)
AR7001-Financials25 7/10/07 8:35 PM Page 23

24 M E T R O P O L I T A N T R A N S P O R T A T I O N A U T H O R I T Y
E-ZPass electronic collection system continued to facilitate the management of heavy traffic volumes. On an averageweekday during 2006, 74.9 percent of all MTA Bridges and Tunnels traffic used E-ZPass compared to 73.8 percent during2005. In 2006, toll revenues were $1,241.6 which was $36.6 or 3.0 percent greater than the toll revenues of 2005. Therevenue gain was largely the result of a toll increase implemented on March 13, 2005 and the 1.00 dollar per monthE-ZPass account maintenance fee instituted on July 1, 2005 (which fee was terminated June 1, 2006) and the considerablyhigher traffic volumes in the last quarter of 2006.
MTA New York City Transit’s fare revenues for the year ended December 31, 2006 were higher than in 2005 by $115.9or 4.4 percent. This increase is due primarily to the fare adjustments implemented on February 27, 2005 which raised theprice of 7-day and 30-day passes and the express bus fare, and the impact of the three-day transit strike in December of2005, as well as the reduced fares during the Holiday Bonus Program in 2005. Total ridership was higher by 2.5 percent,attributed in part to an improving local economy and negative impact of the December 2005 transit strike. Other operat-ing revenues increased by $17.9 due primarily to higher paratransit and urban tax revenues.
MTA Long Island Rail Road ridership for the year ended December 31, 2006 was at approximately 82.0 million on pas-senger revenues of $457.4. Revenues increased by approximately $15.1 or 3.0 percent for the year ended December 31,2006 over the year ended December 31, 2005. This increase is due in part to the fare increase that went into effect onMarch 1, 2005 as well as increased ridership attributed to rising gasoline prices and job gains in New York City.
MTA Metro-North Railroad’s operating revenue increased by $20.3 or approximately 4.3 percent for the year endedDecember 31, 2006 over the year ended December 31, 2005. A 5.5 percent fare increase on travel that begins or ends inthe State of Connecticut was effective as of January 1, 2005. A fare increase on travel in New York State designed toincrease 2005 revenues by 5.0 percent took effect on March 1, 2005. Ridership on the Harlem, Hudson and New HavenLines increased in 2006 by approximately 3.2 percent. This includes increases in commuter ridership to Manhattan, aswell as increases in customers traveling between stations, and weekend travel.
The MTA receives the equivalent of four quarters of Metropolitan Mass Transportation Operating Assistance receiptseach year, with the State advancing the first quarter of each succeeding calendar year’s receipts in the fourth quarter of thecurrent year. This results in little or no Metropolitan Mass Transportation Operating Assistance receipts being receivedduring the first quarter of each calendar year. The MTA has made other provisions to provide for cash liquidity duringthis period. During the first quarter of 2006, however, the State advanced the payment of $200 of MMTOA assistance tothe MTA from MTA’s 2006 appropriation. There has been no change in the timing of the State’s payment of, or MTA’sreceipt of, Dedicated Mass Transportation Trust Fund (“MTTF”) Receipts, which MTA anticipates will be sufficient tomake monthly principal and interest deposits into the Debt Service Fund for the Dedicated Tax Fund Bonds.
Over the last few years, the mortgage recording taxes payable to the MTA have generally exceeded expectations due pri-marily to the high level of home buying and refinancings caused by historically low interest rates. Due to, among otherthings, the Federal Reserve Bank’s continuation of its interest rate increases and the adverse consequences those actionsare expected to have on the level of activity in the real estate market, the MTA does not expect that its collection of mort-gage recording taxes will continue at the current levels.
Capital Programs
At December 31, 2006, $5,170 had been committed and $1,670 had been expended for the combined 2005-2009MTA Capital Programs and the 2005-2009 MTA Bridges and Tunnels Capital Program, and $19,074 had been com-mitted and $15,225 had been expended for the combined 2000-2004 MTA Capital Programs and the 2000-2004 MTABridges and Tunnels Capital Program.
MTA’s and MTA Bridges and Tunnels’ capital programs are described in Note 1 to the consolidated financial statements.
Management’s Discussion and AnalysisYears Ended December 31, 2006 and 2005($ millions)
AR7001-Financials26 7/10/07 8:35 PM Page 24

25M E T R O P O L I T A N T R A N S P O R T A T I O N A U T H O R I T Y
5—Currently Known Facts, Decisions, or Conditions
Increase in Subsidies
Effective June 1, 2005, (1) the MTA’s portion of the regional sales tax in the commuter transportation district wasincreased from .25 of 1 percent to .375 of 1 percent and (2) the MRT-1 portion of the MTA’s mortgage recording taxeswas increased from 25 cents per 100 dollars of recorded mortgage to 30 cents per 100 dollars of recorded mortgage.
Creation of MTA Bus Company
MTA Bus was created as a public benefit corporation subsidiary of MTA in 2004 specifically to operate certain Citybus routes. At its meeting in December 2004, the MTA Board approved a letter agreement with the City of New York(the “City”) with respect to MTA Bus’ establishment and operation of certain bus routes (the “City Bus Routes”) inareas then served by private bus operators in Manhattan, the Bronx, Queens and Brooklyn pursuant to franchisesgranted by the City. The letter agreement with the City provides for the following:
• A lease by the City to MTA Bus of the bus assets to operate the City Bus Routes.
• The City agrees to pay MTA Bus the difference between the actual cost of operation of the City Bus Routes (otherthan certain capital costs) and all revenues and subsidies received by MTA Bus and allocable to the operation of theCity Bus Routes. The letter agreement permits the parties after a period of 18 months to negotiate an agreement toestablish a formula-based approach for the payment of the City subsidy.
• If the City fails to timely pay any of the subsidy amounts due for a period of 30 days, MTA Bus has the right, afteran additional 10 days, to curtail, suspend or eliminate service and may elect to terminate the agreement. The Citycan terminate the agreement on one year’s notice.
• MTA Bus completed its consolidation of the various bus routes of the seven original companies during the firstquarter of 2006.
Additional Bond Issues During 2006
During the month of June, the MTA issued MTA DTF fixed rate bonds in the amount of $350. Also during the month ofJune, the MTA Bridges and Tunnels issued fixed rate General Revenue Bonds in the amount of $200. During the monthof July, the MTA issued fixed rate Transportation Revenue Bonds in the amount of $475. During the month of November,the MTA issued MTA DTF fixed rate bonds in the amount of $410. During the month of December, the MTA issuedfixed rate MTA Transportation Revenue Bonds in the amount of $717.7.
* * * * *
Management’s Discussion and AnalysisYears Ended December 31, 2006 and 2005
($ millions)
AR7001-Financials27 7/10/07 8:35 PM Page 25

26 M E T R O P O L I T A N T R A N S P O R T A T I O N A U T H O R I T Y
2006 2005
AssetsCurrent Assets:
Cash (Note 3) $ 155 $ 138
Investments (Note 3) 2,604 1,561
Receivables:
Station maintenance, operation, and use assessments 101 98
State and regional mass transit taxes 106 52
Mortgage Recording Tax receivable 60 63
State and local operating assistance 8 8
Other subsidies 108 35
Connecticut Department of Transportation 7 19
New York City 28 26
Other 353 328
Less allowance for doubtful accounts (25) (47)
Total receivables — net 746 582
Materials and supplies 317 292
Advance to Defined Benefit Pension Trust 425 —
Prepaid expenses and other current assets (Notes 2 and 4) 114 90
Total current assets 4,361 2,663
Noncurrent Assets:
Capital assets — net (Note 5) 38,307 35,900
Restricted investment held under capital lease obligations (Note 3 and 7) 2,463 2,505
Investments (Note 3) 1,583 2,196
Receivable from New York State 2,246 2,294
Other noncurrent assets 1,125 1,068
Total noncurrent assets 45,724 43,963
Total Assets $50,085 $46,626
See notes to consolidated financial statements. (continued)
Consolidated Balance SheetsYears Ended December 31, 2006 and 2005($ millions)
AR7001-Financials28 7/10/07 8:35 PM Page 26
27M E T R O P O L I T A N T R A N S P O R T A T I O N A U T H O R I T Y
2006 2005
Liabilities and Net AssetsCurrent Liabilities:
Accounts payable $ 476 $ 431
Accrued expenses:
Interest 200 191
Salaries, wages and payroll taxes 280 174
Vacation and sick pay benefits 652 607
Current portion — retirement and death benefits 184 207
Current portion — estimated liability from injuries to persons (Note 8) 176 191
Other 408 396
Total accrued expenses 1,900 1,766
Current portion — long-term debt (Note 6) 338 306
Current portion — obligations under capital lease (Note 7) 7 7
Deferred revenue 352 324
Total current liabilities 3,073 2,834
Noncurrent Liabilities:
Retirement and death benefits (Note 4) 6 60
Estimated liability arising from injuries to persons (Note 8) 984 983
Long-term debt (Note 6) 23,544 21,653
Obligations under capital leases (Note 7) 2,608 2,642
Contract retainage payable 180 216
Other long-term liabilities 327 245
Total noncurrent liabilities 27,649 25,799
Total liabilities 30,722 28,633
Net assets:Invested in capital assets, net of related debt 14,777 14,044
Restricted for debt service 1,095 1,069
Unrestricted 3,491 2,880
Total net assets 19,363 17,993
Total Liabilities and Net Assets $50,085 $46,626
See notes to consolidated financial statements. (concluded)
Years Ended December 31, 2006 and 2005($ millions)
Consolidated Balance Sheets
AR7001-Financials29 7/10/07 8:35 PM Page 27

28 M E T R O P O L I T A N T R A N S P O R T A T I O N A U T H O R I T Y
Consolidated Statements of Revenues, Expenses andChanges in Net AssetsYears Ended December 31, 2006 and 2005($ millions)
2006 2005
Operating RevenuesFare revenue $3,840 $3,606
Vehicle toll revenue 1,241 1,205
Rents, freight, and other revenue 406 387
Total operating revenues 5,487 5,198
Operating Expenses:Salaries and wages 4,123 3,819
Retirement and other employee benefits 1,623 1,618
Traction and propulsion power 278 253
Fuel for buses and trains 178 143
Insurance 49 67
Claims 93 90
Paratransit service contracts 184 158
Maintenance and other operating contracts 527 460
Professional service contracts 177 227
Materials and supplies 448 405
Depreciation 1,606 1,474
Other 44 38
Total operating expenses 9,330 8,752
Operating Loss (3,843) (3,554)
See notes to consolidated financial statements. (continued)
AR7001-Financials30 7/10/07 8:35 PM Page 28

29M E T R O P O L I T A N T R A N S P O R T A T I O N A U T H O R I T Y
Consolidated Statements of Revenues, Expenses andChanges in Net Assets
Years Ended December 31, 2006 and 2005($ millions)
2006 2005
Non Operating Revenues (Expenses)Grants, appropriations and taxes:
Tax supported subsidies — NYS $ 2,054 $ 1,665
Tax supported subsidies — NYC and local 1,671 1,383
Operating subsidies — NYS 206 230
Operating subsidies — NYC and local 188 188
Total grants, appropriations and taxes 4,119 3,466
Operating subsidies recoverable from Connecticut Department of Transportation
related to New Haven Line 53 44
Subsidies paid to Dutchess, Orange and Rockland Counties (20) (23)
Suburban Highway Transportation Fund subsidy (20) (20)
Interest on long-term debt (1,039) (984)
Station maintenance, operation and use assessments 137 134
Loss on disposal of subway cars — (2)
Unrealized (loss)/gain on investment (13) 7
Other nonoperating revenue 98 38
Net non operating revenues 3,315 2,660
Income/(Loss) Before Appropriations (528) (894)
Appropriations, Grants and Other Receipts Externally Restricted for Capital Projects 1,898 1,291
Change in Net Assets 1,370 397
Net Assets, Beginning of Year 17,993 17,596
Net Assets, End of Period $19,363 $17,993
See notes to consolidated financial statements. (concluded)
AR7001-Financials31 7/10/07 8:35 PM Page 29

30 M E T R O P O L I T A N T R A N S P O R T A T I O N A U T H O R I T Y
2006 2005
Cash Flows Provided by/(Used in) Operating Activities:Passenger receipts/tolls $ 5,302 $ 5,006
Rents and other receipts 207 233
Payroll and related fringe benefits (5,663) (5,254)
Other operating expenses (1,879) (1,709)
Net cash used in operating activities (2,033) (1,724)
Cash Flows Provided by/(Used in) NoncapitalFinancing Activities:
Grants, appropriations and taxes 4,209 3,592
Operating subsidies from CDOT 52 44
Suburban transportation fund subsidy (20) —
Subsidies paid to Dutchess, Orange and Rockland counties (23) (22)
Pension Funding (465) —
Net cash provided by noncapital financing activities 3,753 3,614
Cash Flows Provided by/(Used in) Capital andRelated Financing Activities:
MTA bond proceeds 2,020 3,409
TBTA bond proceeds 207 950
MTA bonds refunded (281) (528)
TBTA bonds refunded — (772)
MTA anticipation notes proceeds 450 —
MTA anticipation notes redeemed (11) (720)
Capital lease payments (22) (27)
Grants and appropriations 2,191 1,423
CDOT capital contributions 4 3
Capital expenditures (4,092) (3,641)
Debt service payments (1,824) (1,616)
Net cash used in capital and related financing activities (1,358) (1,519)
See notes to consolidated financial statements. (continued)
Years Ended December 31, 2006 and 2005($ millions)
Consolidated Statements of Cash Flows
AR7001-Financials32 7/10/07 8:36 PM Page 30

Consolidated Statements of Cash Flows
31M E T R O P O L I T A N T R A N S P O R T A T I O N A U T H O R I T Y
2006 2005
Cash Flows Provided by/(Used in) Investing Activities:Purchase of long-term securities $(3,551) $(2,941)
(Purchase)/sales of maturities of securities — long-term 3,249 2,858
Sale/(purchase) of short-term securities (171) (377)
Earnings on investments 128 103
Net cash provided by investing activities (345) (357)
Net decrease in cash 17 14
Cash, beginning of period 138 124
Cash, end of period $ 155 $ 138
Reconciliation of Operating Loss to Net CashUsed in Operating Activities:
Operating loss $(3,843) $(3,554)
Adjustments to reconcile to net cash used in operating activities:
Depreciation and amortization 1,606 1,474
Net increase in payables, accrued expenses and other liabilities 337 275
Net (increase)/decrease in receivables (125) (1)
Net (increase)/decrease in materials and supplies and prepaid expenses (8) 82
Net cash used in operating activities $(2,033) $(1,724)
See notes to consolidated financial statements. (Concluded)
Years Ended December 31, 2006 and 2005($ millions)
AR7001-Financials33 7/10/07 8:36 PM Page 31

32 M E T R O P O L I T A N T R A N S P O R T A T I O N A U T H O R I T Y
1—Basis of Presentation
The Metropolitan Transportation Authority (“MTA”) was established in 1965, under Section 1263 of the New YorkPublic Authorities Law, and is a public benefit corporation and a component unit of the State of New York (“NYS”)whose mission is to continue, develop and improve public transportation and to develop and implement a unified pub-lic transportation policy in the New York metropolitan area.
These consolidated financial statements are of the Metropolitan Transportation Authority, including its relatedgroups (collectively, the “MTA”) as follows:
Metropolitan Transportation Authority and Related Groups • Metropolitan Transportation Authority Headquarters (“MTAHQ”) provides support in budget, cash manage-
ment, finance, legal, real estate, treasury, risk and insurance management, and other services to the relatedgroups listed below.
• The Long Island Rail Road Company (“MTA Long Island Rail Road”) provides passenger transportationbetween New York City (“NYC”) and Long Island.
• Metro-North Commuter Railroad Company (“MTA Metro-North Railroad”) provides passenger transportationbetween NYC and the suburban communities in Westchester, Dutchess, Putnam, Orange, and Rockland countiesin NYS and New Haven and Fairfield counties in Connecticut.
• Staten Island Rapid Transit Operating Authority (“MTA Staten Island Railway”) provides passenger transporta-tion on Staten Island.
• Metropolitan Suburban Bus Authority (“MTA Long Island Bus”) provides public bus service in NYC andNassau County, New York.
• First Mutual Transportation Assurance Company (“FMTAC”) provides primary insurance coverage for certainlosses, some of which are reinsured, and assumes reinsurance coverage for certain other losses.
• MTA Capital Construction Company (“MTA Capital Construction”) provides oversight for the planning, designand construction of current and future major MTA system-wide expansion projects.
• MTA Bus Company (“MTA Bus”) operates certain bus routes in areas previously served by private bus operatorspursuant to franchises granted by the City of New York.
• MTAHQ, MTA Long Island Rail Road, MTA Metro-North Railroad, MTA Staten Island Railway, MTA LongIsland Bus, FMTAC, MTA Capital Construction and MTA Bus, collectively are referred to herein as MTA. MTALong Island Rail Road and MTA Metro-North Railroad are referred to collectively as the Commuter Railroads.
• New York City Transit Authority (“MTA New York City Transit”) and its subsidiary, Manhattan and BronxSurface Transit Operating Authority (“MaBSTOA”) provide subway and public bus service within the five bor-oughs of New York City.
• Triborough Bridge and Tunnel Authority (“MTA Bridges and Tunnels”) operates seven toll bridges, two tunnelsand the Battery Parking Garage, all within the five boroughs of New York City.
MTA New York City Transit and MTA Bridges and Tunnels are operationally and legally independent of the MTA.These related groups enjoy certain rights typically associated with separate legal status including, in some cases, theability to issue debt. However, they are included in the MTA’s financial statements because of the MTA’s financialaccountability for these entities and they are under the direction of the MTA Board. Under accounting principles gener-ally accepted in the United States of America (“GAAP”), the MTA is required to include these related groups in itsfinancial statements. While certain units are separate legal entities, they do have legal capital requirements and the rev-enues of all of the related groups of the MTA are used to support the organization as a whole. The components do notconstitute a separate accounting entity (fund) since there is no legal requirement to account for the activities of thecomponents as discrete accounting entities. Therefore, the MTA financial statements are presented on a consolidatedbasis with segment disclosure for each distinct operating activity.
Notes to Consolidated Financial StatementsYears Ended December 31, 2006 and 2005($ millions)
AR7001-Financials34 7/10/07 8:36 PM Page 32

33M E T R O P O L I T A N T R A N S P O R T A T I O N A U T H O R I T Y
Capital ProgramThe MTA has ongoing capital programs, which except for MTA Bridges and Tunnels, MTA Long Island Bus and MTABus, are subject to the approval of the Metropolitan Transportation Authority Capital Program Review Board(“CPRB”), and which are designed to improve public transportation in the New York Metropolitan area.
2005-2009 Capital ProgramCapital programs covering the years 2005-2009 have been approved by the MTA Board for (1) the commuter railroadoperations of the MTA conducted by MTA Long Island Rail Road and MTA Metro-North Railroad (the “2005–2009Commuter Capital Program”), (2) the transit system operated by MTA New York City Transit and its subsidiary,MaBSTOA, and the rail system operated by MTA Staten Island Railway (the “2005–2009 Transit Capital Program”),and (3) the toll bridges and tunnels operated by MTA Bridges and Tunnels (the “2005–2009 MTA Bridges and TunnelsCapital Program”). The 2005–2009 MTA Bridges and Tunnels Capital Program was effective upon adoption by theMTA Bridges and Tunnels Board. The 2005–2009 Commuter Capital Program and the 2005–2009 Transit Capitalprogram (collectively, the “2005–2009 MTA Capital Programs”) have been approved by the CPRB.
The 2005–2009 MTA Capital Programs and the 2005–2009 MTA Bridges and Tunnels Capital Program throughDecember 31, 2006, provided for $21,331 in capital expenditures, of which $11,220 relates to ongoing repairs of, andreplacements to, the Transit System operated by MTA New York City Transit and MaBSTOA and the rail system oper-ated by MTA Staten Island Railway, $3,546 relates to ongoing repairs of, and replacements to, the commuter systemoperated by MTA Long Island Rail Road and MTA Metro-North Railroad, $4,575 relates to the expansion of existingrail networks for both the transit and commuter systems to be managed by MTA Capital Construction, $495 relates toa multi-faceted security program, $155 relates to MTA interagency initiatives including MTA Police Department plusan MTA-wide integrated computer systems initiative, $138 relates to MTA Bus company initiatives, and $1,202 relatesto the ongoing repairs of, and replacements to, MTA Bridges and Tunnels facilities.
The combined funding sources for the approved 2005–2009 MTA Capital Programs and the 2005–2009 MTABridges and Tunnels Capital Program include $9,441 in MTA and MTA Bridges and Tunnels Bonds, $1,450 in NewYork State general obligation bonds approved by the voters in the November 2005 election, $6,587 in Federal Fundsand $3,853 from other sources.
At December 31, 2006, $5,170 had been committed and $1,670 had been expended for the combined 2005-2009MTA Capital Programs and the 2005-2009 MTA Bridges and Tunnels Capital Program.
2000-2004 Capital ProgramCapital programs covering the years 2000-2004 have been approved by the MTA Board for (1) the commuter railroadoperations of the MTA conducted by MTA Long Island Rail Road and MTA Metro-North Railroad (the “2000-2004Commuter Capital Program”), (2) the transit system operated by the MTA New York City Transit and its subsidiary,MaBSTOA, and the rail system operated by MTA Staten Island Railway (the “2000-2004 Transit Capital Program”),and (3) the toll bridges and tunnels operated by MTA Bridges and Tunnels (the “2000-2004 MTA Bridges and TunnelsCapital Program”). The 2000-2004 MTA Bridges and Tunnels Capital Program was effective upon adoption by theMTA Bridges and Tunnels Board. The 2000-2004 Commuter Capital Program and the 2000-2004 Transit CapitalProgram (collectively, the “2000-2004 MTA Capital Programs”) have been approved by the CPRB.
The 2000-2004 MTA Capital Programs and the 2000-2004 MTA Bridges and Tunnels Capital Program throughDecember 31, 2006, which provides for $21,147 in capital expenditures, of which $10,295 relates to ongoing repairs of,and replacements to, the Transit System operated by MTA New York City Transit and MaBSTOA and the rail systemoperated by MTA Staten Island Railway, $3,959 relates to ongoing repairs of, and replacements to, the CommuterSystem operated by MTA Long Island Rail Road and MTA Metro-North Railroad, $4,689 relates to the expansion ofexisting rail networks for both the transit and commuter systems to be managed by MTA Capital Construction, $450relates to planning and design and customer service projects, $249 relates to World Trade Center repair projects, $1,003relates to the ongoing repairs and replacements to MTA Bridges and Tunnels facilities, and $502 relates to MTA Bus.
Notes to Consolidated Financial StatementsYears Ended December 31, 2006 and 2005
($ millions)
AR7001-Financials35 7/10/07 8:36 PM Page 33

34 M E T R O P O L I T A N T R A N S P O R T A T I O N A U T H O R I T Y
The combined funding sources for the approved 2000–2004 MTA Capital Programs and the 2000–2004 MTABridges and Tunnels Capital Program include $7,919 in bonds, $6,522 in Federal funds, $4,575 from the proceeds ofthe MTA/MTA Bridges and Tunnels debt restructuring in 2002 and $2,131 from other sources.
At December 31, 2006, $19,074 had been committed and $15,225 had been expended for the combined 2000-2004MTA Capital Programs and the 2000-2004 MTA Bridges and Tunnels Capital Program.
The federal government has a contingent equity interest in assets acquired by the MTA with federal funds, and upondisposal of such assets, the federal government may have a right to its share of the proceeds from the sale. This provi-sion has not been a substantial impediment to the MTA’s operation.
2—Significant Accounting Policies
In accordance with GASB Statement No. 20, Accounting and Financial Reporting for Proprietary Fund Accounting,the MTA applies all applicable GASB pronouncements as well as Financial Accounting Standards Board (“FASB”)Statements and Interpretations issued on or before November 30, 1989 that do not conflict with GASB pronounce-ments. The MTA has elected not to apply FASB Standards issued after November 30, 1989.
EstimatesFinancial statements prepared in accordance with GAAP require the use of estimates made by management for certainaccount balances and transactions. Actual results may differ from these estimates.
Principles of ConsolidationThe consolidated financial statements consist of MTAHQ, MTA Long Island Rail Road, MTA Metro-North Railroad,MTA Staten Island Railway, MTA Long Island Bus, FMTAC, MTA Bus, MTA Capital Construction, MTA New YorkCity Transit, and MTA Bridges and Tunnels. All significant related group transactions have been eliminated for consoli-dation purposes.
Basis of AccountingThe MTA follows enterprise fund and accrual basis of accounting, which is similar in presentation to private businessenterprises.
InvestmentsThe MTA’s investment policies comply with the New York State Comptroller’s guidelines for such policies. Those poli-cies permit investments in, among others, obligations of the U.S. Treasury, its agencies and instrumentalities, and repur-chase agreements secured by such obligations.
Investments expected to be utilized within a year of December 31 have been classified as current assets in the finan-cial statements.
All investments are recorded on the balance sheets at fair value and all investment income, including changes in thefair value of investments, is reported as revenue on the statement of revenues, expenses and changes in net assets. Fairvalues have been determined using quoted market values at December 31, 2006 and December 31, 2005.
Materials and SuppliesMaterials and supplies are valued principally at the lower of average cost or market value, net of obsolescence reserve.
Prepaid Expenses and Other Current AssetsPrepaid expenses and other current assets reflect advance payment of insurance premiums as well as farecard mediarelated with ticket machines, WebTickets and AirTrain tickets.
Capital AssetsProperties and equipment are carried at cost and are depreciated on a straight-line basis over estimated useful lives.Expenditures for maintenance and repairs are charged to operations as incurred.
Notes to Consolidated Financial StatementsYears Ended December 31, 2006 and 2005($ millions)
AR7001-Financials36 7/10/07 8:36 PM Page 34

35M E T R O P O L I T A N T R A N S P O R T A T I O N A U T H O R I T Y
Liability InsuranceFMTAC, an insurance captive subsidiary of MTA, operates a liability insurance program (“ELF”) that insures certainclaims in excess of the self-insured retention limits of the agencies on both a retrospective (claims arising from incidentsthat occurred before October 31, 2003) and prospective (claims arising from incidents that occurred on or afterOctober 31, 2003) basis. For claims arising from incidents that occurred on or after November 1, 2001, but beforeNovember 1, 2006, the self-insured retention limits are: $7 for MTA New York City Transit, MaBSTOA, MTA Bus,MTA Staten Island Railway, MTA Long Island Rail Road and MTA Metro-North Railroad; $2 for MTA Long IslandBus; and $1.4 for MTA and MTA Bridges and Tunnels. Effective November 1, 2006, the self-insured retention limitsfor ELF were increased to the following amounts: $8 for MTA New York City Transit, MaBSTOA, MTA Bus, MTAStaten Island Railway, MTA Long Island Rail Road and MTA Metro-North Railroad; $2.3 for MTA Long Island Bus;and $1.6 for MTA and MTA Bridges and Tunnels. The maximum amount of claims arising out of any one occurrenceis the total assets of the program available for claims, but in no event greater than $50. The retrospective portion con-tains the same insurance agreements, participant retentions, and limits as existed under the ELF program for occur-rences happening on or before October 30, 2003. On a prospective basis, FMTAC issues insurance policies indemnify-ing the MTA, its subsidiaries and affiliates above their specifically assigned self-insured retention with a limit of $50per occurrence with $50 annual aggregate. FMTAC charges appropriate annual premiums based on loss experienceand exposure analysis to maintain the fiscal viability of the program. On December 31, 2006, the balance of the assetsin this program was $82.5.
MTA also maintains an All-Agency Excess Liability Insurance Policy that affords the MTA and its subsidiaries andaffiliates additional coverage limits of $250, for a total limit of $300 ($250 excess of $50). In certain circumstances,when the assets in the program described in the preceding paragraph are exhausted due to payment of claims, theAll-Agency Excess Liability Insurance will assume the coverage position of $50.
On March 1, 2006, the “non-revenue fleet” automobile liability policy program was renewed. This program pro-vides third party auto liability insurance protection for the MTA and its member agencies with the exception of MTANew York City Transit and MTA Bridges and Tunnels. The policy provides $7.0 per occurrence limit with a $.5 peroccurrence deductible. FMTAC renewed its deductible buy back policy, where it assumes the liability of the agenciesfor their deductible.
On March 1, 2006, the “Access-A-Ride” automobile liability policy program was renewed. This program providesthird party auto liability insurance protection for the MTA New York City Transit’s Access-A-Ride program, includingthe contracted operators. This policy provides a $3.0 per occurrence limit with a $.5 per occurrence deductible.
On November 1, FMTAC increased the primary coverage on the Station Liability and Force Account liability poli-cies from $7 to $8 for MTA Metro-North Railroad and MTA Long Island Rail Road.
Property InsuranceEffective October 31, 2006, FMTAC renewed the all-agency property insurance program. For the period October 31,2006 through October 30, 2007, FMTAC directly insures property damage claims of the related entities in excess of a$25 per occurrence self-insured retention (“SIR”), subject to an annual $75 aggregate. Losses occurring after the reten-tion aggregate is exceeded are subject to a deductible of $7.5 per occurrence. The total program limit has been main-tained at $1.25 billion per occurrence covering property of the related entities collectively. With the exception of acts ofterrorism (both domestic and foreign), and subject to certain parts of the program limit that have been retained byFMTAC as discussed in the next paragraph, FMTAC is reinsured in the domestic, London, European and Bermudamarketplaces for this coverage. The storms in 2005 had a severe impact on pricing and capacity for property insurance.Although the market is beginning to stabilize given the absence of major catastrophes in 2006, available capacity atreasonable pricing levels remains tight. As a result, FMTAC was able to obtain additional reinsurance capacity overlast year (reducing the amount retained from $394.5 million for the year beginning October 31, 2005 to $267.9 mil-lion for the year beginning October 31, 2006), but continues to retain portions of upper tiers of the program limit. Thefollowing chart shows the portions of the tiers of the program limit that have been reinsured and the portions thathave been retained by FMTAC. Within each tier, losses would be shared on a pro rata basis.
Notes to Consolidated Financial StatementsYears Ended December 31, 2006 and 2005
($ millions)
AR7001-Financials37 7/10/07 8:36 PM Page 35

36 M E T R O P O L I T A N T R A N S P O R T A T I O N A U T H O R I T Y
AmountIncremental Amount RetainedInsurance Loss Reinsured by FMTAC
$ 0 – 25 $ 0.0 $ 25.025 – 125 100.0 0.0
125 – 175 50.0 0.0175 – 400 225.0 0.0400 – 700 300.0 0.0
700 – 1,000 57.1 242.91,000 – 1,250 250.0 0.0
Total $982.1 $267.9
The property insurance, which is subject to annual renewal on October 31, 2007, provides replacement cost cover-age for all risks of direct physical loss or damage to all real and personal property, with minor exceptions. The policyalso provides extra expense and business interruption coverages. With respect to acts of international terrorism com-mitted by or on behalf of foreign interests, as covered by the Terrorism Risk Insurance Act of 2002, and amended bythe Terrorism Risk Insurance Extension Act of 2005 (“2005 TRIA”), FMTAC is reinsured by the United StatesGovernment for 85% of such “certified” losses, subject to an annual cap on all losses payable under TRIA for $100billion. No federal compensation will be paid unless the aggregate industry insured losses exceed $100 (“trigger”). Theremaining 15% of MTA losses would be covered under an additional policy described below. TRIA coverage is providedthrough December 31, 2007. Negotiations are underway in Congress to extend the current arrangement, or implementa more permanent solution.
With respect to terrorism losses not covered by the United States Government under TRIA, MTA obtained an addi-tional commercial reinsurance policy with Lexington Insurance Co. (part of AIG). That policy provides coverage for(1) 15% of any “certified” act of terrorism caused by foreign interests — up to a maximum recovery of $150 for anyone occurrence, or (2) 100% of any terrorism loss not “certified” by the United States Government (including losseswithin the established event “trigger”) — up to a maximum recovery of $100 for any occurrence. This coverageexpires on December 31, 2007. Recovery under this policy is subject to a retention of $25 per occurrence and $75 inthe annual aggregate — in the event of multiple losses during the policy year. Should the MTA’s retention in any oneyear come to a total $75, then future losses in that policy year are subject to a retention of just $7.5.
Effective October 31, 2004 through October 30, 2005, FMTAC directly insured property damage claims of the MTAin excess of a $25 per occurrence self-insurance retention, subject to an annual $75 aggregate. The aggregate limitationof $1.25 billion per occurrence (up from $1 billion for the preceding year) covers all property of the related entitiescollectively. The property insurance provides replacement cost coverage for all risks of direct physical loss or damage toall real and personal property, with minor exceptions. The policy also provides extra expense and business interruptioncoverages.
Operating RevenuesPassenger Revenue and TollsRevenues from the sale of tickets, tokens, electronic toll collection system, and farecards are recognized as income asthey are used. Deferred revenue is recorded for the estimated amount of unused tickets, tokens and farecards.
Non Operating RevenuesOperating AssistanceThe MTA receives, subject to annual appropriation, NYS operating assistance funds that are generally recognized as rev-enue when all applicable eligibility requirements are met. Generally, funds received under the NYS operating assistanceprogram are fully matched by contributions from NYC and the seven other counties within the MTA’s service area.
Notes to Consolidated Financial StatementsYears Ended December 31, 2006 and 2005($ millions)
AR7001-Financials38 7/10/07 8:36 PM Page 36

37M E T R O P O L I T A N T R A N S P O R T A T I O N A U T H O R I T Y
Mortgage Recording Taxes (“MRT”)Under NYS law, the MTA receives capital and operating assistance through a Mortgage Recording Tax (MRT-1),which is collected by NYC and the seven other counties within the MTA’s service area, at the rate of .25 of one percentof the debt secured by certain real estate mortgages. Effective June 1, 2005, the rate was increased from 25 cents per100 dollars of recorded mortgage to 30 cents per 100 dollars of recorded mortgage. The MTA also receives an addi-tional Mortgage Recording Tax (MRT-2) of .25 of one percent of certain mortgages secured by real estate improved orto be improved by structures containing one to six dwelling units in the MTA’s service area. MRT-1 and MRT-2 taxesare recognized as revenue based upon reported amounts of taxes collected.
MRT-1 proceeds are initially used to pay MTAHQ’s operating expenses. Remaining funds, if any, are allocated55 percent to certain Transit Operations and 45 percent to the Commuter Railroads. The Commuter Railroad portionis first used to fund the NYS Suburban Highway Transportation Fund in an amount not to exceed $20 annually(subject to the moneys being returned under the conditions set forth in the governing statute if the CommuterRailroads are operating at a deficit). As of December 31, 2006 and 2005 the amount payable to the NYS SuburbanHighway Transportation Fund was $20 for each of the years. Of the MTA New York City Transit portion, the MTAdistributed $111.7 and $108.8 as of December 31, 2006 and December 31, 2005, respectively.
The first $5 of the MRT-2 proceeds is transferred to the MTA Dutchess, Orange and Rockland Fund ($1.5 each forDutchess and Orange Counties and $2 for Rockland County). Additionally, the MTA must transfer to each County’sfund an amount equal to the product of (i) the percentage by which each respective County’s mortgage recording taxpayments (both MRT-1 and MRT-2) to the MTA increased over such payments in 1989 and (ii) the base amountreceived by each county as described above. The counties do not receive any portion of the June 1, 2005 increase inMRT-1 from 25 cents per $100 of recorded mortgage to 30 cents. Excess amounts transferable to the counties as ofDecember 31, 2006 and December 31, 2005, were $15.1 and $18.1, respectively. Through December 31, 2006, theMTA has distributed $40.8 from the MRT-2 funds to the Commuter Railroads and $95.1 to MTA New York CityTransit for their current operations. In the same period in 2005 the MTA distributed from the MRT-2 funds $0 to theCommuter Railroads and $0 to MTA New York City Transit for their current operations. During 2006, $2.1 ofMRT-2 funds was transferred to fund the MaBSTOA Pension Plan and $267.1 was transferred to fund the MTADefined Benefit Pension Plan.
In addition, MTA New York City Transit Authority receives operating assistance directly from NYC through a mort-gage recording tax at the rate of .625 of one percent of the debt secured by certain real estate mortgages and through aproperty transfer tax at the rate of one percent of the assessed value (collectively referred to as “Urban Tax Subsidies”)of certain properties.
Dedicated TaxesUnder NYS law, subject to annual appropriation, the MTA receives operating assistance through a portion of theDedicated Mass Transportation Trust Fund (“MTTF”) and Metropolitan Mass Transportation Operating AssistanceFund (“MMTOA”). The MTTF receipts consist of a portion of the revenues derived from certain business privilegetaxes imposed by the State on petroleum businesses, a portion of the motor fuel tax on gasoline and diesel fuel, and aportion of certain motor vehicle fees, including registration and non-registration fees. Effective October 1, 2005, theState increased the amount of motor vehicle fees deposited into the MTTF for the benefit of the MTA. MTTF receiptsare applied first to meet certain debt service requirements or obligations and in the second instance are used to payoperating and capital costs. The MMTOA receipts are comprised of .375 of one percent regional sales tax (which wasincreased effective June 1, 2005 from .25 of one percent), a temporary regional franchise tax surcharge, a portion oftaxes on certain transportation and transmission companies, and an additional portion of the business privilege taximposed on petroleum businesses. MMTOA receipts, to the extent that MTTF receipts are not sufficient to meet debtservice requirements, will also be applied to certain debt service obligations, and secondly to operating and capitalcosts of the Transit System, and the Commuter Railroads.
Notes to Consolidated Financial StatementsYears Ended December 31, 2006 and 2005
($ millions)
AR7001-Financials39 7/10/07 8:36 PM Page 37

38 M E T R O P O L I T A N T R A N S P O R T A T I O N A U T H O R I T Y
The State Legislature enacts in an annual budget bill for each state fiscal year an appropriation to the MTADedicated Tax Fund for the then current state fiscal year and an appropriation of the amounts projected by theDirector of the Budget of the State to be deposited in the MTA Dedicated Tax Fund for the next succeeding state fiscalyear. The assistance deposited into the MTTF is required by law to be allocated, after provision for debt service onDedicated Tax Fund Bonds (see Note 6), 85 percent to certain Transit Operations (not including MTA Bus) and 15percent to the Commuter Railroads. Revenues from this funding source are recognized based upon amounts of taxreported collected by NYS, to the extent of the appropriation.
Operating Subsidies Recoverable from Connecticut Department of Transportation (“CDOT”)The portion of the deficit from operations relating to MTA Metro-North Railroad’s New Haven line is recoverablefrom CDOT. Under the terms of a renewed Service Agreement, which began on January 1, 2000, and the 1998 resolu-tion of an arbitration proceeding initiated by the State of Connecticut, CDOT pays 100 percent of the net operatingdeficit of MTA Metro-North Railroad’s branch lines in Connecticut (New Canaan, Danbury, and Waterbury), 65 per-cent of the New Haven mainline operating deficit, and a fixed fee for the New Haven line’s share of the net operatingdeficit of Grand Central Terminal (“GCT”) calculated using several years as a base, with annual increases for inflationand a one-time increase for the cost of operating GCT’s North End Access beginning in 1999. The Service Agreementalso provides that CDOT pay 100 percent of the cost of non-movable capital assets located in Connecticut, 100 per-cent of movable capital assets to be used primarily on the branch lines and 65 percent of the cost of other movablecapital assets allocated to the New Haven line. Remaining funding for New Haven line capital assets is provided by theMTA. The Service Agreement provides for automatic five-year renewals unless a notice of termination has been provided.The Service Agreement has been automatically renewed for an additional five years beginning January 1, 2005. Capitalassets completely funded by CDOT are not reflected in these financial statements, as ownership is retained by CDOT.The Service Agreement provides that final billings for each year are subject to audit by CDOT. Years subsequent to2000 remain subject to final audit.
Reimbursement of ExpensesThe cost of operating and maintaining the passenger stations of the Commuter Railroads in NYS is assessable by theMTA to NYC and the other counties in which such stations are located for each NYS fiscal year ending March 31,under provisions of the NYS Public Authorities Law. This funding is recognized as revenue based upon an amount,fixed by statute, for the costs to operate and maintain passenger stations and is revised annually by the increase ordecrease of the regional Consumer Price Index.
Pursuant to an agreement with NYS and NYC each pays to MTA $45 annually to cover a portion of the cost of thefree fare student program. The estimated cost of this program is approximately $176 for the 2006-2007 school year. Itis believed that NYC will continue to provide for the City’s $45 contribution for the 2006-2007 school year, of which$15 was received in December 2006. The Transit Operations approved 2007 Adopted Budget assumes that the remain-ing $30 from NYC will be received in 2007. It also assumes that the full $45 for the 2006-2007 school year will bereceived in 2007. The Transit Operation’s 2008-2010 Financial Plan assumes the continuation of the joint funding ofthe free fare program for students.
Policing of the transit system is carried out by the NYC Police Department at NYC’s expense. The MTA, however,continues to be responsible for certain capital costs and support services related to such police activities, a portion ofwhich is reimbursed by NYC. The MTA received approximately $3.7 in the twelve months ended December 31, 2006,and $3.8 in the twelve months ended December 31, 2005 from NYC for the reimbursement of transit police costs. Inaddition, $0.9 was received in February 2007 for calendar 2006.
Federal law and regulations require a paratransit system for passengers who are not able to ride the buses and trainsbecause of their disabilities. Pursuant to an agreement between NYC and the MTA, MTA New York City Transit hadassumed operating responsibility for all paratransit service required in NYC by the Americans with Disabilities Act of1990. The services are provided by private vendors under contract with MTA New York City Transit. NYC reimburses
Notes to Consolidated Financial StatementsYears Ended December 31, 2006 and 2005($ millions)
AR7001-Financials40 7/10/07 8:36 PM Page 38

39M E T R O P O L I T A N T R A N S P O R T A T I O N A U T H O R I T Y
the MTA for the lesser of 33.0 percent of net paratransit operating expenses defined as labor, transportation, andadministrative costs less fare revenues and 6.0 percent of gross Urban Tax Subsidies, or an amount that is 20.0 percentgreater than the amount paid by the City for the preceding calendar year. Fare revenue and reimbursements aggregatedapproximately $90.8 in the twelve months ended December 31, 2006, and $73.9 in the twelve months endedDecember 31, 2005. Total paratransit expenses, including paratransit service contracts, were $226.8 and $189.8 in2006 and 2005, respectively.
Grants and AppropriationsGrants and appropriations for capital projects are recorded when requests are submitted to the funding agencies for reim-bursement of capital expenditures and beginning in 2001 were recorded as nonoperating revenues in accordance withGASB Statement No. 33, Accounting and Financial Reporting for Nonexchange Transactions. These amounts are report-ed separately after Total non operating revenues in the Statements of Revenues, Expenses and Changes in Net Assets.
ReclassificationsCertain reclassifications have been made to prior year amounts to conform to the current year presentation.
Recent Accounting PronouncementsThe MTA has completed the process of evaluating the impact that will result from implementing GASB Statement No.44, Economic Condition Reporting: The Statistical Section. The MTA has concluded that the implementation of GASBStatement No. 44 had little impact on the MTA’s statistical section. GASB Statement No. 44 is effective for statisticalsections prepared for periods beginning after June 15, 2005.
The MTA has not completed the process of evaluating the impact that will result from adopting GASB StatementNo. 45, Accounting and Financial Reporting by Employers for Postemployment Benefits Other Than Pension. TheMTA is therefore unable to disclose the impact that adopting this statement will have on its financial position andresults of operations when such statement is adopted. The Statement establishes standards for the measurement, recog-nition, and display of OPEB expense/expenditures and related liabilities (assets), note disclosures, and if applicable,required supplementary information (RSI) in the financial reports of state and local governmental employers. TheStatement is effective for financial statement periods beginning after December 15, 2006.
The MTA has completed the process of evaluating the impact that will result from adopting GASB Statement No. 46, Net Assets Restricted by Enabling Legislation—an amendment of GASB Statement No. 34. The MTA has con-cluded that GASB No. 46 had no impact on its financial position and results from operations based upon the MTA’scurrent reporting of its net assets. The Statement clarifies the definition of a “legally enforceable” enabling legislationrestriction on a government’s net assets. The statement was effective for fiscal periods beginning after June 15, 2005.
The MTA has completed the process of evaluating the impact that will result from adopting GASB StatementNo. 47, Accounting for Termination Benefits. The MTA has concluded that the impact of adopting GASB No. 47 didnot have a material impact on its financial position and results of operations. The Statement establishes the accountingstandards for voluntary termination benefits (for example, early-retirement incentives) and involuntary benefits (forexample, severance benefits). The statement was effective for fiscal periods beginning after June 15, 2005.
The MTA has not completed the process of evaluating the impact that will result from adopting GASB StatementNo. 48, Sales and Pledges of Receivables and Future Revenues and Intra-Entity Transfer of Assets and FutureRevenues. The MTA is therefore unable to disclose the impact GASB Statement No. 48 will have on its financial posi-tion and results of operations when such statement is adopted. The Statement establishes criteria that governments willuse to ascertain whether proceeds received should be reported as revenue or as a liability. The statement is effective forfiscal periods beginning after December 15, 2006.
The MTA has not completed the process of evaluating the impact that will result from adopting GASB StatementNo. 49, Accounting and Financial Reporting for Pollution Remediation Obligations. The MTA is therefore unable todisclose the impact GASB Statement No. 49 will have on its financial position and results of operations when such state-ment is adopted. This Statement addresses accounting and financial reporting standards for pollution (including contam-ination) remediation obligations. The statement is effective for fiscal periods beginning after December 15, 2007.
Notes to Consolidated Financial StatementsYears Ended December 31, 2006 and 2005
($ millions)
AR7001-Financials41 7/10/07 8:36 PM Page 39

40 M E T R O P O L I T A N T R A N S P O R T A T I O N A U T H O R I T Y
3—Cash and Investments
Cash, including deposits in transit, consists of the following at December 31, 2006 and 2005:December December
2006 2005_____________________________________ _____________________________________
Carrying Bank Carrying BankAmount Balance Amount Balance
FDIC insured or collateralized deposits $ 72 $66 $ 75 $69Uninsured and not collateralized 83 14 63 6
$155 $80 $138 $75
All collateralized deposits are held by the MTA or its agent in the MTA’s name.
The MTA, on behalf of the Transit operations, MTA Bridges and Tunnels, MTA Long Island Bus and MTA Busoperations, invests funds which are not immediately required for the MTA’s operations in securities permitted by theNew York State Public Authorities Law, including repurchase agreements collateralized by U.S. Treasury securities, U.S.Treasury notes and U.S. Treasury zero coupon bonds.
The MTA’s uninsured and uncollateralized deposits are primarily held by commercial banks in the metropolitan NewYork area and are subject to the credit risks of those institutions.
Investments, at fair value, consist of the following at December 31, 2006 and 2005:December December
2006 2005_____________________________________ _____________________________________
Repurchase agreements $ 680 $ 627U.S. Treasuries due 2005-2020 1,639 1,384Investments restricted for capital lease obligations
U.S. Treasury Notes 8 8Treasury Strips 121 138Other Agencies 2,334 2,359
Sub-total 2,463 2,505Commercial Paper 651 685Other Agencies due 2005-2011 1,217 1,061
Total $2,463 $6,650 $2,505 $6,262
Fair values include accrued interest to the extent that interest is included in the carrying amounts. Accrued intereston investments other than Treasury bills and coupons is included in other receivables on the balance sheet. The MTA’sinvestment policy states that securities underlying repurchase agreements must have a market value at least equal to thecost of the investment. The net unrealized loss on investments for the twelve months ended December 31, 2006 was$13.0 as compared to a gain for the year ended December 31, 2005 of $6.8.
In connection with certain lease transactions described in Note 7, the MTA has purchased securities or entered intopayment undertaking, letter of credit, or similar type agreements or instruments (guaranteed investment contracts) withfinancial institutions that have a credit rating of AAA by Standard and Poor’s, which generate sufficient proceeds tomake payments under the terms of the leases. If the obligors do not perform, the MTA may have an obligation to makethe related rent payments.
All investments are either insured or registered and held by the MTA or its agent in the MTA’s name. Investments hadweighted average yields of 5.0 percent and 4.1 percent for the years ended December 31, 2006 and 2005, respectively.
Notes to Consolidated Financial StatementsYears Ended December 31, 2006 and 2005($ millions)
AR7001-Financials42 7/10/07 8:36 PM Page 40

41M E T R O P O L I T A N T R A N S P O R T A T I O N A U T H O R I T Y
Of the above cash and investments, amounts held for restricted purposes were as follows at December 31, 2006 andDecember 31, 2005:
December December2006 2005
Construction or acquisition of capital assets $1,858 $1,301Funds received from related groups for investment 1,071 897Debt service 489 590Payment of claims 269 304Restricted for capital leases 2,463 2,505Other 432 558
Total $6,582 $6,155
Credit RiskAt December 31, 2006, the following credit quality rating has been assigned to MTA investments by a nationally rec-ognized rating organization:
Quality Rating Percent ofMoody’s Total Portfolio
P-1 $1,352 29.50%Aaa 58 1.26%Aa 17 0.37%A 42 0.92%Baa 26 0.57%Not Rated 28 0.61%Gov’t/Gov’t Agencies 3,060 66.77%
Total $4,583 100.00%
Interest Rate RiskInterest rate risk is the risk that changes in interest rates will adversely affect the fair value of the investment. Durationis a measure of interest rate risk. The greater the duration of a bond or portfolio of bonds, the greater its price volatili-ty will be in response to a change in interest rate risk and vice versa. Duration is an indicator of bond price’s sensitivityto 100 basis point change in interest rates.Securities Fair Value Duration
U.S. Treasuries $1,583 0.38U.S. Agencies 1,018 0.52Tax Benefits Lease Investments 424 11.50Repurchase Agreement 715 0.01Certificate of Deposits 11 0.39Commercial Paper 637 0.08Mortgage Backed Securities 32 2.25Asset Backed Securities 43 0.74Collateralized Mortgage Backed Securities 21 4.09Corporates 82 0.95
Total Fair Value 4,566
Modified Duration 1.39Equities 17
Total $4,583
Notes to Consolidated Financial StatementsYears Ended December 31, 2006 and 2005
($ millions)
AR7001-Financials43 7/10/07 8:36 PM Page 41

42 M E T R O P O L I T A N T R A N S P O R T A T I O N A U T H O R I T Y
4—Employee Benefits
Substantially all of the MTA’s related groups and pension plans have separately issued financial statements that arepublicly available and contain descriptions and supplemental information regarding employee benefit plans. Thesestatements may be obtained by calling the administrative office of the respective related group.
Pension PlansThe MTA sponsors and participates in a number of pension plans for its employees. These plans are not componentunits of the MTA and are not included in the combined financial statements.
Defined-Benefit Pension PlansSingle-Employer Pension PlansThe Long Island Rail Road Company Pension Plan and the Long Island Rail Road Company Plan for AdditionalPensions (“Additional Plan”) are contributory, defined-benefit pension plans that cover employees who began servicewith MTA Long Island Rail Road prior to January 1, 1988. Benefit provisions are established by MTA Long IslandRail Road and are based on length of qualifying service and final average compensation.
The MaBSTOA Pension Plan is a defined-benefit plan covering substantially all of its employees. This plan assignsauthority to amend the plan and determine contributions to the MaBSTOA Board.
For the plan years ended December 31, 2006 and 2005, MTA New York City Transit made contributions to theMaBSTOA Plan of $159.6 and $153.4, respectively, equal to or in excess of the required contributions for each year. TheMTA Board recently approved amendments authorizing the MaBSTOA Plan to invest in alternative investments. Suchinvestments will be subject to specific investment guidelines and monitored by the Plan’s independent investment adviser.On September 28 and October 25, 2006, MTA made contributions to the MaBSTOA Plan of $100.0 and $.3 to reduceunfunded pension liabilities. In December 2006, MTA New York City Transit made an advance payment of $12.5.
MTA Staten Island Railway has a contributory defined-benefit plan that was a single-employer public employee retire-ment system covering certain employees. Authority to amend the plan and to determine contributions rests with theMTA Board. In 2005, that plan was merged with the MTA Defined Benefit Pension Plan and administered by the MTA.
Multi-Employer Pension PlanThe MTA Defined-Benefit Pension Plan (“MTA Plan”), a defined-benefit pension plan for certain MTA Long IslandRail Road non-represented employees hired after December 31, 1987, and MTA Metro-North Railroad non-represent-ed employees, certain MTA Long Island Bus employees hired prior to January 23, 1983, MTA Police, certain MTALong Island Rail Road represented employees hired after December 31, 1987, certain MTA Metro-North Railroad rep-resented employees, employees of MTA Staten Island Railway and certain employees of the MTA Bus Company(“MTA Bus”) is a cost-sharing multiple-employer retirement plan. MTA Long Island Rail Road, MTA Metro-NorthRailroad, MTA, MTA Staten Island Railway and MTA Bus contribute to the MTA Plan, which offers distinct retire-ment, disability, and death benefits for covered MTA Metro-North Railroad and MTA Long Island Rail Road employ-ees, covered MTA Bus employees and participants of the MTA 20-Year Police Retirement Program, MTA Long IslandBus Employees’ Pension Plan, and the SIRTOA Pension Program. Participants of the MTA Police Program contributeto that program at various rates. Annual pension costs and related information about this plan are presented in the fol-lowing table for all years presented as if the plan was a single-employer plan at the MTA level.
Beginning in 2005, certain employees of MTA Bus became participants of defined-benefit programs within the MTAPlan. Those programs, most of which are contributory, are based on the pension plans which covered these employeeswhen they were employed by the seven private bus companies which previously provided the service now provided byMTA Bus.
Notes to Consolidated Financial StatementsYears Ended December 31, 2006 and 2005($ millions)
AR7001-Financials44 7/10/07 8:36 PM Page 42

43M E T R O P O L I T A N T R A N S P O R T A T I O N A U T H O R I T Y
The MTA Board has approved plan and trust amendments to provide for and implement the merger of the LongIsland Rail Road (“LIRR”) Company Pension Plan into the MTA Defined Benefit Plan. The Board also approvedamendments pursuant to which the LIRR Plan for Additional Pensions, which includes the same members as the LIRRCompany Pension Plan, will participate in the MTA Plans’ Master Trust. In addition, the Board approved amendmentsauthorizing the MTA Plan to invest in alternative investments. Such investments will be subject to specific investmentguidelines and monitored by the Plan’s independent investment adviser. On September 28, 2006, MTA made a contri-bution to the MTA Master Trust of $363.7 to reduce unfunded pension liabilities of the MTA plan and the LIRR Planfor Additional Pensions. This amount has been allocated $229.7 to the MTA Plan and $134.0 to the LIRR Plan forAdditional Pensions. On October 25, 2006, an additional $1.4 was contributed to the Trust.
The MTA Plan may be amended by action of the MTA Board.
A stand-alone financial report may be obtained by writing to the MTA Comptroller, 347 Madison Avenue, NewYork, New York, 10017.
Annual pension costs and related information about each plan follows:Single-Employer Plans
LIRR MaBSTOA MTA PlanDate of valuation 1/1/06 1/1/06 1/1/06
Required contribution rates:Plan members variable variable variable
Employer: actuarially actuarially actuariallydetermined determined determined
Employer contributions made in 2006 $124.5 $260.0 $72.6
Three-year trend information:Annual Required Contribution:
2006 $124.5 $159.6 $72.62005 109.1 153.4 58.22004 102.8 142.0 54.7
Percentage of ARC contributed:2006 100% 163% 100%2005 100% 101% 100%2004 100% 101% 100%
Annual Pension Cost (APC):2006 $124.6 $157.6 $72.62005 109.2 151.4 58.22004 102.9 140.1 54.7
Net Pension Obligation (NPO) (assets) at end of year:2006 (4.6) (47.5) –2005 (4.6) 54.9 –2004 (4.7) 57.0 –
Percentage of APC contributed:2006 100% 165% 100%2005 100% 101% 100%2004 100% 101% 100%
Components of APC:Annual required contribution (ARC) $124.5 $159.6 $72.6Interest on NPO (0.3) 4.4 –Adjustment of ARC (0.4) 6.4 –
Notes to Consolidated Financial StatementsYears Ended December 31, 2006 and 2005
($ millions)
AR7001-Financials45 7/10/07 8:36 PM Page 43

44 M E T R O P O L I T A N T R A N S P O R T A T I O N A U T H O R I T Y
Single-Employer Plans
LIRR MaBSTOA MTA PlanAPC 124.6 157.6 72.6Contributions made 124.5 260.0 72.6
Change in NPO (assets) 0.1 (102.4) –NPO (assets) beginning of year (4.7) 54.9 –
NPO (assets) end of year $ (4.6) $ (47.5) $ –
Actuarial cost method Entry age Entry age Entry agenormal normal normal
frozen initial frozen initialliability liability
Method to determine actuarialvalue of plan assets 5-year 5-year 5-year
smoothing smoothing smoothing
Investment return 8.00% 8.00% 8.00%
Projected salary increases 3.5% 3.5% – 18.0% 3.5% – 36.2%
Consumer price inflation 2.50% 2.50% 2.50%
Amortization method and period level dollar / level dollar / level dollar /27 years 30 years 23 years
Period closed or open closed closed closed
Cost-Sharing Multiple-Employer PlansNew York City Employees’ Retirement System (“NYCERS”)
Plan DescriptionMTA New York City Transit and MTA Bridges and Tunnels contribute to the New York City Employees’ RetirementSystem, a cost-sharing multiple-employer retirement system for employees of NYC and certain other governmentalunits. NYCERS combines features of a defined-benefit pension plan with those of a defined-contribution pension plan.NYCERS provides pension benefits to retired employees based on salary and length of service. In addition, NYCERSprovides disability benefits, cost-of-living adjustments and death benefits subject to satisfaction of certain servicerequirements and other provisions. The NYCERS plan functions in accordance with existing NYS statutes and NYClaws and may be amended by action of the State Legislature. NYCERS issues a publicly available comprehensive annu-al financial report that includes financial statements and required supplementary information. That report may beobtained by writing to the New York City Employees’ Retirement System, 335 Adams Street, Suite 2300, Brooklyn,New York 11201.
Funding PolicyNYCERS is a contributory plan, except for certain employees who entered prior to July 27, 1976 who make no contri-bution. Employees who entered qualifying service after July 1976, contribute 3 percent of their salary. The State legisla-ture passed legislation in 2000 that suspended the 3 percent contribution for employees who have 10 years or more ofcredited service. MTA New York City Transit and MTA Bridges and Tunnels are required to contribute at an actuarial-ly determined rate. The contribution requirements of plan members and MTA New York City Transit and MTABridges and Tunnels are established and amended by law. MTA New York City Transit’s required contributions forNYCERS fiscal years ending June 30, 2006, and 2005 were $220.5 and $182.4, respectively. MTA Bridges andTunnels’ contributions to NYCERS for the years ended December 31, 2006 and 2005 were $12.9, and $10.1, respec-tively, which were equal to or in excess of the actuary’s recommendation, plus interest.
Notes to Consolidated Financial StatementsYears Ended December 31, 2006 and 2005($ millions)
AR7001-Financials46 7/10/07 8:36 PM Page 44

45M E T R O P O L I T A N T R A N S P O R T A T I O N A U T H O R I T Y
New York State and Local Employees’ Retirement System (“NYSLERS”)
Plan Description and Funding PolicyMTAHQ and MTA Long Island Bus employees who were hired after January 23, 1983, are members of NYSLERS.NYSLERS is a cost-sharing multiple-employer plan and offers a broad spectrum of benefits including retirement, deathand disability benefits and cost of living adjustments. Generally, employees contribute 3 percent of salary. In 2000, theState Legislature passed legislation that suspends the 3 percent contribution of members who have 10 or more years ofmember service. MTAHQ and MTA Long Island Bus recognize pension expense based upon annual assessments madeby NYSLERS. NYSLERS pension expense was approximately $11.2 and $11.8, for the years ended December 31,2006 and 2005, respectively, and was equal to the annual required contributions for each year. Further informationabout the plan is more fully described in the publicly available statement of NYSLERS and may be obtained by writingto New York State and Local Retirement System, Office of the State Comptroller, 110 State Street, Albany, New York,12244-0001.
Defined Contribution PlansSingle-EmployerThe Long Island Rail Road Company Money Purchase Plan (“Money Purchase Plan”) is a defined contribution planthat covers certain represented employees who began service with MTA Long Island Rail Road after December 31,1987. Effective January 1, 2004, employees who were participants in the Money Purchase Plan have become partici-pants in the MTA Plan and have similar benefits as those applicable to non-represented employees of MTA Long IslandRail Road in the MTA Plan.
The Metro-North Commuter Railroad Company Defined Contribution Pension Plan for Agreement Employees(“Agreement Plan”) established January 1, 1988, covers represented employees in accordance with applicable collectivebargaining agreements. Under this plan, MTA Metro-North Railroad will contribute an amount equal to 4 percent ofeach eligible employee’s gross compensation to the plan on that employee’s behalf. For employees who have 19 ormore years of service MTA Metro-North Railroad contributes 7 percent. In addition, employees may voluntarily matchMTA Metro-North Railroad’s contribution to the plan, on an after-tax basis. The plan is administered by MTA Metro-North Railroad and the Plan’s Board of Managers of Pension. Effective January 1, 2004, certain employees who wereparticipants of the Agreement Plan became participants in the MTA Plan and have similar benefits as those applicableto non-represented employees of MTA Metro-North Railroad in the MTA Plan.
December 31, December 31,2006 2005_____________________________________ _____________________________________
LIRR LIRRMoney MNCR Money MNCR
Purchase Agreement Purchase AgreementPlan Plan Plan Plan
Employer contributions $ – $10.8 $ – $10.8Employee contributions 0.3 0.6 0.7 0.6
Notes to Consolidated Financial StatementsYears Ended December 31, 2006 and 2005
($ millions)
AR7001-Financials47 7/10/07 8:36 PM Page 45

46 M E T R O P O L I T A N T R A N S P O R T A T I O N A U T H O R I T Y
Deferred Compensation PlansAs permitted by Internal Revenue Code Section 457, the MTA has established a trust or custodial account to hold planassets for the exclusive use of the participants and their beneficiaries. Plan assets and liabilities are not reflected on theMTA’s combined balance sheets.
Certain MTA employees are eligible to participate in a second deferred compensation plan established in accordancewith Internal Revenue Code Section 401(k). Participation in the plan is available to most represented and non-repre-sented employees. All amounts of compensation deferred under the plan, and all income attributable to such compen-sation, are in trust for the exclusive use of the participants and their beneficiaries. Accordingly, this plan is not reflectedin the accompanying combined balance sheets.
Other Post-Employment Benefits
In addition to providing pension benefits, the MTA provides healthcare, life insurance, and survivor benefits for certainretired employees and their families. These benefits are recorded on a pay-as-you-go basis. The cost of the benefits isshared in varying proportions by the employer and employee. The number of retirees and costs of providing the bene-fits by the MTA are as follows:
December 31, December 31,2006 2005__________________________________________ __________________________________________
Number of Number ofParticipants Cost of Participants Cost of
(Actual) Benefits (Actual) Benefits
MTA Total 42,198 $243.9 39,218 $233.0
5—Capital Assets
Capital assets and improvements include all land, buildings, equipment, and infrastructure of the MTA having a mini-mum useful life of two years, having a cost of more than $.025.
Capital assets are stated at historical cost, or at estimated historical cost based on appraisals, or on other acceptablemethods when historical cost is not available. Capital leases are classified as capital assets in amounts equal to the less-er of the fair market value or the present value of net minimum lease payments at the inception of the lease.
Accumulated depreciation and amortization are reported as reductions of fixed assets. Depreciation is computedusing the straight-line method based upon estimated useful lives of 25 to 50 years for buildings, 2 to 40 years forequipment, and 25 to 100 years for infrastructure. Capital lease assets and leasehold improvements are amortized overthe term of the lease or the life of the asset whichever is less. Capital assets consist of the following at December 31,2006 and December 31, 2005:
Notes to Consolidated Financial StatementsYears Ended December 31, 2006 and 2005($ millions)
AR7001-Financials48 7/10/07 8:36 PM Page 46

47M E T R O P O L I T A N T R A N S P O R T A T I O N A U T H O R I T Y
Balance Balance BalanceDecember 31, December 31, December 31,
2004 Additions Deletions 2005 Additions Deletions 2006
Capital assets, not beingdepreciatedLand $ 125 $ 11 $ – $ 136 $ 1 $ – $ 137Construction work-in-
progress 5,471 1,629 1,459 5,641 2,083 2,469 5,255
Total capital assets, notbeing depreciated 5,596 1,640 1,459 5,777 2,084 2,469 5,392
Capital assets, beingdepreciatedBuildings and structures 10,692 1,295 175 11,812 1,096 41 12,867Bridges and tunnels 1,604 43 – 1,647 65 – 1,712Equipment
Passenger cars andlocomotives 8,519 716 84 9,151 666 183 9,634
Buses 1,852 205 1 2,056 182 – 2,238Infrastructure 10,635 819 6 11,448 1,395 79 12,764Other 7,144 628 5 7,767 1,095 21 8,841
Total capital assets, beingdepreciated 40,446 3,706 271 43,881 4,499 324 48,056
Less accumulateddepreciationBuildings and structures 2,856 328 17 3,167 364 1 3,530Bridges and tunnels 337 16 – 353 15 – 368Equipment
Passenger cars andlocomotives 2,623 297 79 2,841 341 181 3,001
Buses 1,128 119 1 1,246 122 – 1,368Infrastructure 2,867 372 4 3,235 398 18 3,615Other 2,577 342 3 2,916 363 20 3,259
Total accumulateddepreciation 12,388 1,474 104 13,758 1,603 220 15,141
Total capital assets, beingdepreciated, net 28,058 2,232 167 30,123 2,896 104 32,915
Capital assets, net $33,654 $3,872 $1,626 $35,900 $4,980 $2,573 $38,307
Interest capitalized in conjunction with the construction of capital assets at December 31, 2006 and December 31,2005 was $75.9 and $70, respectively.
Capital assets acquired prior to April 1982 for MTA New York City Transit were funded primarily by NYC withcapital grants made available to MTA New York City Transit. NYC has title to a substantial portion of such assets and,accordingly, these assets are not recorded on the books of the MTA. Subsequent acquisitions, which are part of theMTA Capital Program, are recorded at cost by MTA New York City Transit. In certain instances, title to MTA Bridgesand Tunnels’ real property may revert to NYC in the event the MTA determines such property is unnecessary for itscorporate purpose. The MTA New York City Transit scrapped 10 subway cars and 3 buses during the year ended 2005and recorded a loss on disposal of $1.9. In the 12 months ended December 31, 2005, MTA Long Island Railroadretired 196 fully depreciated M-1 electric cars from revenue service. In addition, the overpass at the Jamaica stationconstructed to accommodate passengers with disabilities (ADA overpass) was demolished and taken out of service anda loss on disposal of assets of $18 was recorded. During the 2006, MTA Long Island Rail Road placed into service 244new M-7 electric cars and retired 206 M-1 electric cars and a locomotive from service, and MTA Metro-North pur-chased 76 new M-7, completed overhaul on 15 M-2 and disposed of 69 M-1 cars, 79 MU cars, 1 M-1 car, 2 M-3 carsand 1 Dual Mode locomotive.
Notes to Consolidated Financial StatementsYears Ended December 31, 2006 and 2005
($ millions)
AR7001-Financials49 7/10/07 8:36 PM Page 47

48 M E T R O P O L I T A N T R A N S P O R T A T I O N A U T H O R I T Y
For certain construction projects, the MTA holds in a trust account marketable securities pledged by third-party con-tractors in lieu of cash retainages. At December 31, 2006 and December 31, 2005 these securities totaled $71.6 and$76.1, respectively, and had a market value of $75.9 and $85.1 respectively, and are not included in these financialstatements.
6—Long-Term Debt
December 31, December 31,
2005 Issued Retired Refunded 2006
MTA:Transportation Revenue Bonds
2.25% – 5.752% due through 2035 $ 9,207 $1,193 $192 $268 $ 9,940
Transportation Revenue Bond Anticipation Notes Commercial Paper – 450 10 – 440
State Service Contract Bonds3.00% – 5.50% due through 2031 2,332 – 43 – 2,289
Dedicated Tax Fund Bonds3.00% – 6.25% due through 2031 3,278 760 66 – 3,972
Certificates of Participation4.40% – 5.625% due through 2029 443 – 12 – 431
15,260 2,403 323 268 17,072
Less net unamortized bond discount and premium (363) 65 3 14 (315)
$14,897 $2,468 $326 $282 $16,757
TBTA:General Revenue Bonds
4.00% – 5.77% due through 2033 $ 4,586 $ 200 $ 85 $ – $ 4,701
Subordinate Revenue Bonds4.00% – 5.77% due through 2032 2,364 – 40 – 2,324
6,950 200 125 – 7,025
Less net unamortized bond discount and premium 112 – 12 – 100
$7,062 $200 $137 $ – $ 7,125
Total $21,959 $2,668 $463 $282 $23,882
Current portion (306) (338)
Long-term portion $21,653 $23,544
MTA Transportation Revenue BondsPrior to 2005, MTA issued ten series of Transportation Revenue Bonds secured under its General ResolutionAuthorizing Transportation Revenue Obligation adopted on March 26, 2002 in the aggregate principal amount of$6,695. The Transportation Revenue Bonds are MTA’s special obligations payable solely from transit and commutersystems revenues and certain state and local operating subsidies.
During 2005, the MTA issued the following series of Transportation Revenue Bonds to finance transit and commuterprojects or to refund outstanding bonds: Series 2005A in the amount of $650; Series 2005B in the amount of $750;Series 2005C in the amount of $150; Series 2005D in the amount of $250; Series 2005E in the amount of $250; Series2005F in the amount of $469; Series 2005G in the amount of $250; and Series 2005H in the amount of $173. TheSeries 2005H was issued to redeem Series 2002C.
Notes to Consolidated Financial StatementsYears Ended December 31, 2006 and 2005($ millions)
AR7001-Financials50 7/10/07 8:36 PM Page 48
49M E T R O P O L I T A N T R A N S P O R T A T I O N A U T H O R I T Y
During 2006, the MTA issued the following Transportation Revenue Bonds: Series 2006A in the amount of $475 tofinance transit and commuter projects; and Series 2006B in the amount of $717.7 to pay in full the principal portion ofMTA’s outstanding commercial paper notes and to refund certain MTA bonds that were previously issued to fund tran-sit and commuter projects.
MTA Bond Anticipation Notes (commercial paper program)From time to time, MTA issues Transportation Revenue Bond Anticipation Notes in accordance with the terms andprovisions of the General Resolution described in the preceding paragraph in the form of commercial paper to fund itstransit and commuter capital needs. The interest rate payable on the notes depends on the maturity and market condi-tions at the time of issuance. Payment of principal and interest on the notes are additionally secured by a letter of cred-it issued by a bank. The MTA Act requires MTA to periodically refund (at least each five years), its commercial papernotes with bonds.
As of December 31, 2005, MTA issued its Transportation Revenue Bonds, Series 2005F and Series 2005G to refundits outstanding commercial paper program in the amount of $720. In March 2006 MTA issued TransportationRevenue Bond Anticipation Notes, Series CP-1 Credit Enhanced in the amount of $450.
MTA State Service Contract BondsPrior to 2005, MTA issued two series of State Service Contract Bonds secured under its state Service ContractObligation Resolution adopted on March 26, 2002, in the aggregate principal amount of $2,395. The State ServiceContract Bonds are MTA’s special obligations payable solely from certain payments from the State of New York undera service contract.
MTA Dedicated Tax Fund BondsPrior to 2005, MTA issued seven series of Dedicated Tax Fund Bonds secured under its Dedicated Tax Fund ObligationResolution adopted on March 26, 2002, in the aggregate principal amount of $3,391. The Dedicated Tax Fund Bondsare MTA’s special obligations payable solely from monies held in the Pledged Amounts Account of the MTA DedicatedTax Fund. State law requires that the MTTF revenues and MMTOA revenues (described above in footnote 2 under“Nonoperating Revenues”) be deposited, subject to appropriation by the State Legislature, into the MTA DedicatedTax Fund.
During 2005, the MTA issued the following series of Dedicated Tax Fund Bonds to refund outstanding bonds: Series2005A in the amount of $350.
During 2006, the MTA issued the following series of Dedicated Tax Fund Bonds to finance certain transit and com-muter projects: Series 2006A in the amount of $350; and Series 2006B in the amount of $410.
MTA Certificates of ParticipationPrior to 2005, MTA, MTA New York City Transit and MTA Bridges and Tunnels executed and delivered two series ofCertificates of Participation in the aggregate principal amount of $479 to finance certain building and leaseholdimprovements to an office building at Two Broadway in Manhattan occupied principally by MTA New York CityTransit, MTA Bridges and Tunnels, MTA Capital Construction and MTAHQ. The Certificates of Participation whichrepresent proportionate interests in the principal and interest components of Base Rent paid severally, but not jointly,in their respective proportionate shares by MTA New York City Transit, MTA and MTA Bridges and Tunnels, pur-suant to a Leasehold Improvement Sublease Agreement.
MTA Bridges and Tunnels General Revenue BondsPrior to 2005, MTA Bridges and Tunnels issued eight series of General Revenue Bonds secured under its GeneralResolution Authorizing General Revenue Obligations adopted on March 26, 2002, in the aggregate principal amountof $4,447. The General Revenue Bonds are MTA Bridges and Tunnels’ general obligations payable generally from thenet revenues collected on the bridges and tunnels operated by MTA Bridges and Tunnels.
During 2005, MTA Bridges and Tunnels issued the following series of General Revenue Bonds to finance bridge andtunnel projects or to refund outstanding bonds: Series 2005A in the amount of $150 and Series 2005B in the amountof $800.
Notes to Consolidated Financial StatementsYears Ended December 31, 2006 and 2005
($ millions)
AR7001-Financials51 7/10/07 8:37 PM Page 49

50 M E T R O P O L I T A N T R A N S P O R T A T I O N A U T H O R I T Y
During 2006, MTA Bridges and Tunnels issued the following series of General Revenue Bonds to finance bridge andtunnel projects: Series 2006A in the amount of $200.
MTA Bridges and Tunnels Subordinate Revenue BondsPrior to 2005, MTA Bridges and Tunnels issued nine series of Subordinate Revenue Bonds secured under its 2001Subordinate Revenue Resolution Authorizing Subordinate Revenue Obligations adopted on March 26, 2002, in theaggregate principal amount of $2,412. The Subordinate Revenue Bonds are MTA Bridges and Tunnels’ special obliga-tions payable generally from the net revenues collected on the bridges and tunnels operated by MTA Bridges andTunnels after the payment of debt service on the MTA Bridges and Tunnels General Revenue Bonds described in thepreceding paragraph.
Debt LimitationThe NYS Legislature has imposed limitations on the aggregate amount of debt that the MTA and MTA Bridges andTunnels can issue to fund the approved transit and commuter capital programs. The current aggregate ceiling, subjectto certain exclusions, is $28,877 compared with issuances totaling approximately $14,866 at December 31, 2006. TheMTA expects that the current statutory ceiling will allow it to fulfill the bonding requirements of the 2000-2004 MTACapital Program and the 2005-2009 MTA Capital program.
Bond RefundingsDuring 2002 as part of the Debt Restructuring, the MTA and MTA Bridges and Tunnels retired most of their outstand-ing debt with either funds available or by issuing new bonds. From time to time, the MTA and MTA Bridges andTunnels issue additional refunding bonds to achieve debt service savings or other benefits. The proceeds of refundingbonds are generally used to purchase U.S. Treasury obligations that were placed in irrevocable trusts. The principal andinterest within the trusts will be used to repay the refunded debt. The trust account assets and the refunded debt areexcluded from the consolidated balance sheets.
In accordance with GASB Statement No. 23, Accounting and Financial Reporting for Refundings of Debt Reportedby Proprietary Activities, gains or losses resulting from debt refundings have been deferred and will be amortized overthe lesser of the remaining life of the old debt or the life of the new debt.
At December 31, 2006, the following amounts of MTA bonds, which have been refunded, remain valid debt instru-ments and are secured solely by and payable solely from their respective irrevocable trusts.
MTA Transit and Commuter Facilities:Transit Facilities Revenue Bonds $1,529Commuter Facilities Revenue Bonds 1,480Commuter Facilities Subordinate Revenue Bonds 18Transit and Commuter Facilities Service Contract Bonds 895Dedicated Tax Fund Bonds 1,363Excess Loss Trust Fund 19
MTA New York City Transit:Transit Facilities Revenue Bonds (Livingston Plaza Project) 121
MTA Bridges and Tunnels:General Purpose Revenue Bonds 2,259Special Obligation Subordinate Bonds 214Mortgage Recording Tax Bonds 236
Total $8,134
Notes to Consolidated Financial StatementsYears Ended December 31, 2006 and 2005($ millions)
AR7001-Financials52 7/10/07 8:37 PM Page 50

51M E T R O P O L I T A N T R A N S P O R T A T I O N A U T H O R I T Y
Debt Service PaymentsPrincipal and interest debt service payments (excluding refunded bonds) at December 31, 2006, are as follows:
MTA MTA BRIDGES AND TUNNELS______________________________________ ___________________________________________________________________________________________________________________________Senior Subordinate Debt
Revenue Revenue Service______________________________________ ______________________________________ ______________________________________Principal Interest Principal Interest Principal Interest Principal Interest
2007 $ 324 $ 773 $ 87 $ 215 $ 43 $ 113 $ 454 $ 1,101
2008 337 758 97 210 44 111 478 1,079
2009 353 744 102 206 48 108 503 1,058
2010 368 728 106 202 50 105 524 1,035
2011 384 711 112 196 52 103 548 1,010
2012-2016 2,220 3,259 627 885 304 470 3,151 4,614
2017-2021 2,817 2,660 826 701 450 378 4,093 3,739
2022-2026 3,584 1,939 969 484 519 267 5,072 2,690
2027-2031 4,482 1,017 1,232 228 654 132 6,368 1,377
2032-2036 1,763 162 543 21 160 9 2,466 192
$16,632 $12,751 $4,701 $3,348 $2,324 $1,796 $23,657 $17,895
The above interest amounts include both fixed and variable rate calculations. The interest rate assumptions for variablerate bonds are as follows:
Dedicated Tax Fund Refunding Bonds, Series 2005A – 3.3156% per annum taking into account the interest rateswap
Transportation Revenue Bonds, Series 2005D – 3.561% per annum taking into account the interest rate swaps
Transportation Revenue Bonds, Series 2005E – 3.561% per annum taking into account the interest rate swaps
Transportation Revenue Bonds, Series 2005G – 4.00% per annum
Dedicated Tax Fund Bonds, Series 2004D – 4.00% per annum
Certificates of Participation, Series 2004A – 3.542% per annum taking into account the interest rate swaps
Transportation Revenue Bonds, Series 2004A – 4.00% per annum
Dedicated Tax Fund Bonds, Series 2004B – 4.00% per annum
Dedicated Tax Fund Bonds, Series 2002B – 4.06% per annum until September 1, 2013 based on the interest rateswap and 4.00% per annum thereafter
Transportation Revenue Refunding Bonds, Series 2002B – 4.00% per annum
Transportation Revenue Refunding Bonds, Series 2002D – 4.00% per annum and including net payments madeby MTA under the swap agreements
Transportation Revenue Refunding Bonds, Series 2002G – 4.00% per annum
MTA Bridges and Tunnels General Revenue Bonds, Series 2005A – 4.00% per annum
MTA Bridges and Tunnels General Revenue Refunding Bonds, Series 2005B – 3.513% per annum based on theBasis Risk Interest Rate Swap through January 1, 2012 and 3.076% per annum based on the Initial Interest RateSwaps thereafter.
MTA Bridges and Tunnels Subordinate Revenue Bonds, Series 2004A – 4.00% per annum
Notes to Consolidated Financial StatementsYears Ended December 31, 2006 and 2005
($ millions)
AR7001-Financials53 7/10/07 8:37 PM Page 51

52 M E T R O P O L I T A N T R A N S P O R T A T I O N A U T H O R I T Y
MTA Bridges and Tunnels Subordinate Refunding Bonds, Series 2000A and 2000B – 4.00% per annum andincluding net payments made by MTA Bridges and Tunnels under the swap agreements
MTA Bridges and Tunnels General Revenue Refunding Bonds, Series 2002D – 4.00% per annum
MTA Bridges and Tunnels General Revenue Refunding Bonds, Series 2002F – 4.00% per annum
MTA Bridges and Tunnels General Revenue Refunding Bonds, Series 2002G – 4.00% per annum
Tax Rebate LiabilityUnder the Internal Revenue Code of 1986, the MTA accrues a liability for an amount of rebateable arbitrage resultingfrom investing low-yielding, tax-exempt bond proceeds in higher-yielding, taxable securities. The arbitrage liability ispayable to the federal government every five years and is reported as part of other long-term liabilities. MTA made anarbitrage payment of $2.7 in 2005. No additional rebate liability was recorded for the year ended December 31, 2006.
Swap AgreementsBoard-adopted GuidelinesThe Related Entities adopted guidelines governing the use of swap contracts to manage the interest rate exposure oftheir debt. The Guidelines establish specific requirements that must be satisfied for a Related Entity to enter into aswap contract, such as suggested swap terms and objectives, credit ratings of the counterparties, collateralizationrequirements and reporting requirements.
Objectives of the SwapsIn order to protect against the potential of rising interest rates, to achieve a lower net cost of borrowing, to reduceexposure to changing interest rates on a related bond issue, or, in some cases where Federal tax law prohibits anadvance refunding, to achieve debt service savings through a synthetic fixed rate, MTA, MTA Bridges and Tunnels andMTA New York City Transit entered into separate pay-fixed, receive-variable interest rate swaps at a cost anticipatedto be less than what MTA, MTA Bridges and Tunnels and MTA New York City Transit would have paid to issuefixed-rate debt.
Fair ValueRelevant market interest rates on the valuation date of the swaps reflected in the following charts (December 31, 2006)in some cases were higher than, and in some cases were lower than, market interest rates on the effective date of theswaps. Consequently, as of the valuation date, some of the swaps had negative fair values and some had positive fairvalues. A negative fair value means that MTA, MTA Bridges and Tunnels and/or MTA New York City Transit wouldhave to pay the counterparty that approximate amount to terminate the swap. In the event there is a positive fairvalue, MTA, MTA Bridges and Tunnels and/or MTA New York City Transit would be entitled to receive a paymentfrom the counterparty to terminate the swap; consequently, MTA, MTA Bridges and Tunnels and/or MTA New YorkCity Transit would be exposed to the credit risk of the counterparties in the amount of the swaps’ fair value should theswap be terminated.
The fair values listed in the following tables represent the theoretical cost to terminate the swap as of the date indi-cated, assuming that a termination event occurred on that date. The fair values were estimated using the zero-couponmethod. This method calculates the future net settlement payments required by the swap, assuming that the currentforward rates implied by the yield curve correctly anticipate future spot interest rates. These payments are then dis-counted using the spot rates implied by the current yield curve for hypothetical zero-coupon bond due on the date ofeach future net settlement on the swap. In the event both parties continue to perform their obligations under the swap,there is not a risk of termination and neither party is required to make a termination payment to the other. MTA, MTABridges and Tunnels and MTA New York City Transit are not aware of any event that would lead to a terminationevent with respect to any of their existing swaps. See “Termination Risk” below.
Notes to Consolidated Financial StatementsYears Ended December 31, 2006 and 2005($ millions)
AR7001-Financials54 7/10/07 8:37 PM Page 52

53M E T R O P O L I T A N T R A N S P O R T A T I O N A U T H O R I T Y
Terms and Fair ValuesThe terms, fair values and counterparties of the outstanding swaps of MTA and MTA Bridges and Tunnels, as well asthe swaps entered into in connection with the 2 Broadway Certificates of Participation refunding, are reflected in thefollowing tables. The MTA swaps are reflected in separate tables for the Transportation Revenue Bonds and DedicatedTax Fund Bonds. The MTA Bridges and Tunnels swaps are reflected in separate tables for the senior lien and subordi-nate revenue bonds.
MTA Transportation Revenue BondsNotional Fair Amounts Values
as of Fixed Variable as of Swap Associated 12/31/06 Effective Rate Rate 12/31/06 Termination Bond Issue (in millions) Date Paid Received (in millions) Date Counterparty
Series 2002D-2 $200.0 05/30/02 3.627% BMA(1) $ 0.0 01/01/07 Bear Stearns Capital Markets Inc.
Series 2002D-2 200.0 01/01/07 4.45 69% of one-month (23.1) 11/01/32 Bear Stearns Capital LIBOR(2) Markets Inc.
Series 2005D and 500.0 11/02/05 3.561 67% of one-month (6.2) 11/01/35 60% – UBS AGSeries 2005E LIBOR 20% – Lehman Brothers
Special Financing Inc.20% – AIG Financial Products Corp.
Total $900.0 $(29.3)
(1) The Bond Market Association Municipal Swap Index™.
(2) London Interbank Offered Rate.
MTA Dedicated Tax Fund BondsNotional Fair Amounts Values
as of Fixed Variable as of Swap Associated 12/31/06 Effective Rate Rate 12/31/06 Termination Bond Issue (in millions) Date Paid Received (in millions) Date Counterparty
Series 2002B $440.0 09/05/02 4.06% Actual bond rate $(11.7) 09/01/13 Morgan Stanley Capital until 04/30/10, and Services Inc.thereafter, BMA
Series 2005A 346.6 03/24/05 3.3156 67% of one-month 5.9 11/01/31 Citigroup Financial LIBOR Products Inc.
Total $786.6 $ (5.8)
Notes to Consolidated Financial StatementsYears Ended December 31, 2006 and 2005
($ millions)
AR7001-Financials55 7/10/07 8:37 PM Page 53

54 M E T R O P O L I T A N T R A N S P O R T A T I O N A U T H O R I T Y
MTA Bridges and Tunnels Senior Lien Revenue BondsNotional Fair Amounts Values
as of Fixed Variable as of Swap Associated 12/31/06 Effective Rate Rate 12/31/06 Termination Bond Issue (in millions) Date Paid Received (in millions) Date Counterparty
Series 2001B $ 230.9 01/01/02 5.777% Actual bond rate $(27.0) 01/01/19 Citigroup Financial and 2001C(3) Products Inc.
Series 2002C(4) 77.2 01/01/00 5.634 Actual bond rate (7.3) 01/01/13 Ambac Financial Services, L.P.
Series 2005B 800.0 07/07/05 3.076 67% of one- 40.7 01/01/32 25% each – month LIBOR Citibank, N.A.,
JPMorgan Chase Bank, BNP Paribas North America, Inc. and UBS AG
Series 2005B 800.0 07/07/05 67% of BMA minus 10 (12.6) 01/01/12 UBS AGone-month basis pointsLIBOR plus 43.7 basis points(5)
Total $1,908.1 $ (6.2)
(3) In accordance with a swaption entered into on February 24, 1999 with the Counterparty paying to MTA Bridges and Tunnels a premium of $19.2.
(4) In accordance with a swaption entered into on February 24, 1999 with the Counterparty paying to MTA Bridges and Tunnels a premium of $8.4.
(5) For the purpose of mitigating the basis risk during the escrow period with respect to the $800 notional amount swaps entered into in connectionwith the Series 2005B Bonds, MTA Bridges and Tunnels will pay 67% of one month LIBOR plus 43.7 basis points to the UBS AG and receive a vari-able rate equal to the BMA Index minus 10 basis points.
MTA Bridges and Tunnels Subordinate Revenue BondsNotional Fair Amounts Values
as of Fixed Variable as of Swap Associated Bond 12/31/06 Effective Rate Rate 12/31/06 Termination Issue (in millions) Date Paid Received (in millions) Date Counterparty
Series 2000A $212.9 01/01/01 6.08% Actual bond rate $(29.8) 01/01/19 Bear Stearns Capital and 2000B(6) Markets Inc.
Series 2000C 212.8 01/01/01 6.07 Actual bond rate (29.7) 01/01/19 Citigroup Financial and 2000D(6) Products Inc.
Series 2002G-1 90.5 11/26/02 3.218 Lesser of actual (1.4) 01/01/18 JPMorgan Chase Bankbond rate, or 67% of one-month LIBOR minus 45 basis points
Series 2002G-2 90.5 11/26/02 3.218 Lesser of actual (1.6) 01/01/18 JPMorgan Chase Bankbond rate, or 67% of one-month LIBOR minus 45 basis points
Total $606.7 $(62.5)
(6) In accordance with a swaption entered into on August 12, 1998 with each Counterparty paying to MTA Bridges and Tunnels a premium of $22.7.
Notes to Consolidated Financial StatementsYears Ended December 31, 2006 and 2005($ millions)
AR7001-Financials56 7/10/07 8:37 PM Page 54

55M E T R O P O L I T A N T R A N S P O R T A T I O N A U T H O R I T Y
2 Broadway Certificates of Participation SwapsIn addition to the foregoing, MTA, MTA New York City Transit and MTA Bridges and Tunnels entered into separateISDA Master Agreements with UBS AG relating to the $357.9 Variable Rate Certificates of Participation, Series 2004A(Auction Rate Securities) in connection with the refunding of certain certificates of participation originally executed tofund certain improvements to the office building located at 2 Broadway in Manhattan. The 2 Broadway swaps have(1) an effective date of September 22, 2004, (2) a fixed rate paid of 3.092%, (3) a variable rate received of the lesser of(a) the actual bond rate, or (b) 67% of one-month LIBOR minus 45 basis points, and (4) a termination date ofJanuary 1, 2030. Based on the aggregate notional amount of $355.5 outstanding as of December 31, 2006, MTANew York City Transit is responsible for $244.3 aggregate notional amount of the swaps, MTA for $74.6 aggregatenotional amount, and MTA Bridges and Tunnels for $36.6 aggregate notional amount. As of December 31, 2006, theaggregate fair value of the swaps was ($2.1).
Counterparty RatingsThe current ratings of the counterparties are as follows:
Ratings of the Counterpartyor its Credit Support Provider
Counterparty S&P Moody’s Fitch
AIG Financial Products Corp. AA Aa2 AAAmbac Financial Services, L.P. AAA Aaa AAABear Stearns Capital Markets Inc. A+ A1 A+BNP Paribas North America, Inc. AA Aa2 AACitigroup Financial Products Inc. AA- Aa1 AA+JPMorgan Chase Bank AA- Aa2 A+Lehman Brothers Special Financing Inc. A+ A1 A+Morgan Stanley Capital Services Inc. A+ Aa3 AA-UBS AG AA+ Aa2 AA+
Except as set forth below, the notional amounts of the swaps match the principal amounts of the associated bonds.The following table sets forth the notional amount and the outstanding principal amount as of December 31, 2006 forthe swap where the notional amount does not match the outstanding principal amount of the associated bonds.
Principal Amount Notional
of Bonds AmountAssociated Bond Issue (in millions) (in millions)
MTA Bridges and Tunnels General Revenue Variable Rate Refunding Bonds, Series 2001B and 2001C $296.4 $230.9
MTA Bridges and Tunnels General Revenue Variable Rate Refunding Bonds, Series 2002C $103.3 $ 77.2
Except as discussed below under the heading “Rollover Risk,” the swap agreements contain scheduled reductions tooutstanding notional amounts that are expected to approximately follow scheduled or anticipated reductions in theprincipal amount of the associated bonds.
Risks Associated with the Swap AgreementsFrom MTA’s, MTA Bridges and Tunnels’ and MTA New York City Transit’s perspective, the following risks are gener-ally associated with swap agreements:
• Credit Risk – The counterparty becomes insolvent or is otherwise not be able to perform its financial obliga-tions. In the event of a deterioration in the credit ratings of the counterparty or MTA/MTA Bridges andTunnels/MTA New York City Transit, the swap agreement may require that collateral be posted to secure theparty’s obligations under the swap agreement. See “Collateralization” below. Further, ratings deterioration byeither party below levels agreed to in each transaction could result in a termination event requiring a cash settle-ment of the future value of the transaction. See “Termination Risk” below.
Notes to Consolidated Financial StatementsYears Ended December 31, 2006 and 2005
($ millions)
AR7001-Financials57 7/10/07 8:37 PM Page 55

56 M E T R O P O L I T A N T R A N S P O R T A T I O N A U T H O R I T Y
• Basis Risk – The variable interest rate paid by the counterparty under the swap and the variable interest ratepaid by MTA, MTA Bridges and Tunnels or MTA New York City Transit on the associated bonds may not bethe same. If the counterparty’s rate under the swap is lower than the bond interest rate, then the counterparty’spayment under the swap agreement does not fully reimburse MTA, MTA Bridges and Tunnels or MTA NewYork City Transit for its interest payment on the associated bonds. Conversely, if the bond interest rate is lowerthan the counterparty’s rate on the swap, there is a net benefit to MTA, MTA Bridges and Tunnels or MTA NewYork City Transit.
• Termination Risk – The swap agreement will be terminated and MTA, MTA Bridges and Tunnels or MTA NewYork City Transit will be required to make a termination payment to the counterparty.
• Rollover Risk – The notional amount under the swap agreement terminates prior to the final maturity of theassociated bonds on a variable rate bond issuance, and MTA, MTA Bridges and Tunnels or MTA New York CityTransit may be exposed to then market rates and cease to receive the benefit of the synthetic fixed rate for theduration of the bond issue.
Credit RiskThe following table shows, as of December 31, 2006, the diversification, by percentage of notional amount, among thevarious counterparties that have entered into ISDA Master Agreements with MTA and/or MTA Bridges and Tunnels,or in connection with the 2 Broadway Certificates of Participation refunding. The notional amount totals belowinclude both Bear Stearns swaps relating to the Transportation Revenue Bonds, Series 2002D-2 (one of which termi-nates on January 1, 2007, which is the date that the other swap becomes effective) and includes all five swaps (includ-ing the UBS basis risk swap) in connection with the MTA Bridges and Tunnels General Revenue Variable RateRefunding Bonds, Series 2005B. The counterparties have the ratings set forth above.
Notional % of Total Amount Notional
Counterparty (in millions) Amount
UBS AG $1,655.5 36.33%Citigroup Financial Products Inc. 990.3 21.73Bear Stearns Capital Markets Inc. 612.9 13.45Morgan Stanley Capital Services Inc. 440.0 9.66JPMorgan Chase Bank 381.0 8.36BNP Paribas North America, Inc. 200.0 4.39AIG Financial Products Corp. 100.0 2.19Lehman Brothers Special Financing Inc. 100.0 2.19Ambac Financial Services, L.P. 77.2 1.69
Total $4,556.9
The ISDA Master Agreements entered into with the following counterparties provide that the payments under onetransaction will be netted against other transactions entered into under the same ISDA Master Agreement:
• Bear Stearns Capital Markets Inc. with respect to the MTA Bridges and Tunnels Subordinate Revenue VariableRate Refunding Bonds, Series 2000A and 2000B,
• Citigroup Financial Products Inc. with respect to the MTA Bridges and Tunnels Subordinate Revenue VariableRate Refunding Bonds, Series 2000C and 2000D,
• Citigroup Financial Products Inc. with respect to the MTA Bridges and Tunnels General Revenue Variable RateRefunding Bonds, Series 2001B and 2001C, and
• Ambac Financial Services, L.P. (though there is only one transaction outstanding under that Master Agreement).
Under the terms of these agreements, should one party become insolvent or otherwise default on its obligations,close-out netting provisions permit the nondefaulting party to accelerate and terminate all outstanding transactions andnet the transactions’ fair values so that a single sum will be owed by, or owed to, the nondefaulting party.
Notes to Consolidated Financial StatementsYears Ended December 31, 2006 and 2005($ millions)
AR7001-Financials58 7/10/07 8:37 PM Page 56

57M E T R O P O L I T A N T R A N S P O R T A T I O N A U T H O R I T Y
CollateralizationGenerally, the Credit Support Annex attached to the ISDA Master Agreement requires that if the outstanding ratings ofMTA, MTA Bridges and Tunnels or MTA New York City Transit, as the case may be, or the counterparty falls to acertain level, the party whose rating falls is required to post collateral with a third-party custodian to secure its termi-nation payments above certain threshold amounts. Collateral must be cash or U.S. government or certain Federalagency securities.
The following tables set forth the ratings criteria and threshold amounts relating to the posting of collateral set forthfor MTA, MTA Bridges and Tunnels or MTA New York City Transit, as the case may be, and the counterparty foreach swap agreement. In most cases, the counterparty does not have a Fitch rating on its long-term unsecured debt, sothat criteria would not be applicable in determining if the counterparty is required to post collateral.
MTA Transportation Revenue Bonds
Notes to Consolidated Financial StatementsYears Ended December 31, 2006 and 2005
($ millions)
AssociatedBond Issue
If the highest rating of the related MTA bonds or the counterparty’s long-term unsecured debt falls to
Then the downgradedparty must post
collateral if its estimatedtermination payments
are in excess of
Series 2002D-2 Fitch – BBB+,Moody’s – Baa1, orS&P – BBB+
Fitch – BBB and below or unrated,Moody’s – Baa2 and below or unrated by S&P &Moody’s, orS&P – BBB and below or unrated
$10.0
$ 0.0
MTA Dedicated Tax Fund Bonds
Series 2005D and Series 2005E
Fitch – BBB+,Moody’s – Baa1, orS&P – BBB+
Fitch –below BBB+,Moody’s – below Baa1, orS&P – below BBB+
$10.0
$ 0.0
AssociatedBond Issue
If the highest rating of the related MTA bonds or the counterparty’s long-term unsecured debt falls to
Then the downgradedparty must post
collateral if its estimatedtermination payments
are in excess of
Series 2002B Fitch – BBB+, orS&P – BBB+
Fitch – BBB and below or unrated, orS&P – BBB and below or unrated
$10.0
$ 0.0
Series 2005A [Note: for this swap, MTAis not required to postcollateral under anycircumstances.]
Fitch – A-, orMoody’s – A3, orS&P – A-
Fitch – BBB+ and below, orMoody’s – Baa1 and below, orS&P – BBB+ and below
$10.0
$ 0.0
AR7001-Financials59 7/10/07 8:37 PM Page 57

58 M E T R O P O L I T A N T R A N S P O R T A T I O N A U T H O R I T Y
2 Broadway Certificates of Participation
MTA Bridges and Tunnels Senior Lien Revenue Bonds
Notes to Consolidated Financial StatementsYears Ended December 31, 2006 and 2005($ millions)
AssociatedAgencies
If the highest rating of the MTA Transportation Revenue Bonds falls to
Then MTA, MTA Bridges
and Tunnels and MTA
New York City Transit must
post collateral if its
estimated termination
payments are in excess of
AssociatedBond Issue
If the highest rating of the related MTA Bridges and Tunnels bonds or the
counterparty’s long-term unsecured debt falls to
Then the downgradedparty must post
collateral if its estimatedtermination payments
are in excess of
MTAMTA Bridges and TunnelsMTA New YorkCity Transit
Fitch – BBB+,Moody’s – Baa1, orS&P – BBB+
Fitch – BBB and below or unrated,Moody’s – Baa2 and below or unrated by S&P &Moody’s, orS&P – BBB and below or unrated
If the highest rating of the counterparty’s long-termunsecured debt falls to
$25.0
$ 0.0
Then the counterparty
must post collateral
if its estimated
termination payments
are in excess of
Moody’s — Baa1 or lower, orS&P — BBB+ or lower
$ 0.0
Series 2001B and 2001C N/A – Because MTA Bridges and Tunnels’ swap payments are insured, MTA Bridges andTunnels is not required to post collateral, but Citigroup is required to post collateral if itsestimated termination payments are in excess of $1,000,000.
Series 2002C N/A – Because MTA Bridges and Tunnels’ swap payments are insured, MTA Bridges andTunnels is not required to post collateral, but Ambac is required to post collateral if itsestimated termination payments are in excess of $1,000,000.
Series 2005B interest rateswap and Series 2005Bbasis risk swap
For counterparty,Fitch – A-, or Moody’s – A3, or S&P – A-
For MTA,Fitch – BBB+, or Moody’s – Baa1, or S&P – BBB+
For MTA,Fitch – BBB, or Moody’s – Baa2, or S&P – BBB
For counterparty,Fitch – BBB+ and below, or Moody’s – Baa1 and below, orS&P – BBB+ and below
For MTA,Fitch – BBB- and below, or Moody’s – Baa3 and below, orS&P – BBB- and below
$10.0
$30.0
$15.0
$ 0.0
$ 0.0
AR7001-Financials60 7/10/07 8:37 PM Page 58

59M E T R O P O L I T A N T R A N S P O R T A T I O N A U T H O R I T Y
MTA Bridges and Tunnels Subordinate Revenue Bonds
Notes to Consolidated Financial StatementsYears Ended December 31, 2006 and 2005
($ millions)
AssociatedBond Issue
If the highest rating of the related MTA Bridges and Tunnels bonds or the
counterparty’s long-term unsecured debt falls to
Then the downgradedparty must post
collateral if its estimatedtermination payments
are in excess of
Series 2000A and 2000B N/A – Because MTA Bridges and Tunnels’ swap payments are insured, MTA Bridges andTunnels is not required to post collateral, but Bear Stearns is required to post collateral ifits estimated termination payments are in excess of $1.0.
Series 2000C and 2000D N/A – Because MTA Bridges and Tunnels’ swap payments are insured, MTA Bridges andTunnels is not required to post collateral, but Citigroup is required to post collateral if itsestimated termination payments are in excess of $1.0.
Series 2002G-1 and 2002G-2
Fitch – BBB+,Moody’s – Baa1, orS&P – BBB+
Fitch – Below BBB+,Moody’s – Below Baa1, orS&P – Below BBB+
$10.0
$ 0.0
Notwithstanding the foregoing, in the event any downgraded party is responsible for an event of default or potentialevent of default as defined in the ISDA Master Agreement, the downgraded party must immediately collateralize itsobligations irrespective of the threshold amounts.
Under each MTA and MTA Bridges and Tunnels bond resolution, the payments relating to debt service on the swapsare parity obligations with the associated bonds, as well as all other bonds issued under that bond resolution, but allother payments, including the termination payments, are subordinate to the payment of debt service on the swap andall bonds issued under that bond resolution. In addition, MTA and MTA Bridges and Tunnels have structured each ofthe swaps (other than the 2 Broadway swaps) in a manner that will permit MTA or MTA Bridges and Tunnels to bondthe termination payments under any available bond resolution.
The payments relating to debt service on the 2 Broadway swaps are parity obligations with respect to the subleasepayments under the 2 Broadway Certificates of Participation, payable solely from available transportation revenuesafter the payment of the MTA’s transportation revenue bonds and additional parity and subordinate bonds. All otherpayments, including the termination payments, are payable from substantially the same pool of available transporta-tion revenues after the payment of the MTA’s transportation revenue bonds and additional parity and subordinatebonds.
The ISDA Master Agreement sets forth certain termination events applicable to all swaps entered into by the partiesto that ISDA Master Agreement. MTA, MTA Bridges and Tunnels and MTA New York City Transit have entered intoseparate ISDA Master Agreements with each counterparty that governs the terms of each swap with that counterparty,subject to individual terms negotiated in a confirmation.
AR7001-Financials61 7/10/07 8:37 PM Page 59

60 M E T R O P O L I T A N T R A N S P O R T A T I O N A U T H O R I T Y
The following table sets forth, for each swap, the additional termination events for the following associated bondissues. In certain swaps, where the counterparty has a guarantor of its obligations, the ratings criteria applies to theguarantor and not to the counterparty.
MTA Transportation Revenue and Dedicated Tax Fund Bonds
Notes to Consolidated Financial StatementsYears Ended December 31, 2006 and 2005($ millions)
AssociatedBond Issue Additional Termination Event(s)
Transportation Revenue Bonds
Series 2002D-2 (both swaps), Series2005D and Series 2005E
The ratings by S&P and Moody’s of the counterparty or the MTATransportation Revenue Bonds falls below “BBB-” and “Baa3,” respectively,or are withdrawn.
Dedicated Tax Fund Bonds
Series 2002B The ratings by S&P and Fitch of the counterparty or the MTA Dedicated TaxFund Bonds falls below “BBB-” or are withdrawn.
Series 2005A Bonds The ratings by S&P or Moody’s of the counterparty fall below “BBB+” or“Baa1,” respectively, or the ratings of S&P or Fitch with respect to the MTADedicated Tax Fund Bonds falls below “BBB” or, in either case the ratings arewithdrawn.
2 Broadway
AssociatedBond Issue Counterparty Additional Termination Event(s)
2 Broadway Certificates ofParticipation, Series 2004A
UBS AG Negative financial events relating to the swap insurer,Ambac Assurance Corporation.
MTA Bridges and Tunnels Senior and Subordinate Revenue Bonds
AssociatedBond Issue Additional Termination Events
Senior Lien Revenue Bonds
Series 2001B and 2001C and Series2002C
1. MTA Bridges and Tunnels can elect to terminate the swap relating to thatSeries on 10 Business Days’ notice if the Series of Bonds are converted to afixed rate, the fixed rate on the converted Bonds is less than the fixed rate onthe swap and MTA Bridges and Tunnels demonstrates its ability to make thetermination payments, or MTA Bridges and Tunnels redeems a portion of theSeries of Bonds and demonstrates its ability to make the termination payments.
2. Negative financial events relating to the related swap insurer, AmbacAssurance Corporation.
Series 2005B interest rate swap andbasis risk swap
The ratings by S&P or Moody’s of the counterparty fall below “BBB+” or“Baa1,” respectively, or the ratings of S&P or Moody’s with respect to theMTA Bridges and Tunnels Senior Lien Revenue Bonds falls below “BBB” or“Baa2,” respectively, or , in either case the ratings are withdrawn.
AR7001-Financials62 7/10/07 8:37 PM Page 60

61M E T R O P O L I T A N T R A N S P O R T A T I O N A U T H O R I T Y
Rollover RiskMTA and MTA Bridges and Tunnels are exposed to rollover risk on swaps that mature or may be terminated prior tothe maturity of the associated debt. When these swaps terminate, MTA or MTA Bridges and Tunnels may not realize thesynthetic fixed rate offered by the swaps on the underlying debt issues. The following debt is exposed to rollover risk:
Bond SwapMaturity Termination
Associated Bond Issue Date Date
MTA Dedicated Tax Fund Variable Rate Bonds, Series 2002B 11/01/22 09/01/13MTA Bridges and Tunnels General Revenue Variable Rate Refunding Bonds,
Series 2001B and 2001C 01/01/32 01/01/19MTA Bridges and Tunnels General Revenue Variable Rate Refunding Bonds, Series 2002C 01/01/33 01/01/13MTA Bridges and Tunnels Subordinate Revenue Variable Rate Refunding Bonds,
Series 2002G(1) 11/01/32 01/01/18(1) The swap relating to the Subseries 2002G-1 Bonds in the notional amount of $90.5 may be terminated at the option of MTA Bridges and Tunnelson or after December 29, 2010, and the swap relating to the Subseries 2002G-2 Bonds in the notional amount of $90.5 may be terminated at theoption of MTA Bridges and Tunnels on or after January 5, 2011.
It should also be noted that, in connection with the MTA Bridges and Tunnels Subordinate Revenue Variable RateRefunding Bonds, Series 2000A, 2000B, 2000C and 2000D, currently, all of the principal of the bonds is scheduled tobe amortized through sinking fund redemption payments by the time of the swap’s termination; however, MTA Bridgesand Tunnels has retained the right to readjust the sinking fund payments to decrease the amounts of the sinking fundpayments currently scheduled and to extend the amortization period of the Series 2000A — D Bonds to January 1,2031. A readjustment of the sinking fund payments would not change the scheduled decreases in notional amounts ofthe associated swap. As a result, the principal amount of the bonds outstanding would exceed the notional amount ofthe associated swap. However, if MTA Bridges and Tunnels decided to readjust the sinking fund schedules, MTA Bridgesand Tunnels would be exposed to rollover risk at the swap termination date. MTA Bridges and Tunnels could readjustsuch sinking fund redemption schedules only upon delivery of an opinion of nationally recognized bond counsel meetingthe conditions of the bond resolutions. MTA Bridges and Tunnels has no current intention of exercising these rights.
Notes to Consolidated Financial StatementsYears Ended December 31, 2006 and 2005
($ millions)
MTA Bridges and Tunnels Senior and Subordinate Revenue Bonds
AssociatedBond Issue Additional Termination Events
Subordinate Revenue Bonds
Series 2000A, 2000B, 2000C and2000D
1. MTA Bridges and Tunnels can elect to terminate the swap relating to thatSeries on 10 Business Days’ notice if the Series of Bonds are converted to afixed rate, the fixed rate on the converted Bonds is less than the fixed rate onthe swap and MTA Bridges and Tunnels demonstrates its ability to make thetermination payments, or MTA Bridges and Tunnels redeems a portion of theSeries of Bonds and demonstrates its ability to make the termination payments.
2. Negative financial events relating to the related swap insurer, FinancialSecurity Assurance Inc.
Series 2002G-1 and Series 2002G-2 1. The ratings by S&P and Moody’s of the counterparty or the MTA Bridgesand Tunnels Subordinate Revenue Bonds falls below “BBB-” and “Baa3,”respectively, or are withdrawn.
2. MTA Bridges and Tunnels may terminate the swap at no cost on or afterDecember 29, 2010 in the case of the Series 2002G-1 swap, and on or afterJanuary 5, 2011 in the case of the Series 2002G-2 swap.
AR7001-Financials63 7/10/07 8:37 PM Page 61

62 M E T R O P O L I T A N T R A N S P O R T A T I O N A U T H O R I T Y
Swap Payments and Associated DebtThe following tables contain the aggregate amount of estimated variable-rate bond debt service and net swap paymentsduring certain years that such swaps were entered into in order to: protect against the potential of rising interest rates;achieve a lower net cost of borrowing; reduce exposure to changing interest rates on a related bond issue; or, in somecases where Federal tax law prohibits an advance refunding, achieve debt service savings through a synthetic fixed rate.As rates vary, variable-rate bond interest payments and net swap payments will vary. Using the following assumptions,debt service requirements of MTA’s and MTA’s outstanding variable-rate debt and net swap payments are estimated tobe as follows:
• It is assumed that the variable-rate bonds would bear interest at a rate of 4.0% per annum.• The net swap payments were calculated using the actual fixed interest rate on the swap agreements.
MTA (in millions)
Variable-Rate BondsNet Swap
Fiscal Year Ending December 31 Principal Interest Payments Total
2007 $ 1.5 $ 59.5 $ (3.4) $ 57.52008 1.5 59.4 (3.4) 57.52009 1.6 59.3 (3.4) 57.62010 1.7 59.3 (3.4) 57.62011 1.7 59.2 (3.4) 57.62012-2016 144.0 289.0 (17.5) 415.62017-2021 398.3 235.0 (16.3) 617.02022-2026 303.8 157.0 (10.9) 449.92027-2031 381.2 98.1 (3.8) 475.52032-2036 251.3 16.8 (0.1) 267.9
MTA Bridges and Tunnels (in millions)
Variable-Rate BondsNet Swap
Fiscal Year Ending December 31 Principal Interest Payments Total
2007 $ 26.3 $ 71.2 $ 4.5 $ 102.02008 34.1 69.8 3.5 107.42009 36.4 68.4 3.0 107.72010 38.2 66.9 2.1 107.22011 41.1 65.2 1.2 107.52012-2016 274.1 295.2 (14.4) 554.82017-2021 225.6 239.1 (34.7) 429.92022-2026 217.0 200.1 (33.0) 384.22027-2031 691.0 119.1 (22.1) 788.02032-2036 222.7 0.3 – 222.9
7—Lease Transactions
Hillside FacilityOn March 31, 1997, the MTA entered into a lease/leaseback transaction with a third party whereby the MTA leasedMTA Long Island Rail Road’s Hillside maintenance facility. The term of the lease is 22 years, but the third party hasthe right to renew for a further 21.5 year term. The facility was subsequently subleased back to the MTA as a capitallease, and sub-subleased by the MTA to MTA Long Island Rail Road.
Notes to Consolidated Financial StatementsYears Ended December 31, 2006 and 2005($ millions)
AR7001-Financials64 7/10/07 8:37 PM Page 62

63M E T R O P O L I T A N T R A N S P O R T A T I O N A U T H O R I T Y
Under the terms of the lease/leaseback agreement, the MTA initially received $314, which was utilized as follows.The MTA paid $266 to an affiliate of the third party’s lender, which has the obligation to make a portion of subleaserent payments equal to this amount, thereby eliminating the need for the MTA to make these payments to the thirdparty. The MTA used $21 to purchase Treasury securities, which it deposited under pledge to the third party. Thisdeposit, together with the aforementioned obligation of the third party’s lender, resulted in a financial defeasance of allsublease obligations, including the cost of purchasing the third party’s remaining rights at the end of the 22 year sub-lease period, if the purchase option is exercised. A further $.6 was used to pay for legal and other costs of the transac-tion, and $3 was used to pay the first rental payment under the sublease. A further $23 is the MTA’s net benefit fromthe transaction, representing consideration for the tax benefits. MTA Bridges and Tunnels has entered into a guaranteewith the third party that the sublease payments will be made. At December 31, 2006, the MTA has recorded a long-term capital obligation and capital asset of $274 arising from the transaction.
Subway and Rail CarsOn December 12, 1997, the MTA entered into lease/leaseback transactions whereby the MTA leased certain of MTAMetro-North Railroad’s rail cars to a third party and MTA New York City Transit leased certain subway maintenancecars to the same third party. The lease periods for MTA Metro-North Railroad’s rail cars expire between 2009 and2014, depending on the asset, and the lease period for MTA New York City Transit’s subway maintenance cars expiresin 2013. The third party has the right to renew the lease for an additional period of 12 years for MTA Metro-NorthRailroad cars, depending on the asset, and a further 12 years for MTA New York City Transit’s subway maintenancecars. The cars were subsequently subleased back to the MTA as a capital lease, and sub-subleased by the MTA to MTAMetro-North Railroad and MTA New York City Transit, respectively.
Under the terms of the lease/leaseback agreement, the MTA initially received $76.6, which was utilized as follows:The MTA paid $59.8 to an affiliate of the third party’s lender, which has the obligation to make a portion of subleaserent payments equal to this amount, thereby eliminating the need for the MTA to make these payments to the thirdparty. The MTA used $12.5 to purchase a Letter of Credit from an affiliate of the third-party’s lender, guaranteed bythe third-party lender’s parent. This payment, together with the aforementioned obligation of the third-party’s lender, issufficient to settle all obligations, including the cost of purchasing the third party’s remaining rights at the end of thesublease period if the purchase options are exercised. At December 31, 2006, the MTA has recorded a long-term capi-tal obligation and capital asset of $44 arising from the transaction. The net proceeds are deferred and amortized tooperations over the period of the lease.
On September 25, 2002 and December 17, 2002 the MTA entered into four sale/leaseback transactions wherebyMTA New York City Transit transferred ownership of certain MTA New York City Transit subway cars to the MTA,the MTA sold those cars to third parties, and MTA leased those cars back from such third parties. The MTA subleasedthe cars to MTA New York City Transit. The four leases expire in 2032, 2034, 2033, and 2033, respectively. At thelease expiration, the MTA has the option of either exercising a fixed price purchase option for the cars or returning thecars to the third party owner.
Under the terms of the sale/leaseback agreements, the MTA initially received $1,514.9, which was utilized as follows:The MTA paid $1,058.6 to affiliates of certain of the lenders to the third parties, which affiliates have the obligation tomake a portion of the lease rent payment equal to the debt service on the related loans, thereby eliminating the needfor MTAHQ to make these payments to the third parties. The MTA also purchased Freddie Mac, FNMA, and U.S.Treasury debt securities in amounts and with maturities which are sufficient to make the lease rent payments equal tothe debt service on the loans from the other lenders to the third parties. In the case of one of the four leases, MTAHQalso purchased Freddie Mac debt securities in amounts and with maturities which are expected to be sufficient to paythe remainder of the lease rent payments under that lease and the purchase price due upon exercise by the MTA of thepurchase option if exercised. In the case of the other three leases, the MTA entered into Equity Payment Agreementswith Premier International Funding Co. (which are guaranteed by Financial Security Assurance, Inc.) whereby thatentity has the obligation to provide to the MTA the amounts necessary to make the remainder of the basic lease rentpayments under the leases and to pay the purchase price due upon exercise by the MTA of the purchase options if
Notes to Consolidated Financial StatementsYears Ended December 31, 2006 and 2005
($ millions)
AR7001-Financials65 7/10/07 8:37 PM Page 63

64 M E T R O P O L I T A N T R A N S P O R T A T I O N A U T H O R I T Y
exercised. The amount remaining after payment of transaction expenses, $96.2, was the MTA’s net benefit from thesefour transactions. These amounts are deferred and amortized to operations over the period of the lease.
During 1995, MTA Bridges and Tunnels entered into a sale/leaseback transaction with a third party whereby the MTABridges and Tunnels sold certain subway cars, which were contributed by the MTA New York City Transit, for net pro-ceeds of $84.2. These cars were subsequently leased back by MTA Bridges and Tunnels under a capital lease. The deferredcredit of $34.2 was netted against the carrying value of the leased assets, and the assets were recontributed to the MTANew York City Transit. MTA Bridges and Tunnels transferred $5.5 to the MTA, representing the net economic benefit ofthe transaction. The remaining proceeds, equal to the net present value of the lease obligation, of which $71.3 was placedin an irrevocable deposit account and $7.5 was invested in U.S. Treasury Strips. The estimated yields and maturities of thedeposit account and the Treasury Strips are expected to be sufficient to meet all obligations under the lease as they becomedue. The capital lease obligation is included in other long-term liabilities. At the end of the lease term MTA Bridges andTunnels has the option to purchase the subway cars for approximately $106 which amount has been reflected in the netpresent value of the lease obligation, or to make a lease termination payment of approximately $89.
QTE Lease TransactionsOn December 19, 2002, the MTA entered into four sale/leaseback transactions whereby MTA New York City Transittransferred ownership of certain MTA New York City Transit qualified technological equipment (QTE) relating to theMTA New York City Transit automated fare collection system to the MTA. The MTA sold that equipment to thirdparties and the MTA leased that equipment back from such third parties. The MTA subleased the equipment to MTANew York City Transit. The four leases expire in 2022, 2020, 2022, and 2020, respectively. At the lease expiration theMTA has the option of either exercising a fixed price purchase option for the equipment or returning the equipment tothe third-party owner.
Under the terms of the sale/leaseback agreements the MTA initially received $507.4, which was utilized as follows: TheMTA paid $316.2 to affiliates of certain of the lenders to the third parties, which affiliates have the obligation to make aportion of the lease rent payment equal to the debt service on the related loans, thereby eliminating the need for the MTAto make these payments to the third parties. The MTA also purchased FNMA and U.S. Treasury debt securities inamounts and with maturities which are sufficient to make the lease rent payments equal to the debt service on the loansfrom the other lenders to the third parties. In the case of three of the four leases the MTA also purchased U.S. Treasurydebt securities in amounts and with maturities which are expected to be sufficient to pay the remainder of the lease rentpayments under those leases and the purchase price due upon exercise by the MTA of the purchase options if exercised. Inthe case of the other lease the MTA entered into an Equity Payment Undertaking Agreement with XL Insurance(Bermuda) Ltd. (which is guaranteed by XL Financial Assurance Ltd.) whereby that entity has the obligation to provide tothe MTA the amounts necessary to make the remainder of the basic lease rent payments under that lease and to pay thepurchase price due upon exercise by the MTA of the purchase option if exercised. The amount remaining after payment oftransaction expenses, $57.6, was the MTA’s net benefit from these four transactions. As consideration for the cooperationof the City of New York in these transactions, including the transfer of any property interests held by the City on suchequipment to MTA New York City Transit and the MTA, the MTA is obligated to pay to the City 24.11% of the net ben-efit received from these four QTE transactions. At December 31, 2005, MTA had paid the City of New York $13.7.
On June 3, 2003, the MTA entered into a sale/leaseback transaction whereby MTA New York City Transit trans-ferred ownership of certain MTA New York City Transit subway cars to the MTA, the MTA sold those cars to a thirdparty, and the MTA leased those cars back from such third party. The MTA subleased the cars to MTA New York CityTransit. The lease expires in 2033. At the lease expiration, the MTA has the option of either exercising a fixed pricepurchase option for the cars or returning the cars to the third-party owner.
Under the terms of the sale/leaseback agreement, the MTA initially received $168.1 million, which was utilized asfollows: The MTA paid $126.3 to an affiliate of one of the lenders to the third party, which affiliate has the obligationto make a portion of the lease rent payment equal to the debt service on the related loan, thereby eliminating the needfor MTAHQ to make these payments to third parties. The MTA also purchased FNMA and U.S. Treasury securities inamounts and with maturities which are sufficient to make the lease rent payments equal to the debt service on the
Notes to Consolidated Financial StatementsYears Ended December 31, 2006 and 2005($ millions)
AR7001-Financials66 7/10/07 8:37 PM Page 64

65M E T R O P O L I T A N T R A N S P O R T A T I O N A U T H O R I T Y
loans from the other lender to the third party and to pay the remainder of the rent under that lease and the purchaseprice due upon exercise by the MTA of the purchase option if exercised. The amount remaining after payment of trans-action expenses, $7.4, was the MTA’s benefit from the transaction.
On September 25, 2003 and September 29, 2003, MTA entered into two sale/leaseback transactions whereby MTANew York City Transit transferred ownership of certain MTA New York City Transit subway cars to MTA, MTA soldthose cars to third parties, and MTA leased those cars back from such third parties. MTA subleased the cars to MTANew York City Transit. Both leases expire in 2033. At the lease expiration, MTAHQ has the option of either exercis-ing a fixed price purchase option for the cars or returning the cars to the third party owner.
Under the terms of the sale/leaseback agreements, MTA initially received $294, which was utilized as follows: In thecase of one of the leases MTA paid $97 to an affiliate of one of the lenders to the third party, which affiliate has theobligation to make a portion of the lease rent payment equal to the debt service on the related loan, thereby eliminat-ing the need for MTA to make these payments to the third party. In the case of the other lease MTA purchased U.S.Treasury debt securities in amounts and with maturities which are sufficient to make the lease rent payments equal tothe debt service on the loan from the other lender to the third party. In the case of both of the leases MTA also pur-chased REFCO debt securities that mature in 2030 under an agreement with AIG Matched Funding Corp. (guaranteedby American International Group, Inc.) whereby AIG Matched Funding Corp. receives the proceeds from the REFCOdebt securities at maturity and is obligated to pay the remainder of the lease rent payments under those leases and thepurchase price due upon exercise by MTA of the purchase options if exercised. The amount remaining after paymentof transaction expenses, $24, was MTA’s net benefit from these two transactions. These amounts are deferred andamortized to operations over the period of the respective leases.
Other Lease TransactionsOn July 29, 1998, the MTAHQ, MTA New York City Transit, and MTA Bridges & Tunnels entered into a lease andrelated agreements whereby each agency, as sublessees, will rent, for an initial stated term of approximately 50 years,an office building at Two Broadway in lower Manhattan. The lease term expires on July 30, 2048, and, pursuant tocertain provisions, is renewable for two additional 15-year terms. The lease comprises both operating (for the lease ofland) and capital (for the lease of the building) elements. The total annual rental payments over the initial lease termare $1,602 with rent being abated from the commencement date through June 30, 1999. During 2002 and 2001 theMTA made rent payments of $21. In connection with the renovation of the building and for tenant improvements, theMTA issued $121 and $328 in 2000 and 1999, respectively, of long-term obligations (see Note 6). The office buildingis principally occupied by MTA New York City Transit and MTA Bridges & Tunnels.
On April 8, 1994, the MTA amended its lease for the Harlem/Hudson line properties, including Grand CentralTerminal. This amendment initially extends the lease term, previously expiring in 2031, an additional 110 years and,pursuant to several other provisions, an additional 133 years. In addition, the amendment grants the MTA an optionto purchase the leased property after the 25th anniversary of the amended lease. The amended lease comprises bothoperating (for the lease of land) and capital (for the lease of buildings and track structure) elements.
In August 1988, the MTA entered into a 99-year lease agreement with Amtrak for Pennsylvania Station. This agree-ment, with an option to renew, is for rights to the lower concourse level and certain platforms. The $45 paid toAmtrak by the MTA under this agreement is included in other assets. This amount is being amortized over 30 years. Inaddition to the 99-year lease, MTA Long Island Rail Road entered into an agreement with Amtrak to share equally thecost of the design and construction of certain facilities at Pennsylvania Station. Under this agreement, the MTA may berequired to contribute up to $60 for its share of the cost. As of December 31, 2000 the project was closed and $50 wasincluded in property and equipment.
On May 17, 2006, President Bush signed into law an act entitled the “Tax Increase Prevention and ReconciliationAct of 2005” (P.L. 109-222). Among other provisions, P.L. 109-222 imposes an excise tax on the net income or pro-ceeds of certain types of leasing transactions entered into by tax-exempt entities, including states and their politicalsubdivisions, such as MTA and its affiliates and subsidiaries. Some of the MTA leasing transactions that could be sub-ject to the tax are described in footnote 7. The United States Department of the Treasury and the Internal Revenue
Notes to Consolidated Financial StatementsYears Ended December 31, 2006 and 2005
($ millions)
AR7001-Financials67 7/10/07 8:37 PM Page 65

66 M E T R O P O L I T A N T R A N S P O R T A T I O N A U T H O R I T Y
Service are in the process of drafting regulations that will further clarify which transactions are subject to the excise taxand the calculations of the excise tax. MTA is evaluating P.L. 109-222 and awaiting these regulations. At this time, themagnitude of MTA’s excise tax liability with respect to the lease transactions that are subject to P.L. 109-222 is unclear.
Total rent expense under operating leases approximated $28.5 through December 31, 2006 and $32 throughDecember 31, 2005.
At December 31, 2006, the future minimum lease payments under non-cancelable leases are as follows:Year Operating Capital
2007 $ 25 $ 1,1422008 24 982009 23 3052010 20 1742011 20 702012 - 2016 81 4452017 - 2021 65 5302022 - 2026 63 5712027 - 2031 51 1712032 - 2033 48 1,623Thereafter 443 584
$863 5,713Amount representing interest (3,098)
Present value of capital lease obligations $ 2,615
8—Estimated Liability Arising from Injuries to Persons
A summary of activity in estimated liability as computed by actuaries arising from injuries to persons, includingemployees, and damage to third-party property, for the years ended December 31, 2006 and 2005 is presented below:
December 31, December 31,2006 2005
Balance, beginning of year $1,174 $1,127Activity during the year:
Current year claims andchanges in estimates 157 200
Claims paid (160) (153)
Balance, end of period 1,171 1,174Less current portion (176) (191)
Long-term liability $ 995 $ 983
9—Commitments and Contingencies
The MTA actively monitors its properties for the presence of pollutants and/or hazardous wastes and evaluates itsexposure with respect to such matters. When the expense, if any, to clean up pollutants and/or hazardous wastes isestimable it is accrued by the MTA.
Management has reviewed with counsel all actions and proceedings pending against or involving the MTA, includingpersonal injury claims. Although the ultimate outcome of such actions and proceedings cannot be predicted with cer-tainty at this time, management believes that losses, if any, in excess of amounts accrued resulting from those actionswill not be material to the financial position, results of operations, or cash flows of the MTA.
Notes to Consolidated Financial StatementsYears Ended December 31, 2006 and 2005($ millions)
AR7001-Financials68 7/10/07 8:37 PM Page 66

67M E T R O P O L I T A N T R A N S P O R T A T I O N A U T H O R I T Y
10—Operating Activity Information
Bridgesand Consolidated
MTA Commuters Transit Tunnels Eliminations Total
December 31, 2006Operating revenue $ 232 $ 990 $ 3,041 $ 1,259 $ (35) $ 5,487Depreciation and amortization 52 484 1,012 58 – 1,606Subsidies and grants 376 – 314 – (156) 534Tax revenue 2,646 – 2,111 – (1,172) 3,585Interagency subsidy 435 – 167 (435) (167) –Operating (deficit) surplus (585) (1,276) (2,830) 848 – (3,843)Net (deficit) surplus 648 (1,223) 1,781 164 – 1,370Capital expenditures 3,931 272 857 185 (1,153) 4,092
December 31, 2006Total assets 11,735 9,610 27,288 3,833 (2,381) 50,085Net working capital 2,578 (95) 290 (178) (1,307) 1,288Long-term debt – (including current portion) 16,757 – – 7,169 (44) 23,882Net assets (10,123) 8,691 24,667 (3,872) – 19,363
December 31, 2006Net cash (used in)/provided by
operating activities (479) (749) (1,767) 931 31 (2,033)Net cash provided by/(used in) noncapital
financing activities 3,351 783 2,399 (440) (2,340) 3,753Net cash (used in)/provided by capital and
related financing activities (2,509) (33) (476) (429) 2,089 (1,358)Net cash provided by/(used in)
Investing activities (319) (4) (181) (61) 220 (345)Cash at beginning of year 34 29 63 12 – 138Cash at end of period 78 26 38 13 – 155
December 31, 2005Operating revenue $ 133 $ 939 $ 2,908 $ 1,254 $ (36) $ 5,198Depreciation and amortization 35 434 955 50 – 1,474Subsidies and grants 381 – 315 – (156) 540Tax revenue 2,295 – 1,565 – (934) 2,926Interagency subsidy 457 – 180 (457) (180) –Operating (deficit) surplus (442) (1,208) (2,765) 861 – (3,554)Net (deficit) surplus 313 (1,182) 1,111 153 – 395Capital expenditures 3,618 214 708 166 (1,067) 3,639
December 31, 2005Total assets 10,487 9,087 25,430 3,571 (1,949) 46,626Net working capital (373) (99) 49 (235) 487 (171)Long-term debt – (including current portion) 14,897 – – 7,107 (45) 21,959Net assets (9,069) 8,213 22,885 (4,036) – 17,993
December 31, 2005Net cash (used in)/provided by
operating activities (411) (683) (1,543) 879 34 (1,724)Net cash provided by (used in) noncapital
financing activities 3,244 717 2,090 (479) (1,958) 3,614Net cash provided by/(used in) capital and
related financing activities (2,120) (12) (284) (447) 1,344 (1,519)Net cash provided by/(used in)
Investing activities (736) (10) (237) 46 580 (357)Cash at beginning of year 58 17 36 13 – 124Cash at end of period 34 29 63 12 – 138
NOTE: Only MTA and MTA Bridges and Tunnels agencies are issuing debt.
Notes to Consolidated Financial StatementsYears Ended December 31, 2006 and 2005
($ millions)
AR7001-Financials69 7/10/07 8:37 PM Page 67

68 M E T R O P O L I T A N T R A N S P O R T A T I O N A U T H O R I T Y
11—Settlement of Claims
The case of Cruz V. MTA Long Island Rail Road settled on January 20, 2006 for the total sum of $12.1 with FMTACbeing responsible for the amount in excess of the MTA Long Island Rail Road’s retention of $6.0 at the time of theevent. FMTAC paid its portion of such settlement from the ELF.
Notes to Consolidated Financial StatementsYears Ended December 31, 2006 and 2005($ millions)
AR7001-Financials70 7/10/07 8:37 PM Page 68

69M E T R O P O L I T A N T R A N S P O R T A T I O N A U T H O R I T Y
Required Supplementary Information: Schedule of PensionFunding Progress
($ millions)
January 1, January 1, January 1,2006 2005 2004
LIRRa. Actuarial value of plan assets $ 625.0 $ 659.6 $ 689.7b. Actuarial accrued liability (AAL) 1,898.6 1,786.7 1,745.6c. Total unfunded AAL (UAAL) [b-a] 1,273.6 1,127.1 1,055.9d. Funded ratio [a/b] 32.9% 36.9% 39.5%e. Covered payroll $ 117.3 $ 137.1 $ 151.2f. UAAL as a percentage of covered payroll [c/e] 1085.8% 822.1% 698.3%
MaBSTOAa. Actuarial value of plan assets $ 841.0 $ 762.1 $ 713.2b. Actuarial accrued liability (AAL) 1,725.2 1,680.5 1,663.3c. Total unfunded AAL (UAAL) [b-a] 884.2 918.4 950.1d. Funded ratio [a/b] 48.7% 45.3% 42.9%e. Covered payroll $ 498.0 $ 479.5 460.9f. UAAL as a percentage of covered payroll [c/e] 177.5% 191.5% 206.1%
MTAa. Actuarial value of plan assets $ 613.6 $ 463.6 $ 391.6b. Actuarial accrued liability (AAL) 793.3 625.5 554.0c. Total unfunded AAL (UAAL) [b-a] 179.7 161.9 162.4d. Funded ratio [a/b] 77.4% 74.1% 70.7%e. Covered payroll N/A* $ 480.8 $ 451.1f. UAAL as a percentage of covered payroll [c/e] N/A* 33.7% 36.0%
*Not applicable since the benefits for former employees of New York Bus, Queens Surface and Liberty Lines are not related to Pay.
AR7001-Financials71 7/10/07 8:38 PM Page 69
$

70 M E T R O P O L I T A N T R A N S P O R T A T I O N A U T H O R I T Y
Unaudited
Financial Plan Actual – Operating Loss $(3,817.6)
Reconciling items:FMTAC revenues are recorded as operating on the Financial Plan and recorded asnon-operating on the Financial Statements. (15.4)
Various agencies recorded adjustments to the Financial Statements after the Financial Planwas completed. (33.8)
The Financial Plan includes TBTA capital transfer to agencies. 24.1
Other miscellaneous adjustments and accruals. –
Financial Statement – Operating Loss $(3,842.7)
Supplementary Information: Schedule of Financial Plan toFinancial Statements ReconciliationYear Ended December 31, 2006($ millions)
AR7001-Financials72 7/10/07 8:38 PM Page 70

71M E T R O P O L I T A N T R A N S P O R T A T I O N A U T H O R I T Y
Supplementary Information: Consolidated Reconciliationbetween Financial Plan and Financial Statements
Year Ended December 31, 2006 ($ millions)
Financial FinancialPlan Statement
Category Actual GAAP Actual Variance(Unaudited)
RevenueFarebox Revenue $ 3,839.8 $ 3,839.7 $ (0.1)Vehicle Toll Revenue 1,241.5 1,241.5 –Other Operating Revenue 467.2 406.1 (61.1)
Total Revenue 5,548.5 5,487.3 (61.2)
Expenses
Labor:Payroll 3,676.0 3,722.0 (46.0)Overtime 436.7 401.2 35.5Health and Welfare 839.0 843.6 (4.6)Pensions 600.4 601.6 (1.2)Other Fringe Benefits 397.9 406.6 (8.7)Reimbursable Overhead (260.0) (228.7) (31.3)
Total Labor Expenses 5,690.0 5,746.3 (56.3)
Non-Labor:
Traction and Propulsion Power 277.8 277.8 –Fuel for Buses and Trains 177.9 177.9 –Insurance 45.2 48.7 (3.5)Claims 79.6 92.7 (13.1)Paratransit Service Contracts 183.6 183.6 –Maintenance and Other Operating Contracts 533.9 527.1 6.8Professional Service Contract 179.5 177.4 2.1Materials & Supplies 452.8 448.1 4.7Other Business Expenses 156.8 44.3 112.5Rounding – – –
Total Non-Labor Expenses 2,087.1 1,977.6 109.5
Other Expenses Adjustments:
TBTA Transfer 24.1 – 24.1General Reserve 6.0 – 6.0Interagency Subsidy (34.5) – (34.5)Other (11.9) – (11.9)
Total Other Expense Adjustments (16.3) – (16.3)
Total Expenses Before Depreciation 7,760.8 7,723.9 36.9
Depreciation 1,605.3 1,606.1 (0.8)
Total Expenses (Excluding TBTA Depreciation) 9,366.1 9,330.0 36.1
Net Operating Deficit Excluding Subsidies and Debt Service $(3,817.6) $(3,842.7) $(25.1)
AR7001-Financials73 7/10/07 8:38 PM Page 71

72 M E T R O P O L I T A N T R A N S P O R T A T I O N A U T H O R I T Y
Supplementary Information: Consolidated Subsidy AccrualReconciliation between Financial Plan and FinancialStatementsYear Ended December 31, 2006($ millions)
Financial FinancialPlan Statement
Accrued Subsidies Actual GAAP Actual Variance(Unaudited)
Mass Transportation Operating Assistance $ 1,311.1 $ 1,311.1 $ –Petroleum Business Tax 612.7 612.7 –Mortgage Recording Tax 1 and 2 759.8 759.8 –MRT transfer (36.8) (40.1) (3.3)(1)
Urban Tax 704.7 704.7 –Operating subsidies from NYC 199.0 196.7 (2.3)(2)
State and Local Operating Assistance 378.8 378.8 –Additional Mass Transportation Assistance Program 15.0 15.0 –Nassau County Subsidy to Long Island Bus 10.5 10.5 –Station Maintenance 137.4 137.4 –Connecticut Department of Transportation (CDOT) 52.6 52.6 –NYS Grant for Debt Service – 130.2 130.2(3)
Investment income 24.4 46.2 21.8(4)
Total Accrued Subsidies 4,169.2 4,315.6 146.4Net Operating Surplus/(Deficit)
Excluding Accrued Subsidies and Debt Service $(3,817.6) $(3,842.7) (25.1)
Total Net Operating Surplus/(Deficit) $ 351.6 $ 472.9 $121.3
Interest on Long-Term Debt $ 1,039.2
Debt Service $ 1,310.0
(1) The Financial Plan records on a cash basis while the Financial Statements records on an accrual basis.(2) Adjustment made to the MTA Bus Company financial statements after the close of the Financial Plan.(3) In the Financial Statement, funds received from NYS to cover debt service payments for Service Contract Bonds are included in the subsidies. TheFinancial Plan does not include either the funds received or disbursed.(4) The Financial Plan excludes certain pool and capital funds.
AR7001-Financials74 7/10/07 8:38 PM Page 72

This page is intentionally left blank.
AR7001-Financials75 7/10/07 8:38 PM Page 73

This page is intentionally left blank.
AR7001-Financials76 7/10/07 8:38 PM Page 74

Statistical Section
AR7001-Financials77 7/10/07 8:38 PM Page 75

76 M E T R O P O L I T A N T R A N S P O R T A T I O N A U T H O R I T Y
Statistical Tables and ChartsFinancial Trends
MTA Net Assets($ millions) 2006
Invested in Capital Assets, Net of Related Debt
Capital Assets, Net $ 38,307
Related Debt (24,769)
Defeasance Cost 549
Unused Funds 690
Restricted for Debt Service
Transportation Revenue Bonds 167
Dedicated Tax Fund Bonds 38
Capital Leases 424
General Revenue Bonds — Senior 312
General Revenue Bonds — Subordinate 154
Unrestricted 3,491
Net Change 19,363
MTA Changes in Net Assets($ millions) 2006
Operating Revenues $ 5,487
Operating Expenses (9,330)
Non-Operating Revenue 3,315
Grants and Other Receipts Restricted for Capital Purchases 1,898
Net Change 1,370
AR7001-Financials78 7/10/07 8:38 PM Page 76

77M E T R O P O L I T A N T R A N S P O R T A T I O N A U T H O R I T Y
Statistical Tables and ChartsRevenue Capacity Information
December 31, 2006
Subway and Local Buses
Base Fare $2.00
Commuter Rail Roads Long Island Rail Road Metro-North Railroad
One-Way Peak $4.936 + 16.41¢/mile $4.941 + 16.47¢/mile (EOH-NYS)
$5.452 + 18.17¢/mile (EOH-CT)
$3.749 + 10.97¢/mile (WOH)
Bridge and Tunnel Crossings Major Crossings Minor Crossings
One-Way Passenger Vehicle Toll $4.50 $2.25
MTA New York City Transit, MTA Long Island Bus, MTA Bus, MTA Staten Island Railway
Notes: The base fare for subways and local buses is a cash or single-ride fare. Nearly all riders take advantage of various pre-paid discounts available with MetroCard; seniors and people with disabilities pay a reduced fare that can be further discounted by using prepaid MetroCard. Commuter railroad mileage charges are based on the average distance between the main terminal and the stations in each fare zone. Monthly ticket prices (which represent the largest component of fare purchases) are computed by Long Island Rail Road on the basis of a 48 to 59 percent discount off one-way peak fares based on approximately 40 trips per month and on Metro-North Railroad on the basis of a 48 to 51 percent discount based on approximately 42 trips per month. Metro-North figures show charges for East-of-Hudson (EOH) service for stations in New York State and Connecticut and for West-of-Hudson (WOH) service.
Bridges and Tunnels' charges for other types of vehicles are based on vehicle size and type. Customers using E-ZPass receive special discounts. Major crossings are the Bronx-Whitestone, Triborough, Throgs Neck, and Verrazano-Narrows bridges and the Brooklyn- Battery and Queens Midtown tunnels; minor crossings are the Henry Hudson, Marine Parkway-Gil Hodges Memorial, and Cross Bay Veterans Memorial bridge. Tolls are collected in a single direction on the Verrazano-Narrows Bridge and are doubled. Other discounts for the Verrazano-Narrows Bridge are available to residents of Staten Island and other discounts for the Marine Parkway-Gil Hodges Memorial Bridge and the Cross Bay Veterans Memorial Bridge are available to Rockaway and Broad Channel residents.
MTA Revenue Base
AR7001-Financials79 7/10/07 8:38 PM Page 77

78 M E T R O P O L I T A N T R A N S P O R T A T I O N A U T H O R I T Y
Statistical Tables and ChartsDebt Information
MTA Debt by Type—Par Outstanding, Year-End ($ millions) 2006
Dedicated Tax Fund $3,972
Transportation Revenue 9,940
TBTA General Revenue 4,701
TBTA Subordinate Revenue 2,325
State Service Contract 2,289
2 Broadway Certificates of Participation 431
Total $23,658
2006
Debt Limit $28,877
Debt Issuance Subject to the Limit 14,866
Limit Available $14,011
Percent of Limit Issued 51.48%
MTA Debt Capacity
Note: The statutory debt limit includes only debt issued for transit and commuter projects set forth in the 1992 through 2009 CPRB-approved Capital Programs. Statutory exclusions include refunding bonds and bonds issued to cover the cost of issuance.
($ millions)
AR7001-Financials80 7/10/07 8:38 PM Page 78

79M E T R O P O L I T A N T R A N S P O R T A T I O N A U T H O R I T Y
Statistical Tables and ChartsDemographic and Economic Information
MTA Farebox Recovery Ratio
1997
1998
1999
2000
2001
2002
2003
2004
2005
2006
0 20 40 60 80 100
54.0%
50.3%
46.4%
47.6%
45.1%
43.7%
43.6%
43.7%
41.6%
41.7%
(percent)
Note: Farebox recovery ratio is the percentage of MTA expenses (including debt service) covered by fare revenue. (Excludes operations of MTA Capital Construction and MTA Bridges and Tunnels.)
Population within MTA Service Area
1997
1998
1999
2000
2001
2002
2003
2004
2005
2006
0 2,000 4,000 6,000 8,000 10,000 12,000 14,000 16,000
14,021
14,171
14,294
14,397
14,545
14,606
14,675
14,709
14,770
14,772
1,675
1,686
1,697
1,707
1,720
1,729
1,739
1,743
1,746
1,746
12,346
12,485
12,597
12,690
12,825
12,877
12,936
12,966
13,024
13,026
(thousands) New York State Connecticut
Note: Population figures for 2000 are from the 2000 Census. Other figures are from annual estimates of population by county published by the U.S. Census Bureau.
AR7001-Financials81 7/10/07 8:38 PM Page 79

MTA Revenue Passengers
0
200
400
600
800
1,000
1,200
1,400
1,600
Notes: Bus figure includes rides provided by Able-Ride paratransit service but does not include Access-A-Ride paratransit service. 2002 bus total restated from prior annual reports due to recalculation of New York City Transit bus ridership.
1997 1998 1999 2000 2001 2002 2003 2004 2005 2006
Commuter Rail LinesSubways Buses
568644
696729
771 786 758 771 775
873
143 147 151 157 159 157 153 152 155 159
1,1361,203
1,287
1,385 1,409 1,417 1,3881,429 1,453
1,503
(millions)
80 M E T R O P O L I T A N T R A N S P O R T A T I O N A U T H O R I T Y
Statistical Tables and ChartsOperating Information
In the Operating Information charts, subway-related information includes operations of MTA New York City Transitsubways and MTA Staten Island Railway. Unless otherwise indicated, bus-related information includes operations ofMTA New York City Transit buses, MTA Long Island Bus, and (beginning with 2006 figures) MTA Bus, but excludesAccess-A-Ride and Able-Ride paratransit service. Commuter rail-related information includes MTA Long Island RailRoad and MTA Metro-North Railroad.
Scope of Operations
1997 1998 1999 2000 2001 2002 2003 2004 2005 2006Subway Lines 26 26 26 26 28 28 28 28 27 27Subway Stations 490 490 490 490 490 490 490 490 490 490Subway Route Miles 258 247 247 247 247 247 247 247 247 247Subway Track Miles 685 685 685 685 685 685 689 689 689 689Bus Routes 280 287 288 290 298 298 298 297 297 378Bus Route Miles 2,355 2,355 2,637 2,641 2,646 3,012 2,967 2,967 2,967 3,879Commuter Rail Lines 17 17 17 17 17 17 17 17 17 17Commuter Rail Stations 251 241 241 243 243 243 244 244 244 244Commuter Rail Route Miles 715 721 703 703 703 703 703 703 703 701Commuter Rail Track Miles 1,353 1,370 1,370 1,369 1,369 1,369 1,369 1,369 1,369 1,369Bridges 7 7 7 7 7 7 7 7 7 7Tunnels 2 2 2 2 2 2 2 2 2 2
Total Net Assets 1,370
AR7001-Financials82 7/10/07 8:38 PM Page 80
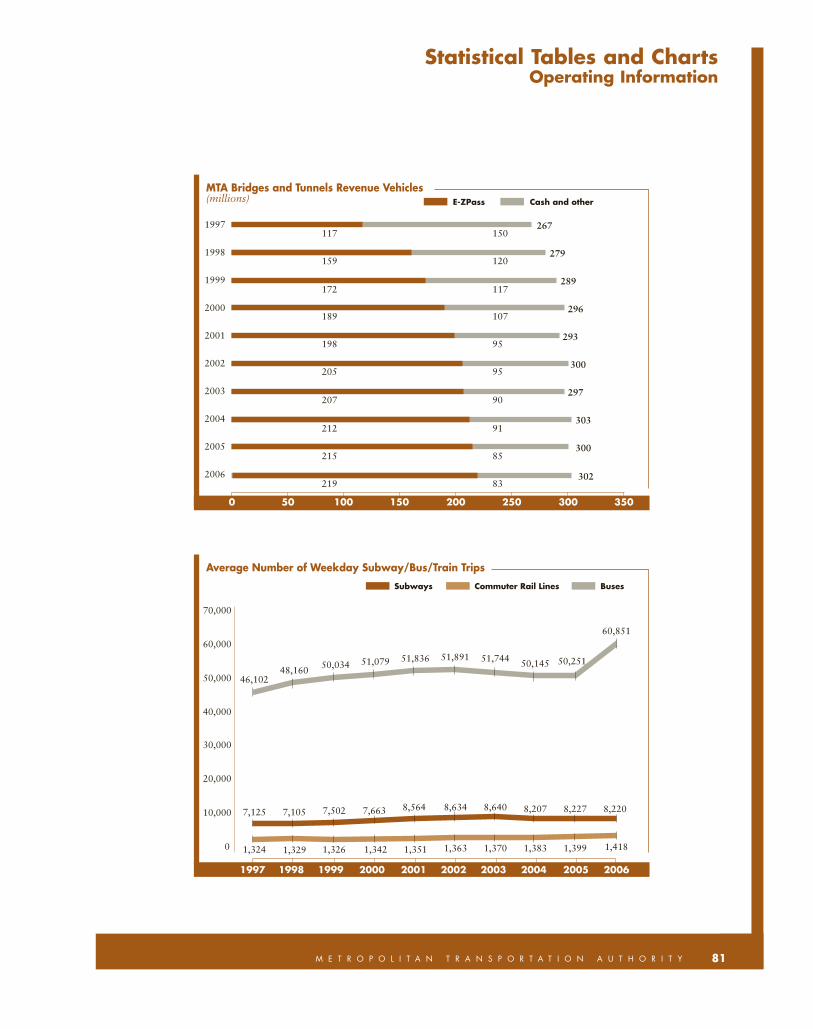
81M E T R O P O L I T A N T R A N S P O R T A T I O N A U T H O R I T Y
Statistical Tables and ChartsOperating Information
MTA Bridges and Tunnels Revenue Vehicles
1997
1998
1999
2000
2001
2002
2003
2004
2005
2006
0 50 100 150 200 250 300 350
267
279
289
296
293
300
297
303
300
302
117
159
172
189
198
205
207
212
215
219
150
120
117
107
95
95
90
91
85
83
(millions) E-ZPass Cash and other
Average Number of Weekday Subway/Bus/Train Trips
0
10,000
20,000
30,000
40,000
50,000
60,000
70,000
Commuter Rail LinesSubways Buses
1997 1998 1999 2000 2001 2002 2003 2004 2005 2006
46,10248,160 50,034 51,079 51,836 51,891 51,744 50,145 50,251
60,851
1,324 1,329 1,326 1,342 1,351 1,363 1,370 1,383 1,399 1,418
7,125 7,105 7,502 7,663 8,564 8,634 8,640 8,207 8,227 8,220
AR7001-Financials83 7/10/07 8:38 PM Page 81

82 M E T R O P O L I T A N T R A N S P O R T A T I O N A U T H O R I T Y
Statistical Tables and ChartsOperating Information
MTA Revenue Vehicle Miles(millions)
0 50 100 150 200 250 300 350
Rail CarsSubway Cars Buses
306
96102
1997
308
102103
1998
315
106104
1999
325
111106
2000
328
113107
2001
336
115107
2002
337
116106
2003
342
117109
2004
338
114111
2005
342
138116
2006
MTA Passenger Miles(millions)
1997
1998
1999
2000
2001
2002
2003
2004
2005
2006
Rail CarsSubway Cars Buses
0 1,000 2,000 3,000 4,000 5,000 6,000 7,000 8,000 9,000
1,513
1,449
1,676
1,688
1,939
2,025
1,788
1,732
2,109
2,035
3,816
4,116
3,981
4,411
4,312
4,224
4,205
3,962
3,477
3,992
Note: 2006 figures exclude MTA Bus.
7,136
7,389
7,865
8,346
8,299
7,889
7,842
8,355
8,423
8,361
AR7001-Financials84 7/10/07 8:38 PM Page 82

83M E T R O P O L I T A N T R A N S P O R T A T I O N A U T H O R I T Y
Statistical Tables and ChartsOperating Information
MTA Rolling Stock
1997
1998
1999
2000
2001
2002
2003
2004
2005
2006
Rail CarsSubway Cars Buses
0 1,000 2,000 3,000 4,000 5,000 6,000 7,000
5,863
5,863
5,875
5,871
6,247
6,464
6,210
6,255
6,285
6,305
4,184
4,426
4,756
4,871
4,864
4,930
4,895
5,097
5,113
6,202
1,937
1,963
1,968
1,978
1,984
1,989
2,049
2,322
2,305
2,431
Employees by Category
2006
Administration 4,394
Operations 30,733
Maintenance 28,834
Engineering/Capital 1,875
Public Safety 1,621
Total 67,457
AR7001-Financials85 7/10/07 8:38 PM Page 83

84 M E T R O P O L I T A N T R A N S P O R T A T I O N A U T H O R I T Y
2006 Operating Statistics
MTA MTA MTA MTA MTANew York City New York City Staten Island Long Island Long Island
Transit/Subway Transit/Bus1 Railway Rail Road Bus2
Paid rides (annual)
2006 1,498,915,984 741,419,747 3,782,591 82,036,736 32,577,477
2005 1,449,109,242 736,493,445 3,458,853 80,130,571 31,507,473
Gain (loss) 49,806,742 4,926,302 323,738 1,906,165 1,070,004
Percent change 3.44% 0.67% 9.36% 2.38% 3.40%
Paid rides (average weekday)
2006 4,865,769 2,380,124 13,781 289,586 109,302
2005 4,737,093 2,374,777 12,647 282,410 105,329
Gain (loss) 128,676 5,347 1,134 7,176 3,973
Percent change 2.72% 0.23% 8.97% 2.54% 3.77%
Annual revenue vehicle miles
2006 339,374,918 101,520,477 2,160,104 61,273,582 13,361,529
2005 335,689,529 101,269,584 2,102,170 59,173,711 12,894,456
Gain (loss) 3,398,911 1,721,787 57,934 2,099,871 467,073
Percent change 1.10% 0.25% 2.76% 3.55% 3.62%
Average number weekdaytrain/bus trips 8,093 45,839 127 733 4,179
Stations 468 — 22 124 —
Train lines/bus routes 26 243 1 11 54
Route miles7
Rail route miles 233 — 14 319 —
Bus route miles — 2,043 — — 954
Track miles8 660 — 29 594 —
Rolling stock
Rail cars 6,241 — 64 1,153 —
Buses — 4,518 — — 417
Bridges — — — — —
Tunnels — — — — —
Employees 27,807 14,393 270 6,303 1,108
1. Figures include Manhattan and Bronx Surface Transit Operating Authority, a subsidiary of MTA New York City Transit; does not include ridership of Access-A-Ride paratransit operation.
2. Paid rides, revenue vehicle miles, average number of bus trips, rolling stock, andemployees figures include both fixed-route and Able-Ride paratransit operations.
3. Figures include operations on the Harlem, Hudson, and New Haven lines in NewYork State and Connecticut and the New York State portions of the Port Jervis andPascack Valley lines.
4. Paid rides statistics include MTA New York City Transit subway, bus, and Access-A-Ride paratransit operations.
AR7001-Financials86 7/10/07 8:38 PM Page 84

5. MTA Long Island Rail Road plus MTA Metro-North Railroad.
6. MTA ridership increases shown include results of MTA Bus operations, whichcompleted its first year of substantial service in 2006. Excluding MTA Busridership, total ridership on MTA subways, buses, and commuter rail services(excluding MTA Bridges and Tunnels crossings) rose 2.56 percent, averageweekday ridership rose 2.01 percent, and annual revenue vehicle miles rose1.86 percent.
7. Nondirectional route miles; i.e., the distance from terminal to terminal.Several rail or bus lines may share the same route.
8. Does not include track in yards.
9. Includes 5,496 employees in administration, operations, maintenance, andengineering/capital construction positions.
10. Includes 586 employees at MTA Headquarters, 732 at MTA Public Safety, and68 employees of MTA Capital Construction.
85M E T R O P O L I T A N T R A N S P O R T A T I O N A U T H O R I T Y
2006 Operating Statistics
MTA MTA MTA MTA Combined MTAMetro-North Bus Bridges and New York City MTA Railroads Total6
Railroad3 Tunnels Transit Total4 Total5
76,850,478 99,254,478 302,058,593 2,245,537,300 158,887,214 2,540,039,060
74,507,341 — 300,385,193 2,190,265,764 154,637,912 2,379,870,002
2,343,137 — 1,673,400 55,271,536 4,249,302 160,169,058
3.14% — 0.56% 2.52% 2.75% 6.73%
265,949 330,739 854,443 7,262,760 555,535 8,272,117
257,842 — 848,154 7,126,950 540,252 7,785,178
8,107 — 6,289 135,810 15,283 486,939
3.14% — 0.74% 1.91% 2.83% 6.25%
54,542,127 23,334,790 — 440,895,395 115,815,709 595,567,527
51,826,772 — — 436,959,113 111,000,483 562,956,222
2,715,355 — — 5,120,698 4,815,226 33,795,721
5.24% — — 0.90% 4.34% 5.79%
685 10,833 — 53,932 1,418 59,656
120 — — 468 244 734
6 81 — 269 17 378
382 — — 233 701 948
— 882 — 2,043 — 3,879
775 — — 660 1,369 2,058
1,188 — — 6,241 2,341 8,646
— 1,267 — 4,518 — 6,202
— — 7 — — 7
— — 2 — — 2
5,856 3,055 1,783 47,6969 12,159 67,45710
AR7001-Financials87 7/10/07 8:38 PM Page 85

86 M E T R O P O L I T A N T R A N S P O R T A T I O N A U T H O R I T Y
Peter S. KalikowChairman
David S. MackVice Chairman
Andrew M. SaulVice Chairman
Elliot G. SanderExecutive Director andChief Executive Officer
Members of the BoardAndrew B. Albert*
John H. Banks IIIJames F. Blair*
Nancy Shevell BlakemanNorman E. Brown*
Donald CecilBarry L. FeinsteinJeffrey A. KayMark D. Lebow
James L. McGovern*
Susan G. MetzgerMark PageMitchell H. PallyFrancis H. PowersNorman I. SeabrookJames L. Sedore, Jr. Ed Watt*
Carl V. Wortendyke
*non-voting member
The Metropolitan Transportation Authority is a public-benefit corporation chartered by the State of New York, Eliot Spitzer, Governor.
MTA management and Board members shown on this page are current as of May 1, 2007.
347 Madison AvenueNew York, NY 10017-3739212-878-7000
www.mta.info
For additional copies of the 2006 MTA annual report, write to MTA Marketing and Corporate Communications, 347 Madison Avenue, New York, NY10017-3739; for information about the 2006 financial statements, write to MTA Office of the Comptroller, 345 Madison Avenue, New York, NY10017-3937.
The 2006 MTA annual report and financial statements are also available on the MTA website at www.mta.info.
MTA Agencies
MTA BusThomas J. Savage President347 Madison AvenueNew York, NY 10017-3739212-878-7174
MTA Long Island Rail RoadRaymond P. KennyActing PresidentJamaica StationJamaica, NY 11435-4380718-558-7400
MTA Long Island BusNeil S. YellinPresident700 Commercial AvenueGarden City, NY 11530-6410516-542-0100
MTA Metro-North RailroadPeter A. CannitoPresident347 Madison AvenueNew York, NY 10017-3739212-340-3000
MTA Bridges and TunnelsDavid MorettiActing PresidentRandalls IslandNew York, NY 10035-0035646-252-7000
MTA Capital ConstructionMysore L. NagarajaPresident2 BroadwayNew York, NY 10004-2207646-252-4277
MTA New York City TransitHoward H. Roberts, Jr.President2 BroadwayNew York, NY 10004-2207718-330-3000
40575_Financial.qxp 7/31/07 11:22 AM Page 86

2onstructionC of the new South Ferry subway terminal viewed from the top of the Old U.S. Custom House.
40575_cover.qxd 7/11/07 9:45 AM Page 2

347 Madison AvenueNew York, NY 10017-3739
www.mta.info
© 2007 Metropolitan Transportation Authority
Metro
polita
n Tra
nsp
orta
tion A
uth
ority
Com
pre
hensiv
e A
nnual Fin
ancia
l Report fo
r the Y
ear En
ded D
ece
mber 3
1, 2
006
The MTA2006
Comprehensive Annual Financial Report for the Year EndedDecember 31, 2006
Comprehensive Annual Financial Report for the Year EndedDecember 31, 2006
ANNUAL REPORT
40575_cover.qxd 7/11/07 10:09 AM Page 1