Ar Budgetrev 1988-89
63
Board of Governors of the Federal Reserve System 1988-89 Digitized for FRASER http://fraser.stlouisfed.org/ Federal Reserve Bank of St. Louis
-
Upload
fraser-federal-reserve-archive -
Category
Documents
-
view
224 -
download
0
Transcript of Ar Budgetrev 1988-89

Board of Governors of the Federal Reserve System
1988-89
Digitized for FRASER http://fraser.stlouisfed.org/ Federal Reserve Bank of St. Louis

Contents
1 INTRODUCTION
Parti The 1989 Budgets
Chapter 1 5 FEDERAL RESERVE SYSTEM 5 Net Expenses 7 Trends in Expenses and Employment 8 Operational Areas 8 1989 Budget Initiatives
Chapter 2 11 BOARD OF GOVERNORS 11 The Budget by Operational Area 14 10-Year Trend
Chapter 3 17 FEDERAL RESERVE BANKS 17 Major Initiatives 19 Budget Objective for 1989 19 Operational Areas 24 Objects of Expense 25 Capital Outlays 26 Trends in Expenses and Employment 27 Volume and Unit Cost 27 1988 Budget Performance 28 1988 Budget Performance on Expedited Funds
Part II Special Analysis
Chapter 4 31 THE AUTOMATED CURRENCY PROCESSING SYSTEM 31 History of Currency Processing Technology 32 The New Automated Currency Processing System
Digitized for FRASER http://fraser.stlouisfed.org/ Federal Reserve Bank of St. Louis
Appendixes
Appendix A 35 MISSION AND OPERATIONAL AREAS
OF THE FEDERAL RESERVE SYSTEM 35 Monetary and Economic Policy 35 Supervision and Regulation 36 Services to Financial Institutions and the Public 38 Services to the U. S. Treasury and Other Government Agencies
Appendix B 39 BUDGET PROCESSES 39 The Budget and Control Process of the Board of Governors 40 The Budget and Control Process of the Federal Reserve Banks
Appendix C 43 SPECIAL CATEGORIES OF SYSTEM EXPENSE 43 Priced Services 46 Capital Outlays 46 Special Projects 48 Currency Printing
Appendix D 51 SOURCES AND USES OF FUNDS
Appendix E 53 FEDERAL RESERVE SYSTEM AUDITS
Appendix F 57 EXPENSES AND EMPLOYMENT
AT THE FEDERAL RESERVE BANKS
65 MAP OF THE FEDERAL RESERVE SYSTEM
Digitized for FRASER http://fraser.stlouisfed.org/ Federal Reserve Bank of St. Louis

1
Introduction
This report describes the budgeted ex-penses of the Federal Reserve System for 1989 and compares them with expenses for 1987 and 1988. In addition, to provide some insight into the technology of a major function of the System and the budgetary implications of keeping that technology current, this report examines the development of the automated cur-rency processing equipment used at the Reserve Banks.
The Federal Reserve System was cre-ated by the Federal Reserve Act, passed by the Congress in 1913 to establish a safer and more flexible monetary and banking system. With time, it became clear that these original purposes were part of broader national economic and financial objectives. Growth of the econ-omy, stable prices, and reasonable bal-ance in transactions with foreign coun-tries have come to be recognized as primary objectives of governmental economic policy. Over the years, such objectives have been articulated by the Congress in legislation giving the Federal Reserve more authority and responsibility.
The Board of Governors, together with the 12 Federal Reserve Banks and their 25 Branches, serves as the nation's central bank and lender of last resort. In addition, the Board has broad supervisory and regulatory responsibilities covering banks that are members of the Federal Reserve System, bank holding com-panies, international banking facilities in the United States, Edge act and agree-ment corporations, foreign activities of member banks, and activities of U.S. branches and agencies of foreign banks. In addition, the System is responsible for
implementing major federal laws govern-ing consumer credit.
The Federal Reserve System also plays a major role in the nation's payments mechanism. The Federal Reserve Banks distribute currency and coin, provide both wire and automated clearinghouse transfers of funds and securities, and process 35 percent of all domestic checks. The Federal Reserve serves as the fiscal agent for the U.S. Treasury and provides a variety of other financial services for the Treasury and other government agencies.
To carry out these responsibilities, the Federal Reserve System spent an esti-mated $1,352 million in 1988 and has budgeted expenses for 1989 of $1,427 million. These are the gross operating expenses for the Board of Governors and the Federal Reserve Banks and their Branches. Offsetting them in 1988 was an estimated $783 million in revenue from priced services, reimbursements, and other income, which brought 1988 net operating expenses to $568 million. Net spending for 1989 is expected to total $597 million.
The major source of Federal Reserve income, estimated at $18.2 billion in 1988, is earnings on the portfolio of U.S. government securities in the System Open Market Account. The System uses purchases and sales from this portfolio to implement monetary policy. Losses on foreign exchange transactions ap-proached $500 million.
Each year the Federal Reserve returns to the U. S. Treasury its earnings in excess of expenses, dividends, and surplus—in 1988, an estimated $17.4 billion. These earnings are treated as receipts in the
Digitized for FRASER http://fraser.stlouisfed.org/ Federal Reserve Bank of St. Louis

2 Introduction
U.S. budget accounting system; projec-tions of these earnings by the Office of Management and Budget appear in the U.S. budget.
Part I of this report discusses Federal Reserve budgeted expenses for 1989 for the System as a whole and for the Board of Governors and the Reserve Banks taken separately. Part I I is a discussion of the currency operations of the Reserve Banks and of the new generation of cur-rency processing equipment to begin arriving at the Banks in 1990. Appen-dixes provide additional information on System operations, budget processes, special categories of System expense, sources and uses of funds, Federal Re-serve System audits, and trends in Bank expenses and employment.
This report, which discusses the Sys-tem's budget in detail, is a companion to the Board's 75th Annual Report, 1988. That document covers all activities and initiatives of the Federal Reserve System during the year. •
Digitized for FRASER http://fraser.stlouisfed.org/ Federal Reserve Bank of St. Louis
Parti The 1989 Budgets
Digitized for FRASER http://fraser.stlouisfed.org/ Federal Reserve Bank of St. Louis
5
Chapter 1
Federal Reserve System
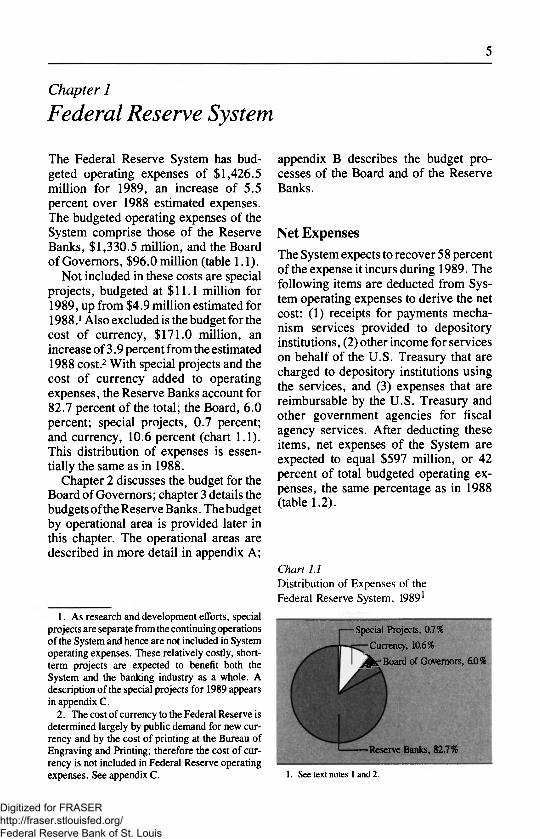
The Federal Reserve System has bud-geted operating expenses of $1,426.5 million for 1989, an increase of 5.5 percent over 1988 estimated expenses. The budgeted operating expenses of the System comprise those of the Reserve Banks, $1,330.5 million, and the Board of Governors, $96.0 million (table 1.1).
Not included in these costs are special projects, budgeted at $11.1 million for 1989, up from $4.9 million estimated for 1988.1 Also excluded is the budget for the cost of currency, $171.0 million, an increase of 3.9 percent from the estimated 1988 cost.2 With special projects and the cost of currency added to operating expenses, the Reserve Banks account for 82.7 percent of the total; the Board, 6.0 percent; special projects, 0.7 percent; and currency, 10.6 percent (chart 1.1). This distribution of expenses is essen-tially the same as in 1988.
Chapter 2 discusses the budget for the Board of Governors; chapter 3 details the budgets of the Reserve Banks. The budget by operational area is provided later in this chapter. The operational areas are described in more detail in appendix A;
1. As research and development efforts, special projects are separate from the continuing operations of the System and hence are not included in System operating expenses. These relatively costly, short-term projects are expected to benefit both the System and the banking industry as a whole. A description of the special projects for 1989 appears in appendix C.
2. The cost of currency to the Federal Reserve is determined largely by public demand for new cur-rency and by the cost of printing at the Bureau of Engraving and Printing; therefore the cost of cur-rency is not included in Federal Reserve operating expenses. See appendix C.
appendix B describes the budget pro-cesses of the Board and of the Reserve Banks.
Net Expenses The System expects to recover 58 percent of the expense it incurs during 1989. The following items are deducted from Sys-tem operating expenses to derive the net cost: (1) receipts for payments mecha-nism services provided to depository institutions, (2) other income for services on behalf of the U.S. Treasury that are charged to depository institutions using the services, and (3) expenses that are reimbursable by the U.S. Treasury and other government agencies for fiscal agency services. After deducting these items, net expenses of the System are expected to equal $597 million, or 42 percent of total budgeted operating ex-penses, the same percentage as in 1988 (table 1.2).
Chart 1.1 Distribution of Expenses of the Federal Reserve System, 19891
Special Projects, 0.7%
Currency, 10.6%
y ^ V Board of Governors, 6.0%
Reserve Banks, 82.7%
1. See text notes 1 and 2.
Digitized for FRASER http://fraser.stlouisfed.org/ Federal Reserve Bank of St. Louis
6 Federal Reserve System
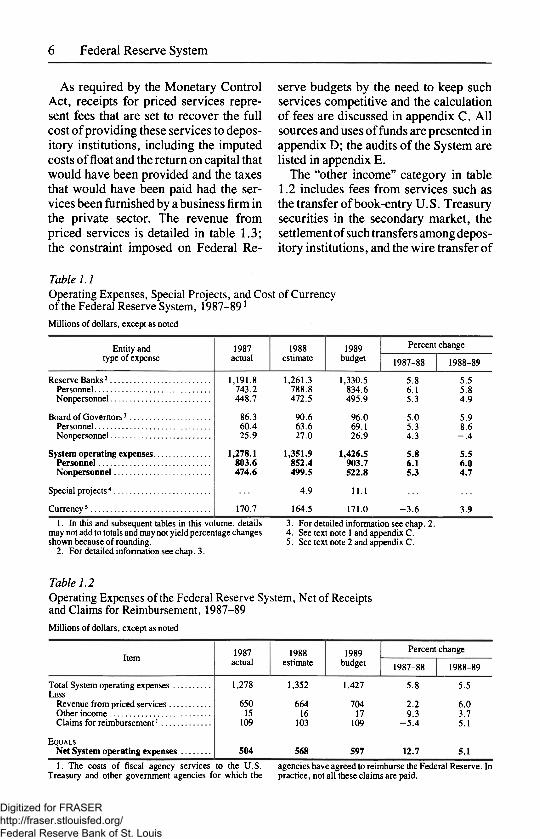
As required by the Monetary Control Act, receipts for priced services repre-sent fees that are set to recover the full cost of providing these services to depos-itory institutions, including the imputed costs of float and the return on capital that would have been provided and the taxes that would have been paid had the ser-vices been furnished by a business firm in the private sector. The revenue from priced services is detailed in table 1.3; the constraint imposed on Federal Re-
serve budgets by the need to keep such services competitive and the calculation of fees are discussed in appendix C. All sources and uses of funds are presented in appendix D; the audits of the System are listed in appendix E.
The "other income" category in table 1.2 includes fees from services such as the transfer of book-entry U.S. Treasury securities in the secondary market, the settlement of such transfers among depos-itory institutions, and the wire transfer of
Table 1.1 Operating Expenses, Special Projects, and Cost of Currency of the Federal Reserve System, 1987-891
Millions of dollars, except as noted
Entity and 1987 1988 1989 Percent change type of expense actual estimate budget 1987-88 1988-89
Reserve Banks2 1,191.8 1,261.3 1,330.5 5.8 5.5 Personnel 743.2 788.8 834.6 6.1 5.8 Nonpersonnel 448.7 472.5 495.9 5.3 4.9
Board of Governors3 86.3 90.6 96.0 5.0 5.9 Personnel 60.4 63.6 69.1 5.3 8.6 Nonpersonnel 25.9 27.0 26.9 4.3 - . 4
System operating expenses 1,278.1 1,351.9 1,426.5 5.8 5.5 Personnel 803.6 852.4 903.7 6.1 6.0 Nonpersonnel 474.6 499.5 522.8 5.3 4.7
Special projects4 4.9 11.1
Currency5 170.7 164.5 171.0 - 3 . 6 3.9 1. In this and subsequent tables in this volume, details 3. For detailed information see chap. 2.
may not add to totals and may not yield percentage changes 4. See text note 1 and appendix C. shown because of rounding. 5. See text note 2 and appendix C.
2. For detailed information see chap. 3.
Table 1.2 Operating Expenses of the Federal Reserve System, Net of Receipts and Claims for Reimbursement, 1987-89 Millions of dollars, except as noted
Item 1987 actual
1988 estimate
1989 budget
Percent change Item 1987
actual 1988
estimate 1989
budget 1987-88 1988-89
Total System operating expenses 1,278 1,352 1,427 5.8 5.5 LESS
Revenue from priced services 650 664 704 2.2 6.0 Other income 15 16 17 9.3 3.7 Claims for reimbursement1 109 103 109 - 5 . 4 5.1
EQUALS Net System operating expenses 504 568 597 12.7 5.1
1. The costs of fiscal agency services to the U.S. agencies have agreed to reimburse the Federal Reserve. In Treasury and other government agencies for which the practice, not all these claims are paid.
Digitized for FRASER http://fraser.stlouisfed.org/ Federal Reserve Bank of St. Louis
Federal Reserve System 7
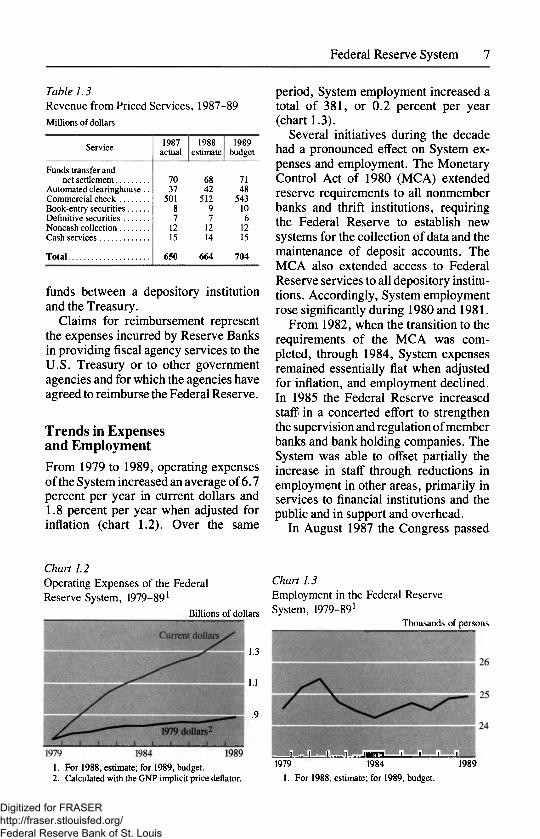
Table 1.3 Revenue from Priced Services, 1987-89 Millions of dollars
Service 1987 actual
1988 estimate
1989 budget
Funds transfer and net settlement 70 68 71
Automated clearinghouse .. 37 42 48 Commercial check 501 512 543 Book-entry securities 8 9 10 Definitive securities 7 7 6 Noncash collection 12 12 12 Cash services 15 14 15
Total 650 664 704
funds between a depository institution and the Treasury.
Claims for reimbursement represent the expenses incurred by Reserve Banks in providing fiscal agency services to the U.S. Treasury or to other government agencies and for which the agencies have agreed to reimburse the Federal Reserve.
Trends in Expenses and Employment From 1979 to 1989, operating expenses of the System increased an average of 6.7 percent per year in current dollars and 1.8 percent per year when adjusted for inflation (chart 1.2). Over the same
period, System employment increased a total of 381, or 0.2 percent per year (chart 1.3).
Several initiatives during the decade had a pronounced effect on System ex-penses and employment. The Monetary Control Act of 1980 (MCA) extended reserve requirements to all nonmember banks and thrift institutions, requiring the Federal Reserve to establish new systems for the collection of data and the maintenance of deposit accounts. The MCA also extended access to Federal Reserve services to all depository institu-tions. Accordingly, System employment rose significantly during 1980 and 1981.
From 1982, when the transition to the requirements of the MCA was com-pleted, through 1984, System expenses remained essentially flat when adjusted for inflation, and employment declined. In 1985 the Federal Reserve increased staff in a concerted effort to strengthen the supervision and regulation of member banks and bank holding companies. The System was able to offset partially the increase in staff through reductions in employment in other areas, primarily in services to financial institutions and the public and in support and overhead.
In August 1987 the Congress passed
Chart 1.2 Operating Expenses of the Federal Reserve System, 1979-891
Billions of dollars
1.3
1.1
.9
1. For 1988, estimate; for 1989, budget. 2. Calculated with the GNP implicit price deflator.
Chart 1.3 Employment in the Federal Reserve System, 1979-891
Thousands of persons
I 1 1 1 I I I I 1 I 1979 1984 1989
1. For 1988, estimate; for 1989, budget.
Digitized for FRASER http://fraser.stlouisfed.org/ Federal Reserve Bank of St. Louis

8 Federal Reserve System
the Expedited Funds Availability Act (title VI of Public Law 100-86, the Competitive Equality Banking Act of 1987). The act, which became effective on September 1, 1988, requires the Fed-eral Reserve to issue regulations to ensure the prompt availability of funds and the expeditious return of checks. Staff in-creases throughout the System were necessary to meet this mandate and to handle anticipated increases in the vol-umes of returned checks processed through the Reserve Banks.
Operational Areas Federal Reserve expenses are classified for budgeting purposes according to the major operational areas of the System: monetary and economic policy, supervi-sion and regulation, services to financial institutions and the public, and services to the U.S. Treasury and other govern-ment agencies (table 1.4). Costs for support and overhead are redistributed or
allocated to the four operational areas. Only the Reserve Banks perform ser-vices to the Treasury and other govern-ment agencies. The operational area unique to the Board of Governors, Sys-tem policy direction and oversight, is considered an overhead expense of the System (see chapter 2).
1989 Budget Initiatives The Reserve Banks and the Board are beginning or continuing several major initiatives for 1989. Several such projects involve savings bonds on behalf of the U.S. Treasury: expansion of a project within the Fourth District for centralized issuance of over-the-counter savings bonds; accounting for, and printing, bonds on behalf of companies with em-ployee payroll deduction plans; and processing retired savings bonds on check-sorting equipment. The Treasury has also asked die Federal Reserve for improvements in Treasury Direct, a
Table 1.4 Operating Expenses of the Federal Reserve System, by Operational Area, 1987-891
Millions of dollars, except as noted
Operational area and entity
1987 actual
1988 estimate
1989 budget
Percent change Operational area and entity
1987 actual
1988 estimate
1989 budget 1987-88 1988-89
Monetary and economic policy 143.6 149.4 159.8 4.0 7.0 Reserve Banks 86.5 88.8 95.8 2.7 7.9 Board of Governors 57.1 60.6 64.0 6.0 5.6
Supervision and regulation 197.3 214.1 230.5 8.5 7.6 Reserve Banks 170.4 187.1 201.5 9.8 7.7 Board of Governors 26.9 27.0 28.9 .6 7.1
Services to financial institutions and the public 801.6 846.0 887.9 5.5 5.0
Reserve Banks 779.2 842.9 884.9 5.5 5.0 Board of Governors 2.3 3.0 3.1 29.1 3.7
Services to the U.S. Treasury and other government agencies2 135.7 142.4 148.4 5.0 4.2
Total 1,278.1 1,351.9 1,426.5 5.8 5.5 Reserve Banks 1,191.8 1,261.3 1,330.5 5.8 5.5 Board of Governors 86.3 90.6 96.0 5.0 5.9
1. Operating expenses reflect all allocations for support areas shown above. As a result, the numbers in chap. 2 for and overhead and exclude capital outlays. The operational the operational areas are not the same as those shown here. area unique to the Board of Governors, System policy 2. Reserve Banks only. The Board of Governors does direction and oversight, which is shown separately in not provide these services, chap. 2, has been allocated across the operational
Digitized for FRASER http://fraser.stlouisfed.org/ Federal Reserve Bank of St. Louis
9 Federal Reserve System
system begun in 1987 to handle in book-entry (computerized) form all Treasury securities bought and sold by individuals.
Automation initiatives continue to have a large effect on the System's operating budgets. The Board and Re-serve Banks are expanding office automa-tion systems, several Districts are antici-pating the expansion of their computer capacity, and many Reserve Banks are working on contingency processing for critical operations.
Supervision and regulation efforts also continue to receive a major emphasis in the budgets. Spending in this area will be larger than 1988 estimated expenses to accommodate the greater complexity of examinations, more holding company examinations, and Regulation CC (Expe-dited Funds Availability). In addition, the Board and Reserve Banks are devel-oping a National Information Center to provide a single source for much of the information needed to review applica-tions, monitor safety and soundness, and maintain the integrity of data in an era of wider interstate banking and growing complexity in the financial markets.
Last, the Board is reevaluating its compensation structure with a view to improving its ability to attract and retain high-quality staff and to meet critical responsibilities. •
Digitized for FRASER http://fraser.stlouisfed.org/ Federal Reserve Bank of St. Louis

11
Chapter 2
Board of Governors
For 1989 the Board of Governors has budgeted operating expenses of $96.0 million, an increase of $5.4 million, or 5.9 percent, over estimated expenses for 1988. These expenses are 6.0 percent of the total for the Federal Reserve System as a whole, including the costs of special projects and of currency (see chapter 1).
The growth in Board expenses between 1988 and 1989 is attributable to a number of factors. The general pay increase and routine salary actions add $3.2 million to salaries. First-year costs for the imple-mentation of a new compensation struc-ture require $900,000, a portion of which will be offset over time by savings associated with reduced turnover. Be-cause of rate increases, costs for health insurance are $700,000 higher, and be-cause of the greater proportion of employ-ees covered by Social Security in 1989, retirement expenses increase $300,000. The $700,000 cost of a study of consumer finances, when netted against the expense of other surveys completed in 1988, will raise the net expense allocated for such work $100,000. Costs for the develop-ment of software for the National Infor-mation Center, a Systemwide, standard-ized database on the structure and finances of the nation's banking industry, will rise $300,000 in 1989, to $700,000. Also included in the budget are funds for the continued strengthening of the supervi-sion function plus an upgrade of the resources available to the Board to per-form audits of the automation systems at the Reserve Banks.
Central automation services provided to the operating divisions by the Informa-tion Resources Management (IRM) divi-sions account for a significant part of the Board's costs. As it was last year, the
budget for centralized IRM resources has been reduced: user requirements have diminished, and productivity and quality in the IRM provider divisions have improved. Under the Board's charge-back procedures for using IRM re-sources, such resources can be ex-changed, within certain constraints, for alternative means to attain objectives, a choice that gives both the operating program manager and the provider of the resources a strong incentive to be more efficient. The Board, through its budget process, continues to refine these charge-back procedures.
The following sections analyze the operating budgets for the Board's four operational areas and discuss trends in expenses and employment. Appendix A describes the operational areas of the Board and the Banks, appendix B dis-cusses the Board's budgeting process, and appendix C presents, among other topics, the Board's capital outlays.
The Budget by Operational Area The Board's activities fall into four broadly defined operational areas: mon-etary and economic policy, supervision and regulation of financial institutions, services to financial institutions and the public, and System policy direction and oversight (see also chapter 1 and appen-dix A).
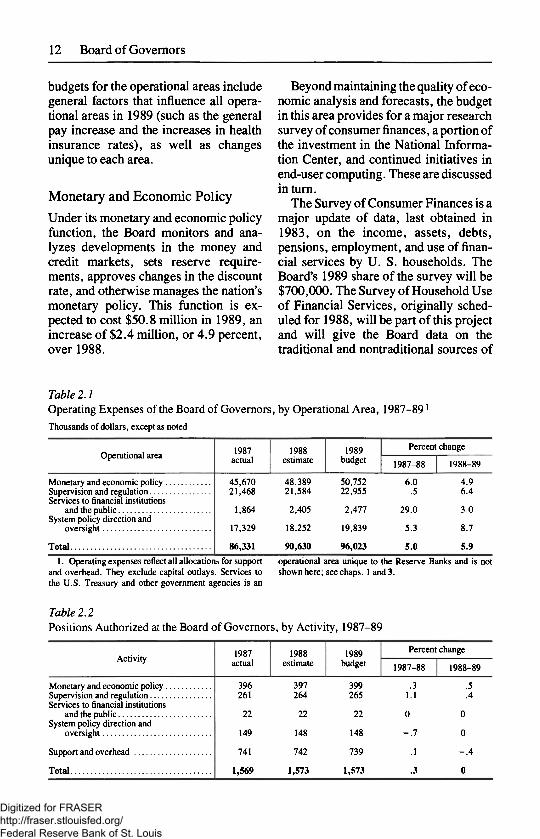
Table 2.1 shows the operating ex-penses, and table 2.2 shows the number of authorized positions, for each of the Board's operational areas for the years 1987-89. The costs include those for support and overhead, allocated to each operational area according to that area's proportion of total direct expenses. The
Digitized for FRASER http://fraser.stlouisfed.org/ Federal Reserve Bank of St. Louis
12 Board of Governors
budgets for the operational areas include general factors that influence all opera-tional areas in 1989 (such as the general pay increase and the increases in health insurance rates), as well as changes unique to each area.
Monetary and Economic Policy Under its monetary and economic policy function, the Board monitors and ana-lyzes developments in the money and credit markets, sets reserve require-ments, approves changes in the discount rate, and otherwise manages the nation's monetary policy. This function is ex-pected to cost $50.8 million in 1989, an increase of $2.4 million, or 4.9 percent, over 1988.
Beyond maintaining the quality of eco-nomic analysis and forecasts, the budget in this area provides for a major research survey of consumer finances, a portion of the investment in the National Informa-tion Center, and continued initiatives in end-user computing. These are discussed in turn.
The Survey of Consumer Finances is a major update of data, last obtained in 1983, on the income, assets, debts, pensions, employment, and use of finan-cial services by U. S. households. The Board's 1989 share of the survey will be $700,000. The Survey of Household Use of Financial Services, originally sched-uled for 1988, will be part of this project and will give the Board data on the traditional and nontraditional sources of
Table 2.1 Operating Expenses of the Board of Governors, by Operational Area, 1987-891
Thousands of dollars, except as noted
Operational area 1987 actual
1988 estimate
1989 budget
Percent
1987-88
change
1988-89
Monetary and economic policy Supervision and regulation Services to financial institutions
and the public System policy direction and
oversight
Total
45,670 48,389 50,752 6.0 4.9 21,468 21,584 22,955 .5 6.4
1,864 2,405 2,477 29.0 3.0
17,329 18,252 19,839 5.3 8.7
86,331 90,630 96,023 5.0 5.9
1. Operating expenses reflect all allocations for support operational area unique to the Reserve Banks and is not and overhead. They exclude capital outlays. Services to shown here; see chaps. 1 and 3. the U.S. Treasury and other government agencies is an
Table 2.2 Positions Authorized at the Board of Governors, by Activity, 1987-89
Activity 1987 actual
1988 estimate
1989 budget
Percent change Activity 1987
actual 1988
estimate 1989
budget 1987-88 1988-89
Monetary and economic policy 396 397 399 .3 .5 Supervision and regulation 261 264 265 1.1 .4 Services to financial institutions
and the public 22 22 22 0 0 System policy direction and
oversight 149 148 148 - . 7 0
Support and overhead 741 742 739 .1 - . 4
Total 1,569 1,573 1,573 .3 0
Digitized for FRASER http://fraser.stlouisfed.org/ Federal Reserve Bank of St. Louis

13 Board of Governors
financial services to households. Combin-ing the surveys yields significant savings.
In 1988 the Board approved the cre-ation of the National Information Center to provide a cost-effective and high-quality database on the structure and finances of the nation's banks and bank holding companies. The staff made progress in 1988 to define the require-ments of the project and prepare the necessary software. The 1989 budget provides $737,000 to continue the devel-opment of the software and prepare the data. When completed, the National Information Center will provide the Board and the Reserve Banks a single source for much of the information needed to review applications, monitor the safety and soundness of financial institutions, and maintain the integrity of data in an era of increasing interstate banking and financial market complexity.
The budget provides for the final phase of the research automation project. The 1989 operating costs of this project, $245,000, are offset by reductions, for the second year in a row, in expenses for centrally provided automation services. The decrease in mainframe charges is tied to lower rates charged by the divi-sions providing the mainframe resources, to progress made in transferring work from the mainframe to the local network, and to software that allows more efficient programming and data manipulation on the departmental computer. The savings also help offset the costs of two positions added to this operational area to improve the data and analysis concerning the debt problems of developing countries, the U.S. foreign trade deficit, and other key issues.
Supervision and Regulation Supervision of financial institutions in-cludes reviews of examination and inspec-tion reports on state member banks
prepared by the Reserve Banks, special studies related to international applica-tions, direction of enforcement actions, and regulation of trust activities. Regula-tion includes the following activities: the formulation of regulations; the oversight of mergers, foreign banking activities, and compliance with consumer regula-tions; and the regulation of securities credit.
The $23.0 million budget for supervi-sion and regulation is $ 1.4 million, or 6.4 percent, greater than estimated expenses for 1988. The size of the increase in this operational area would have been larger except for the one-time $450,000 expense for the Small Business Survey, which was charged to this category in 1988 and does not recur in 1989. The budget funds the known costs of the project on risk-based capital standards, but additional resources, not included in this budget, may be required for software develop-ment to support this initiative.
The 1989 budget supports the contin-ued strengthening of supervision and regulation through the creation of six new positions: two positions are to revise examination manuals for banks and bank holding companies; the remaining four are to manage a growing database for country exposure and risk-based capital, improve the accounting review of public disclosure documents, increase emphasis on the Regulatory Improvement Project, and help establish the National Informa-tion Center. The new positions are almost completely offset by the elimination of five administrative positions, a reduction permitted by the greater productivity derived from office automation.
Services to Financial Institutions and the Public The $2.5 million budgeted for services to financial institutions and the public is $72,000, or 3.0 percent, higher than
Digitized for FRASER http://fraser.stlouisfed.org/ Federal Reserve Bank of St. Louis

14 Board of Governors
1988 estimated expenses. This opera-tional area is composed almost entirely of programs supporting the payments func-tion of the Federal Reserve System.
The 3.0 percent increase for 1989 is small because the 1988 budget included a large one-time increment to improve the management of currency operations through automation. The 1989 budget includes $283,000 to continue the project at approximately the same level as in 1988. Costs should fall in 1990, when all development is complete and expenses decline to the maintenance level. The automation project allows managers to make more informed and timely deci-sions on ordering and transporting cur-rency. Efficiencies generated by the project will reduce the volume of cur-rency ordered and the number of ship-ments required, potentially saving the System's currency budget about $500,000 per year.
System Policy Direction and Oversight The $19.8 million budget for System policy direction and oversight is $1.6 million, or 8.7 percent, more than esti-mated 1988 expenses. Three factors caused the increase. First, the number and length of position vacancies in the Office of Board Members and in the Office of the Inspector General was high in 1988, causing actual salary expenses that year to be low relative to the 1989 budget for the same number of positions. Second, the budget includes development of software to enhance the administration of the Board's compensation program. Third, the budget funds several new projects, including the records manage-ment initiative and an effort to improve the frequency and thoroughness of audits of automation systems at the Reserve Banks.
10-Year Trend During the period from 1979 through 1989 the Board's operating expenses have grown from $53.2 million to $96.0 million, an average increase of 6.1 percent per year in current dollars and 1.4 percent in constant dollars (chart 2.1). During this period, the costs for personnel have increased at an average of 5.2 percent per year in current dollars (chart 2.2), while expenses for goods and services have risen at 8.8 percent (chart 2.3). When measured in inflation-ad-justed dollars, expenses for personnel
Chart 2.1 Operating Expenses of the Board of Governors, 1979-891
Millions of dollars
1979 1984 1989 1. For 1988, estimate; for 1989, budget. 2. Calculated with the GNP implicit price deflator.
Chart 2.2 Expenses for Personnel Services at the Board of Governors, 1979-891
Millions of dollars
l I I l I I I 1 I I 1979 1984 1989
1. For 1988, estimate; for 1989, budget. 2. Calculated with the GNP implicit price deflator.
Digitized for FRASER http://fraser.stlouisfed.org/ Federal Reserve Bank of St. Louis
Board of Governors 15
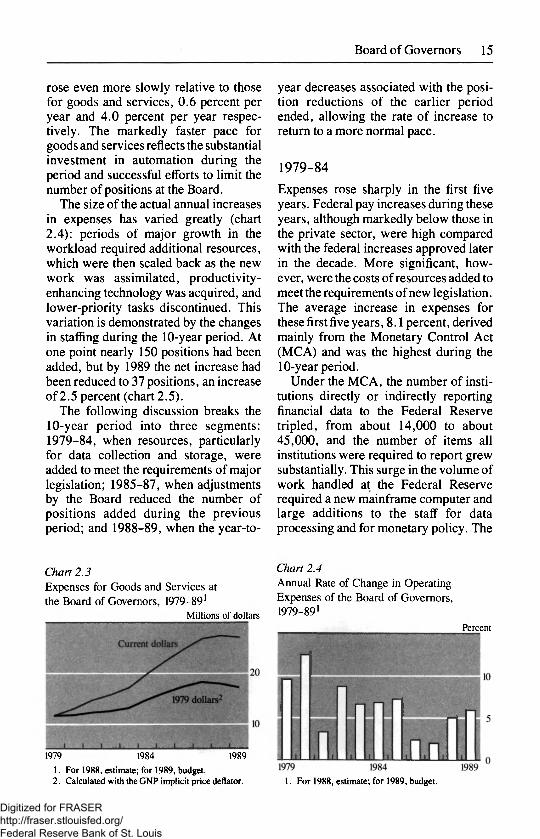
rose even more slowly relative to those for goods and services, 0.6 percent per year and 4.0 percent per year respec-tively. The markedly faster pace for goods and services reflects the substantial investment in automation during the period and successful efforts to limit the number of positions at the Board.
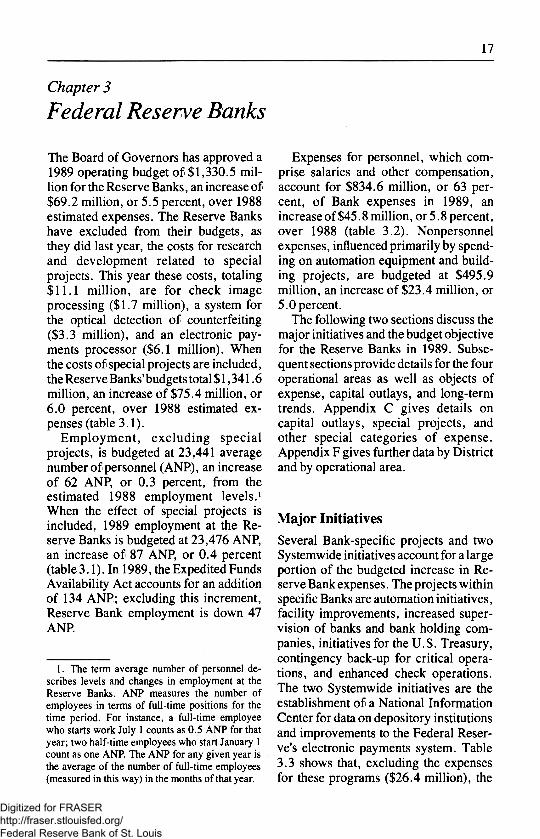
The size of the actual annual increases in expenses has varied greatly (chart 2.4): periods of major growth in the workload required additional resources, which were then scaled back as the new work was assimilated, productivity-enhancing technology was acquired, and lower-priority tasks discontinued. This variation is demonstrated by the changes in staffing during the 10-year period. At one point nearly 150 positions had been added, but by 1989 the net increase had been reduced to 37 positions, an increase of 2.5 percent (chart 2.5).
The following discussion breaks the 10-year period into three segments: 1979-84, when resources, particularly for data collection and storage, were added to meet the requirements of major legislation; 1985-87, when adjustments by the Board reduced the number of positions added during the previous period; and 1988-89, when the year-to-
Chart 2.3 Expenses for Goods and Services at the Board of Governors, 1979-891
Millions of dollars
1979 1984 1989 1. For 1988, estimate; for 1989, budget. 2. Calculated with the GNP implicit price deflator.
year decreases associated with the posi-tion reductions of the earlier period ended, allowing the rate of increase to return to a more normal pace.
1979-84 Expenses rose sharply in the first five years. Federal pay increases during these years, although markedly below those in the private sector, were high compared with the federal increases approved later in the decade. More significant, how-ever, were the costs of resources added to meet the requirements of new legislation. The average increase in expenses for these first five years, 8.1 percent, derived mainly from the Monetary Control Act (MCA) and was the highest during the 10-year period.
Under the MCA, the number of insti-tutions directly or indirectly reporting financial data to the Federal Reserve tripled, from about 14,000 to about 45,000, and the number of items all institutions were required to report grew substantially. This surge in the volume of work handled at the Federal Reserve required a new mainframe computer and large additions to the staff for data processing and for monetary policy. The
Chart 2.4 Annual Rate of Change in Operating Expenses of the Board of Governors, 1979-891
Percent
1. For 1988, estimate; for 1989, budget.
Digitized for FRASER http://fraser.stlouisfed.org/ Federal Reserve Bank of St. Louis

16 Board of Governors
requirement of the MCA that the Federal Reserve price many services it had previ-ously provided without explicit charge and expand their availability also im-posed costs of implementation. Also during this period, the deregulation and other changes in the banking industry arising from the Financial Institutions Regulatory and Interest Rate Control Act required additional supervisory staff at the Federal Reserve. To meet all of these requirements the number of positions jumped from 1,508 to 1,653, an increase of almost 10 percent, over the five years. Employment grew by a like percentage, from 1,447 to 1,588.
1985-87 In mid-1984 the Board established the Program Improvement Project (PIP) with the goal of reducing the number of positions at the Board 7 percent by the end of 1986. PIP made large changes in the structure and size of the data process-ing divisions; somewhat lesser reduc-tions were made throughout the rest of the Board's staff.
Although PIP gave careful consider-ation to exempting areas addressing problems such as the trade deficit and the
debt positions of developing countries, the only area excluded from the overall reduction program was supervision and regulation. After six positions supporting lower-priority functions in the supervi-sion and regulation area were abolished, 29 positions were added to the programs in the area directly concerned with the growing number of problems in the nation's banking industry. Even with this increase, the net number of positions Board-wide declined by 73 in 1985.
The one-time costs of implementing PIP, coupled with enhanced efforts to automate critical functions, limited the effect of these reductions on the Board's expenses in 1985. PIP yielded a further decrease of 40 positions in 1986. The effect of these reductions was clearly evident in 1986 and 1987, when the growth of expenses was 2.4 percent and 2.0 percent respectively.
1988-89 Without the legislative demands of the earlier years of the decade or the one-time increment in savings from the staff reductions of the middle years, increases in the Board's expenses returned to a more normal average of 5.4 percent per year in 1988 and 1989. In response to the continued pressures in the supervision function and to the problems of the trade deficit and the debt of developing coun-tries, the Board has authorized expendi-tures to improve automation and has approved minor, selected increases in staff. Pressures in other areas, such as the programs responsible for financial mar-kets, have been met by a growing volume of overtime and a reduction in the level of long-term research that is funded within the budget. Overall, the reductions in staff level accomplished by PIP have been maintained.
Chart 2.5 Employment and Positions at the Board of Governors, 1979-891
Number, in thousands
1. Year-end data. For 1988, estimate; for 1989, budget. Excludes interns and summer positions for youth.
Digitized for FRASER http://fraser.stlouisfed.org/ Federal Reserve Bank of St. Louis
17
Chapter 3
Federal Reserve Banks
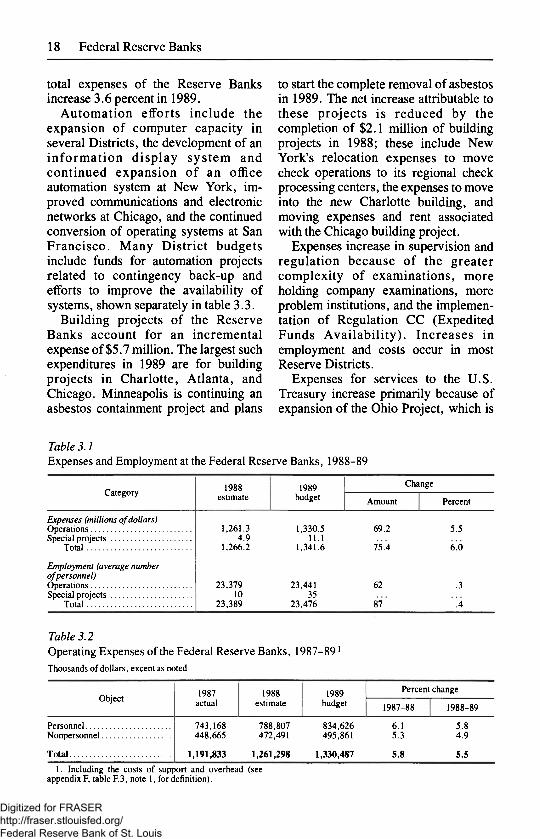
The Board of Governors has approved a 1989 operating budget of 51,330.5 mil-lion for the Reserve Banks, an increase of $69.2 million, or 5.5 percent, over 1988 estimated expenses. The Reserve Banks have excluded from their budgets, as they did last year, the costs for research and development related to special projects. This year these costs, totaling $11.1 million, are for check image processing ($1.7 million), a system for the optical detection of counterfeiting ($3.3 million), and an electronic pay-ments processor ($6.1 million). When the costs of special projects are included, the Reserve Banks' budgets total $1,341.6 million, an increase of $75.4 million, or 6.0 percent, over 1988 estimated ex-penses (table 3.1).
Employment, excluding special projects, is budgeted at 23,441 average number of personnel (ANP), an increase of 62 ANP, or 0.3 percent, from the estimated 1988 employment levels.1
When the effect of special projects is included, 1989 employment at the Re-serve Banks is budgeted at 23,476 ANP, an increase of 87 ANP, or 0.4 percent (table 3.1). In 1989, the Expedited Funds Availability Act accounts for an addition of 134 ANP; excluding this increment, Reserve Bank employment is down 47 ANP.
1. The term average number of personnel de-scribes levels and changes in employment at the Reserve Banks. ANP measures the number of employees in terms of full-time positions for the time period. For instance, a full-time employee who starts work July 1 counts as 0.5 ANP for that year; two half-time employees who start January 1 count as one ANP. The ANP for any given year is the average of the number of full-time employees (measured in this way) in the months of that year.
Expenses for personnel, which com-prise salaries and other compensation, account for $834.6 million, or 63 per-cent, of Bank expenses in 1989, an increase of $45.8 million, or 5.8 percent, over 1988 (table 3.2). Nonpersonnel expenses, influenced primarily by spend-ing on automation equipment and build-ing projects, are budgeted at $495.9 million, an increase of $23.4 million, or 5.0 percent.
The following two sections discuss the major initiatives and the budget objective for the Reserve Banks in 1989. Subse-quent sections provide details for the four operational areas as well as objects of expense, capital outlays, and long-term trends. Appendix C gives details on capital outlays, special projects, and other special categories of expense. Appendix F gives further data by District and by operational area.
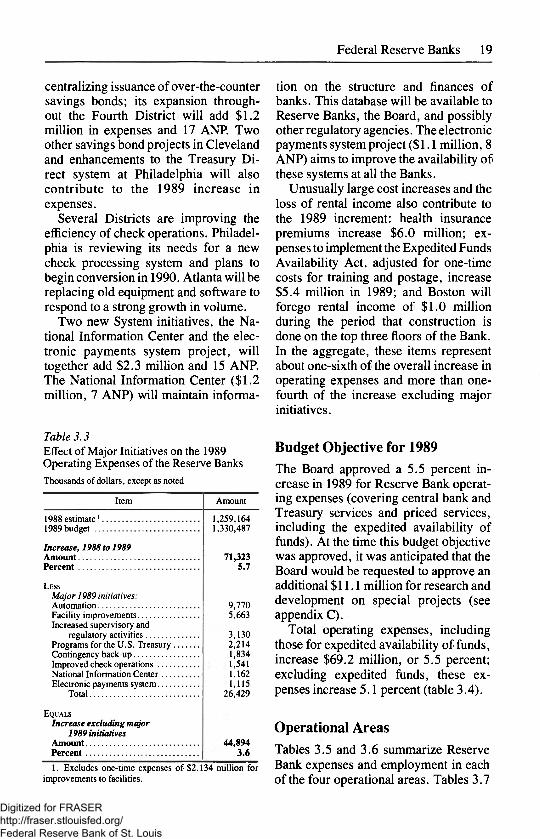
Major Initiatives Several Bank-specific projects and two Systemwide initiatives account for a large portion of the budgeted increase in Re-serve Bank expenses. The projects within specific Banks are automation initiatives, facility improvements, increased super-vision of banks and bank holding com-panies, initiatives for the U.S. Treasury, contingency back-up for critical opera-tions, and enhanced check operations. The two Systemwide initiatives are the establishment of a National Information Center for data on depository institutions and improvements to the Federal Reser-ve's electronic payments system. Table 3.3 shows that, excluding the expenses for these programs ($26.4 million), the
Digitized for FRASER http://fraser.stlouisfed.org/ Federal Reserve Bank of St. Louis
18 Federal Reserve Banks
total expenses of the Reserve Banks increase 3.6 percent in 1989.
Automation efforts include the expansion of computer capacity in several Districts, the development of an information display system and continued expansion of an office automation system at New York, im-proved communications and electronic networks at Chicago, and the continued conversion of operating systems at San Francisco. Many District budgets include funds for automation projects related to contingency back-up and efforts to improve the availability of systems, shown separately in table 3.3.
Building projects of the Reserve Banks account for an incremental expense of $5.7 million. The largest such expenditures in 1989 are for building projects in Charlotte, Atlanta, and Chicago. Minneapolis is continuing an asbestos containment project and plans
to start the complete removal of asbestos in 1989. The net increase attributable to these projects is reduced by the completion of $2.1 million of building projects in 1988; these include New York's relocation expenses to move check operations to its regional check processing centers, the expenses to move into the new Charlotte building, and moving expenses and rent associated with the Chicago building project.
Expenses increase in supervision and regulation because of the greater complexity of examinations, more holding company examinations, more problem institutions, and the implemen-tation of Regulation CC (Expedited Funds Availability). Increases in employment and costs occur in most Reserve Districts.
Expenses for services to the U.S. Treasury increase primarily because of expansion of the Ohio Project, which is
Table 3.1 Expenses and Employment at the Federal Reserve Banks, 1988-89
Category 1988 estimate
1989 budget
Change Category 1988
estimate 1989
budget Amount Percent
Expenses (millions of dollars) Operations Special projects
Total
Employment (average number ofpersonnel) Operations Special projects
Total
1,261.3 1,330.5 69.2 5.5 4.9 11.1
1,266.2 1,341.6 75.4 6.0
23,379 23,441 62 .3 10 35
23,389 23,476 87 .4
Table 3.2 Operating Expenses of the Federal Reserve Banks, 1987-891
Thousands of dollars. exceDt as noted
Object 1987 1988 1989 Percent change Object actual estimate budget 1987-88 1988-89
Personnel 743,168 788,807 834,626 6.1 5.8 Nonpersonnel 448,665 472,491 495,861 5.3 4.9
Total 1,191,833 1,261,298 1,330,487 5.8 5.5
1. Including the costs of support and overhead (see appendix F, table F.3, note 1, for definition).
Digitized for FRASER http://fraser.stlouisfed.org/ Federal Reserve Bank of St. Louis
Federal Reserve Banks 19
centralizing issuance of over-the-counter savings bonds; its expansion through-out the Fourth District will add $1.2 million in expenses and 17 ANR Two other savings bond projects in Cleveland and enhancements to the Treasury Di-rect system at Philadelphia will also contribute to the 1989 increase in expenses.
Several Districts are improving the efficiency of check operations. Philadel-phia is reviewing its needs for a new check processing system and plans to begin conversion in 1990. Atlanta will be replacing old equipment and software to respond to a strong growth in volume.
Two new System initiatives, the Na-tional Information Center and the elec-tronic payments system project, will together add $2.3 million and 15 ANP. The National Information Center ($1.2 million, 7 ANP) will maintain informa-
tion on the structure and finances of banks. This database will be available to Reserve Banks, the Board, and possibly other regulatory agencies. The electronic payments system project ($1.1 million, 8 ANP) aims to improve the availability of these systems at all the Banks.
Unusually large cost increases and the loss of rental income also contribute to the 1989 increment: health insurance premiums increase $6.0 million; ex-penses to implement the Expedited Funds Availability Act, adjusted for one-time costs for training and postage, increase $5.4 million in 1989; and Boston will forego rental income of $1.0 million during the period that construction is done on the top three floors of the Bank. In the aggregate, these items represent about one-sixth of the overall increase in operating expenses and more than one-fourth of the increase excluding major initiatives.
Table 3.3 Effect of Major Initiatives on the 1989 Operating Expenses of the Reserve Banks Thousands of dollars, except as noted
Item
1988 estimate1
1989 budget ..
Increase, 1988 to 1989 Amount Percent
LESS Major 1989 initiatives: Automation Facility improvements Increased supervisory and
regulatory activities Programs for the U.S. Treasury . Contingency back-up Improved check operations National Information Center Electronic payments system
Total
EQUALS Increase excluding major
1989 initiatives Amount Percent
Amount
1,259,164 1,330,487
71,323 5.7
9,770 5,663
3,130 2,214 1,834 1,541 1,162 1,115
26,429
44,894 3.6
1. Excludes one-time expenses of $2,134 million for improvements to facilities.
Budget Objective for 1989 The Board approved a 5.5 percent in-crease in 1989 for Reserve Bank operat-ing expenses (covering central bank and Treasury services and priced services, including the expedited availability of funds). At the time this budget objective was approved, it was anticipated that the Board would be requested to approve an additional $11.1 million for research and development on special projects (see appendix C).
Total operating expenses, including those for expedited availability of funds, increase $69.2 million, or 5.5 percent; excluding expedited funds, these ex-penses increase 5.1 percent (table 3.4).
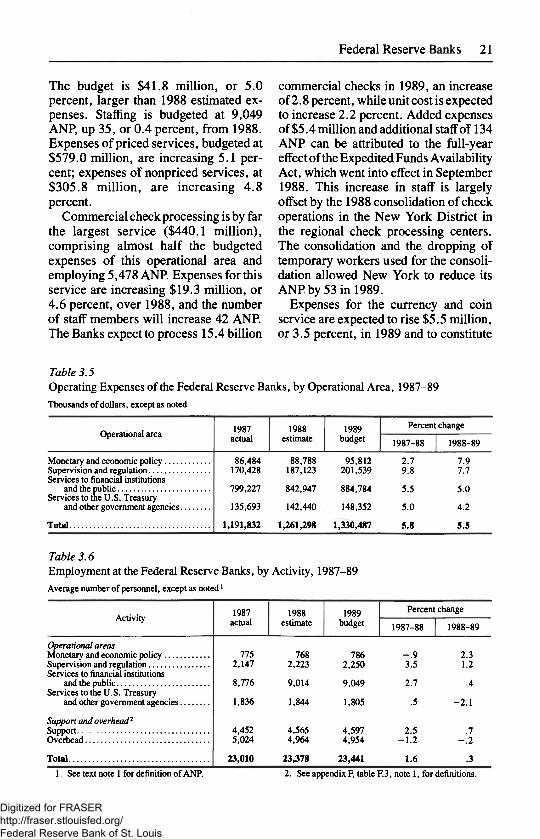
Operational Areas Tables 3.5 and 3.6 summarize Reserve Bank expenses and employment in each of the four operational areas. Tables 3.7
Digitized for FRASER http://fraser.stlouisfed.org/ Federal Reserve Bank of St. Louis

20 Federal Reserve System
through 3.9 show expense details for each area.
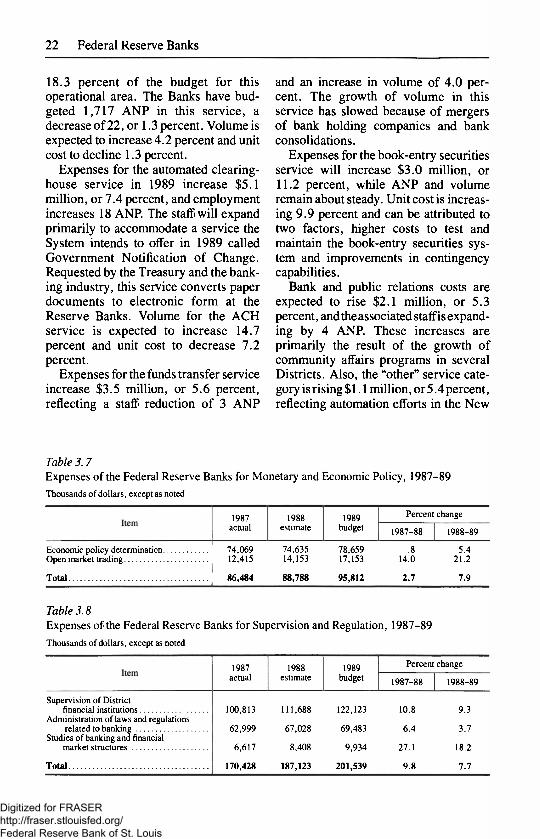
Monetary and Economic Policy Expenses at the Reserve Banks for mon-etary and economic policy are budgeted at $95.8 million, about 7.2 percent of the Banks' operating expenses (table 3.7). The increase over 1988 estimated ex-penses is $7.0 million, or 7.9 percent. Employment in this area is 786 ANP, an increase of 18 ANP, or 2.3 percent, over 1988.
Net additions to the Banks' staff (pri-marily economists), salary actions, and automation initiatives are the main sources of higher spending. The 1989 staffing level is slightly lower than that budgeted for 1988.
Dallas plans to expand its staff by 6 ANP over the 1988 estimate of 39 ANP to better address regional issues and to improve its monetary policy research. Richmond plans to add 2 ANP (the current level is 33) to enhance its work in international and regional studies. Auto-mation initiatives, all at the New York Bank, include a new system to display information on the markets for govern-
Table 3.4 Comparison of 1989 Budget of the Reserve Banks with 1989 Budget Objective Percent increase from 1988 estimated expenses
Item 1989
budget objective
1989 budget
Operating expenses excluding those related to the Expedited Funds Availability Act 4.7 5.1
Expenses related to the Expedited Funds Availability Act .8 .4
Total operating expenses 5.5 5.5 Special Projects .3 .5
Total 5.8 6.0
ment and corporate securities and for-eign exchange; a new system of trading and clearing securities; and streamlining the reporting series for government securities dealers.
Supervision and Regulation Expenses for supervision and regulation, $201.5 million, increase $14.4 million, or 7.7 percent, over 1988 (table 3.8). This area now comprises 15.1 percent of total expenses for the Reserve Banks, compared with 13.2 percent in 1984. The 1989 staff level of 2,250 ANP is an increase of 27, or 1.2 percent, over 1988. Since 1984, staffing has increased 365 ANP.
The 1989 increase in costs and ANP are the result of continued growth in the number of bank holding companies; increases in the number of de novo banks that, under Board guidelines, require more frequent examinations; the Sy-stem's enhanced program for examina-tions of international operations of U.S. banks and U.S. offices of foreign banks; and monitoring for compliance with Regulation CC. The increase for staff, spread over most Districts, is moderate compared with that in recent years. Other factors contributing to the cost increment are a greater emphasis on monitoring reserve accounts with respect to daylight and overnight overdrafts, the full year effects of the development of the National Information Center, and the continued expansion in the use of microcomputers.
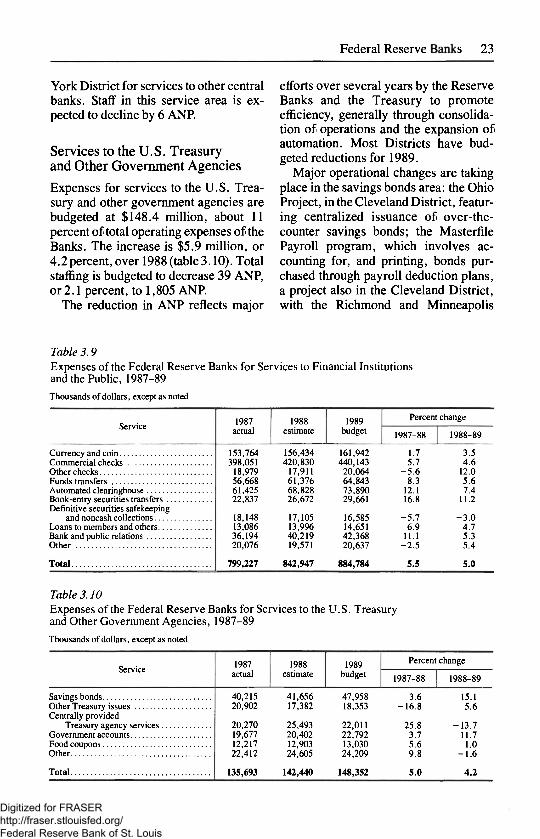
Services to Financial Institutions and the Public Expenses for services to financial institu-tions and the public include both priced and nonpriced services (table 3.9). They are budgeted at $884.8 million and account for two-thirds of total expenses, a ratio only slightly higher than in 1984.
Digitized for FRASER http://fraser.stlouisfed.org/ Federal Reserve Bank of St. Louis
Federal Reserve System Audits 21
The budget is $41.8 million, or 5.0 percent, larger than 1988 estimated ex-penses. Staffing is budgeted at 9,049 ANP, up 35, or 0.4 percent, from 1988. Expenses of priced services, budgeted at $579.0 million, are increasing 5.1 per-cent; expenses of nonpriced services, at $305.8 million, are increasing 4.8 percent.
Commercial check processing is by far the largest service ($440.1 million), comprising almost half the budgeted expenses of this operational area and employing 5,478 ANP. Expenses for this service are increasing $19.3 million, or 4.6 percent, over 1988, and the number of staff members will increase 42 ANP. The Banks expect to process 15.4 billion
commercial checks in 1989, an increase of 2.8 percent, while unit cost is expected to increase 2.2 percent. Added expenses of $5.4 million and additional staff of 134 ANP can be attributed to the full-year effect of the Expedited Funds Availability Act, which went into effect in September 1988. This increase in staff is largely offset by the 1988 consolidation of check operations in the New York District in the regional check processing centers. The consolidation and the dropping of temporary workers used for the consoli-dation allowed New York to reduce its ANP by 53 in 1989.
Expenses for the currency and coin service are expected to rise $5.5 million, or 3.5 percent, in 1989 and to constitute
Table 3.5 Operating Expenses of the Federal Reserve Banks, by Operational Area, 1987-89 Thousands of dollars, except as noted
Operational area 1987 actual
1988 estimate
1989 budget
Percent
1987-88
change
1988-89
Monetary and economic policy Supervision and regulation Services to financial institutions
and the public Services to the U.S. Treasury
and other government agencies
Total
86,484 88,788 95,812 2.7 7.9 170,428 187,123 201,539 9.8 7.7
799,227 842,947 884,784 5.5 5.0
135,693 142,440 148,352 5.0 4.2
1,191,832 1,261,298 1,330,487 5.8 5.5
Table 3.6 Employment at the Federal Reserve Banks, by Activity, 1987-89 Average number of personnel, except as noted1
Activity 1987 actual
1988 estimate
1989 budget
Percent change Activity 1987
actual 1988
estimate 1989
budget 1987-88 1988-89
Operational areas Monetary and economic policy 775 768 786 - . 9 2.3 Supervision and regulation 2,147 2,223 2,250 3.5 1.2 Services to financial institutions
and the public 8,776 9,014 9,049 2.7 .4 Services to the U.S. Treasury
and other government agencies 1,836 1,844 1,805 .5 - 2 . 1
Support and overhead2
Support 4,452 4,565 4,597 2.5 .7 Overhead 5,024 4,964 4,954 - 1 . 2 - . 2
Total 23,010 23,378 23,441 1.6 .3
1. See text note 1 for definition of ANP. 2. See appendix F, table F.3, note 1, for definitions.
Digitized for FRASER http://fraser.stlouisfed.org/ Federal Reserve Bank of St. Louis
22 Federal Reserve Banks
18.3 percent of the budget for this operational area. The Banks have bud-geted 1,717 ANP in this service, a decrease of 22, or 1.3 percent. Volume is expected to increase 4.2 percent and unit cost to decline 1.3 percent.
Expenses for the automated clearing-house service in 1989 increase $5.1 million, or 7.4 percent, and employment increases 18 ANP. The staff will expand primarily to accommodate a service the System intends to offer in 1989 called Government Notification of Change. Requested by the Treasury and the bank-ing industry, this service converts paper documents to electronic form at the Reserve Banks. Volume for the ACH service is expected to increase 14.7 percent and unit cost to decrease 7.2 percent.
Expenses for the funds transfer service increase $3.5 million, or 5.6 percent, reflecting a staff reduction of 3 ANP
and an increase in volume of 4.0 per-cent. The growth of volume in this service has slowed because of mergers of bank holding companies and bank consolidations.
Expenses for the book-entry securities service will increase $3.0 million, or 11.2 percent, while ANP and volume remain about steady. Unit cost is increas-ing 9.9 percent and can be attributed to two factors, higher costs to test and maintain the book-entry securities sys-tem and improvements in contingency capabilities.
Bank and public relations costs are expected to rise $2.1 million, or 5.3 percent, and the associated staff is expand-ing by 4 ANP. These increases are primarily the result of the growth of community affairs programs in several Districts. Also, the "other" service cate-gory is rising $1.1 million, or 5.4 percent, reflecting automation efforts in the New
Table 3. 7 Expenses of the Federal Reserve Banks for Monetary and Economic Policy, 1987-89 Thousands of dollars, except as noted
1987 1988 1989 Percent change actual estimate budget 1987-88 1988-89
Economic policy determination 74,069 74,635 78,659 . 8 5.4 Open market trading 12,415 14,153 17,153 14.0 21.2
Total 86,484 88,788 95,812 2.7 7.9
Table 3.8 Expenses of the Federal Reserve Banks for Supervision and Regulation, 1987-89 Thousands of dollars, except as noted
1987 1988 1989 Percent change actual estimate budget 1987-88 1988-89
Supervision of District financial institutions 100,813
Administration of laws and regulations related to banking 62,999
Studies of banking and financial market structures 6,617
Total 170,428
111,688 122,123 10.8 9.3
67,028 69,483 6.4 3.7
8,408 9,934 27.1 18.2
187,123 201,539 9.8 7.7
Digitized for FRASER http://fraser.stlouisfed.org/ Federal Reserve Bank of St. Louis
Federal Reserve System Audits 23
York District for services to other central banks. Staff in this service area is ex-pected to decline by 6 ANR
Services to the U.S. Treasury and Other Government Agencies Expenses for services to the U.S. Trea-sury and other government agencies are budgeted at $148.4 million, about 11 percent of total operating expenses of the Banks. The increase is $5.9 million, or 4.2 percent, over 1988 (table 3.10). Total staffing is budgeted to decrease 39 ANP, or 2.1 percent, to 1,805 ANP.
The reduction in ANP reflects major
efforts over several years by the Reserve Banks and the Treasury to promote efficiency, generally through consolida-tion of operations and the expansion of automation. Most Districts have bud-geted reductions for 1989.
Major operational changes are taking place in the savings bonds area: the Ohio Project, in the Cleveland District, featur-ing centralized issuance of over-the-counter savings bonds; the Masterfile Payroll program, which involves ac-counting for, and printing, bonds pur-chased through payroll deduction plans, a project also in the Cleveland District, with the Richmond and Minneapolis
Table 3.9 Expenses of the Federal Reserve Banks for Services to Financial Institutions and the Public, 1987-89 Thousands of dollars, except as noted
Service 1987 actual
1988 estimate
1989 budget
Percent change Service 1987
actual 1988
estimate 1989
budget 1987-88 1988-89
Currency and coin 153,764 156,434 161,942 1.7 3.5 Commercial checks 398,051 420,830 440,143 5.7 4.6 Other checks 18,979 17,911 20,064 - 5 . 6 12.0 Funds transfers 56,668 61,376 64,843 8.3 5.6 Automated clearinghouse 61,425 68,828 73,890 12.1 7.4 Book-entry securities transfers 22,837 26,672 29,661 16.8 11.2 Definitive securities safekeeping
and noncash collections 18,148 17,105 16,585 - 5 . 7 - 3 . 0 Loans to members and others 13,086 13,996 14,651 6.9 4.7 Bank and public relations 36,194 40,219 42,368 11.1 5.3 Other 20,076 19,571 20,637 - 2 . 5 5.4
Total 799,227 842,947 884,784 5.5 5.0
Table 3.10 Expenses of the Federal Reserve Banks for Services to the U.S. Treasury and Other Government Agencies, 1987-89 Thousands of dollars, except as noted
Service 1987 actual
1988 estimate
1989 budget
Percent change Service 1987
actual 1988
estimate 1989
budget 1987-88 1988-89
Savings bonds 40,215 41,656 47,958 3.6 15.1 Other Treasury issues 20,902 17,382 18,353 -16 .8 5.6 Centrally provided
Treasury agency services 20,270 25,493 22,011 25.8 -13 .7 Government accounts 19,677 20,402 22,792 3.7 11.7 Food coupons 12,217 12,903 13,030 5.6 1.0 Other 22,412 24,605 24,209 9.8 - 1 . 6
Total 135,693 142,440 148,352 5.0 4.2
Digitized for FRASER http://fraser.stlouisfed.org/ Federal Reserve Bank of St. Louis

24 Federal Reserve System
Districts participating on a smaller scale; and consolidated operations of Series HH/H payments in the Philadelphia District.
Objects of Expense The operating expenses of the Federal Reserve Banks for personnel and nonper-sonnel are detailed in table 3.11.
Personnel expenses comprise salaries for officers and employees, compensa-tion to other personnel, and retirement and other benefits. Total personnel costs
account for almost 63 percent of Reserve Bank expenses and are expected to in-crease 5.8 percent in 1989.
Total personnel expenses except those for retirement and other benefits account for nearly 52 percent of 1989 budgeted expenses and anticipated growth is $31.5 million, or 4.6 percent. Salaries are expected to increase $35.7 million, or 5.5 percent, and will be offset partially by a decline of $4.2 million, or 32.5 percent, in expenses for other personnel. Merit increases are the primary source of higher expenses for salaries. Also contributing
Table 3.11 Operating Expenses of the Federal Reserve Banks, by Object, 1987-89 Thousands of dollars, except as noted
Object 1987 actual
1988 estimate
1989 budget
Percent change Object 1987
actual 1988
estimate 1989
budget 1987-88 1988-89
PERSONNEL Officers'salaries 60,010 63,685 67,345 6.1 5.7 Employees' salaries 545,358 579,838 611,844 6.3 5.5 Other personnel 16,335 12,956 8,750 - 2 0 . 7 - 3 2 . 5 Retirement and benefits 121,465 132,327 146,687 8.9 10.9
Total personnel 743,168 788,807 834,626 6.1 5.8
NONPERSONNEL Equipment Purchases 4,694 3,829 3,447 - 1 8 . 4 - 1 0 . 0 Rentals 33,857 27,004 24,740 - 2 0 . 2 - 8 . 4 Depreciation 75,802 78,432 85,619 3.5 9.2 Repairs and maintenance 42,467 47,453 51,810 11.7 9.2
Total equipment 156,820 156,717 165,616 - . 1 5.7
Buildings Insurance 842 760 761 - 9 . 8 .1 Taxes on Real Estate 21,710 25,005 27,181 15.2 8.7 Property Depreciation 26,078 28,911 32,125 10.9 11.1 Utilities 22.906 23,387 25,113 2.1 7.4 Rent 17,119 21,611 21,500 26.2 - . 5 Other 18,726 18,217 19.009 - 2 . 7 4.3
Total buildings 107,381 117,890 125,687 9.8 6.6
Shipping Postage 12,150 13,638 13,631 12.3 - . 1 Other 69,200 68,979 70,180 - . 3 1.7
Total shipping 81,350 82,617 83,811 1.6 1.4
Other Supplies 47,282 49,333 51,077 4.3 3.5 Travel 22,155 24,717 25,466 11.6 3.0 Communications 12,291 11,976 12,009 - 2 . 6 .3 Fees 11,357 11,308 12,652 - . 4 11.9 Other 10,029 17,933 19,544 78.8 9.0
Total other 103,114 115,267 120,747 11.8 4.8
Total nonpersonnel 448,665 472,491 495,861 5.3 4.9
Total 1,191,833 1,261,298 1,330,487 5.8 5.5
Digitized for FRASER http://fraser.stlouisfed.org/ Federal Reserve Bank of St. Louis

Federal Reserve System Audits 25
are promotions, reclassifications, and higher levels of staffing. These increases are partially offset by position vacancies (lag), by the replacement of a departing employee with one at lower pay (turn-over), and reduced expenses for over-time. The decrease in expenses for other personnel results from declining use of contract computer programmers and decreased need for temporary help in check operations.
Expenses for retirement and other benefits, which account for 11 percent of the Banks' budget, are anticipated to increase $14.4 million, or 10.9 percent, in 1989. This increase is a result of the continued escalation in hospital and medical costs, a rise in the maximum salary subject to Social Security tax, and increased participation in the System's thrift plan.
Nonpersonnel expenses account for 37 percent of the Reserve Banks' expenses and are projected to increase 4.9 percent in 1989. Equipment expenses are 5.7 percent higher for 1989 and will account for 12.4 percent of total operating costs. The increase results from the purchase of data processing and data communications equipment to handle increased workloads and improve contingency functions, the full-year impact of equipment purchased to meet the demands of the Expedited Funds Availability Act, and a shift from leasing to purchasing of equipment.
Building expenses will rise 6.6 percent for 1989 and account for 9.4 percent of total expenses. Building expansion and renovation projects at Chicago and At-lanta and construction of a new building for the Charlotte Branch of the Richmond Bank contribute to increased expenses for property depreciation, real estate taxes, utilities, and other building opera-tions. Depreciation expenses will also increase in 1989 as numerous smaller renovation and repair projects are com-pleted. Offsetting increased rental ex-
pense at New York and Atlanta is a decrease of $900,000 in Chicago as the Bank gives up rental space and moves back to its newly expanded main building.
Shipping costs account for 6.3 percent of the 1989 budget and will increase 1.4 percent next year. This increase is pri-marily the result of expanded check routes necessary for expedited funds. Partially offsetting the 1989 increase is the reduction in postage expenses in-curred in 1988 to inform depository institutions of the requirements for expe-dited funds.
Expenses for other nonpersonnel will increase 4.8 percent to accommodate additional software and the higher cost of supplies.
Capital Outlays Capital outlays of the Reserve Banks are budgeted at $231.7 million, an increase of $28.4 million, or 14.0 percent, over the estimate for 1988 (table 3.12). The capital budgets of the Reserve Banks continue to be dominated by equipment for data processing and data communica-tions and by building projects.
Outlays for data processing and data communications equipment total $87.6 million in 1989, approximately 38 per-cent of the capital budget. The machines include mainframes or upgrades for New York ($6.4 million), Cleveland ($4.9 million), Richmond ($2.6 million), and Kansas City ($7.4 million); new or upgraded check processing equipment for Cleveland ($1.0 million), Richmond ($2.6 million), and Atlanta ($3.0 mil-lion); peripheral computer equipment and upgrades for New York ($4.2 mil-lion), Chicago ($1.7 million), and San Francisco ($1.3 million); and data pro-cessing equipment to support the asbestos abatement project at Minneapolis ($4.6 million).
Digitized for FRASER http://fraser.stlouisfed.org/ Federal Reserve Bank of St. Louis

26 Federal Reserve System
Building outlays amount to $57.0 million in 1989, approximately 25 per-cent of total capital outlays. The major items in this account are the building additions and improvements in Boston ($1.3 million), New York ($3.8 million), Cleveland ($4.1 million), and Kansas City ($1.2 million); consulting fees for the New York District's East Rutherford operations center ($2.3 million); a new building design in Dallas ($4.9 million); the new Helena site, in the Minneapolis District ($7.6 million); and the new building at Charlotte, in the Richmond District ($5.1 million).
Major purchases of furniture and other equipment, which total $30.2 million for 1989, are planned for Boston ($1.0 million), Richmond ($800,000), Atlanta ($2.7 million), New York ($1.2 million), and Minneapolis ($1.2 million).
Outlays for building machinery and equipment are budgeted at $ 13.3 million. Improvements to facilities for emergency power are planned at Cleveland ($1.8 million) and Dallas ($1.4 million), and Kansas City is updating its building support systems ($3.1 million).
Purchases of land and other real estate, at $34.4 million, are primarily for the acquisition of land if a proposal for a new building at Dallas is approved ($23 million) and for the purchase and site
preparation for New York's East Ruther-ford operations center ($10.7 million).
Leasehold improvements, which total $9.1 million, are primarily at the Minne-apolis Bank and are related to its asbestos removal project ($6.6 million).
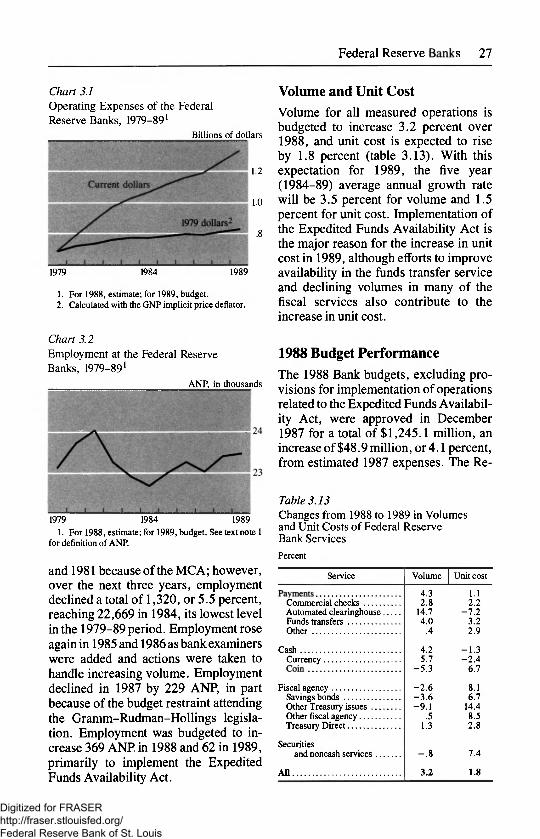
Trends in Expenses and Employment From 1979 to 1989, expenses of the Reserve Banks have increased an average of 6.7 percent per year in current dollars (chart 3.1). In the 1980-83 period, when the Banks began implementing the Mon-etary Control Act (MCA) and inflation drove up wages, the annual average change was 9.1 percent. The average for the 1984-89 period is 4.5 percent per year. Figured in constant (1979) dollars, the annual rate of growth was fairly steady over the decade, averaging 1.8 percent.
Over the last decade the number of employees at the Reserve Banks has increased 337 ANP, or 0.1 percent per year (chart 3.2). From 1974, when the average number of personnel at the Reserve Banks was at its peak of 26,567, employment declined 3,624 ANP, or 13.6 percent, to 22,943 in 1979 under a Systemwide program to increase pro-ductivity. Employment increased in 1980
Table 3.12 Capital Outlays of the Federal Reserve Banks, by Class of Outlay, 1987-89 Thousands of dollars, except as noted
Class 1987 1988 1989 Percent change Class actual estimate budget 1987-88 1988-89
Data processing and data communications equipment 45,162 86,404 87,638 91.3 1.4
Furniture and other equipment 22,394 23,511 30,237 5.0 28.6 Land and other real estate 1,759 2,262 34,419 28.6 1,421.5 Buildings 58,715 78,178 56,964 33.1 -27 .1 Building machinery and equipment 6,163 9,678 13,311 57.0 37.5 Leasehold improvements 4,121 3,275 9,105 -20 .5 178.0
Total 138,314 203,308 231,673 47.0 14.0
Digitized for FRASER http://fraser.stlouisfed.org/ Federal Reserve Bank of St. Louis
Federal Reserve System Audits 27
Chart 3.1 Operating Expenses of the Federal Reserve Banks, 1979-891
Billions of dollars
1.2
1.0
.8
1979 1984 1989
1. For 1988, estimate; for 1989, budget. 2. Calculated with the GNP implicit price deflator.
and 1981 because of the MCA; however, over the next three years, employment declined a total of 1,320, or 5.5 percent, reaching 22,669 in 1984, its lowest level in the 1979-89 period. Employment rose again in 1985 and 1986 as bank examiners were added and actions were taken to handle increasing volume. Employment declined in 1987 by 229 ANP, in part because of the budget restraint attending the Gramm-Rudman-Hollings legisla-tion. Employment was budgeted to in-crease 369 ANP in 1988 and 62 in 1989, primarily to implement the Expedited Funds Availability Act.
Volume and Unit Cost Volume for all measured operations is budgeted to increase 3.2 percent over 1988, and unit cost is expected to rise by 1.8 percent (table 3.13). With this expectation for 1989, the five year (1984-89) average annual growth rate will be 3.5 percent for volume and 1.5 percent for unit cost. Implementation of the Expedited Funds Availability Act is the major reason for the increase in unit cost in 1989, although efforts to improve availability in the funds transfer service and declining volumes in many of the fiscal services also contribute to the increase in unit cost.
1988 Budget Performance The 1988 Bank budgets, excluding pro-visions for implementation of operations related to the Expedited Funds Availabil-ity Act, were approved in December 1987 for a total of $1,245.1 million, an increase of $48.9 million, or 4.1 percent, from estimated 1987 expenses. The Re-
Table 3.13 Changes from 1988 to 1989 in Volumes and Unit Costs of Federal Reserve Bank Services Percent
Service Volume Unit cost
4.3 1.1 Commercial checks 2.8 2.2 Automated clearinghouse 14.7 - 7 . 2 Funds transfers 4.0 3.2 Other .4 2.9
Cash 4.2 - 1 . 3 Currency 5.7 - 2 . 4
- 5 . 3 6.7
Fiscal agency - 2 . 6 8.1 Savings bonds - 3 . 6 6.7 Other Treasury issues - 9 . 1 14.4 Other fiscal agency .5 8.5 Treasury Direct 1.3 2.8
Securities and noncash services - . 8 7.4
All 3.2 1.8 3.2 1.8
Chart 3.2 Employment at the Federal Reserve Banks, 1979-891
ANP, in thousands
1979 1984 1989 1. For 1988, estimate; for 1989, budget. See text note 1
for definition of ANP.
Digitized for FRASER http://fraser.stlouisfed.org/ Federal Reserve Bank of St. Louis
28 Federal Reserve System
serve Banks now estimate 1988 expenses will be $1,249.7 million (again excluding provisions for operational aspects of expedited funds), which is $4.6 million, or 0.4 percent, over the approved budget. One-half of this overrun is attributable to incremental expenses for (nonopera-tional) educational efforts and postage related to the expedited funds mandate, which the Reserve Banks were unable to absorb completely within approved bud-gets. Of the Districts estimated to be over their approved budgets, five of them notified the Board of their expected overrun. The budget overruns of the remaining Districts are within the guide-line allowed by the Board.
The Reserve Banks, while attempting to hold down costs overall, have found it necessary to direct additional resources in several areas. Problems with check operations in Boston, New York, and Cleveland required additional staff, as did increased responsibilities in Philadel-phia and Dallas for supervision and regulation. The 1988 budget proposed by Dallas had been reduced with the under-standing that the Bank could exceed its budget provided that resources were needed for supervision. Efforts to im-prove the availability of automated func-tions and support for programming has increased expenses and staffing levels at Richmond and Kansas City.
1988 Budget Performance on Expedited Funds In early 1988, the Director of the Division of Federal Reserve Bank Operations, acting under authority delegated by the Board, approved supplemental expense budgets, totaling $12.5 million, for the 12 Districts to carry out the Expedited Funds Availability Act. The Reserve Banks now estimate these supplemental expenses at $11.6 million, which is $0.9
million, or 7.8 percent, less than the approved amount. The Boston District expects to exceed its supplemental bud-get; all other Districts anticipate spending an amount equal to, or less than, their approved amounts. •
Digitized for FRASER http://fraser.stlouisfed.org/ Federal Reserve Bank of St. Louis
Part II Special Analysis
Digitized for FRASER http://fraser.stlouisfed.org/ Federal Reserve Bank of St. Louis

31
Chapter 4
The Automated Currency Processing System
Although the public's use of checks, credit cards, and electronic means of payment is expanding, its demand for currency continues to rise (table 4.1). An important function of the Federal Reserve is to satisfy this demand for currency and for coin. Depository institutions circulate their currency through the Reserve Banks, which in turn remove worn and counterfeit bills and recirculate the fit currency. Under the terms of the Federal Reserve Act, the System orders from the Bureau of Engraving and Printing the amount of currency it deems necessary to supplement the recirculated bills.1 Over the years, the Federal Reserve has looked to improvements in technology to meet at the lowest cost the public's demand for currency.
History of Currency Processing Technology A simple counting machine called the Federal Bill Counter was one of the first pieces of equipment used to sort currency at the Reserve Banks. While hand-sorting bills into various pockets on this machine, tellers would visually inspect the quality of the notes and look for counterfeits.
As the volume of notes increased, the Federal Reserve shifted to mechanical counting devices. Employees were un-
1. The Federal Reserve assumes the cost of producing and distributing the currency. The expense of producing and distributing coin, which the Federal Reserve receives from the Bureau of the Mint at face value, remains a liability of the U.S. Treasury. Coin accounts for a minor portion of the value of cash in the nation's payments system. See pp. 5,13-14, table 3.13 on p. 27, and pp. 48-49 for other information on currency and coin.
able to inspect the notes processed by these machines, which performed a sim-ple count of a stack of notes, typically 100 at a time. As a result, the quality of notes in circulation fell and the detection of counterfeits suffered. Marginally more advanced machines were introduced over the years, but currency processing re-mained labor-intensive, the ability to cull notes remained low, and the volume of notes in circulation continued to expand.
In 1977 the Federal Reserve intro-duced a technologically far more ad-vanced generation of equipment called Currency Verification, Counting, and Sorting (CVCS) machines. CVCS ma-chines can process up to 60 thousand notes per hour and are equipped with sensors that detect the denomination, quality, and authenticity of each note. Today, the 37 Federal Reserve Banks and Branches operate 116 CVCS machines.
In the face of rising demand for cur-rency, the Federal Reserve increased productivity through more intensive use of the CVCS machines and through improvements in the machines them-selves. For example, the Banks' manag-ers and processing staff developed more efficient processing teams, reduced idle time, and added shifts. Also, the Banks installed new sensors on the machines during 1982 and 1983 to better detect worn bills; use of the machines slowed during the installation, but by 1984, output per person was 13 percent above the level for 1981. Thanks to such efforts, the number of notes processed by each employee has grown 43 percent between 1979 and 1988, from about 13 million to more than 19 million. As a result, since 1979 the Banks have held the increase in the staffing level for currency processing
Digitized for FRASER http://fraser.stlouisfed.org/ Federal Reserve Bank of St. Louis

32 The Automated Currency Processing System
to 38 percent, while the volume of notes processed has increased 98 percent (chart 4.1).
The New Automated Currency Processing System The CVCS machines are reaching the limits of their efficiency and of their useful life. At the same time, the Banks expect the economy's need for processed currency to continue growing, to more than 34 billion pieces by the year 2000. In 1982 the Federal Reserve engaged sev-eral domestic and foreign vendors to begin developing a new generation of equipment. In November 1987 the Board of Governors approved the machines developed by Recognition Equipment, Inc, of Irving, Texas, and authorized $40 million for their purchase. The first units will be delivered in mid-1990.
The new equipment, called the Auto-mated Currency Processing System (ACPS), is the next step in the technolog-ical evolution of currency processing in the Federal Reserve System. Among the advantages of the new machines will be a
Table 4.1 Currency Processed and Paid into Circulation by the Reserve Banks, 1979-88 Billions
Year Notes received from circulation and processed (pieces)1
Notes paid into circulation 2
Year Notes received from circulation and processed (pieces)1
Pieces Dollars (face value)
1979 .. 8.9 10.2 109.1 1980 .. 9.5 1 1 . 0 124.6
1981 .. 10.3 11.8 137.5 1982 .. 10.6 12.1 146.1 1983 .. 11.5 13.1 161.5 1984 .. 13.4 14.4 181.4 1985 .. 14.6 15.4 199.7
1986 .. 15.4 16.4 216.1 1987 .. 16.9 17.7 233.8 19883. 17.6 18.3 243.3
1. Excludes new currency. 2. Includes new currency. 3. Estimate.
20 percent increase in output and a 40 percent reduction in labor costs. In addition, the ACPS machines will be more accurate, provide better security, and destroy unfit notes more thoroughly to make disposal easier. The purchase is thus a major step in the continuing effort by the Federal Reserve to minimize the cost of providing the public with high-quality currency.
1. For 1988, estimate. 2. Billions of pieces. 3. Average number of personel; for definition of ANP,
see chap. 3, note 1.
Chart 4.1 Trends in Currency Processing1
1979 = 100
Digitized for FRASER http://fraser.stlouisfed.org/ Federal Reserve Bank of St. Louis
Appendixes
Digitized for FRASER http://fraser.stlouisfed.org/ Federal Reserve Bank of St. Louis
35
Appendix A
Mission and Operational Areas of the Federal Reserve System
The Federal Reserve Banks and the Board of Governors have established four major operational areas to account for their activities: monetary and economic pol-icy, supervision and regulation of finan-cial institutions, services to financial institutions and the public, and services to the U.S. Treasury and other govern-ment agencies.1 This appendix describes each of these areas in detail.
Monetary and Economic Policy The Federal Reserve contributes to the attainment of the nation's economic and financial goals through its ability to influence money and credit in the econ-omy. The System has several tools to affect the availability and cost of the nation's money and credit: setting of reserve requirements; setting of the discount rate (which affects the cost of borrowing); and the primary tool of monetary policy, open market opera-tions.
The seven-member Board of Gover-nors sets reserve requirements, and it acts on requests from the Federal Reserve Banks to adjust the discount rate. The Federal Open Market Committee (FOMC) meets in Washington eight times per year, usually twice each business quarter, to set policies for System open market operations; it comprises the
1. Services to the U.S. Treasury and other government agencies is an operational area unique to the Federal Reserve Banks. The fourth opera-tional area for the Board of Governors, System policy direction and oversight, provides resources for the supervision of Board and Bank programs and is discussed in chap. 2.
Board, the President of the Federal Reserve Bank of New York, and, on a rotating basis, the presidents of four other Reserve Banks.
A vast amount of banking and financial data flows through the Reserve Banks to the Board, where it is compiled and made available to the public in weekly and monthly statistical releases in such areas as the monetary aggregates, interest rates, bank credit, and exchange rates. The research staffs at the Board and the Reserve Banks use this information, along with data collected by other public and private institutions, to assess the state of the economy and the relationships between the financial markets and eco-nomic activity. Staff members provide background for the Board and for each meeting of the FOMC by preparing detailed economic and financial analyses and projections for the domestic econ-omy and international markets. In addi-tion, they conduct longer-run economic studies of issues at the regional, national, and international levels.
Supervision and Regulation Under the authority of the Federal Re-serve Act and the Bank Holding Com-pany Act, the Federal Reserve System plays a major role in the supervision and regulation of banks and bank holding companies. Under the Bank Holding Company Act, the Board is responsible for assuring that all activities of bank holding companies are "closely related to banking and a proper incident thereto." The Board of Governors adopts regula-tions to carry out statutory directives and
Digitized for FRASER http://fraser.stlouisfed.org/ Federal Reserve Bank of St. Louis
36 Mission and Operational Areas
establishes System supervisory and reg-ulatory policies; the Reserve Banks con-duct on-site examinations and inspections of state member banks and bank holding companies; review applications for mergers, acquisitions, and changes in control from banks and bank holding companies; and take formal supervisory actions. The System makes available to the public nonidentifying information it periodically collects on the condition and income of banks and bank holding companies.
Beyond these activities, the Federal Reserve maintains continuous oversight of the banking industry to ensure the overall safety and soundness of the financial system. This broader responsi-bility is reflected in the System's presence in financial markets, through open mar-ket operations, and in the Federal Reser-ve's role as lender of last resort. Toward that goal, the Federal Reserve, together with the Office of the Comptroller of the Currency and the Federal Deposit Insur-ance Corporation, in March 1988 intro-duced to the G-10 countries a proposal regarding capital requirements that em-ploys the risk-based framework devel-oped by the Basle Supervisors' Commit-tee. The principal objective of the proposal is to achieve greater conver-gence in the measurement and assessment of capital positions of major international banking organizations.
The Board's staff believes that adoption of risk-based capital requirements will achieve important objectives long sought by the Federal Reserve. First, it will make regulatory capital requirements more sensitive to differences in risk profiles among banking organizations. Second, it will take an important step in the factoring of off-balance-sheet risks into the assessment of capital adequacy. Third, it will minimize disincentives to holding liquid, low-risk assets.
The development of a risk-based frame-work in conjunction with supervisory officials from other industrial countries acknowledges the growing international-ization of major banking and financial markets. The harmonization and strength-ening of capital standards worldwide should contribute to a more stable and resilient international banking system and help mitigate a source of competitive inequality for international banks stem-ming from differences in national super-visory requirements.
Over the past two years, the System has intensified its supervision of state member banks and bank holding com-panies in light of the rising number of failing and problem banks. In 1988 the Board and the Banks conducted 875 examinations of state member banks, an increase of 4.8 percent over 1987, and 2,726 inspections of bank holding com-panies and their subsidiaries, an increase of 3.5 percent over 1987. The System re-viewed 2,247 applications from foreign and domestic bank holding companies.
The Board enforces compliance by state member banks with the federal laws protecting consumers in their use of credit. In 1988 the System conducted examinations for such compliance at an estimated 605 banks.
The Board's supervisory responsibili-ties also extend to foreign operations of U.S. banks and, under the International Banking Act, to U.S. operations of for-eign banks.
Services to Financial Institutions and the Public The Federal Reserve System plays a central role in the nation's payments mechanism, which consists of many independent systems designed to move funds among financial institutions. The Federal Reserve distributes currency and
Digitized for FRASER http://fraser.stlouisfed.org/ Federal Reserve Bank of St. Louis

37 Mission and Operational Areas
coin, processes checks for collection, operates electronic funds transfer net-works, and provides for transfers of securities and for coupon collection.
Ensuring that the supply of currency and coin meets the public's demand for cash is the responsibility of the Federal Reserve. The Reserve Banks obtain cur-rency and coin from the Bureau of En-graving and Printing and the Mint and distribute them through depository insti-tutions. The Banks use highly sophisti-cated equipment to count cash, identify counterfeits, and destroy currency that is unfit for circulation. In 1988, the Reserve Banks paid out $243.3 billion in currency and $4.5 billion in coin and destroyed $53.9 billion of unfit currency.
The Reserve Banks collect and clear checks under the specific authority of the Federal Reserve Act of 1913. The Banks, Branches, and regional check-processing centers currently clear approximately 15 billion checks each year with an average daily value of more than $41 billion. Most checks deposited with the Federal Reserve by financial institutions are collected on the day they are deposited or on the next business day.
In 1987 the Congress adopted the Expedited Funds Availability Act (title VI of Public Law 100-86, the Competi-tive Equality Banking Act). The law, which became effective on September 1, 1988, is intended to balance the risk to financial institutions with the needs of customers by limiting the time an institu-tion may delay the access of customers to their deposited funds. To implement the act, the Federal Reserve adopted Regula-tion CC, which sets out schedules of access to different types of deposits in various types of accounts.
The Federal Reserve also plays a central role in the nation's payments mechanism through its electronic wire transfer system, Fedwire. Depository
institutions can draw on their reserves or clearing accounts at the Reserve Banks through Fedwire and transfer funds any-where in the country within minutes. Approximately 5,800 depository institu-tions use Fedwire through direct com-puter connections with Federal Reserve Banks, and another 5,400 institutions use Fedwire through off-line means such as telephone and telex. During 1988, ap-proximately 56 million transfers valued at about $160 trillion were sent over Fedwire, an average of $29 million per transfer and $639 billion per day.
The Federal Reserve allows partici-pants in private clearing arrangements to exchange and settle transactions on a net basis through reserve or clearing-account balances. Users of this net settlement service include local check clearinghouse associations, credit card processors, networks of automated teller machines, and national and regional funds transfer networks. In 1988, about 695,000 net settlement entries were processed by the Reserve Banks.
Approximately 22,000 depository in-stitutions use the automated clearing-house, which makes recurring payments electronically instead of by check. The institutions use the ACH primarily to pay salaries and pensions and to make preau-thorized bill payments, such as those for insurance premiums and mortgages. About 3,700 of the institutions using the ACH originate and receive transactions via electronic connections with the Fed-eral Reserve; the others use machine-readable magnetic tapes. In 1988 the Reserve Banks processed about 1 billion ACH transactions; about 40 percent were governmental, largely disbursements of Social Security benefits and civilian and military pay.
The securities services provided by the Reserve Banks cover the handling of book-entry securities and definitive secu-
Digitized for FRASER http://fraser.stlouisfed.org/ Federal Reserve Bank of St. Louis

38 Mission and Operational Areas
rities and the collection of coupons and miscellaneous items. The book-entry service, begun in 1968, enables holders of government agency securities to trans-fer them to other institutions throughout the country. The Reserve Banks main-tained 40,117 book-entry accounts in 1988 and processed 10.3 million security transfers.
In the definitive securities service, the Banks store physical securities ineligible for maintenance on the book-entry sys-tem. The Federal Reserve held approxi-mately $25 billion of such securities at the end of 1988.
In its noncash collection service, the Federal Reserve processes coupons, bonds, and miscellaneous items such as bankers acceptances and certain checks and drafts. Coupon collection, which accounts for approximately 95 percent of the transactions in this service, amounted to about 4.2 million coupons in 1987 and about 3.3 million in 1988.
The Reserve Banks assist the Treasury in its financing of the public debt by issuing, servicing, and redeeming all marketable Treasury securities as well as all Treasury savings bonds and retirement plan bonds. In another unique fiscal service, the Reserve Banks redeem food coupons for the Department of Agriculture and de-stroy them. •
Services to the U.S. Treasury and Other Government Agencies The U.S. government uses the Federal Reserve as its bank. Through deposit accounts at the Federal Reserve Banks, the government issues its checks and payments and collects its receipts. The Reserve Banks also process wire trans-fers of funds and automated clearing-house payments and give the Treasury daily statements of account activity.
Beyond these typical depository activ-ities, the Federal Reserve Banks provide several unique services to the govern-ment. They monitor the tax receipts deposited in the 14,883 tax and loan accounts maintained by depository insti-tutions designated by the Treasury to perform this function; and they hold the collateral that those institutions pledge to support those deposits and transfer funds to the Treasury's account at its request.
Digitized for FRASER http://fraser.stlouisfed.org/ Federal Reserve Bank of St. Louis
39
Appendix B
Budget Processes
As a group, the Reserve Banks follow a budgeting process distinct from that of the Board of Governors. This appendix describes those processes and explains PACS, the planning and control system that the Banks use for accounting.
The Budget and Control Process of the Board of Governors All levels of management at the Board take part in a planning, budget, and control process based on the calendar year. To ensure that all elements are coordinated and objectives are achieved, the Administrative Governor oversees the process under authority delegated by the Chairman.
The Board places expenses and em-ployment in four operational areas: eco-nomic and monetary policy, supervision and regulation of financial institutions, services to financial institutions and the public, and System policy direction and oversight. Costs for data processing are charged as direct expenses to the four major areas according to usage. Expenses for other elements of support and over-head are allocated to the four areas in proportion to the shares of direct costs attributable to each area.
The Budget Schedule
Early each year, the divisions at the Board conduct strategic planning meetings. In May, the Board's functional oversight committees review, for the divisions under their purview, the plans for the following year and beyond. The Board's Controller and Staff Director for Manage-ment coordinate the oversight meetings and the Controller simultaneously pre-
pares a budget estimate based on the current level of operation, taking into account anticipated initiatives discussed at the meetings and other factors such as wage increases, changes in costs of employee benefits, and inflation.
Using this projection of expenses, the Controller prepares a proposed guideline for approval of the Board in June. The approved guideline is then used by the divisions for preparation of their budget proposals in the fall.
The objectives and budgets prepared by the divisions are reviewed with the Controller, the Staff Director for Manage-ment, and the oversight committees. After appropriate adjustments, the Con-troller in coordination with the Staff Director for Management prepares a consolidated budget for the Administra-tive Governor to present to the Board for final approval at a public meeting in December.
Treatment of Capital Expenditures In 1985 the Board began capitalizing certain assets and depreciating their value over appropriate time periods, instead of expensing them in their year of purchase. Capitalizing, which is in accordance with generally accepted accounting princi-ples, more closely aligns the cost of capital assets with their periods of service and is consistent with the accounting practices followed by the Reserve Banks.
The capital budget is developed con-currently with the operating budget, following the same procedures. Although the capital budget is not covered by the guideline for the operating budget, depre-ciation and other costs such as main-tenance that are associated with capital
Digitized for FRASER http://fraser.stlouisfed.org/ Federal Reserve Bank of St. Louis
40 Budget Processes
assets fall under the guideline because they are operating costs.
Financial Monitoring and Control Each division constructs quarterly oper-ating plans, which managers monitor and review throughout the year. The Control-ler observes performance against bud-geted targets and submits quarterly re-ports to the Board.
After a midyear review of current expenses with each division director, the Controller and the Staff Director for Management estimate expenses for the entire year and submit the estimate to the Board along with any recommendations for reallocations. The midyear review helps control current expenses and pro-vides a baseline for analyzing budget requests. At the beginning of the next year, the Controller and the Staff Director for Management report to the Board on the previous year's performance against budget and operating goals.
Assessments The cash requirement for operations during the first half of the year, which is estimated after the Board adopts its budget, is approved by the Administra-tive Governor in early January. As the Federal Reserve Act provides, the re-quired amount is raised by an assessment on each of the Reserve Banks in propor-tion to its capital stock and surplus. For the second half of the year, the cash requirement is estimated in June, and the second assessment is made in July. Funds are transferred quarterly to minimize cash balances held by the Board.
The Budget and Control Process of the Federal Reserve Banks Each year the Federal Reserve Banks, like the Board, establish major operat-
ing goals for the calendar year, devise strategies for their attainment, estimate required resources, and monitor results of current operations and financial performance.
The Budget Process A task force drawn from staff members of the Board and the Reserve Banks develops a proposed budget guideline for the coming year based on forecasts of changes in workload and productivity at the Reserve Banks. The Conference of First Vice Presidents and the Conference of Presidents of the Reserve Banks review the work of the task force, and revise it if necessary, before sending it to the Board of Governors. The Board determines the appropriateness of the proposed level of spending and at about midyear communi-cates the budget objective to the Reserve Banks for their guidance in developing plans and budgets. To plan for priced services, the Banks update a multiyear strategic statement.
The management of each Bank depart-ment develops its budget based on work-loads, required initiatives, and the budget objective. Senior Bank officials review the departmental requests and together with the President and First Vice Presi-dent determine priorities for the overall budget level to be recommended to the Bank's Board of Directors. In the fall the Board of Governors approves the budget of each Reserve Bank as well as the fee schedule for priced services, which is developed simultaneously with the bud-get data.
The Capital Budget Process The Reserve Banks account for capital expenditures in accordance with gener-ally accepted accounting principles and, therefore, include depreciation of capital assets in expenses. Technical staff mem-
Digitized for FRASER http://fraser.stlouisfed.org/ Federal Reserve Bank of St. Louis

41 Budget Processes
bers at the Board review all plans for large capital expenditures, whether for buildings, automation equipment, fur-nishings, or land. The staff members then make recommendations to the Director of the Division of Federal Reserve Bank Operations or to the Board of Governors, depending on the significance of the item or project.
Review at the Board of Governors In the fall, analysts at the Board review the budgets of each Reserve Bank and note Systemwide issues to be addressed during the budget review. They analyze the executive summary and the statement of objectives in each budget in light of the Bank's own trends, plans at the other Banks, the System budget objective and the cost-recovery objectives for priced services. The Product Directors and the Pricing Policy Committee examine the budgets for priced services.1 A commit-tee of three governors reviews the budget of each Reserve Bank and meets directly with the President and First Vice Presi-dent of each Bank to discuss issues and directions.
Board Approval Following review by the Committee of three governors, all Bank budgets are sent to the Board of Governors for action at a public meeting in December.
Special Projects Special projects are those few research and development efforts that have the
1. The Product Directors are the First Vice Presidents at selected Reserve Banks with respon-sibility for day-to-day policy guidance over specific Systemwide priced services. The Pricing Policy Committee comprises one Governor, the Board's Staff Director for Federal Reserve Bank Activities, the Presidents of two Reserve Banks, and the First Vice Presidents of two other Reserve Banks.
potential for a major improvement in the nation's payments mechanism or in the Federal Reserve's ability to provide ser-vices . Because of their long-range impor-tance, special projects are approved separately from the process described above, which focuses on operational costs. Although not included in the budget objective, these projects are indi-vidually approved by the Conference of Presidents and the Board of Governors, and their effect on total system outlays is carefully reviewed. Three such projects, described in appendix C, have been approved for 1989.
The Planning and Control System The Planning and Control System (PACS), implemented by the Reserve Banks in 1977, serves as the fundamental cost accounting system for all the ser-vices provided by the Banks, whether priced or nonpriced, special or routine. Because PACS serves as the structure for budgeting, budgets can be compared to actual expenses by service and object. PACS also enables the Board of Gover-nors to compare the financial and operat-ing performance of the Reserve Banks.
PACS groups all costs by major ser-vices, shown here under the four opera-tional areas and under support and over-head (see the accompanying list). The costs of support and overhead, in turn, are fully allocated to the four operational areas. PACS offers a detailed analysis of all these services and activities, including productivity statistics (primarily unit costs and items per employee hour), "environmental" statistics (to clarify the differences among the Banks' operating environments), and "quality" statistics (to measure performance).
PACS affords the Banks a review of expenses, an audit trail, and expense accountability. Through periodic on-site reviews, the Board confirms that the
Digitized for FRASER http://fraser.stlouisfed.org/ Federal Reserve Bank of St. Louis

42 Budget Processes
Reserve Banks are complying with PACS instructions and also with System guide-lines set by the Board. In addition, the General Accounting Office and an outside
public accounting firm have determined in independent examinations that PACS is an appropriate and effective accounting mechanism for the Federal Reserve.
Federal Reserve Bank Activities
OPERATIONAL AREAS
Monetary and economic policy Economic policy determination Open market trading
Supervision and regulation Supervision of District financial institutions Administration of laws and regulations
related to banking Studies of banking and financial market structure
Services to financial institutions and the public Special cash service Currency Coin Transfer of account balances Automated clearinghouse Commercial check Other check Book-entry securities Definitive securities Loans to depository institutions and others Noncash collection Public programs Other
Services to the U. S. Treasury and other government agencies
Savings bonds Other Treasury issues Centrally provided Treasury and agency services Government agency issues Other Treasury and government agency services Treasury and government coupons Food coupons Government accounts
SUPPORT AND OVERHEAD
Support Data processing Centrally provided support Occupancy service Printing and supplies Centralized planning District projects
Overhead Administration System projects and contingency processing center Special projects Mail Legal General books and budget and expense control Files and records storage Personnel Purchasing Protection Motor vehicles Library Telephone Audit
Digitized for FRASER http://fraser.stlouisfed.org/ Federal Reserve Bank of St. Louis

43
Appendix C
Special Categories of System Expense
This appendix discusses System expenses for priced services, capital assets, special projects, and currency.
Priced Services The Monetary Control Act of 1980 (MCA) requires the Federal Reserve to make available to all depository institu-tions, for a fee, certain services that the Federal Reserve had previously provided without explicit charge and only to mem-ber banks. Under the act, the fees must recover the full costs of providing the services, including all direct and indirect costs, the interest on items credited before collection (float), and the return on capital and the taxes that would have been paid had the services been furnished by a private business firm. The cost of capital and taxes is referred to as the private sector adjustment factor (PSAF).
The Federal Reserve has developed an annual pricing process, which involves a review of Reserve Bank expenses in addition to the one required by the budget process, to meet the requirements for the full recovery of costs. Use of the budgets is an integral part of the pricing exercise because most of the recoverable costs of priced services consist of direct and indirect costs as determined by the budgets.
Generally, fees are set only once a year, in the fourth quarter for the next calendar year, so that depository institu-tions can more easily plan their own correspondent banking services. The Federal Reserve temporarily deviated from this schedule in June 1988, when it announced explicit fees for check collec-tion return items to be effective in Sep-tember. These new fees are part of the
Board's implementation of the Expedited Funds Availability Act. The Federal Reserve anticipates resuming its normal schedule, announcing prices for 1990 in the fourth quarter of 1989.
Fees for Federal Reserve services must be approved by the Product Director for the respective service, by the Pricing Policy Committee, and ultimately by the Board of Governors.1 If fees for any service are set so that the full recovery of costs is not anticipated, the Board an-nounces the rationale.
The cost of float is determined by applying the current rate for federal funds to the level of float expected in the coming year. Income taxes and the return on capital are determined by applying tax and financing rates to the assets the Fed-eral Reserve expects to use in its priced services operations in the coming year. The tax and financing rates are derived from a model of the nation's 25 largest bank holding companies. The other com-ponents of the PSAF are derived from the budgets of the Reserve Banks: the im-puted sales tax (based on budgeted out-lays for materials, supplies, and capital assets); the assessment for FDIC insur-ance on expected clearing balances main-tained with the Federal Reserve to settle transactions; and the portion of the expenses of the Board of Governors that is related directly to the development of priced services.
The inclusion of all these costs means the Federal Reserve offers its priced ser-vices on a basis comparable with that in the private sector, and the discipline of
1. See appendix B, note 1, for a description of the position of Product Director and of the Pricing Policy Committee.
Digitized for FRASER http://fraser.stlouisfed.org/ Federal Reserve Bank of St. Louis

44 Special Categories of System Expense
the market ensures that the prices charged will be no higher than necessary.
Calculation of the PSAF for 1989 In 1988 the Board approved a 1989 private sector adjustment factor of $69.7 million, a decrease of $6.5 million, or 8.5 percent, from the PSAF of $76.2 million targeted for 1988.
Asset Base The estimated value of Federal Reserve assets to be used in providing priced
services in 1989 is $3,240.3 million (table C.l). The value of assets assumed to be financed through debt and equity is $445.2 million in 1989, an increase of $28.0 million, or 6.7 percent, from 1988 (table C.2). The rise is attributable largely to capital expenditures for bank premises, furniture, and equipment.2
2. Short-term assets are assumed to be financed by short-term liabilities; long-term assets are assumed to be financed by a combination of equity and long-term debt.
Table C.l Pro Forma Balance Sheet for Federal Reserve Priced Services, 1988-891
Millions of dollars
Asset or liability 1988 1989
ASSETS
Short-term assets Imputed reserve requirement on clearing balances Investment in marketable securities Receivables2
Materials and supplies2
Prepaid expenses2
Net items in process of collection (float) Total short-term assets
268.2 1,967.0
28.0 6.4 5.8
438.3
Long-term assets Premises23
Furniture and equipment2 . Capital leases Leasehold improvements2.
Total long-term assets.
245.4 129.5
2.5 2.2
2,713.7
379.6
283.3 2,077.9
29.6 7.1 6.2
432.8
259.9 137.9
1 . 1 4.7
2,836.8
403.6
Total assets
LIABILITIES Short-term liabilities Clearing balances Balance arising from early credit
of uncollected items Short-term debt4
Total short-term liabilities
Long-term liabilities Obligations under capital leases Long-term debt4
Total long-term liabilities
Total liabilities
Equity4
Total liabilities and equity
1. Data are averages for the year. 2. Financed through the private sector adjustment
factor; other assets are self-financing. 3. Includes $0.4 million in allocations of assets of the
3,093.3 3,240.3
2,235.2 2,361.2
438.3 432.8 40.1 42.8
2,713.6 2,836.8
2.5 1.1 136.4 156.8
138.9 158.0
2,852.5 2,994.7
240.7 245.6
3,093.2 3,240.3
Board of Governors to priced services for 1989 and $0.5 million for 1988.
4. Imputed figures representing the source of financing for certain priced-service assets.
Digitized for FRASER http://fraser.stlouisfed.org/ Federal Reserve Bank of St. Louis

45 Special Categories of System Expense
Cost of Capital and Taxes In 1987 the Board approved the use of a three-year average of rates of return on equity for calculating the PSAF. Because of abnormally low earnings by bank holding companies in 1987, however, the Board approved the use of five-year average rates of return on equity for use in the 1989 PSAF computation. Use of a three-year average for 1989 would
have resulted in a PSAF that is signifi-cantly below the PSAF approved by the Board.
Changes in the relative sizes of bank holding companies have changed some-what the composition of the 25-company sample used to calculate the PSAF. As in the past, the sampled bank holding com-panies with the highest and lowest rates of return on equity before taxes were
Table C. 2 Derivation of the Private Sector Adjustment Factor, 1988-89 Millions of dollars, except as noted
Item 1988 1989
Assets to be financed1
Short-term Long-term2
Total
P S A F COMPONENTS
Cost of capital (percent)3
Short-term debt Long-term debt Pretax return on equity4
Weighted average ..
Capital structure (percent) Short-term debt Long-term debt Equity
Total
Tax rate (percent)4 .
Capital costs5
Short-term debt Long-term debt Equity
Total
REQUIRED P S A F RECOVERIES
Other costs Sales taxes Assessment for federal deposit insurance. Expenses of Board of Governors
Total
Total PSAF recoveries Millions of dollars As a percent of capital... As a percent of expenses.
40.1 377.1 417.2
7.1 9.7
20.1 15.4
9.6 32.7 57.7
100.0
32.3
2.8 13.3 48.3 64.4
8.2 1.9 1.7
11.8
76.2 18.3 16.3
42.8 402.4 445.2
6.6 9.0
16.9 13.8
9.6 35.2 55.2
100.0
20.5
2.8 14.0 41.4 58.3
8.0 1.9 1.4
11.4
69.7 15.7 13.8
1. The asset base for priced services is directly determined.
2. Total long-term assets less capital leases that are self-financing.
3. All short-term assets are assumed to be financed by short-term debt. Of the total long-term assets, 39 percent are assumed to be financed by long-term debt and 61 percent by equity in 1989. The data are average rates paid by the bank holding companies included in the sample.
4. The pretax rate of return on equity is based on average after-tax rates of return on equity for the sample of bank holding companies, adjusted by the effective tax rate. The 1989 figures for pretax equity and the tax rate are based on the average of these rates for the five years 1983-87.
5. The calculations underlying these data use the dollar value of assets to be financed, divided as described in note 3, and the rates for the cost of capital.
Digitized for FRASER http://fraser.stlouisfed.org/ Federal Reserve Bank of St. Louis

46 Special Categories of System Expense
excluded, and calculations were based on the remaining 23 firms.
Other Imputed Costs Other required PSAF recoveries for 1989—imputed sales taxes, FDIC insur-ance, and Board expenses—total $11.4 million, down $0.4 million from 1988 (table C.2). The reduction is due to a decline from 1988 to 1989 in projected capital expenditures, which in turn low-ered imputed sales taxes. The decline is also attributable to a reduction in the proportion of time Board staff members work on the development of priced ser-vices as the proportion of time spent on implementing the Expedited Funds Avail-ability Act increases.
Capital Outlays
In accordance with generally accepted accounting principles (GAAP), the Fed-eral Reserve System depreciates the cost of fixed assets over their estimated useful lives. In the federal government, where no requirement exists for depreciation accounting, the cost of fixed assets is typically recorded as an expense at the time of purchase. However, the Policy and Procedures Manual for Guidance of Federal Agencies of the General Account-ing Office, which governs accounting procedures in the federal government, specifies in title 2 the use of depreciation accounting for business types of opera-tions and for activities that recover costs from reimbursements or user charges. Certain activities of the Federal Reserve meet both of these criteria. Under GAAP, the cost of acquiring an asset that is expected to benefit an entity over future periods should be allocated over those periods. Such treatment allows a more realistic measurement of operating per-formance.
The Banks capitalize and depreciate all assets that cost $1,500 or more; they can
either capitalize or expense those assets costing less. The capitalization guideline for the Board is $1,000.
The Banks maintain a multiyear plan for capital spending. The Board, in turn, requires the Banks to budget annually for capital outlays by capital class to estimate the effect of total operating and capital spending. During the budget year, the Banks must submit proposed major pur-chases of assets to the Board for further review and approval. The Board of Governors reviews capital expenditures for the Board.
Table C.3 shows total System outlays for recent years based on the federal government's typical practice of expens-ing assets. Total outlays for each year are derived from operating expenses less depreciation costs plus capital outlays. Because capital outlays are thus shown in total in the year of purchase rather than spread over the useful lives of the assets, the amounts and percent changes vary widely from year to year.
Special Projects For 1989 the Board of Governors has approved research and development on three projects intended to provide long-range benefits to the Federal Reserve and the banking industry. Because the spend-ing on such projects is relatively high and short-term, the Federal Reserve accounts for it separately from its operating expenses.
Digital Imaging of Checks In mid-1985 the Conference of First Vice Presidents approved the concept of test-ing the technology for making digital images as it might be applied to check processing. The archiving of information on checks written by the U.S. Treasury and the processing of bad checks (return items) are the potential applications with
Digitized for FRASER http://fraser.stlouisfed.org/ Federal Reserve Bank of St. Louis
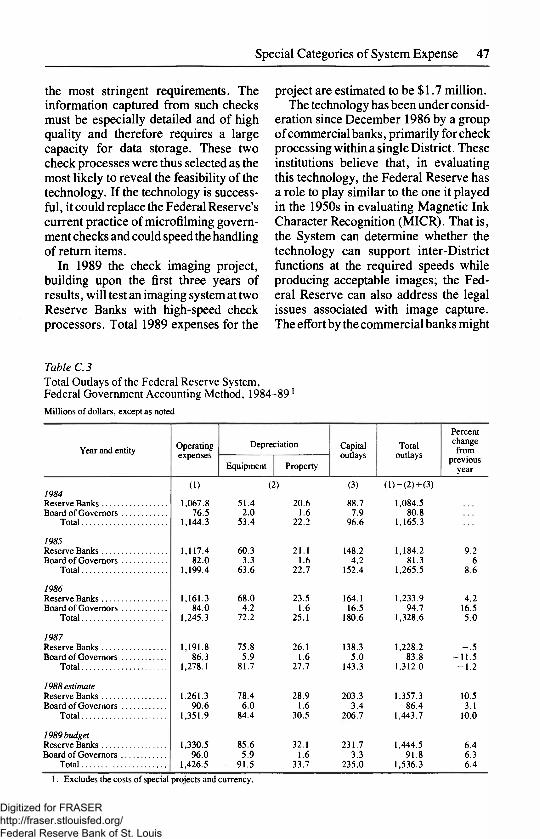
Special Categories of System Expense 47
the most stringent requirements. The information captured from such checks must be especially detailed and of high quality and therefore requires a large capacity for data storage. These two check processes were thus selected as the most likely to reveal the feasibility of the technology. If the technology is success-ful, it could replace the Federal Reserve's current practice of microfilming govern-ment checks and could speed the handling of return items.
In 1989 the check imaging project, building upon the first three years of results, will test an imaging system at two Reserve Banks with high-speed check processors. Total 1989 expenses for the
Table C. 3 Total Outlays of the Federal Reserve System, Federal Government Accounting Method, 1984-891
Millions of dollars, except as noted
Year and entity Operating expenses
Depreciation Capital outlays
Total outlays
Percent change from
previous year
Year and entity Operating expenses
Equipment Property
Capital outlays
Total outlays
Percent change from
previous year
(1) (2) (3) ( l ) - ( 2 ) + (3) 1984 Reserve Banks 1,067.8 51.4 20.6 88.7 1,084.5 Board of Governors 76.5 2.0 1.6 7.9 80.8
Total 1,144.3 53.4 22.2 96.6 1,165.3
1985 Reserve Banks 1,117.4 60.3 21.1 148.2 1,184.2 9.2 Board of Governors 82.0 3.3 1.6 4.2 81.3 .6
Total 1,199.4 63.6 22.7 152.4 1,265.5 8.6
1986 Reserve Banks 1,161.3 68.0 23.5 164.1 1,233.9 4.2 Board of Governors 84.0 4.2 1.6 16.5 94.7 16.5
Total 1,245.3 72.2 25.1 180.6 1,328.6 5.0
1987 Reserve Banks 1,191.8 75.8 26.1 138.3 1,228.2 - . 5 Board of Governors 86.3 5.9 1.6 5.0 83.8 -11 .5
Total 1,278.1 81.7 27.7 143.3 1,312.0 - 1 . 2
1988 estimate Reserve Banks 1,261.3 78.4 28.9 203.3 1,357.3 10.5 Board of Governors 90.6 6.0 1.6 3.4 86.4 3.1
Total 1,351.9 84.4 30.5 206.7 1,443.7 10.0
1989 budget Reserve Banks 1,330.5 85.6 32.1 231.7 1,444.5 6.4 Board of Governors 96.0 5.9 1.6 3.3 91.8 6.3
Total 1,426.5 91.5 33.7 235.0 1,536.3 6.4
1. Excludes the costs of special projects and currency.
project are estimated to be $1.7 million. The technology has been under consid-
eration since December 1986 by a group of commercial banks, primarily for check processing within a single District. These institutions believe that, in evaluating this technology, the Federal Reserve has a role to play similar to the one it played in the 1950s in evaluating Magnetic Ink Character Recognition (MICR). That is, the System can determine whether the technology can support inter-District functions at the required speeds while producing acceptable images; the Fed-eral Reserve can also address the legal issues associated with image capture. The effort by the commercial banks might
Digitized for FRASER http://fraser.stlouisfed.org/ Federal Reserve Bank of St. Louis

48 Special Categories of System Expense
not have developed without the involve-ment of the Federal Reserve.
Optical Detection of Counterfeit Currency The Federal Reserve is using the tech-nology of digital image processing discussed above to develop optical sen-sors that can detect counterfeit U.S. currency. The sensors would be inte-grated into the new generation of auto-mated currency processing machines to be used at the Reserve Banks (see chapter 4).
In 1989, selected vendors will develop a prototype system to be tested against prescribed performance standards. The Federal Reserve, which will share with the vendors the cost of development, has budgeted $3.3 million for the project in 1989.
Processing Electronic Payments A study by the Federal Reserve has indicated that, to meet the needs of users, the System must extend the number of hours it provides electronic payments services and that to better control risk in the payments system, it must improve the reliability of these services. The study also indicated that users of electronic payments are looking for more flexibility in the range of services offered as well as cost-effectiveness.
In 1989 the Federal Reserve will complete its testing of equipment to satisfy these requirements. The pilot program, known as the Electronic Pay-ments Processor, uses nonstop, fault-tolerant equipment of the type used in networks of automatic teller machines and in payments processing at commer-cial banks.
The Federal Reserve is installing the equipment at three Reserve Banks and developing software for the automated
clearinghouse service. The program, budgeted at $6.1 million for 1989, will also demonstrate the use of fault-tolerant equipment for the transfer of funds and securities.
Currency Printing The Bureau of Engraving and Printing produces currency; the Federal Reserve Banks put it into circulation through depository institutions and destroy it as it wears out (table C.4). The Federal Re-serve Act stipulates that the costs of producing currency, as well as the costs of putting it into circulation and destroy-ing it, are to be assumed by the Federal Reserve System (table C.5).
New currency is printed to replace worn notes and to accommodate in-creases in the demand for circulating currency. Notes are also required for inventories held by the Reserve Banks to meet changes in demand.
To minimize the number of new notes ordered and the cost of their printing, the Board consults with the Bureau of En-graving and Printing to ensure that it uses efficient methods and maintains
Table C.4 Currency in Circulation, New Notes Issued, and Notes Destroyed, 1988 Estimate Millions of pieces
Dollar denomination
Notes in
circulation1
New notes paid out2
Notes destroyed2
1 4,304 3,320 2,857 5 1,077 906 770
10 1,169 832 777 20 3,016 1,544 1,345 50 578 158 84
100 1,061 198 73
Total 11,024 6,958 5,906
1. As of July. 2. Based on actual levels through the third quarter and
expected levels for the fourth quarter. Notes paid out do not include additions to inventory at the Reserve Banks.
Digitized for FRASER http://fraser.stlouisfed.org/ Federal Reserve Bank of St. Louis

49 Special Categories of System Expense
System guidelines on the quality of notes; and the Banks monitor all related costs, the Board also sees that Reserve Banks do such as those for transportation and not destroy notes prematurely. The Board packaging.
Table C. 5 Costs to the Federal Reserve of New Currency, 1987-89 Millions of dollars, except as noted
Item 1987 actual
1988 estimate
1989 budget
Percent change, 1988-89
Printing1 164.2 158.0 164.5 4.1 Shipping from Washington2 4.3 4.8 4.8 - 2 . 1 Reimbursement to the Treasury
for issuance and retirement 1.6 1.6 1.6 0 System-Treasury programs to deter counterfeiting .6 0 0 0
Total costs of currency 170.7 164.5 171.0 3.9
1. Based on 6.6billion notes in 1987,6.0 billion notes in 2. Includes purchase of seals and labels for Bureau of 1988, and 6.3 billion notes in 1989. Engraving and Printing.
Digitized for FRASER http://fraser.stlouisfed.org/ Federal Reserve Bank of St. Louis

51
Appendix D
Sources and Uses of Funds
The Federal Reserve System follows generally accepted accounting principles in accruing income and expenses and in capitalizing assets whose useful lives extend over several years (see appendix C).
The Reserve Banks receive income primarily from U.S. government securi-ties that the Federal Reserve has acquired through open market operations, one of the tools of monetary policy. These earn-ings account for approximately 95 per-cent of current income. Table D. 1 shows that the Banks received $17.6 billion in 1987 and an estimated $19.5 billion in 1988 from these securities and other sources.
Table D. 2 shows the distribution of the current income of the Banks for 1987 and
Table D.l Income of the Federal Reserve Banks, 1987-88 Millions of dollars
Source 1987 actual
1988 estimate
224.3 355.6 16,371.4 18,173.3
343.9 303.4 644.7 657.7 48.7 34.5
17,633.0 19,524.5
U.S. government securities . . . Foreign currencies Priced services Other
224.3 355.6 16,371.4 18,173.3
343.9 303.4 644.7 657.7 48.7 34.5
17,633.0 19,524.5 Total
224.3 355.6 16,371.4 18,173.3
343.9 303.4 644.7 657.7 48.7 34.5
17,633.0 19,524.5
224.3 355.6 16,371.4 18,173.3
343.9 303.4 644.7 657.7 48.7 34.5
17,633.0 19,524.5
1988. The current expenses of the Re-serve Banks are their operating expenses and the cost of the earnings credits they grant to depository institutions on clear-ing balances held with the Banks. The Reserve Banks record extraordinary adjustments to current net income in a profit-and-loss account. The primary entries in the profit-and-loss account are for gains or losses on the sale of U.S. government securities and for gains or losses on assets denominated in foreign currencies that result either from the sale of those assets or from their revaluation at market exchange rates.
The Reserve Banks maintain a surplus account to cushion unexpected losses, much as commercial organizations retain earnings. As required by the Board of Governors, the Reserve Banks adjust the size of the surplus account to keep it equal to the paid-in capital of the member banks. Under the policy established by the Board of Governors at the end of 1946, all income net of the statutory dividend to member banks and net of the amount necessary to equate surplus to paid-in capital is transferred to the U.S. Treasury as interest on Federal Reserve notes. Such payments to the Treasury were $17.7 billion in 1987 and are estimated to be $17.4 billion for 1988.
Digitized for FRASER http://fraser.stlouisfed.org/ Federal Reserve Bank of St. Louis

52 Sources and Uses o f Funds
Table D. 2 Distribution of the Income of the Federal Reserve Banks, 1987-88 Millions of dollars
Item 1987 actual
1988 estimate
Current income1
LESS Current expenses of Reserve Banks2-3
Operating expenses Earnings-credit costs
EQUALS Current net income
PLUS Net additions to, or deductions from ( - ) , current net income4.
LESS Cost of unreimbursed Treasury services5
Assessments by Board Board expenses Cost of currency
Other distributions Dividends paid to member banks 6 . Transfers to, or from (—), surplus1
EQUALS Payments to U.S. Treasury
17,633
1,033 114
16,486
1,844
47
82 171
117 174
17,739
19,524
1,081 127
18,316
- 4 8 9
31
84 164
126 65
17,356
1. See table D. l . 2. Net of reimbursements due from the U.S. Treasury
and other government agencies. 3. Reflects reduction of$69.5 million in I988and$49.2
million in 1987 in credits for net periodic pension cost. 4. This account is the same as that reported under the
same name in the table "Income and Expenses of the Federal Reserve Banks," in the Statistical Tables section of the Board's Annual Report and includes gains and losses on foreign exchange transactions due primarily to revaluations at market exchange rates, gains and losses on sales of U. S.
government securities, and miscellaneous gains and losses. 5. This account reflects the cost of services provided to
the U.S. Treasury that are reimbursable under agreements with the Treasury and for which reimbursement is not anticipated.
6. The Federal Reserve Act requires the Federal Reserve to pay dividends to member banks at the rate of 6 percent of paid-in capital.
7. Each year the Federal Reserve transfers to its surplus account an amount sufficient to equate surplus to paid-in capital to provide a reserve against losses.
Digitized for FRASER http://fraser.stlouisfed.org/ Federal Reserve Bank of St. Louis

53
Appendix E
Federal Reserve System Audits
The Federal Reserve System as a whole, as well as the Board of Governors and each of the Reserve Banks taken sepa-rately, are all subject to a variety of audits and reviews. At each Federal Reserve Bank, a full-time staff of auditors under the direction of a general auditor reports directly to the Bank's board of directors. The Board's Division of Federal Reserve Bank Operations, acting on behalf of the Board of Governors, regularly audits the financial operations of each of the Banks and periodically reviews all other Bank operations. The Board itself is reviewed by its own staff of auditors and operations reviewers; the responsibility for these internal reviews at the Board was consoli-dated in 1987 by the creation of the Office of the Inspector General. In addition, an independent auditor annually examines
the fairness of the Board's financial statements and its compliance with the laws and regulations affecting those statements.
The 1978 passage of the Federal Bank-ing Agency Audit Act (Public Law 95-320) brought most of the operations of the Federal Reserve System under the purview of the General Accounting Office (GAO). The GAO, which currently has 16 projects in various stages of comple-tion, since 1979 has completed 49 reports on selected aspects of Federal Reserve operations (see tables E. 1 and E.2). The GAO has also involved the Federal Reserve in about 60 other reviews not directly related to the System and has terminated 29 others before completion. The reports are available directly from the GAO.
Table E.l Active GAO Projects Related to the Federal Reserve System
Subject
Conflicts of interest Food stamp redemption process
Food stamp program within the Federal Reserve banking system Merging federal deposit insurance funds Federal Reserve pricing of check clearing services High-yield bond study Government-in-the-Sunshine Act
Bank failures in 1987 Handling troubled financial institutions Quality of U.S. monthly trade statistics Clearance and settlement in stock, options and futures markets Electronic funds transfer systems International coordination of securities regulation Food stamp program CFTC reauthorization Proposals for dealing with the international debt crisis
Date initiated
5/1/86 5/7/86
7/22/87 8/17/87 8/19/87 8/19/87 9/17/87
2/22/88 3/14/88 3/23/88 5/25/88 7/15/88 8/16/88 8/24/88 9/28/88
10/27/88
Digitized for FRASER http://fraser.stlouisfed.org/ Federal Reserve Bank of St. Louis
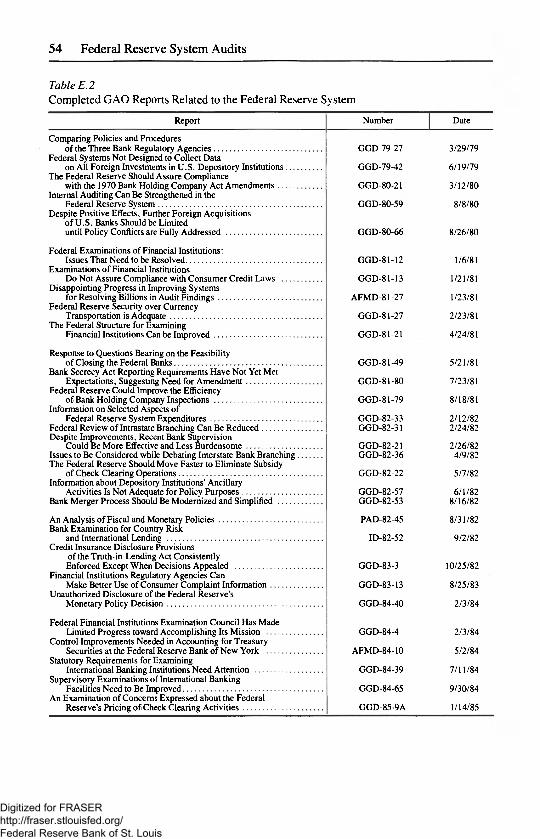
54 Federal Reserve System Audits
Table E. 2 Completed GAO Reports Related to the Federal Reserve System
Report
Comparing Policies and Procedures of the Three Bank Regulatory Agencies
Federal Systems Not Designed to Collect Data on All Foreign Investments in U.S. Depository Institutions...
The Federal Reserve Should Assure Compliance with the 1970 Bank Holding Company Act Amendments
Internal Auditing Can Be Strengthened in the Federal Reserve System
Despite Positive Effects, Further Foreign Acquisitions of U.S. Banks Should be Limited until Policy Conflicts are Fully Addressed
Federal Examinations of Financial Institutions: Issues That Need to be Resolved
Examinations of Financial Institutions Do Not Assure Compliance with Consumer Credit Laws
Disappointing Progress in Improving Systems for Resolving Billions in Audit Findings
Federal Reserve Security over Currency Transportation is Adequate
The Federal Structure for Examining Financial Institutions Can be Improved
Response to Questions Bearing on the Feasibility of Closing the Federal Banks
Bank Secrecy Act Reporting Requirements Have Not Yet Met Expectations, Suggesting Need for Amendment
Federal Reserve Could Improve the Efficiency of Bank Holding Company Inspections
Information on Selected Aspects of Federal Reserve System Expenditures
Federal Review of Intrastate Branching Can Be Reduced Despite Improvements, Recent Bank Supervision
Could Be More Effective and Less Burdensome Issues to Be Considered while Debating Interstate Bank Branching The Federal Reserve Should Move Faster to Eliminate Subsidy
of Check Clearing Operations Information about Depository Institutions' Ancillary
Activities Is Not Adequate for Policy Purposes Bank Merger Process Should Be Modernized and Simplified
An Analysis of Fiscal and Monetary Policies Bank Examination for Country Risk
and International Lending Credit Insurance Disclosure Provisions
of the Truth-in-Lending Act Consistently Enforced Except When Decisions Appealed
Financial Institutions Regulatory Agencies Can Make Better Use of Consumer Complaint Information
Unauthorized Disclosure of the Federal Reserve's Monetary Policy Decision
Federal Financial Institutions Examination Council Has Made Limited Progress toward Accomplishing Its Mission
Control Improvements Needed in Accounting for Treasury Securities at the Federal Reserve Bank of New York
Statutory Requirements for Examining International Banking Institutions Need Attention
Supervisory Examinations of International Banking Facilities Need to Be Improved
An Examination of Concerns Expressed about the Federal Reserve's Pricing of Check Clearing Activities
Number Date
GGD-79-27
GGD-79-42
GGD-80-21
GGD-80-59
GGD-80-66
GGD-81-12
GGD-81-13
AFMD-81-27
GGD-81-27
GGD-81-21
GGD-81-49
GGD-81-80
GGD-81-79
GGD-82-33 GGD-82-31
GGD-82-21 GGD-82-36
GGD-82-22
GGD-82-57 GGD-82-53
PAD-82-45
ID-82-52
GGD-83-3
GGD-83-13
GGD-84-40
GGD-84-4
AFMD-84-10
GGD-84-39
GGD-84-65
GGD-85-9A
3/29/79
6/19/79
3/12/80
8/8/80
8/26/80
1/6/81
1/21/81
1/23/81
2/23/81
4/24/81
5/21/81
7/23/81
8/18/81
2/12/82 2/24/82
2/26/82 4/9/82
5/7/82
6/1/82 8/16/82
8/31/82
9/2/82
10/25/82
8/25/83
2/3/84
2/3/84
5/2/84
7/11/84
9/30/84
1/14/85
Digitized for FRASER http://fraser.stlouisfed.org/ Federal Reserve Bank of St. Louis

Federal Reserve System Audits 55
Table E.2 — Continued
Report Number Date
Information on Independent Public Accountant Audits of Financial Institutions GGD-84-44FS 4/21/86
An Analysis of Two Types of Pooled Investment Funds GGD-86-63 5/12/86 How the Markets Developed and How They Are Regulated GGD-86-26 5/15/86 U.S. Banking Supervision and International
Supervisory Principles NSIAD-86-93 7/25/86 Financial Institution Regulators' Compliance Examination GGD-86-94 8/1/86
The Market's Structure, Risks, and Regulation GGD-86-80BR 8/20/86 Dealer Views on Market Operations and Federal
Reserve Securities Transfer System GGD-86-147FS 9/29/86 Questions About the Federal Reserve's Securities Transfer System GGD-87-15BR 10/20/86 Federal Reserve Board Opposition to Credit Card Interest Rate Limits GGD-87-38BR 4/7/87 Insulating Banks From the Potential Risk of Expanded Activities GGD-87-35 4/14/87 The Federal Reserve Response Regarding its
Market-Making Standard GGD-87-55FS 4/21/87 Change in Fees and Deposit Account Interest
Rates Since Deregulation GGD-87-70 7/13/87 An Examination of Views Expressed about Access to Brokers' Services .. GGD-88-8 12/18/87
Issues Related to Repeal of the Glass-Steagall Act GGD-88-37 1/22/88 Supervision of Overseas Lending is Inadequate NSIAD-88-87 5/5/88 Administrative Expenses at FHLBB and FRB for 1985 and 1986 AFMD-88-33 6/15/88 Trends in Commercial Bank Performance, December 1976-June 1987 . . . GGD-88-106BR 7/28/88 Lending to Troubled Sectors GGD-88-126BR 9/26/88 Government Check Cashing Issues GGD-89-12 10/7/88
Digitized for FRASER http://fraser.stlouisfed.org/ Federal Reserve Bank of St. Louis

57
Appendix F
Expenses and Employment at the Federal Reserve Banks
Table F.l Operating Expenses of the Federal Reserve Banks, by District, 1988-89 Thousands of dollars, except as noted
District 1988 1989 Change District estimate budget Amount Percent
Boston 76,429 80,422 3,993 5.2 New York 247,156 261,139 13,983 5.7 Philadelphia 67,957 71,400 3,443 5.1 Cleveland 75,273 80,619 5,346 7.1 Richmond 97,617 102,135 4,518 4.6 Atlanta 116,707 124,211 7,505 6.4 Chicago 147,050 154,241 7,191 4.9 St. Louis 62,432 63,734 1,303 2.1 Minneapolis 62,103 66,391 4,289 6.9 Kansas City 82,591 86,803 4,211 5.1 Dallas 81,060 85,562 4,503 5.6 San Francisco 144,924 153,830 8,906 6.1
Total, all Districts1 1,261,298 1,330,487 69,189 5.5
Special projects 4,945 11,103
Total 1,266,243 1,341,590 75,347 6.0
1. Includes $13.9 million in 1988 and $19.3 million in 1989 to implement the Expedited Funds Availability Act.
Table F.2 Employment at the Federal Reserve Banks, by District, 1988-89 Average number of personnel1
District 1988 1989 Change District estimate budget Amount Percent
Boston 1,535 1,503 - 3 2 - 2 . 1 New York 4,068 4,037 - 3 2 - . 8 Philadelphia 1,252 1,263 11 .9 Cleveland 1,435 1,476 41 2.9 Richmond 1,978 1,991 13 .7 Atlanta 2,241 2,271 30 1.3 Chicago 2,682 2,676 - 6 - . 2 St. Louis 1,306 1,246 - 5 9 - 4 . 5 Minneapolis 1,088 1,113 25 2.3 Kansas City 1,704 1,704 0 .0 Dallas 1,590 1,623 33 2.1 San Francisco 2,501 2,538 37 1.5
Total, all Districts 23,379 23,441 62 .3
Special projects 10 35
Total 23,389 23,476 8 .4 1. See chap. 3, note 1, for definition of ANP. 2. Includes213.6ANPforANPin 1988and347.7ANP
in 1989 for implementation of the Expedited Funds Availability Act.
Digitized for FRASER http://fraser.stlouisfed.org/ Federal Reserve Bank of St. Louis
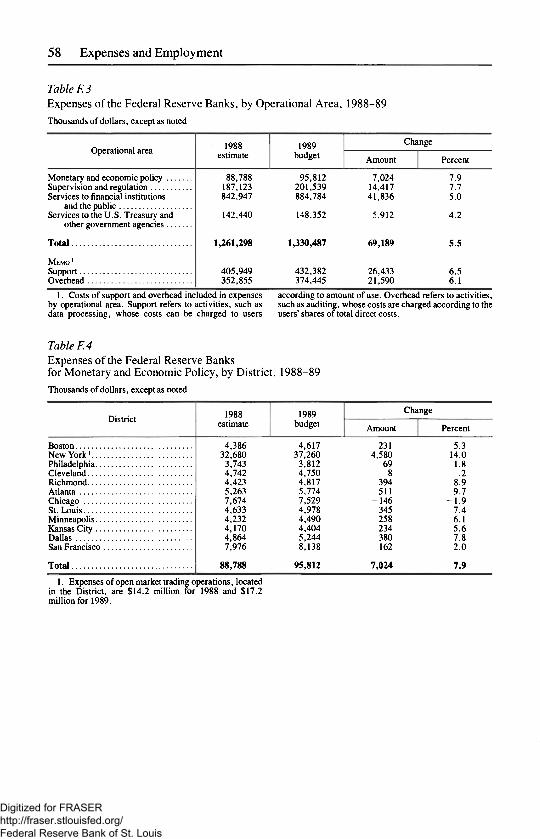
58 Expenses and Employment
Table F. 3 Expenses of the Federal Reserve Banks, by Operational Area, 1988-89 Thousands of dollars, except as noted
Operational area 1988 estimate
1989 budget
Change Operational area 1988
estimate 1989
budget Amount Percent
Monetary and economic policy 88,788 95,812 7,024 7.9 Supervision and regulation 187,123 201,539 14,417 7.7 Services to financial institutions 842,947 884,784 41,836 5.0
and the public Services to the U.S. Treasury and 142,440 148,352 5.912 4.2
other government agencies
Total 1,261,298 1,330,487 69,189 5.5
MEMO1
Support 405,949 432,382 26,433 6.5 Overhead 352,855 374,445 21,590 6.1
1. Costs of support and overhead included in expenses according to amount of use. Overhead refers to activities, by operational area. Support refers to activities, such as such as auditing, whose costs are charged according to the data processing, whose costs can be charged to users users' shares of total direct costs.
Table F. 4 Expenses of the Federal Reserve Banks for Monetary and Economic Policy, by District, 1988-89 Thousands of dollars, except as noted
District 1988 1989 Change District estimate budget Amount Percent
Boston 4,386 4,617 231 5.3 New York1 32,680 37,260 4,580 14.0 Philadelphia 3,743 3,812 69 1.8 Cleveland 4,742 4,750 8 .2 Richmond 4.423 4,817 394 8.9 Atlanta 5,263 5,774 511 9.7 Chicago 7,674 7,529 - 1 4 6 - 1 . 9 St. Louis 4,633 4,978 345 7.4 Minneapolis 4,232 4,490 258 6.1 Kansas City 4,170 4,404 234 5.6 Dallas 4,864 5,244 380 7.8 San Francisco 7,976 8,138 162 2.0
Total 88,788 95,812 7,024 7.9
1. Expenses of open market trading operations, located in the District, are $14.2 million for 1988 and $17.2 million for 1989.
Digitized for FRASER http://fraser.stlouisfed.org/ Federal Reserve Bank of St. Louis
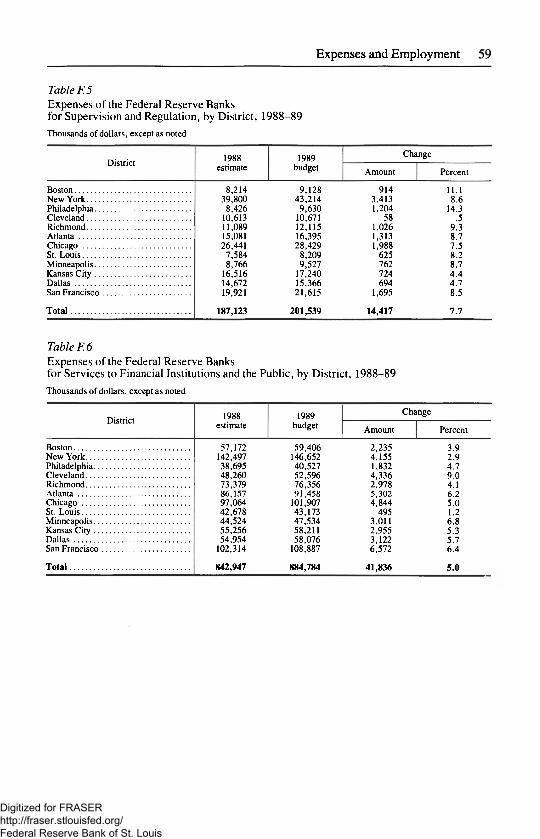
59 Expenses and Employment
Table F. 5 Expenses of the Federal Reserve Banks for Supervision and Regulation, by District, 1988-89 Thousands of dollars, except as noted
District 1988 1989 Change District estimate budget Amount Percent
Boston 8,214 9,128 914 11.1 New York 39,800 43,214 3,413 8.6 Philadelphia 8,426 9,630 1,204 14.3 Cleveland 10,613 10,671 58 .5 Richmond 11,089 12,115 1,026 9.3 Atlanta 15,081 16,395 1,313 8.7 Chicago 26,441 28,429 1,988 7.5 St. Louis 7,584 8,209 625 8.2 Minneapolis 8,766 9,527 762 8.7 Kansas City 16,516 17,240 724 4.4 Dallas 14,672 15,366 694 4.7 San Francisco 19,921 21,615 1,695 8.5
Total 187,123 201,539 14,417 7.7
Table F. 6 Expenses of the Federal Reserve Banks for Services to Financial Institutions and the Public, by District, 1988-89 Thousands of dollars, except as noted
District 1988 estimate
1989 budget
Change District 1988
estimate 1989
budget Amount Percent
Boston 57,172 59,406 2,235 3.9 New York 142,497 146,652 4,155 2.9 Philadelphia 38,695 40,527 1,832 4.7 Cleveland 48,260 52,596 4,336 9.0 Richmond 73,379 76,356 2,978 4.1 Atlanta 86,157 91,458 5,302 6.2 Chicago 97,064 101,907 4,844 5.0 St. Louis 42,678 43,173 495 1.2 Minneapolis 44,524 47,534 3,011 6.8 Kansas City 55,256 58,211 2,955 5.3 Dallas 54,954 58,076 3,122 5.7 San Francisco 102,314 108,887 6,572 6.4
Total 842,947 884,784 41,836 5.0
Digitized for FRASER http://fraser.stlouisfed.org/ Federal Reserve Bank of St. Louis

60 Expenses and Employment
Table F. 7 Expenses of the Federal Reserve Banks for Services to the U.S. Treasury and Other Government Agencies, by District, 1988-89 Thousands of dollars, except as noted
District 1988 1989 Change District estimate budget Amount Percent
Boston 6,657 7,272 614 9.2 New York 32,179 34,014 1,835 5.7 Philadelphia 17,094 17,432 338 2.0 Cleveland 11,659 12,602 943 8.1 Richmond 8,727 8,846 120 1.4 Atlanta 10,205 10,584 379 3.7 Chicago 15,871 16,376 505 3.2 St. Louis 7,536 7,374 -162 - 2 . 2 Minneapolis 4,581 4,839 258 5.6 Kansas City 6,649 6,948 298 4.5 Dallas 6,569 6,876 307 4.7 San Francisco 14,712 15,189 477 3.2
Total 142,440 148,352 5,912 4.2
Table F. 8 Expenses of the Federal Reserve Banks for Salaries of Officers and Employees, by District, 1988-89 Thousands of dollars, except as noted
District 1988 1989 Change District estimate budget Amount Percent
Boston 43,947 44,930 984 2.2 New York 126,457 135,442 8,985 7.1 Philadelphia 33,820 35,358 1,539 4.6 Cleveland 36,896 39,390 2,495 6.8 Richmond 49,253 51,540 2,287 4.6 Atlanta 56,677 60,168 3,491 6.2 Chicago 73,353 76,117 2,764 3.8 St. Louis 32,847 32,969 122 .4 Minneapolis 29,097 31,410 2,312 7.9 Kansas City 44,389 46,731 2,342 5.3 Dallas 43,081 46,350 3,270 7.6 San Francisco 73,772 78,853 5,081 6.9
Total 643,587 679,257 35,670 5.5
Digitized for FRASER http://fraser.stlouisfed.org/ Federal Reserve Bank of St. Louis

61 Expenses and Employment
Table F. 9 Factors in the 1988-89 Change in Salaries of Officers and Employees of the Federal Reserve Banks, by District Percentage points
District Merit
adjust-ment
Structure adjust-ment
Promotion and reclassi-
fication Change in
staffing Turnover and lag' Overtime Other Total
change
Boston 5.5 .2 1.6 1.6 - 2 . 0 - 1 . 5 .0 2.2 New York 4.4 .0 .8 2.6 - 1 . 0 - . 1 .4 7.1 Philadelphia 4.7 .1 .6 2.4 - 2 . 4 - . 8 .0 4.6 Cleveland 4.4 .1 .8 3.2 - 1 . 7 .6 .5 6.8 Richmond 4.7 .0 1.8 - . 7 - . 7 - . 4 .0 4.6 Atlanta 4.9 .4 1.3 1.1 - 1 . 1 - . 4 .0 6.2 Chicago 3.6 .0 1.1 - . 3 - . 1 - . 7 .2 3.8 St. Louis 4.7 .0 .4 - 3 . 9 - . 5 - . 4 .0 .4 Minneapolis 4.4 .1 1.3 2.0 - . 2 .4 .0 7.9 Kansas City 4.5 .3 1.6 .3 - 1 . 2 - . 2 .0 5.3 Dallas 4.8 .1 .7 2.2 - . 6 .2 .2 7.6 San Francisco 5.0 .0 .4 1.9 - . 1 - . 3 .0 6.9
Total 4.6 .1 1.0 1.0 - . 9 - . 4 .1 5.5
1. Turnover is the replacement of a departing employee with one having a lower pay grade. Lag is the time during which a position remains vacant.
Table F. 10 Capital Outlays of the Federal Reserve Banks, by District, 1988-89 Thousands of dollars, except as noted
District 1988 1989 Change District estimate budget Amount Percent
Boston 8,646 8,050 - 5 9 6 - 6 . 9 New York 26,834 42,999 16,164 60.2 Philadelphia 5,041 5,800 759 15.1 Cleveland 11,211 16,813 5,602 50.0 Richmond 26.350 17,696 -8 ,654 -32 .8 Atlanta 15,784 18,795 3,011 19.1 Chicago 62,872 19,879 -42,993 -68 .4 St. Louis 5,086 9,690 4,605 90.5 Minneapolis 4,964 24,171 19,207 386.9 Kansas City 6,183 17,859 11,676 188.8 Dallas 17,663 37,922 20,259 114.7 San Francisco 12,674 12,000 -675 - 5 . 3
Total 203,308 231,673 28,365 14.0
Digitized for FRASER http://fraser.stlouisfed.org/ Federal Reserve Bank of St. Louis

62 Expenses and Employment
Table F. 11 Capital Outlays of the Federal Reserve Banks, by District and Class of Outlay, 1988-891
Thousands of dollars
District and year
Data pro-cessing and data com-
munication equipment
Furniture, furnish-ings, and fixtures
Other equip-ment
Land and
other real
estate
Buildings Building
machinery and
equipment
Lease-hold
improve-ments
Total
Boston 1988 5,876 198 615 0 1,151 807 0 8,646 1989 3,615 1,151 409 0 1,928 113 835 8,050
New York 1988 14,553 2,055 3,847 1,580 2,639 85 2,076 26,834 1989 20,780 2,869 1,499 10,734 6,302 571 244 42,999
Philadelphia 1988 2,554 151 402 0 15 1,315 604 5,041 1989 2,654 45 959 0 0 1,390 753 5,800
Cleveland 1988 7,564 1,117 701 0 1,340 490 0 11,210 1989 7,801 945 1,352 0 4,689 2,026 0 16,813
Richmond 1988 6,251 233 1,117 25 18,619 105 0 26,350 1989 7,834 799 1,810 275 6,836 142 0 17,696
Atlanta 1988 7,996 2,726 1,015 142 2,667 1,063 176 15,784 1989 9,420 4,457 2,868 0 1,452 598 0 18,795
Chicago 1988 16,523 1,872 1,288 0 40,171 2,811 207 62,872 1989 8,841 1,729 1,118 0 7,224 320 648 19,879
St. Louis 1988 2,597 55 548 0 1,515 371 0 5,086 1989 1,606 292 325 0 6,483 985 0 9,690
Minneapolis 1988 2,720 72 444 263 1,264 200 0 4,964 1989 7,164 1,394 544 0 8,479 0 6,591 24,171
Kansas City 1988 2,208 687 1,127 108 1,423 630 0 6,183 1989 9,481 924 1,214 382 1,915 3,944 0 17,859
Dallas 1988 10,769 387 312 144 4,374 1,652 25 17,663 1989 4,014 90 604 22,953 7,934 2,292 35 37,922
San Francisco 1988 6,794 858 1,685 0 3,000 150 188 12,674 1989 4,429 927 1,915 75 3,722 931 0 .12,000
Total 1988 86,404 10,410 13,100 2,262 78,178 9,678 3,275 203,308 1989 87,638 15,622 14,615 34,419 56,964 13,311 9,105 231,673
1. For 1988, estimate; for 1989, budget.
Digitized for FRASER http://fraser.stlouisfed.org/ Federal Reserve Bank of St. Louis

63 Expenses and Employment
Table F. 12 Budget Performance of the Federal Reserve Banks, Operating Expenses, by District, 19881
Thousands of dollars, except as noted
District 1988 1988 Change District budget estimate Amount Percent
Boston 74,547 76,429 1,882 2.5 New York 246,796 247,156 359 .1 Philadelphia 67,568 67,957 389 .6 Cleveland 74,737 75,273 537 .7 Richmond 96,303 97,617 1,315 1.4 Atlanta 116,474 116,707 233 .2 Chicago 147,557 147,050 - 5 0 7 - . 3 St. Louis 63,334 62,432 -903 - 1 . 4 Minneapolis 62,221 62,103 - 1 1 8 - . 2 Kansas City 82,027 82,591 565 .7 Dallas 80,371 81,060 689 .9 San Francisco 145,707 144,924 -783 - . 5
Total 1,257,642 1,261,298 3,656 .3
1. Includes expenses associated with the Expedited Funds Availability Act.
Table F. 13 Budget Performance of the Federal Reserve Banks, Employment, by District, 19881
Average number of personnel, except as noted2
District 1988 1988 Change District budget estimate Amount Percent
Boston 1,523 1,535 12 .8 New York 4,016 4,068 52 2.2 Philadelphia 1,249 1,252 3 .6 Cleveland 1,406 1,435 29 2.5 Richmond 1,959 1,978 19 2.0 Atlanta 2,210 2,241 31 2.1 Chicago 2,684 2,682 - 2 .3 St. Louis 1,333 1,306 - 2 7 - . 6 Minneapolis 1,086 1,088 2 1.1 Kansas City 1,681 1,704 23 3.6 Dallas 1,587 1,590 3 .5 San Francisco 2,516 2,501 - 1 5 .8
Total 23,250 23,379 129 1.5
1. Includes personnel associated with the Expedited Funds Availability Act.
2. See chap. 3, note 1, for the definition of ANP.
Digitized for FRASER http://fraser.stlouisfed.org/ Federal Reserve Bank of St. Louis

64 Expenses and Employment
Table F. 14 Expenses of the Federal Reserve Banks, by Operational Area, 1984-89 Thousands of dollars, except as noted
Year
Monetary and
economic policy
Supervision and
regulation
Services to financial
institutions and the public
Services to the U.S. Treasury and other
government agencies
Total
1984 99,351 140,690 701,453 126,307 1,067,802 1985 90,945 151,991 742,896 131,544 1,117,377 1986 90,570 163,915 770,016 136,789 1,161,290 1987 86,484 170,428 799,227 135,693 1,191,832 1988 estimate 88,788 187,123 842,945 142,440 1,261,295 1989 budget 95,812 201,539 884,783 148,352 1,330,487
Average annual change, percent - . 7 7.5 4.8 3.3 4.5
Table F. 15 Employment at the Federal Reserve Banks, by Operational Area, 1984-89 Average number of personnel, except as noted1
Year
Monetary and
economic policy
Supervision and
regulation
Services to financial
institutions and the public
Services to the U.S. Treasury and other
government agencies
Support2 Overhead2 Total
1984 826 1,885 8,395 1,798 4,340 5,424 22,668 1985 816 1,912 8,754 1,781 4,398 5,323 22,984 1986 791 2,087 8,799 1,819 4,469 5,274 23,239 1987 776 2,148 8,777 1,837 4,452 5,025 23,015 1988 estimate 768 2,223 9,014 1,844 4,565 4,964 23,379 1989 budget 786 2,250 9,049 1,805 4,597 4,954 23,441
Average annual change, percent - 1 . 0 3.6 1.5 .1 1.2 - 1 . 8 .7
1. See chap. 3, note 1, for definition of ANP. 2. See table F.3, note 1, for definition.
Digitized for FRASER http://fraser.stlouisfed.org/ Federal Reserve Bank of St. Louis

65
The Federal Reserve System
Boundaries of Federal Reserve Districts and their Branch Territories
• • I Hth„.
Minneapolis^
Detroit
I r><hXfitfft
cJ&ca Iftirlol'V
Ckicagt
tMigj Kansas City
<»te/es * ® > All""
Dallas®
HoustonJ
Mi'"'
Legend Boundaries of Federal Reserve Districts Boundaries of Federal Reserve Branch Territories
o Board of Governors of the Federal Reserve System • Federal Reserve Bank Cities • Federal Reserve Branch Cities • Federal Reserve Bank Facilities
Digitized for FRASER http://fraser.stlouisfed.org/ Federal Reserve Bank of St. Louis

FRB 1-2,000-0289 C
Digitized for FRASER http://fraser.stlouisfed.org/ Federal Reserve Bank of St. Louis