Aquatic Assessment of the Ely Copper Mine Superfund Site ...
150
U.S. Department of the Interior U.S. Geological Survey Scientific Investigations Report 2010–5084 Prepared in cooperation with the U.S. Environmental Protection Agency Aquatic Assessment of the Ely Copper Mine Superfund Site, Vershire, Vermont
Transcript of Aquatic Assessment of the Ely Copper Mine Superfund Site ...

U.S. Department of the InteriorU.S. Geological Survey
Scientific Investigations Report 2010–5084
Prepared in cooperation with the U.S. Environmental Protection Agency
Aquatic Assessment of the Ely Copper Mine Superfund Site, Vershire, Vermont

Cover photograph. The confluence of Ely Brook, flowing from the back to the front of the scene, with Schoolhouse Brook, flowing from left to right.

Aquatic Assessment of the Ely Copper Mine Superfund Site, Vershire, Vermont
By Robert R. Seal, II, Richard G. Kiah, Nadine M. Piatak, John M. Besser, James F. Coles, Jane M. Hammarstrom, Denise M. Argue, Denise M. Levitan, Jeffrey R. Deacon, and Christopher G. Ingersoll
Prepared in cooperation with the U.S. Environmental Protection Agency
Scientific Investigations Report 2010–5084
U.S. Department of the InteriorU.S. Geological Survey

U.S. Department of the InteriorKEN SALAZAR, Secretary
U.S. Geological SurveyMarcia K. McNutt, Director
U.S. Geological Survey, Reston, Virginia: 2010
For more information on the USGS—the Federal source for science about the Earth, its natural and living resources, natural hazards, and the environment, visit http://www.usgs.gov or call 1-888-ASK-USGS
For an overview of USGS information products, including maps, imagery, and publications, visit http://www.usgs.gov/pubprod
To order this and other USGS information products, visit http://store.usgs.gov
Any use of trade, product, or firm names is for descriptive purposes only and does not imply endorsement by the U.S. Government.
Although this report is in the public domain, permission must be secured from the individual copyright owners to reproduce any copyrighted materials contained within this report.
Suggested citation:Seal, R.R., II, Kiah, R.G., Piatak, N.M., Besser, J.M., Coles, J.F., Hammarstrom, J.M., Argue, D.M., Levitan, D.M., Deacon, J.R., and Ingersoll, C.G., 2010, Aquatic assessment of the Ely Copper Mine Superfund site, Vershire, Vermont: U.S. Geological Survey Scientific Investigations Report 2010–5084, 131 p.

iii
Acknowledgments
Thor Smith, Ann Chalmers, and Marc Zimmerman of the U.S. Geological Survey (USGS), Linda Elliot of the Vermont Department of Environmental Conservation, and Ken Munney of the U.S. Fish and Wildlife Service assisted with the field sampling program. Monique Adams, Todor Todorov, and Michael Anthony, all of the USGS, performed many of the water analyses.
The project benefited from discussions with Ed Hathaway and Bart Hoskins of the U.S. Envi-ronmental Protection Agency (USEPA), Linda Elliot, Steven Fiske, Richard Langdon, and John Schmeltzer of the Vermont Department of Environmental Conservation, Matt Kierstead (Public Archaeology Laboratory), Jason Clere (URS Corporation), and Stan Pauwels (TechLaw, Inc.). The manuscript benefited from reviews by Larry Gough, Ed Hathaway, Bart Hoskins, Ken Munney, and Stan Pauwels. The project was funded by USEPA (Region 1) and the Mineral Resources Program of the USGS.

iv

v
Contents
Acknowledgments ........................................................................................................................................iiiAbstract ...........................................................................................................................................................1Introduction.....................................................................................................................................................2
Purpose and Scope ..............................................................................................................................2Report Organization ..............................................................................................................................2Site Background....................................................................................................................................2
Study Approach and Methodology .............................................................................................................5Selection of Sample Locations ...........................................................................................................5Hydrologic Data...................................................................................................................................10Surface-Water Data ...........................................................................................................................10Pore-Water Data .................................................................................................................................10Sediment Data .....................................................................................................................................10Macroinvertebrate Data ....................................................................................................................11Fish Assemblage Data........................................................................................................................12Toxicity Tests........................................................................................................................................12Quality-Control Procedures ..............................................................................................................12Data Analysis and Statistical Methods ...........................................................................................12
Description of Study Area ..........................................................................................................................14Mine Site ..............................................................................................................................................14Ely Brook...............................................................................................................................................14Schoolhouse Brook ............................................................................................................................17Ompompanoosuc River ......................................................................................................................17
Nature and Extent of Contamination ........................................................................................................17Background Conditions .....................................................................................................................19
Surface-Water Geochemistry ..................................................................................................19Field Parameters and Major Inorganic Constituents ..................................................19Iron, Aluminum, and Manganese ...................................................................................23Minor and Trace Inorganic Elements ............................................................................23Dissolved Organic Carbon and Nutrients .....................................................................23Comparisons with Ambient Water-Quality Criteria .....................................................24
Pore-Water Geochemistry .......................................................................................................24Field Parameters and Major Inorganic Constituents ..................................................24Iron, Aluminum, and Manganese ...................................................................................25Minor and Trace Inorganic Elements ............................................................................25Dissolved Organic Carbon and Nutrients .....................................................................25Comparisons with Ambient Water-Quality Criteria .....................................................26
Sediment Geochemistry ...........................................................................................................26Bioassay Results ........................................................................................................................27Ecological Indicators ................................................................................................................29

vi
Ely Brook Tributaries .................................................................................................................29Surface-Water Geochemistry .........................................................................................29
Field Parameters and Major Inorganic Constituents .........................................29Iron, Aluminum, and Manganese ..........................................................................32Minor and Trace Inorganic Elements ...................................................................32Dissolved Organic Carbon and Nutrients ............................................................33Comparisons with Ambient Water-Quality Criteria and Relations
among Reaches ..........................................................................................33Sediment Geochemistry ..................................................................................................36Ecological Indicators .......................................................................................................36
Ely Brook......................................................................................................................................36Surface-Water Geochemistry .........................................................................................36
Field Parameters and Major Inorganic Constituents .........................................36Iron, Aluminum, and Manganese ..........................................................................37Minor and Trace Inorganic Elements ...................................................................37Dissolved Organic Carbon and Nutrients ............................................................37Trace Element Loads ...............................................................................................37Comparisons with Ambient Water-Quality Criteria and Relations
among Reaches ..........................................................................................39Pore-Water Geochemistry ..............................................................................................39
Field Parameters and Major Inorganic Constituents .........................................39Iron, Aluminum, and Manganese ..........................................................................42Minor and Trace Inorganic Elements ...................................................................42Dissolved Organic Carbon and Nutrients ............................................................42Comparisons with Ambient Water-Quality Criteria ............................................42
Sediment Geochemistry ..................................................................................................42Bioassay Results ...............................................................................................................43Relations among Trace Elements in Surface Water,
Pore Water, Sediment, and Aquatic Biota ......................................................43Schoolhouse Brook ...................................................................................................................46
Surface-Water Geochemistry .........................................................................................46Field Parameters and Major Inorganic Constituents .........................................46Iron, Aluminum, and Manganese ..........................................................................46Minor and Trace Inorganic Elements ...................................................................46Dissolved Organic Carbon and Nutrients ............................................................46Trace-Element Loads ...............................................................................................46Comparisons with Ambient Water-Quality Criteria and Relations
among Reaches ..........................................................................................47Pore-Water Geochemistry ..............................................................................................47
Field Parameters and Major Inorganic Constituents .........................................47Iron, Aluminum, and Manganese ..........................................................................47Minor and Trace Inorganic Elements ...................................................................47Dissolved Organic Carbon and Nutrients ............................................................50Comparisons with Ambient Water-Quality Criteria ............................................50
Sediment Geochemistry ..................................................................................................50Bioassay Results ...............................................................................................................50
vii
Relations among Trace Elements in Surface Water, Pore Water, Sediment, and Aquatic Biota .............................................................................51
Ompompanoosuc River .............................................................................................................53Surface-Water Geochemistry .........................................................................................53
Field Parameters and Major Inorganic Constituents .........................................54Iron, Aluminum, and Manganese ..........................................................................54Minor and Trace Inorganic Elements ...................................................................54Dissolved Organic Carbon and Nutrients ............................................................54Trace-Element Loads ...............................................................................................54Comparisons with Ambient Water-Quality Criteria and Relations
among Reaches ..........................................................................................54Pore-Water Geochemistry ..............................................................................................55
Field Parameters and Major Inorganic Constituents .........................................55Iron, Aluminum, and Manganese ..........................................................................55Minor and Trace Inorganic Elements ...................................................................55Dissolved Organic Carbon and Nutrients ............................................................55Comparisons with Ambient Water Quality Criteria ............................................55
Sediment Geochemistry ..................................................................................................58Bioassay Results ...............................................................................................................58Relations among Trace Elements in Surface Water, Pore Water,
Sediment, and Aquatic Biota .............................................................................58Discussion .....................................................................................................................................................59
Surface-Water Quality .......................................................................................................................59Sediment and Pore-Water Toxicity ..................................................................................................63Bioassay Results .................................................................................................................................66Ecological Indicators..........................................................................................................................67Comparison of Aquatic Ecosystem Health Indicators ..................................................................69
Conclusions...................................................................................................................................................73References Cited..........................................................................................................................................73Appendixes 1–8 ............................................................................................................................................77

viii
Figures 1–3. Maps showing— 1. Sampling location numbers and identifiers for data collected in the
Ompompanoosuc River and Schoolhouse Brook, Vershire, VT. Also shown are the locations of the Elizabeth Mine Superfund site, and the Union Village Dam just below the confluence of the West Branch of the Ompompanoosuc River with the Ompompanoosuc River ...................................3
2. Sampling location numbers and identifiers for data collected at the Ely Mine Superfund site, Vershire, VT ................................................................................4
3. The surficial geology of the Ely Mine Superfund site study area, VT .........................16 4–10. Graphs showing— 4. Flow-duration curve for U.S. Geological Survey gaging station 01141500
Ompompanoosuc River at Union Village Dam, VT, with streamflow distribution of water-quality samples collected in Ely Brook, Schoolhouse Brook, and the Ompompanoosuc River ...................................................18
5. Downstream variations in pH and specific conductance in surface and in situ pore waters at the Ely Mine Superfund site, Vershire, VT ................................23
6. Downstream variations in hardness, alkalinity and sulfate concentrations in surface and in situ pore waters at the Ely Mine Superfund site, Vershire, VT .........24
7. Downstream variations in aluminum, iron, cadmium, copper, and zinc concentrations in surface and in situ pore waters at the Ely Mine Superfund site, Vershire, VT ..............................................................................25
8. Qualitative multi-habitat invertebrate abundance and richness values among the Ely ponds, Vershire, VT ...................................................................................29
9. Riffle-targeted habitat invertebrate abundance and richness values in Ely Brook, abundance and richness values in Schoolhouse Brook, and abundance and richness values in the Ompompanoosuc River .........................30
10. Depositional-targeted habitat invertebrate abundance and richness values in Ely Brook, abundance and richness values in Schoolhouse Brook, and abundance and richness values in the Ompompanoosuc River .........................31
11. Box plots showing select constituent concentrations in surface waters among four tributaries to Ely Brook at the Ely Mine Superfund site, Vershire, VT .......................34
12. Graphs showing qualitative multi-habitat invertebrate abundance and richness values relative to the gradient in hazard index values derived from trace metal concentration in surface-waters from the Ely ponds, Vershire, VT .............37
13. Graphs showing instantaneous aluminum, iron, and manganese, and cadmium, cobalt, copper, and zinc loads at the Ely Mine Superfund site, Vershire, VT ...................38
14. Box plots showing select constituent concentrations in surface waters among four reaches in Ely Brook at the Ely Mine Superfund site, Vershire, VT ...........................40

ix
15. Graphs showing riffle-targeted habitat invertebrate abundance and richness values in Ely Brook, abundance and richness values in Schoolhouse Brook, and abundance and richness values in the Ompompanoosuc River relative to the gradient in hazard index values derived from trace metal concentration in surface waters, Vershire, VT ................................................................................................44
16. Graphs showing depositional-targeted habitat invertebrate abundance and richness values in Ely Brook, abundance and richness values in Schoolhouse Brook, and abundance and richness values in the Ompompanoosuc River relative to the gradient in hazard index values derived from trace metal concentration in pore waters, Vershire, VT ................................................................45
17. Box plots showing select constituent concentrations in surface waters among three reaches in Schoolhouse Brook at the Ely Mine Superfund site, Vershire, VT .................48
18–20. Graphs showing— 18. Fish assemblage index of biotic integrity scores for Schoolhouse Brook
and the Ompompanoosuc River ........................................................................................52 19. Fish assemblage index of biotic integrity compared to the
hazard index for surface waters .......................................................................................52 20. Concentrations of copper and zinc in brook trout and blacknose dace
tissue compared to the critical body residue values for salmonids ...........................53 21. Box plots showing select constituent concentrations in surface waters
among three reaches in the Ompompanoosuc River at the Ely Mine Superfund site, Vershire, VT .....................................................................................................56
22–27. Graphs showing— 22. Downstream variations in aluminum, iron, cadmium, copper, and zinc
hazard quotients in surface waters at the Ely Mine Superfund site, Vershire, VT. A, Ely ponds and Ely Brook; B, Schoolhouse Brook and the Ompompanoosuc River ................................................................................................61
23. Downstream variations in hardness-based and Biotic Ligand Model–based hazard quotients for copper in surface waters at the Ely Mine Superfund site, Vershire, VT ..................................................................................................................62
24. Chronic copper water-quality criteria for surface water based on hardness and the Biotic Ligand Model with the number of riffle-targeted habitat taxa ...........65
25. Three indices of metal toxicity risks for instream sediments from the Ely Mine site, August 2006 .................................................................................65
26. Copper and iron concentrations in stream sediments ..................................................66 27. Comparison of sediment-quality criteria with various measures of
sediment toxicity ..................................................................................................................72
x
Tables 1. Select characteristics for sampling locations at the Ely Mine
study area, Vershire, VT ...............................................................................................................6 2. Select basin and reach characteristics for sampling locations
at the Ely Mine study area, Vershire, VT .................................................................................15 3. Spearman rho values from correlating metal concentrations measured
in surface water, in situ pore water, and sediment against invertebrate richness (RTH, QMH, and DTH samples) and against the index of biotic integrity scores for the fish surveys ........................................................................................19
4. Constituents in filtered surface waters collected in August and September 2006 from the Ely Mine study area, Vershire, VT ............................................................................20
5. Constituents in filtered pore waters collected in August and September 2006 from the Ely Mine study area, Vershire, VT ............................................................................21
6. Select chemistry results for sediments collected in August and September 2006 from the Ely Mine study area, Vershire, VT ............................................................................26
7. Acid volatile sulfide (AVS) and simultaneously extractable metals results for stream sediments from the Ely Mine study area, Vershire, VT .....................................28
8. Results of 28-day toxicity tests with the amphipod Hyalella azteca and of 10-day toxicity tests with the midge Chironomus dilutus exposed to sediments from Ely Mine site, fall 2006 ...............................................................................28
9. Summary of selected invertebrate and fish data and the hazard index used for comparison of assemblage data to water quality at sampling locations in the Ely Mine study area, Vershire, VT................................................................32
10. Summary of the hazard quotient and hazard index for select constituents in waters and stream sediments at sampling locations in the Ely Mine study area, Vershire, VT, August 21 to 23, 2006 ......................................................................33
11. Summary of the concentration, hazard quotient, and hazard index for select constituents in pore waters at sampling locations in the Ely Mine study area, Vershire, VT, August and September 2006 .........................................................64
12. Summary of the aquatic-life use assessments for streams associated with the Ely Mine site ............................................................................................68
13. Summary of geochemical and biological indicators of stream health in the Ely Mine study area, Vershire, VT, June to September 2006 ....................................70
14. Summary of geochemical and biological indicators of pond health in the Ely Mine study area, Vershire, VT, June to September 2006 ....................................71
Appendix 1. Summary of test conditions for sediment toxicity tests with sediments from the Ely Mine site, September 2006, conducted in accordance with USEPA and ASTM standard methods .....................................................................................79
Appendix 2. Quality-assurance, quality-control water samples for the Ely Mine study, Vershire, VT .....................................................................................................81
Appendix 3. Quality-assurance, quality-control sediment samples for the Ely Mine study, Vershire, VT .....................................................................................................89
Appendix 4. Acid volatile sulfide, simultaneously extractable metals, and particle-size results for stream sediments and quality-assurance, quality-control samples for the Ely Mine study area, Vershire, VT ...............................................................................93

xi
Appendix 5. Summary of select constituents in surface waters relative to ambient water-quality criteria for stream reaches in the Ely Mine study area, Vershire, VT, 2000 to 2007......................................................................................97
Appendix 6. Constituents in surface waters collected in August and September 2006 from the Ely Mine study area, Vershire, VT ..........................................................................113
Appendix 7. Constituents in pore waters collected in August and September 2006 from the Ely Mine study area, Vershire, VT ..........................................................................121
Appendix 8. Chemistry results for sediments collected in August and September 2006 from the Ely Mine study area, Vershire, VT ..........................................................................129
Conversion Factors
Multiply By To obtain
Lengthcentimeter (cm) 0.3937 inch (in.)millimeter (mm) 0.03937 inch (in.)meter (m) 3.281 foot (ft) kilometer (km) 0.6214 mile (mi)kilometer (km) 0.5400 mile, nautical (nmi) meter (m) 1.094 yard (yd)
Areasquare meter (m2) 0.0002471 acre hectare (ha) 2.471 acresquare kilometer (km2) 247.1 acresquare centimeter (cm2) 0.001076 square foot (ft2)square meter (m2) 10.76 square foot (ft2) square centimeter (cm2) 0.1550 square inch (ft2) hectare (ha) 0.003861 square mile (mi2) square kilometer (km2) 0.3861 square mile (mi2)
Volumecubic meter (m3) 6.290 barrel (petroleum, 1 barrel = 42 gal)liter (L) 33.82 ounce, fluid (fl. oz)liter (L) 2.113 pint (pt)liter (L) 1.057 quart (qt)liter (L) 0.2642 gallon (gal)cubic meter (m3) 264.2 gallon (gal) cubic meter (m3) 0.0002642 million gallons (Mgal) liter (L) 61.02 cubic inch (in3) cubic meter (m3) 35.31 cubic foot (ft3)cubic meter (m3) 1.308 cubic yard (yd3) cubic meter (m3) 0.0008107 acre-foot (acre-ft)
Massgram (g) 0.03527 ounce, avoirdupois (oz)kilogram (kg) 2.205 pound avoirdupois (lb)

xii
Temperature in degrees Celsius (°C) may be converted to degrees Fahrenheit (°F) as follows:
°F=(1.8×°C)+32
Temperature in degrees Fahrenheit (°F) may be converted to degrees Celsius (°C) as follows:
°C=(°F–32)/1.8
Vertical coordinate information is referenced to the North American Vertical Datum of 1927 (NAVD 27).
Horizontal coordinate information is referenced to the North American Datum of 1927 (NAD 27).
Altitude, as used in this report, refers to distance above the vertical datum.
Specific conductance is given in microsiemens per centimeter at 25 degrees Celsius (µS/cm at 25 °C).
Concentrations of chemical constituents in water are given either in milligrams per liter (mg/L) or micrograms per liter (µg/L).
Acronyms Used in this Report
AFDW ash-free dry weight
ALU aquatic-life use
ANOVA analysis of variance
ANR Agency of Natural Resources (Vermont)
AVS acid volatile sulfide
ATSDR Agency for Toxic Substances and Disease Registry
AWQC ambient water-quality criteria
BERA Baseline Ecological Risk Assessment
BLM Biotic Ligand Model
CBR critical body residue
CCC criterion continuous concentration
CERC Columbia Environmental Research Center (USGS)
CERCLA Comprehensive Environmental Response, Compensation, and Liability Act
CMC criterion maximum concentration
CRREL Cold Regions Research and Engineering Laboratory (U.S. Army Corps of Engineers)
CVAF cold-vapor atomic fluorescence
CWIBI coldwater index of biotic integrity
DGPS differential global positioning system
DOC dissolved organic carbon
DTH depositional-targeted habitat

xiii
ESB equilibrium-partitioning sediment benchmark
HI hazard index
HQ hazard quotient
IBI index of biotic integrity
ICP-AES inductively coupled plasma–atomic emission spectroscopy
ICP-MS inductively coupled plasma–mass spectrometry
MWIBI mixed water index of biotic integrity
PEC probable effects concentration
PEQ probable effects quotient
QMH qualitative multi-habitat
ROS regression on order statistics
RPD relative percent difference
RTH riffle-targeted habitat
SEM simultaneously extractable metals
SEM-AVS simultaneously extractable metals–acid volatile sulfide
TOC total organic carbon
TU toxic units
USACE U.S. Army Corps of Engineers
USBM U.S. Bureau of Mines
USGS U.S. Geological Survey
VTAWQC Vermont ambient water-quality criteria
VTDEC Vermont Department of Environmental Conservation
VTNRB Vermont Natural Resources Board
WAAS Wide Area Augmentation System

xiv
Element Symbols Used in this Report
Ag silver
Al aluminum
As arsenic
B boron
Ba barium
Be beryllium
Bi bismuth
Ca calcium
Cd cadmium
Ce cerium
Cl chlorine
Co cobalt
Cr chromium
Cs cesium
Cu copper
Dy dysprosium
Er erbium
Eu europium
F fluorine
Fe iron
Ga gallium
Gd gadolinium
Ge germanium
Ho holmium
Hg mercury
K potassium
La lanthanum
Li lithium
Lu lutetium
Mg magnesium
Mn manganese
Mo molybdenum
Na sodium
Nb niobium
Nd neodymium
Ni nickel
P phosphorus
Pb lead
Pr praseodymium
Rb rubidium
Sb antimony
Sc scandium
Se selenium
Sm samarium
Sr strontium
Ta tantalum
Tb terbium
Th thorium
Ti titanium
Tl thallium
Tm thulium
U uranium
V vanadium
W tungsten
Y yttrium
Yb ytterbium
Zn zinc
Zr zirconium
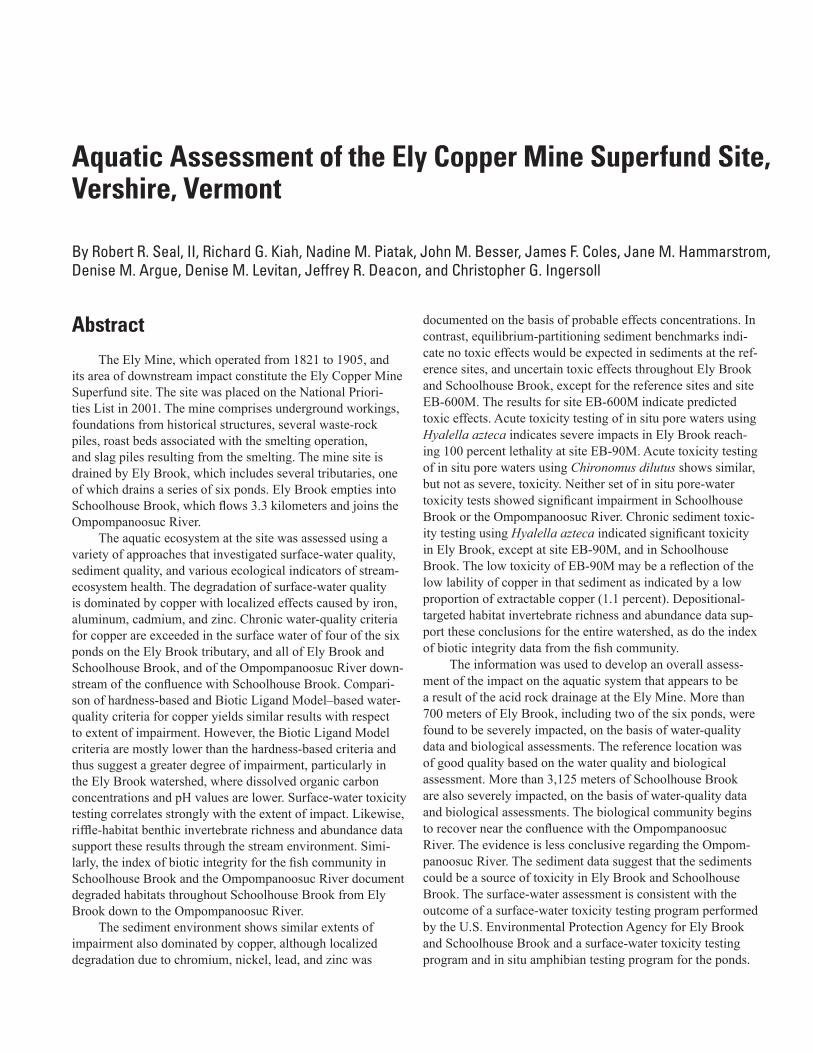
AbstractThe Ely Mine, which operated from 1821 to 1905, and
its area of downstream impact constitute the Ely Copper Mine Superfund site. The site was placed on the National Priori-ties List in 2001. The mine comprises underground workings, foundations from historical structures, several waste-rock piles, roast beds associated with the smelting operation, and slag piles resulting from the smelting. The mine site is drained by Ely Brook, which includes several tributaries, one of which drains a series of six ponds. Ely Brook empties into Schoolhouse Brook, which flows 3.3 kilometers and joins the Ompompanoosuc River.
The aquatic ecosystem at the site was assessed using a variety of approaches that investigated surface-water quality, sediment quality, and various ecological indicators of stream-ecosystem health. The degradation of surface-water quality is dominated by copper with localized effects caused by iron, aluminum, cadmium, and zinc. Chronic water-quality criteria for copper are exceeded in the surface water of four of the six ponds on the Ely Brook tributary, and all of Ely Brook and Schoolhouse Brook, and of the Ompompanoosuc River down-stream of the confluence with Schoolhouse Brook. Compari-son of hardness-based and Biotic Ligand Model–based water-quality criteria for copper yields similar results with respect to extent of impairment. However, the Biotic Ligand Model criteria are mostly lower than the hardness-based criteria and thus suggest a greater degree of impairment, particularly in the Ely Brook watershed, where dissolved organic carbon concentrations and pH values are lower. Surface-water toxicity testing correlates strongly with the extent of impact. Likewise, riffle-habitat benthic invertebrate richness and abundance data support these results through the stream environment. Simi-larly, the index of biotic integrity for the fish community in Schoolhouse Brook and the Ompompanoosuc River document degraded habitats throughout Schoolhouse Brook from Ely Brook down to the Ompompanoosuc River.
The sediment environment shows similar extents of impairment also dominated by copper, although localized degradation due to chromium, nickel, lead, and zinc was
documented on the basis of probable effects concentrations. In contrast, equilibrium- partitioning sediment benchmarks indi-cate no toxic effects would be expected in sediments at the ref-erence sites, and uncertain toxic effects throughout Ely Brook and Schoolhouse Brook, except for the reference sites and site EB-600M. The results for site EB-600M indicate predicted toxic effects. Acute toxicity testing of in situ pore waters using Hyalella azteca indicates severe impacts in Ely Brook reach-ing 100 percent lethality at site EB-90M. Acute toxicity testing of in situ pore waters using Chironomus dilutus shows similar, but not as severe, toxicity. Neither set of in situ pore-water toxicity tests showed significant impairment in Schoolhouse Brook or the Ompompanoosuc River. Chronic sediment toxic-ity testing using Hyalella azteca indicated significant toxicity in Ely Brook, except at site EB-90M, and in Schoolhouse Brook. The low toxicity of EB-90M may be a reflection of the low lability of copper in that sediment as indicated by a low proportion of extractable copper (1.1 percent). Depositional-targeted habitat invertebrate richness and abundance data sup-port these conclusions for the entire watershed, as do the index of biotic integrity data from the fish community.
The information was used to develop an overall assess-ment of the impact on the aquatic system that appears to be a result of the acid rock drainage at the Ely Mine. More than 700 meters of Ely Brook, including two of the six ponds, were found to be severely impacted, on the basis of water-quality data and biological assessments. The reference location was of good quality based on the water quality and biological assessment. More than 3,125 meters of Schoolhouse Brook are also severely impacted, on the basis of water-quality data and biological assessments. The biological community begins to recover near the confluence with the Ompompanoosuc River. The evidence is less conclusive regarding the Ompom-panoosuc River. The sediment data suggest that the sediments could be a source of toxicity in Ely Brook and Schoolhouse Brook. The surface-water assessment is consistent with the outcome of a surface-water toxicity testing program performed by the U.S. Environmental Protection Agency for Ely Brook and Schoolhouse Brook and a surface-water toxicity testing program and in situ amphibian testing program for the ponds.
Aquatic Assessment of the Ely Copper Mine Superfund Site, Vershire, Vermont
By Robert R. Seal, II, Richard G. Kiah, Nadine M. Piatak, John M. Besser, James F. Coles, Jane M. Hammarstrom, Denise M. Argue, Denise M. Levitan, Jeffrey R. Deacon, and Christopher G. Ingersoll

2 Aquatic Assessment of the Ely Copper Mine Superfund Site, Vershire, Vermont
IntroductionThis report presents an evaluation of the aquatic ecosys-
tem associated with the Ely Copper Mine Superfund site in Vershire, Orange County, VT. The Ely Copper Mine Super-fund site was placed on the U.S. Environmental Protection Agency (USEPA) National Priorities List in 2001. Results of detailed mine-waste investigations show that the mine, which operated intermittently from the early 1800s until 1905, is contributing metals and highly acidic waters to local streams (Hammarstrom and others, 2001a, b; Kierstead, 2001; Seal and others, 2001; Piatak and others, 2003, 2004; TechLaw, Inc., 2008; URS Corporation, 2009). Contaminated surface waters and sediment are transported from the mine site by Ely Brook. Ely Brook flows approximately 0.15 kilometer (km) from the lowermost mine-waste piles before entering Schoolhouse Brook, which then flows approximately 3.3 km before entering the Ompompanoosuc River (figs. 1 and 2). The area included in this report comprises the site of historical mining operations, downstream aquatic habitats, and adjacent upstream aquatic habitats selected to represent unimpacted reference conditions. Water bodies include Ely Brook, which drains most of the historical mine site, the tributaries to Ely Brook, including a series of ponds which drain into one of the tributaries, Schoolhouse Brook, which receives drainage from Ely Brook, and the Ompompanoosuc River, which is the receiving water body for Schoolhouse Brook.
Purpose and Scope
The goals of this report are to (1) characterize water and sediment quality and biological communities for water bodies in the Ely Mine study area, (2) compare and contrast surface-water, pore-water, and sediment trace-element concentrations, (3) relate trace-element concentrations to aquatic invertebrate and fish assemblages, and (4) evaluate the toxicity of surface water, pore water, and sediment. Results from this study will contribute to an understanding of the relations among the chemical, physical, and biological components of waterways that are affected by acid-mine drainage. Information from these results will be used in the development of a remedial investigation and feasibility study plan for the site, which will meet the broad U.S. Geological Survey (USGS) goal of furnishing data needed by other Federal agencies for manage-ment and remediation of contaminated sites, and will provide valuable information for the characterization of the impact of acid-mine drainage on the ecological condition of water bodies downstream of the Ely Mine site. Ultimately, this information will be used in making decisions for remedial actions neces-sary to mitigate future contamination from the mine and for developing a longer term monitoring program to assess the effectiveness of remediation. This report has been prepared, in part, to support the Ely Copper Mine Aquatic Baseline Ecolog-ical Risk Assessment (BERA; TechLaw, Inc., 2008) being con-ducted under the regulatory framework of the Comprehensive
Environmental Response, Compensation, and Liability Act (CERCLA). These two reports will complement a source-area remedial investigation being conducted by USEPA and its contractors (URS Corporation, 2009).
Supporting streamflow and water-quality data collected in August and September 2006 are stored in the USGS National Water Information System (http://nwis.waterdata.usgs.gov/nwis). Water-quality, stream sediment, fish-tissue, and fish and benthic macroinvertebrate assemblage data collected from 2000 to 2007 are published in Argue and others (2008).
Report Organization
The report assesses the environmental conditions of the aquatic ecosystem associated with the abandoned Ely Mine site, describes the approach and methods selected to docu-ment these conditions, describes the physical characteristics of the site, documents the nature and extent of contamination, integrates this information to form a conceptual model of the site with respect to the transport and fate of contaminants, and summarizes these results in terms of risks posed to both the aquatic ecosystem and human health.
This introductory section provides background of the site including summaries of the mining history and ownership, and previous and concurrent activities at the site. The second sec-tion describes the approach used to identify sites for detailed study, and the methods employed to investigate surface water, sediment pore water, sediment, and biota characteristics, and toxicity testing. The third section describes the physical setting of the site including the historical mining landscape, geomor-phology and surface-water hydrology of the watershed, depo-sitional sites within the streams, and biologic and ecologic features. The next section documents the nature and extent of contamination in Ely and Schoolhouse Brooks, and in the Ompompanoosuc River in surface water, pore water, and sedi-ments in terms of water-quality parameters, concentrations of metals, other inorganic constituents, organic constituents, and contaminant loads for comparison with biologic indicators of aquatic ecosystem health. The Discussion integrates the results of the previous sections to produce an integrated model describing the transport and fate of contaminants away from source areas. Implications of the aquatic ecosystem remedial investigation to a baseline ecological assessment of the site are discussed. The last section is a brief summary of the conclu-sions of the study.
Site Background
The Ely Copper Mine Superfund site is located in a rural area on Beanville Road, Vershire, Orange County, VT, in the watershed of Schoolhouse Brook—a tributary of the Ompom-panooosuc River; the West Branch of the Ompompanoosuc River includes the Elizabeth Mine Superfund site, south of the Ely site (fig. 1). The site encompasses approximately 730 hectares (ha), of which 110 to 140 ha were used for

Introduction 3
Strafford
Thetford
Fairlee
Vershire
West Fairlee
Norwich
Con
nect
icut
Riv
er
LakeFairlee
Om
pom
pano
osuc
Riv
er
Con
nect
icut
Riv
er
ORT-1080M
Vermont
SB-140M
OR-24500M
OR-24050M
ORT-1080M
OR-11800M
OR-15000M
OR-17400M
OR-19150M
OR-19560M
OR-22390M OR-22450M
OR-24150M
SB-540M
OR-20200M
OR-22320M
SB-490M OR-23650M
SB-35M
OR-8350M
SB-2400MSB-1360M
SB-1140M
EB-1430M
ORT-1190M
ORT-1150M
OR-23200M
OR-15200M
OR-11850M
72°12'72°17'30"
43°55'30"
43°50'
See figure 2
Hydrography base from 1:24,000-scale,National Hydrography Dataset, 1999.Political boundaries from 1:24,000-scale,USGS Digital Line Graphs, 1994. Roads from ESRI Street Atlas, 2007.
"
"
Vermont
New
Hampshire
OR-23630M
SB-20M
§̈5
1 1 3
244
1 3 2
1 1 3
0 1 20.5 MILES
0 1 20.5 KILOMETERS
Con
nect
icut
Ri v
er
VermontCopperBelt
Concord
NEWHAMPSHIRE
VERMONT
StudyArea
Montpelier
Union Village Dam
Elizabethmine
Fish and macroinvertebratecommunity and fish tissue
Fish tissue and community
Surface and pore water
Surface water
Sediment
Datasets
OR-8350MTownshipSample location and site number
Stream, river
Lake, pond
EXPLANATION
Dam
Mine
Symbols
Figure 1. Sampling location numbers and identifiers for data collected in the Ompompanoosuc River and Schoolhouse Brook, Vershire, VT. Also shown are the locations of the Elizabeth Mine Superfund site, and the Union Village Dam just below the confluence of the West Branch of the Ompompanoosuc River with the Ompompanoosuc River.

4 Aquatic Assessment of the Ely Copper Mine Superfund Site, Vershire, Vermont
!!!
!
!!
!
!
!
!!
!!
!!
!
!!
!
!
!!
!!
!!
!!
!
!
!
!!
!!!
! !! !
!!!
!
!
!
!
!
!
!
!
!
!!
!!
!
!
!
!!
!!!!
!!
!!
!
!
!
!
!
!
!!!
!!
!
! !
!
!
!
!
!
!
!!
!
!
!
!
Vershire
Hydrography from 1:24,000-scale,National Hydrography Dataset, 1999.Roads from ESRI Street Atlas, 2007.Contours and roads within contous fromCherau and others, 2005.
EM-SEEP 1
EM-SEEP 20
EM-SEEP 6
EM-SEEP 3
EM-SEEP 4EM-SEEP 5
EM-SEEP 2
EM-SEEP 17EM-SEEP 15
EM-SEEP 18EM-SEEP 19
EM-SEEP 12
EM-SEEP 7
EM-SEEP 16EM-SEEP 8
EBT2-383MEM-SEEP 14
EBT2-265MEBT2-255MEBT2-245M
EBT5-60M
EB-610M
EM-SEEP 11EBT2-78M
EBT2-55M
EBT2-67M
EM-SEEP 10
EBT2-120M
EB-515MEB-465M
EBT1-105M
EBT1-32M
SB-2860M
SB-2940M
SB-2960M
SB-3100M
SB-3255M
SB-3290M
"&
"&
"&
"&
"&
"&
"&
"&
"&
"&
"&
EB-865M
EBT3-230M
EB-535M
EB-190M
EB-20MSB-3260M
EB-815M
EBT4-25M
EBT2-315M
EBT2-430M
EBT2-185M
"&
"&
"&"&
"&
"&
"&
"&"&
EBT3-60M
EBT2-58MEB-560M
EBT2-23MEBT2-7M
EB-530M
EB-440M
"& EB-405M
"& EBT1-10M
"&EBT1-110M
"&EM-SEEP13
"&EB-210M
EB-30M
"&EB-15MSB-3245M
SB-3250M
SB-3250M
SB-3300M
"&
"&
"&
SB-3510M"&
SB-2920M"&SBT1-6M"& "&SB-2900M
EB-1080M
"& EB-770M
"&EB-600M
EB-90M"&SB-3670M
"&SB-3125M
SB-3185M
SB-3220M
SB-3320M"&
SB-3395M
EM-POND1
EM-POND2EM-POND3
EM-POND4
EM-POND5
"&EM-POND6
EXPLANATION
Datasets
Fish tissue andcommunity
Macroinvertebratecommunity
Fish and macro-invertebratecommunity and fish tissue
"&
"&
"&"&
"&
Mine waste pile
Pond
Sample locationand site number
EB-325M
EBT3-180MEM-SEEP 21
EM-SEEP 9EBT3-120M
EBT3-84M
SBT1-57M
"& EB-1030M
"&
"&SB-3020M
Ely
Brook
Surface water
Surface and pore water
Sediment
!
0 400200 FEET
0 10050 METERS
72°17'72°17'20"
43°55'40"
43°55'20"
43°55'
"&Schoolhouse Brook
Symbols
Figure 2. Sampling location numbers and identifiers for data collected at the Ely Mine Superfund site, Vershire, VT.

Study Approach and Methodology 5
mining activities between 1821 and 1920 with peak produc-tion in the 1870s and 1880s (Kierstead, 2001). Mining ceased in 1905, but during World War I, a flotation mill constructed onsite processed material from ore dumps. The property is currently owned by Ely Mine Forest, Inc., and Green Crow Corporation.
The site extends up the Ely Brook watershed to the crest of the ridge (fig. 2). Near the top of the ridge, a series of adits and inclined shafts accessed the ore body in a northeasterly direction. Extending downslope from the main shaft is a series of waste-rock piles and a small area of flotation tailings, fol-lowed by roast beds and finally the smelter site, including a large slag pile on the banks of Schoolhouse Brook. Two main tributaries combine to form Ely Brook. One tributary flows in a southerly direction from the area west of the mine workings; the other flows in a southwesterly direction through a series of ponds east of the mine workings. Both main tributaries converge in the lower waste piles to form the main channel of Ely Brook.
The Ely Mine site has been the subject of numerous geo-logical and environmental studies, some of which predated the remedial investigation initiated by USEPA in 2000. Early sum-maries of the geology and mining history of the Ely Mine are provided by Wheeler (1883), Smyth and Smith (1904), Weed (1911), Buerger (1935), White and Eric (1944), Hermance and others (1949), and Abbott (1973). More recently, the geology of the Ely Mine has been described by Slack and others (1993; 2001) and Offield and others (1993), and the mining his-tory has been discussed by Kierstead (2001) and Cherau and others (2005).
Environmental investigations at the site prior to place-ment on the National Priorities list include studies by the Ver-mont Agency of Natural Resources (ANR), the U.S. Bureau of Mines (USBM), and the USGS. The Vermont ANR evalu-ated the fish community around the site in 1988. The USBM conducted bench-scale pilot tests of passive treatment of acid-mine drainage at the site (McSurdy and others, 1995). The USGS presented preliminary results of investigations of mine-waste and mine-drainage characteristics (Hammarstrom and others, 2001a, b; Seal and others, 2001). They also investi-gated the environmental mineralogy and geochemistry of slag from the site (Piatak and others, 2003, 2004).
The remedial investigation, to date, has included a number of studies on the environmental characteristics and mining history of the site. At the request of the USEPA, the U.S. Army Corps of Engineers (USACE) and the USGS collaborated on a study on spring runoff in 2002 (Holmes and others, 2002). The USGS investigated the geochemical characteristics of mine waste at the Ely Mine (Piatak and others, 2004). In the course of the remedial investigations, the USEPA and its contrac-tors have conducted surface-water (2005, 2006) and sediment (2000–2001, 2004, 2006) sampling and bioassays (2006) of surface waters [Agency for Toxic Substances and Disease Reg-istry (ATSDR), 2008; TechLaw, 2008; URS Corporation, 2009]. The mining history of the site has also been summarized by Cherau and others (2005) as part of the remedial investigation.
Study Approach and MethodologyThis study included a physical characterization of the
water bodies in the Ely Mine study area; a chemical analysis of surface water, pore water, and sediment; toxicity test-ing of surface waters, pore waters, and bulk sediments; and a biological analysis of aquatic macroinvertebrate and fish assemblages. The purpose of analyzing these various com-ponents in the study was to provide an ecological evaluation that was more comprehensive than one based on the tradi-tional triad approach of sediment chemistry, toxicity testing, and infaunal community composition (Long and Chapman, 1985). The study included 12 stream (lotic) locations, each delineated with a 100-m sampling reach, and six pond (lentic) locations. Water samples were collected during August and September 2006. Surface-water samples were collected at the 12 stream locations: 4 on Ely Brook, 5 on Schoolhouse Brook, and 3 on the Ompompanoosuc River (figs. 1 and 2; table 1). Areas of sediment deposition were not found in 2 of the 12 stream locations, and therefore pore-water and sediment samples were collected at 10 stream locations: 4 on Ely Brook, 4 on Schoolhouse Brook, and 2 on the Ompompanoosuc River (figs. 1 and 2; table 1). During September 2006, benthic invertebrate assemblages were sampled, fish assemblages were surveyed, and fish tissue was collected for contaminant analy-sis. Within the stream reaches at 12 locations, macroinver-tebrate assemblages were sampled in riffle habitats, and fish assemblages were surveyed and fish tissue collected along the reach; invertebrate assemblages in depositional habitats were sampled at 10 of these reaches (figs. 1 and 2; table 1). Surface-water and sediment samples were collected at six ponds along a tributary to Ely Brook in September 2006. During October 2006, invertebrate assemblages were also sampled in six hydraulically connected ponds located within the watershed of the mine (figs. 1 and 2; table 1).
Selection of Sample Locations
A qualitative geomorphologic characterization of stream segments in Ely Brook, Schoolhouse Brook, and the Ompompanoosuc River was conducted in June 2006 to assist in determining optimum stream sampling locations where the collection and analysis of surface water, pore water, sediment, macroinvertebrates, and fish would provide an understand-ing of the relative magnitude of contaminants at the site and their effects on aquatic biota. Based on the characterization, sampling locations were selected to provide a more holistic understanding of the differences in surface water, pore water, and sediment chemistry in a stream system affected by acid-rock drainage and the effects to aquatic biota. Where possible, samples were obtained in stream reaches that contained areas of deposition (pools) and areas of greater velocity (riffles).
Latitudes and longitudes for the geomorphologic char-acterization were determined with a 10-hertz (Hz) Trimble AgGPS 132 receiver and integrated with ESRI ArcMap

6 Aquatic Assessment of the Ely Copper Mine Superfund Site, Vershire, Vermont
Table 1. Select characteristics for sampling locations at the Ely Mine study area, Vershire, VT.—Continued
[URS, URS Corporation; CRREL, U.S. Army Corps of Engineers Cold Regions Research and Engineering Laboratory; ADL, Arthur D. Little, Incorporated; EPA, U.S. Environmental Protection Agency; USGS, U.S. Geological Survey; latitude and longitude are given in decimal degrees; SW, surface water; Sed, sediment; PW, pore water; B, benthic invertebrate; F, fish; Tox, toxicity test]
Site number StreamRiver
metera Latitude Longitude Datasets Historical nameSampling
organization
EB-15M Ely Brook 15 43.91857 –72.28655 SW, Sed EB-6, ELYM-8-SS, EB-PPT
CRREL, USGS
EB-20M Ely Brook 20 43.91864 –72.28664 Sed 06Ely11 USGSEB-30M Ely Brook 30 43.91873 –72.28651 SW, Sed SW-09, SED-09 URSEB-90M Ely Brook 90 43.91924 –72.28629 SW, PW, Sed,
B, ToxSite 4, 06Ely04, EB7,
EMTT-3, LOC-49USGS, EPA,
ADLEB-190M Ely Brook 190 43.92012 –72.28595 Sed SED5 EPAEB-210M Ely Brook 210 43.92028 –72.28590 SW, Sed SW-10, SED-10 URSEB-325M Ely Brook 325 43.92134 –72.28601 SW SW-39 URS
Ely Brook 350 Confluence with Ely Brook Tributary 1
EB-405M Ely Brook 405 43.92203 –72.28604 SW, Sed SW-33, SED-33 URSEB-440M Ely Brook 440 43.92237 –72.28590 SW, Sed LOC-59, SW-11 SED-11 ADL, URSEB-465M Ely Brook 465 43.92255 –72.28579 SW EB-5 CRRELEB-515M Ely Brook 515 43.92303 –72.28563 SW EB5, SED4 EPAEB-530M Ely Brook 530 43.92313 –72.28574 SW, Sed SW-12, SED-12 URSEB-535M Ely Brook 535 43.92333 –72.28583 Sed ELY-EB-SS USGS
Ely Brook 540 Confluence with Ely Brook Tributary 2
EB-560M Ely Brook 560 43.92339 –72.28564 SW, Sed SW-13, SED-13 URSEB-600M Ely Brook 600 43.92360 –72.28576 SW, PW, Sed, B Site 3, 06Ely03 USGSEB-610M Ely Brook 610 43.92370 –72.28566 SW LOC-57 ADLEB-770M Ely Brook 770 43.92524 –72.28552 SW, PW, Sed, B Site 2, 06Ely02, SW-40 USGS, URS
Ely Brook 800 Confluence with Ely Brook Tributary 4
EB-815M Ely Brook 815 43.92545 –72.28596 SW, Sed SW-17, SED-17 URSEB-865M Ely Brook 865 43.92562 –72.28650 Sed SED3 EPAEB-1030M Ely Brook 1,030 43.92710 –72.28650 SW, Sed SW-18, SED-18 URSEB-1080M Ely Brook 1,080 43.92746 –72.28667 SW, PW, Sed, B EB-1, Site 1, 06Ely01,
SED1CRREL, USGS,
EPAEB-1430M Ely Brook 1,430 43.92984 –72.28875 SW, Sed SW-20, SED-20 URSEBT1-10M Ely Brook Trib 1 10 43.92160 –72.28584 SW, Sed SW-34, SED-34 URSEBT1-32M Ely Brook Trib 1 32 43.92169 –72.28560 SW EB6 EPAEBT1-105M Ely Brook Trib 1 105 43.92204 –72.28487 SW EB-7 CRRELEBT1-110M Ely Brook Trib 1 110 43.92208 –72.28484 SW, Sed SW-36, SED-36 URSEBT2-7M Ely Brook Trib 2 7 43.92323 –72.28566 SW, Sed SW-32, SED-32 URSEBT2-23M Ely Brook Trib 2 23 43.92336 –72.28556 SW, Sed SW-31, SED-31 URS
Ely Brook Trib 2 50 Confluence with Ely Brook Tributary 3
EBT2-55M Ely Brook Trib 2 55 43.92357 –72.28535 SW EB3 EPAEBT2-58M Ely Brook Trib 2 58 43.92358 –72.28531 SW, Sed SW-14, SED-14 URSEBT2-67M Ely Brook Trib 2 67 43.92336 –72.28509 SW LOC-58 ADLEBT2-78M Ely Brook Trib 2 78 43.92359 –72.28507 SW EB-3 CRRELEBT2-120M Ely Brook Trib 2 120 43.92341 –72.28564 SW EB4 EPA
Ely Brook Trib 2 125 Confluence with Ely Brook Tributary 5

Introduction 7
Table 1. Select characteristics for sampling locations at the Ely Mine study area, Vershire, VT.—Continued
[URS, URS Corporation; CRREL, U.S. Army Corps of Engineers Cold Regions Research and Engineering Laboratory; ADL, Arthur D. Little, Incorporated; EPA, U.S. Environmental Protection Agency; USGS, U.S. Geological Survey; latitude and longitude are given in decimal degrees; SW, surface water; Sed, sediment; PW, pore water; B, benthic invertebrate; F, fish; Tox, toxicity test]
Site number StreamRiver
metera Latitude Longitude Datasets Historical nameSampling
organization
EBT2-185M Ely Brook Trib 2 185 43.92420 –72.28450 SW,Sed SW-37, SED-37 URSEM-POND6 Pond 195 43.92417 –72.28432 SW, Sed, B, Tox Pond 6, 06ElyPond6 USGS, EPAEBT2-245M Ely Brook Trib 2 245 43.92454 –72.28419 Tox EMTT-2 EPAEBT2-255M Ely Brook Trib 2 255 43.92464 –72.28411 SW SW-41 URSEBT2-265M Ely Brook Trib 2 265 43.92468 –72.28404 SW EB-2 CRRELEM-POND5 Pond 290 43.92497 –72.28397 SW, Sed, B, Tox Pond 5, 06ElyPond5 USGS, EPAEBT2-315M Ely Brook Trib 2 315 43.92503 –72.28374 SW, Sed SW-16, SED-16 URSEM-POND4 Pond 320 43.92510 –72.28368 SW, Sed, B, Tox Pond 4, 06ElyPond4,
EMTT-1 REFUSGS, EPA
EM-POND3 Pond 345 43.92514 –72.28334 SW, Sed, B, Tox Pond 3, 06ElyPond3 USGS, EPAEBT2-383M Ely Brook Trib 2 383 43.92531 –72.28302 SW EB-2a CRRELEM-POND2 Pond 385 43.92526 –72.28282 SW, Sed, B, Tox Pond 2, 06ElyPond2 USGS, EPAEBT2-430M Ely Brook Trib 2 430 43.92541 –72.28249 SW, Sed SW-21, SED-21 URSEM-POND1 Pond 432 43.92557 –72.28213 SW, Sed, B Pond 1, 06ElyPond1 USGSEBT3-60M Ely Brook Trib 3 60 43.92369 –72.28532 SW, Sed SW-30, SED-30 URSEBT3-84M Ely Brook Trib 3 84 43.92388 –72.28520 SW EB-4 CRRELEBT3-120M Ely Brook Trib 3 120 43.92421 –72.28512 SW EB2 EPAEBT3-180M Ely Brook Trib 3 180 43.92469 –72.28491 SW EB1 EPAEBT3-230M Ely Brook Trib 3 230 43.92500 –72.28444 Sed ELY-SS-2 USGSEBT4-25M Ely Brook Trib 4 25 43.92558 –72.28563 SW, Sed SW-29, SED-29 URSEBT5-60M Ely Brook Trib 5 60 43.92388 –72.28411 SW SW-51 URSSB-20M Schoolhouse Bk 20 43.90535 –72.25874 SW, Sed, Tox SW-27, SED-27, EMTT-8 URS, EPASB-35M Schoolhouse Bk 35 43.90549 –72.25894 SW SB11 EPASB-140M Schoolhouse Bk 140 43.90490 –72.26012 SW, PW, Sed,
B, F, ToxSite 5, 06Ely08, SED9 USGS, EPA
SB-490M Schoolhouse Bk 490 43.90670 –72.26280 B, F Ely Bk station 0.4, F-17 ADLSB-540M Schoolhouse Bk 540 43.90699 –72.26271 SW SB-3 CRRELSB-1140M Schoolhouse Bk 1,140 43.91121 –72.26672 SW, Sed LOC-52 ADLSB-1360M Schoolhouse Bk 1,360 43.91144 –72.26925 SW, PW, Sed,
B, F, ToxSite 4, 06Ely07, SW-01,
SED-01USGS, URS
SB-2400M Schoolhouse Bk 2,400 43.91460 –72.27950 SW, PW, Sed, B, F, Tox
Site 3, 06Ely06, SED8 USGS, EPA
SB-2860M Schoolhouse Bk 2,860 43.91582 –72.28350 Tox EMTT-7 EPASB-2900M Schoolhouse Bk 2,900 43.91602 –72.28391 SW, Sed SW-02, SED-02 URS
Schoolhouse Bk 2,915 Confluence with Schoolhouse Brook Tributary
SB-2920M Schoolhouse Bk 2,920 43.91615 –72.28400 SW, Sed SW-03, SED-03 URSSB-2940M Schoolhouse Bk 2,940 43.91641 –72.28390 SW SB-2 CRRELSB-2960M Schoolhouse Bk 2,960 43.91653 –72.28403 SW LOC-51 ADLSB-3020M Schoolhouse Bk 3,020 43.91710 –72.28433 SW, Sed SW-04, SED-04 URSSB-3100M Schoolhouse Bk 3,100 43.91751 –72.28493 SW, Tox SB9, EMTT-6 EPASB-3125M Schoolhouse Bk 3,125 43.91770 –72.28526 SW, B, F, Tox Site 2, 06Ely19, SED7,
SW-05, SED-05USGS, EPA,
URS

8 Aquatic Assessment of the Ely Copper Mine Superfund Site, Vershire, Vermont
Table 1. Select characteristics for sampling locations at the Ely Mine study area, Vershire, VT.—Continued
[URS, URS Corporation; CRREL, U.S. Army Corps of Engineers Cold Regions Research and Engineering Laboratory; ADL, Arthur D. Little, Incorporated; EPA, U.S. Environmental Protection Agency; USGS, U.S. Geological Survey; latitude and longitude are given in decimal degrees; SW, surface water; Sed, sediment; PW, pore water; B, benthic invertebrate; F, fish; Tox, toxicity test]
Site number StreamRiver
metera Latitude Longitude Datasets Historical nameSampling
organization
SB-3185M Schoolhouse Bk 3,185 43.91806 –72.28583 F F-18 ADLSB-3220M Schoolhouse Bk 3,220 43.91800 –72.28590 B Ely Bk station 2.2 ADLSB-3245M Schoolhouse Bk 3,245 43.91847 –72.28625 Sed, Tox ELYM-10-SS, EMTT-5 USGS, EPASB-3250M Schoolhouse Bk 3,250 43.91837 –72.28634 SW, Sed SW-06, SED-06 URSSB-3255M Schoolhouse Bk 3,255 43.91850 –72.28638 SW SB8 EPASB-3260M Schoolhouse Bk 3,260 43.91853 –72.28642 Sed 06Ely12 USGS
Schoolhouse Bk 3,270 Confluence with Ely Brook
SB-3290M Schoolhouse Bk 3,290 43.91842 –72.28666 SW SB-1, SW-38 CRREL, URSSB-3300M Schoolhouse Bk 3,300 43.91835 –72.28689 SW, Sed LOC-48 ADLSB-3320M Schoolhouse Bk 3,320 43.91847 –72.28706 Sed, B ELYM-9-SS, Ely Bk
station 2.3USGS, ADL
SB-3395M Schoolhouse Bk 3,395 43.91833 –72.28778 F F-19 ADLSB-3510M Schoolhouse Bk 3,510 43.91911 –72.28838 SW, Sed SW-07, SED-07 URSSB-3670M Schoolhouse Bk 3,670 43.91951 –72.29015 SW, PW, Sed,
B, F, ToxSite 1, 06Ely05, SED6,
EMTT-4USGS, EPA
SBT1-6M Schoolhouse Bk Trib 6 43.91609 –72.28405 SW, Sed SW-25, SED-25 URSSBT1-57M Schoolhouse Bk Trib 57 43.91578 –72.28450 SW LOC-50 ADLOR-8350M Ompompanoosuc River 8,350 43.80691 –72.25970 SW, Sed LOC-45 ADLOR-11800M Ompompanoosuc River 11,800 43.83198 –72.25245 SW OM14 EPAOR-11850M Ompompanoosuc River 11,850 43.83226 –72.25290 SW, Sed LOC-35 ADLOR-15000M Ompompanoosuc River 15,000 43.84826 –72.25645 SW, F OR-3, F-11 CRREL, ADLOR-15200M Ompompanoosuc River 15,200 43.85003 –72.25800 SW, Sed LOC-56 ADLOR-17400M Ompompanoosuc River 17,400 43.86544 –72.26366 SW LOC-55 ADLOR-19150M Ompompanoosuc River 19,150 43.87300 –72.26360 SW LOC-54 ADLOR-19560M Ompompanoosuc River 19,560 43.88272 –72.26152 SW OM13 EPAOR-20200M Ompompanoosuc River 20,200 43.88430 –72.25637 Sed SED13 EPAOR-22320M Ompompanoosuc River 22,320 43.89595 –72.25971 Sed SED12 EPAOR-22390M Ompompanoosuc River 22,390 43.89647 –72.25965 SW OM12 EPAOR-22450M Ompompanoosuc River 22,450 43.89691 –72.25925 SW OR-2 CRRELOR-23200M Ompompanoosuc River 23,200 43.90215 –72.26101 SW, PW, Sed,
B, F, ToxSite 3, 06Ely10, SED11 USGS, EPA
OR-23630M Ompompanoosuc River 23,630 43.90521 –72.25854 SW, B, F, Tox Site 2, 06Ely20, SW-28, SED-28
USGS, URS
Ompompanoosuc River 23,640 Confluence with Schoolhouse Brook
OR-23650M Ompompanoosuc River 23,650 43.90541 –72.25855 SW, Sed SW-26, SED-26 URSOR-24050M Ompompanoosuc River 24,050 43.90812 –72.25928 SW, PW, Sed,
B, F, ToxSite 1, 06Ely09, SED10,
F-13USGS, EPA,
ADLOR-24150M Ompompanoosuc River 24,150 43.90915 –72.25990 SW OR-1 CRRELOR-24500M Ompompanoosuc River 24,500 43.91132 –72.26134 SW, Sed LOC-53 ADL
Ompompanoosuc River 27,450 Confluence with Ompompanoosuc River Tributary

Introduction 9
Table 1. Select characteristics for sampling locations at the Ely Mine study area, Vershire, VT.—Continued
[URS, URS Corporation; CRREL, U.S. Army Corps of Engineers Cold Regions Research and Engineering Laboratory; ADL, Arthur D. Little, Incorporated; EPA, U.S. Environmental Protection Agency; USGS, U.S. Geological Survey; latitude and longitude are given in decimal degrees; SW, surface water; Sed, sediment; PW, pore water; B, benthic invertebrate; F, fish; Tox, toxicity test]
Site number StreamRiver
metera Latitude Longitude Datasets Historical nameSampling
organization
ORT-1080M Ompompanoosuc R Trib 1,080 43.93313 –72.27888 SW, Sed SW-24, SED-24 URSORT-1150M Ompompanoosuc R Trib 1,150 43.93301 –72.27968 SW, Sed SW-23, SED-23 URSORT-1190M Ompompanoosuc R Trib 1,190 43.93303 –72.28025 SW, Sed SW-22, SED-22 URSEM-SEEP1 Seep 43.92760 –72.28518 SW ES-1 CRREL
EM-SEEP2 Seep 43.92662 –72.28455 SW ES-2 CRREL
EM-SEEP3 Seep 43.92726 –72.28471 SW ES-3 CRREL
EM-SEEP4 Seep 43.92694 –72.28427 SW ES-4 CRREL
EM-SEEP5 Seep 43.92692 –72.28421 SW ES-5 CRREL
EM-SEEP6 Seep 43.92675 –72.28313 SW ES-6 CRREL
EM-SEEP7 Seep 43.92590 –72.28323 SW ES-7 CRREL
EM-SEEP8 Seep 43.92583 –72.28424 SW ES-8 CRREL
EM-SEEP9 Seep 43.92423 –72.28511 SW ES-9 CRREL
EM-SEEP10 Seep 43.92328 –72.28525 SW ES-10 CRREL
EM-SEEP11 Seep 43.92328 –72.28444 SW ES-11 CRREL
EM-SEEP12 Seep 43.92709 –72.28565 SW ES-12 CRREL
EM-SEEP13 Seep 43.92117 –72.28511 SW, Sed SW-35, SED-35 URS
EM-SEEP14 Seep 43.92509 –72.28398 SW SW-42 URS
EM-SEEP15 Seep 43.92645 –72.28414 SW SW-43 URS
EM-SEEP16 Seep 43.92577 –72.28425 SW SW-45 URS
EM-SEEP17 Seep 43.92657 –72.28456 SW SW-46 URS
EM-SEEP18 Seep 43.92700 –72.28500 SW SW-47 URS
EM-SEEP19 Seep 43.92698 –72.28561 SW SW-48 URS
EM-SEEP20 Seep 43.92752 –72.28422 SW SW-49 URS
EM-SEEP21 Seep 43.92438 –72.28499 SW SW-52 URSa River meter zero is located at the stream mouth.
10 Aquatic Assessment of the Ely Copper Mine Superfund Site, Vershire, Vermont
software. A differential global positioning system (DGPS) location was output to the software each second. Sub-meter DGPS accuracy was achieved using a differential signal from the Wide Area Augmentation System (WAAS).
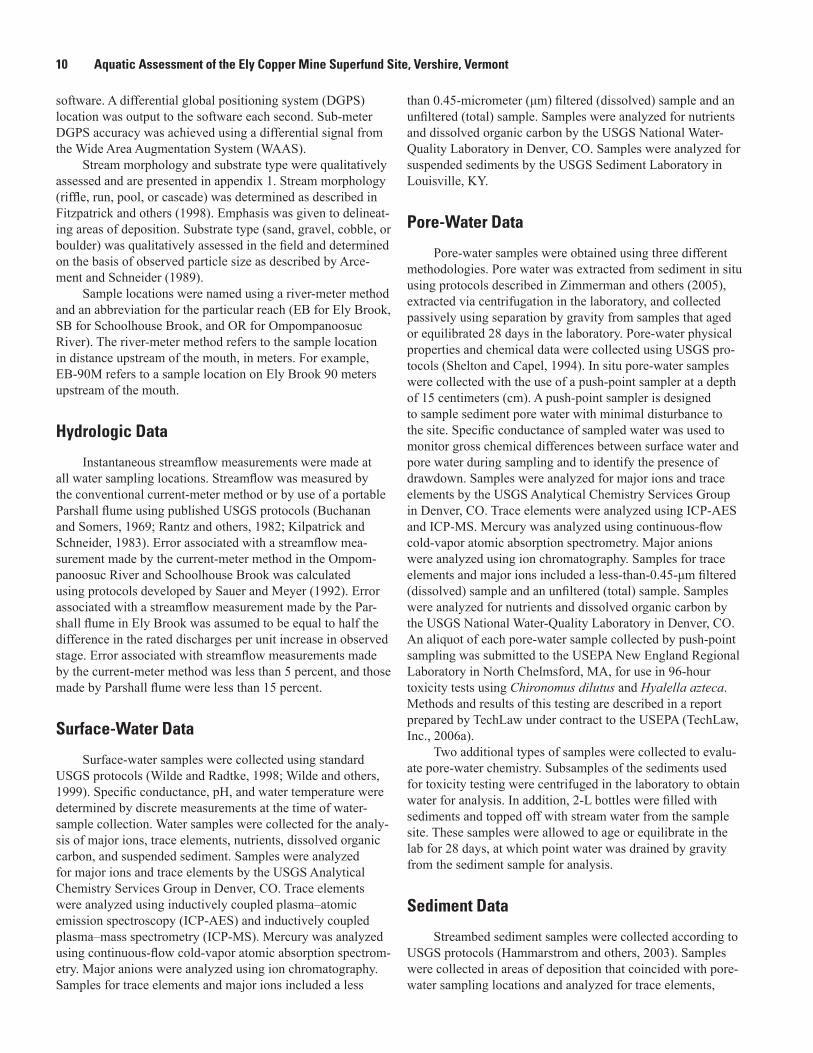
Stream morphology and substrate type were qualitatively assessed and are presented in appendix 1. Stream morphology (riffle, run, pool, or cascade) was determined as described in Fitzpatrick and others (1998). Emphasis was given to delineat-ing areas of deposition. Substrate type (sand, gravel, cobble, or boulder) was qualitatively assessed in the field and determined on the basis of observed particle size as described by Arce-ment and Schneider (1989).
Sample locations were named using a river-meter method and an abbreviation for the particular reach (EB for Ely Brook, SB for Schoolhouse Brook, and OR for Ompompanoosuc River). The river-meter method refers to the sample location in distance upstream of the mouth, in meters. For example, EB-90M refers to a sample location on Ely Brook 90 meters upstream of the mouth.
Hydrologic Data
Instantaneous streamflow measurements were made at all water sampling locations. Streamflow was measured by the conventional current-meter method or by use of a portable Parshall flume using published USGS protocols (Buchanan and Somers, 1969; Rantz and others, 1982; Kilpatrick and Schneider, 1983). Error associated with a streamflow mea-surement made by the current-meter method in the Ompom-panoosuc River and Schoolhouse Brook was calculated using protocols developed by Sauer and Meyer (1992). Error associated with a streamflow measurement made by the Par-shall flume in Ely Brook was assumed to be equal to half the difference in the rated discharges per unit increase in observed stage. Error associated with streamflow measurements made by the current-meter method was less than 5 percent, and those made by Parshall flume were less than 15 percent.
Surface-Water Data
Surface-water samples were collected using standard USGS protocols (Wilde and Radtke, 1998; Wilde and others, 1999). Specific conductance, pH, and water temperature were determined by discrete measurements at the time of water-sample collection. Water samples were collected for the analy-sis of major ions, trace elements, nutrients, dissolved organic carbon, and suspended sediment. Samples were analyzed for major ions and trace elements by the USGS Analytical Chemistry Services Group in Denver, CO. Trace elements were analyzed using inductively coupled plasma–atomic emission spectroscopy (ICP-AES) and inductively coupled plasma–mass spectrometry (ICP-MS). Mercury was analyzed using continuous-flow cold-vapor atomic absorption spectrom-etry. Major anions were analyzed using ion chromatography. Samples for trace elements and major ions included a less
than 0.45-micrometer (μm) filtered (dissolved) sample and an unfiltered (total) sample. Samples were analyzed for nutrients and dissolved organic carbon by the USGS National Water-Quality Laboratory in Denver, CO. Samples were analyzed for suspended sediments by the USGS Sediment Laboratory in Louisville, KY.
Pore-Water Data
Pore-water samples were obtained using three different methodologies. Pore water was extracted from sediment in situ using protocols described in Zimmerman and others (2005), extracted via centrifugation in the laboratory, and collected passively using separation by gravity from samples that aged or equilibrated 28 days in the laboratory. Pore-water physical properties and chemical data were collected using USGS pro-tocols (Shelton and Capel, 1994). In situ pore-water samples were collected with the use of a push-point sampler at a depth of 15 centimeters (cm). A push-point sampler is designed to sample sediment pore water with minimal disturbance to the site. Specific conductance of sampled water was used to monitor gross chemical differences between surface water and pore water during sampling and to identify the presence of drawdown. Samples were analyzed for major ions and trace elements by the USGS Analytical Chemistry Services Group in Denver, CO. Trace elements were analyzed using ICP-AES and ICP-MS. Mercury was analyzed using continuous-flow cold-vapor atomic absorption spectrometry. Major anions were analyzed using ion chromatography. Samples for trace elements and major ions included a less-than-0.45-μm filtered (dissolved) sample and an unfiltered (total) sample. Samples were analyzed for nutrients and dissolved organic carbon by the USGS National Water-Quality Laboratory in Denver, CO. An aliquot of each pore-water sample collected by push-point sampling was submitted to the USEPA New England Regional Laboratory in North Chelmsford, MA, for use in 96-hour toxicity tests using Chironomus dilutus and Hyalella azteca. Methods and results of this testing are described in a report prepared by TechLaw under contract to the USEPA (TechLaw, Inc., 2006a).
Two additional types of samples were collected to evalu-ate pore-water chemistry. Subsamples of the sediments used for toxicity testing were centrifuged in the laboratory to obtain water for analysis. In addition, 2-L bottles were filled with sediments and topped off with stream water from the sample site. These samples were allowed to age or equilibrate in the lab for 28 days, at which point water was drained by gravity from the sediment sample for analysis.
Sediment Data
Streambed sediment samples were collected according to USGS protocols (Hammarstrom and others, 2003). Samples were collected in areas of deposition that coincided with pore-water sampling locations and analyzed for trace elements,
Study Approach and Methodology 11
simultaneously extractable metals–acid volatile sulfide (SEM-AVS), grain size, total organic carbon (TOC), cation-exchange capacity, and ash-free dry weight. Samples were collected from undisturbed, continuously wetted depositional zones in the stream channel. The top 10 cm of streambed sediment were sampled to obtain only the most recently deposited mate-rial. Composited samples were collected with 5 to 10 represen-tative subsamples located across the stream channel. Samples were analyzed for trace elements using ICP-AES, TOC using an elemental analyzer, and mercury using continuous-flow cold-vapor atomic absorption spectrometry by the USGS Analytical Chemistry Services Group in Denver, CO. Samples were analyzed for SEM-AVS and grain size by Severn Trent Laboratory in Colchester, VT.
Potential sediment toxicity can be assessed either by comparing sediment geochemical concentrations to a probable effects concentration for various elements (PEC; MacDon-ald and others, 2000) or by investigating the equilibrium- partitioning sediment benchmark (ESB). The PEC for each chemical represents a concentration above which toxicity has been observed in toxicity tests from many sites. The ESB is defined as the molar difference between the combined simul-taneously extractable metals (SEM; Cd + Cu + Ni + Pb + Zn) and the acid volatile sulfide (AVS), normalized to the fraction of organic carbon (OC) on a mass basis (fOC; [SSEM–AVS]/fOC; Di Toro and others, 2005; USEPA, 2005).
Macroinvertebrate Data
Macroinvertebrate samples were collected to coincide with water-chemistry sampling locations. The procedures in the USGS protocols for collecting biological samples (Moulton and others, 2002) were followed with some minor modifications described below that were based on State of Ver-mont protocols [Vermont Department of Environmental Con-servation (VTDEC), 2006]. Because this study was designed to characterize the nature and extent of acid-mine drainage within the aquatic system, three different types of invertebrate samples were collected, each of which was specific to the hab-itat being sampled. The first of these samples was from areas representative of a riffle-targeted habitat (RTH) to characterize the effects of contaminants in surface water on invertebrate assemblage structure. The second of these samples was from areas representative of a depositional-targeted habitat (DTH), such as pools, to characterize the effects of contaminants in depositional sediments and interstitial pore water on inverte-brate assemblage structure. At 10 of the 12 stream-reach loca-tions, RTH and DTH samples were closely paired to assess the condition of the epifaunal (RTH) and infaunal (DTH) inver-tebrate assemblage. The purpose of using these two sample types was to determine if the degree of impairment from acid-mine drainage differed in the two assemblage types. The State of Vermont Bioassessment Program uses epifaunal assemblage data collected from riffle areas as the basis for stream assess-ments in lotic habitats (VTDEC, 2006), whereas the USEPA
Superfund program emphasizes the ecological importance of assessing infauna in the depositional areas, because contami-nated sediments tend to collect in the slow-flowing areas.
A third type of invertebrate sample, collected from the ponds, was a qualitative multi-habitat (QMH) sample. The QMH samples characterized the epifaunal invertebrate assem-blages that were most closely associated with the vegetation along the littoral areas of the ponds, which typically supports assemblages with the greatest abundance and diversity in lentic systems.
RTH samples were collected using a Slack sampler with a 500-μm mesh designed to cover 0.25 square meter (m2) of substrate area (Moulton and others, 2002). At each location, invertebrates were collected at four locations in a swift-flowing area of a sampling reach, and these four samples were composited to represent the invertebrate assemblage on a 1-m2 area of substrate. This procedure is a slight deviation from the USGS protocol, which specifies a composite from five loca-tions (1.25 m2), but the change was made so that the assem-blage data would conform to the method used by the VTDEC for high-gradient streams (VTDEC, 2006), and therefore be amenable to the bioassessment procedures used by VTDEC.
DTH samples of infaunal invertebrates were collected with a PVC coring device designed to sample the top 10 cm of sediment in an area of approximately 100 square centimeters (cm2). At each location, sediments were sampled at five loca-tions in depositional areas of a sampling reach, and these five samples were composited to represent the infaunal assemblage on a 500-cm2 area of substrate. Sediment samples were col-lected by pushing the coring device into the sediment and then working a mason’s trowel through the sediment to close off the bottom.
QMH samples were collected in the littoral areas along the edges of the ponds that were dominated by vegetation, wood snags, or both, to characterize the invertebrate assem-blage structure within the pond. The QMH samples were collected with an invertebrate kick-net sampler with a 500-μm mesh designed to cover 0.1 m2 of substrate. At each location, a composite QMH sample was collected by making four sweeps of equal effort in each of four locations. Although these samples were designated as “qualitative,” using equal effort in collecting the samples resulted in an approximate relative-abundance measure that could be compared among locations (VTDEC, 2006).
Samples were preserved in 70-percent isopropyl alcohol and shipped to EcoAnalysts Inc., Moscow, ID, for taxonomic identifications and calculation of metrics of abundance, dominance, richness, composition, functional feeding groups, diversity/evenness, and biotic indices. A minimum of 300 indi-viduals or 25 percent of the sample was counted and identified for each sample. The RTH data also were provided to VTDEC so that the agency could conduct a biological assessment of the data and determine the extent of impairment to the streams.

12 Aquatic Assessment of the Ely Copper Mine Superfund Site, Vershire, Vermont
Fish Assemblage Data
Fish assemblages were surveyed in the field following USGS protocols (Crawford and Luoma, 1993; Moulton and others, 2002). Fish were collected by electrofishing with a backpack unit along the 100-m reach that was associated with each of the water-chemistry sampling location in Schoolhouse Brook (five locations) and the Ompompanoosuc River (three locations) (figs. 1 and 2). The fish surveys were conducted with the use of a single backpack unit in Schoolhouse Brook and with the use of two backpack units in the Ompompa-noosuc River.1 Fish were weighed, measured, and released, except for those specimens used for tissue samples for analysis of trace element concentrations. These fish were whole-body samples that used single fish for brook trout and composites of five to eight fish for blacknose dace. Fish tissue samples were freeze-dried, water loss during drying was measured, and samples were analyzed for trace elements using ICP-MS and for mercury using continuous-flow cold-vapor atomic absorp-tion spectrometry by the USGS Analytical Chemistry Services Group in Denver, CO.
Toxicity Tests
Toxicity tests have been performed on surface water, whole sediment, and sediment pore water at the Ely Mine site. Surface-water toxicity testing using the water flea Ceriodaph-nia dubia and the fathead minnow Pimephales promelas were performed at the USEPA New England Regional Laboratory in North Chelmsford, MA, in 2006. Methods and results are described by TechLaw, Inc. (TechLaw, Inc., 2006b). Whole sediment samples and pore water samples were collected at 10 sampling locations in August 2006. The toxicity of whole sediments was evaluated using 28-day exposures with the amphipod Hyalella azteca and 10-day exposures with the midge Chironomus dilutus, with endpoints of survival for both species, length of amphipods, and ash-free dry weight (AFDW) of midges. Tests were conducted and evaluated by the USGS Columbia Environmental Research Center (CERC) in Columbia, MO, according to standard methods for conducting whole-sediment toxicity tests (USEPA, 2000; ASTM, 2007) (appendix 1). Amphipod and midge exposures were conducted in 300-milliliter (mL) exposure chambers containing 100-mL sediment and 175-mL overlying water at 23 ± 1 °C. Tests with each of 11 Ely Mine sediments and one control sediment (a wetted soil from Florissant, MO) had 8 replicate chambers for each species, with 10 organisms in each chamber. Overlying water in test chambers was well water, diluted with deionized water to target hardness of 100 mg/L
1 The Ompompanoosuc River location below the confluence of School-house Brook (OR-23200M) was resurveyed in August 2007 with a single backpack unit. The number of fish originally captured at this location in 2006 was lower than expected, which could be attributed to effects from acid-rock drainage, limited habitat features, or collection bias. Resurveying the location helped determine if abundance was affected by acid-mine drainage contamina-tion (for example, if low abundance both times) or sampling efficiency (for example, if abundance was significantly higher when resurveyed).
as CaCO3. Overlying water in test chambers was renewed by an automatic water delivery system to deliver two volume replacements per day. Water quality of overlying water was monitored biweekly.
The toxicity of pore water was evaluated by USEPA as described by TechLaw, Inc. (TechLaw, 2006a). Pore waters for toxicity testing were extracted from each of the sediment samples by centrifugation and filtration (0.45 µm), and by in situ sampling. Aliquots of each sample were analyzed by the USGS Analytical Chemistry Services Group in Denver, CO. The toxicity of in situ pore waters was evaluated using 96-hour exposures with the amphipod Hyalella azteca and with the midge Chironomus dilutus, with endpoints of survival for both species.
In addition, toxicity testing also was done by USEPA for the ponds along the tributary to Ely Brook to the northeast. These tests included survival of fathead minnows and the hatching efficiency of wood frog (Rana sylvatica) eggs and the survival of their tadpoles (TetraLaw, Inc., 2008).
As an additional measure of risk within the ponds, USEPA performed in situ amphibian embryo-larval toxicity testing in 2007 (TechLaw, Inc., 2008). For these tests, wood frog egg masses were collected from an offsite reference pond and placed within enclosures in Ely Mine ponds 1, 4, and 5.
Quality-Control Procedures
Field quality-control procedures for samples collected in August 2006 included the collection of blanks and replicates for surface- and pore-water samples and replicates for sedi-ment samples. Quality-control data for all media are presented in appendixes in 2, 3, and 4. Standard reference materials were submitted along with water and sediment samples. Field blanks provide information on bias or the potential for con-tamination of analytical results by sample collection, process-ing, and analysis (Spahr and Boulger, 1997). Concentrations of most constituents discussed in this report were below detec-tion limits for the field-blank samples with the exception being zinc. Total zinc concentrations of 1.3 and 1.9 micrograms per liter (µg/L) were reported for surface- and pore-water field-blank samples. Field-replicate samples provide information on the variability of results (Spahr and Boulger, 1997). The absolute difference between environmental and replicate water samples for constituent concentrations discussed in this report ranged from 0 to 11 µg/L. Analytical laboratory quality- control procedures are summarized in Taggart (2002).
Data Analysis and Statistical Methods
Selected results from data in Argue and others (2008) and from this study are presented in the following sections and are shown as a series of graphs and plots used to analyze the data. For samples where multiple analytical methods were used, preference was given to the method with the lower reporting limit.
Chronic criteria standards for the protection of aquatic biota were used to compare trace-element concentrations in

Study Approach and Methodology 13
water from data in Argue and others (2008) and from this study to water-quality guidelines and will be referred to as ambi-ent water-quality criteria (AWQC). State of Vermont AWQC chronic criteria standards (VTAWQC) were used for analysis of As, Cd, Cr, Cu, Fe, Pb, Hg, Ni, Se, Ag, and Zn concentra-tions [Vermont Natural Resources Board (VTNRB), 2006]. The chronic toxicity standards for Cd, Cu, Pb, Ni, Ag, and Zn were adjusted based on hardness according to the VTAWQC (VTNRB, 2006). Hardness values for samples in this report were calculated from concentrations of Ca and Mg, in mil-liequivalents per liter (meq/L). The USEPA National Recom-mended Water Quality Criterion Continuous Concentration standard was used for analysis of total aluminum (Al) con-centrations (USEPA, 2006). Tier II secondary chronic values summarized in Suter (1996) were used for analysis of dissolved concentrations of Sb, Ba, Be, Co, Mn, Sr, Tl, U, and V.
Consensus-based sediment quality guidelines developed by MacDonald and others (2000) were used to compare trace-element concentrations in stream sediment from this study to sediment-quality guidelines. The PEC was used for analysis of Cd, Cu, Pb, Ni, and Zn (MacDonald and others, 2000). Sediment toxicity is also assessed using the ESB (Di Toro and others, 2005; USEPA, 2005).
Water and sediment toxicity analysis was done using the hazard quotient (HQ) and hazard index (HI) methods (USEPA, 1986). The HQ is a ratio of the measured trace-element concentration to the chronic toxicity standard for that element. Trace elements with an HQ value greater than 1 have the potential to be toxic to aquatic communities. The HI is a sum of the HQ values for select constituents at each location and was used to describe the potential cumulative effect of contaminants on aquatic communities. Because of their con-centrations in the water, and sediment, their inclusion in the simultaneously extractable metals fraction, and their toxicity to aquatic biota, Cd, Cu, Pb, Ni, and Zn were used to calculate HI in this report.
A statistical analysis of water data in Argue and others (2008) and analysis of instantaneous constituent loads from the August 2006 samples were conducted to investigate the origin and transport of potential contaminants at the Ely site. Summary statistics for surface-water data were analyzed by SAS/STAT software (version 9.1; SAS Institute, Inc., 1998) and robust regression on order statistics (ROS), which uses a probability plot of the logarithms of data to account for datasets that includes multiple detection limits (Helsel and Cohn, 1988; Helsel, 2005). The Kruskal-Wallis statistical test, a non-parametric analysis of variance (ANOVA) test that uses ranked data, was performed using SAS/STAT statistical software (SAS Institute, Inc., 1998) to determine if there were statistical differences among Ely Brook tributaries, Ely Brook, Schoolhouse Brook, the Ompompanoosuc River, and back-ground conditions. The level of significance for ANOVA was set at alpha equal to 0.05. If a significant difference was found, the Tukey’s multiple-comparison test was used to determine which groups differed significantly (Helsel and Hirsch, 1992). Results of this analysis were examined among stream reaches
and background locations by use of box plots. Results below the maximum detection limit used in each analysis were considered estimated, and box plots for these values were expressed as dashed lines (Helsel, 2005).
The RTH invertebrate and fish survey data were provided to the VTDEC Water Quality Division, which analyzed the data as specified in their bioassessment protocols for wadeable streams and rivers (VTDEC, 2004) to determine the extent of impairment to the locations. The assessment of the ecologi-cal condition of a location was based on how the invertebrate or fish assemblage scored among several metric categories that characterized assemblage structure and function. A fish- assemblage assessment was indicated numerically from an index of biotic integrity (IBI), which was based on compiled scores of the individual structure and function metrics. Assess-ments based on RTH invertebrate assemblages did not rely on an IBI, but instead, each of eight metrics was scored against threshold values for pass, fail, or intermediate; the comprehen-sive assessment for each location is then based on a compila-tion of the eight qualitative scores. Depending how the inverte-brate assemblage scored over the eight metrics, or how the fish assemblage scored with the IBI, the assessment was qualita-tively summarized as poor, fair, good, very good, or excellent, which is pertinent to Vermont Class B water-quality standards. At the time of this study, VTDEC did not have an established protocol for assessing sites with DTH and QMH data.
Differences in fish assemblages among the locations were measured in two ways, both of which used the fish IBI to represent the assemblage condition at each location: The IBI scores were compared along the stream gradient (upstream to downstream) to determine where effects from acid-rock drain-age likely occurred, the relative impairment across sites, and if there was a trend toward recovery; secondly, the IBI scores were compared against the HI values to characterize changes in condition along a contamination gradient. Differences in invertebrate assemblages also were measured over stream and contaminant gradients, but assemblage characterizations were not based on a common IBI because different types of samples were collected (RTH, DTH, QMH) and the VTDEC bioassessment procedure of a qualitative ranking only applied to the RTH samples. The assessment for the RTH samples did not derive a single IBI for direct comparison but used a qualitative ranking. Therefore, two of the eight metrics used in bioassessments by VTDEC were used to characterize biologi-cal condition of the sites: invertebrate abundance and richness (total number of individuals and total number of taxa, respec-tively). Values of these two metrics were determined for all of the invertebrate sample types (RTH, DTH, QMH) to serve as a common baseline for comparison of all locations. When comparing changes in fish and invertebrate assemblages across sites, reference baselines were the fish IBI scores and inverte-brate abundance and richness values from the most upstream location in the respective system (EB-1080M, SB-3670M, Ely pond 1, OR-24050M).
Fish-tissue data were compared to the critical body residue of metals that were used to derive the HI for Cd, Cu,

14 Aquatic Assessment of the Ely Copper Mine Superfund Site, Vershire, Vermont
Pb, Ni, and Zn, and additionally for Hg. For a particular fish species, a critical body residue (CBR) is a literature-based benchmark that represents a metal concentration in the tissue at which adverse effects have been observed (effects level), or below which an adverse effect was not observed (no observ-able effects level). In this study, the critical body residues were based only on literature values for no-effect and effect levels in salmonids because brook trout (a salmonid) is a species of special interest in the waterways affected by the Ely Mine, and also because no relevant data were found for blacknose dace or any other cold-water cyprinid. The salmonid critical body residue values were compared to metal concentrations in the samples of single brook trout. However, brook trout were only captured at three sites (SB-3670M, SB-3100M, OR-23200M), whereas blacknose dace were captured at all eight fish-survey sites. Thus, the brook trout critical body residue values were also compared to those for the composite samples of blacknose dace to provide a more comprehensive view of the study area.
Toxicity data were analyzed by SAS/STAT software (version 9.1). Toxicity data were transformed to ranks before ANOVA testing. Overall ANOVA tests were conducted to determine whether test endpoints differed significantly among all sediments tested (rho < 0.05). For endpoints with sig-nificant overall ANOVA tests, separate ANOVA tests were conducted with sediments from each of the three streams (Ely Brook, Schoolhouse Brook, and the Ompompanoosuc River) with the one-tailed Dunnett’s test used to determine which responses were significantly less than those in reference sedi-ments from each stream.
Description of Study Area
Mine Site
The Ely Mine site is located within the Vermont cop-per belt in Vershire, Orange County, VT; it is approximately 1,800 acres (730 ha) in size, and contains piles of waste rock, ore waste, tailings, and smelter waste. Waste-rock and tailings piles extend from an area downgradient of the main shaft to the center of the site, whereas ore and smelter wastes are located near the southern boundary (fig. 2).
Surface waters at the mine site drain primarily to Ely Brook. Ely Brook originates upgradient and northwest of the mine site, generally flows north to south, and is west of the mine workings and waste piles (fig. 2). A short tributary to Ely Brook originates northeast of the mine site and flows through a series of small ponds before crossing waste-rock piles and joining the main stem of Ely Brook. Waters from Ely Brook flow into Schoolhouse Brook which, in turn, flows for approximately 3,270 meters to the confluence with the Ompompanoosuc River (figs. 1 and 2).
The predominant land use of the study area is forest, and approximately 37 percent of the Ompompanoosuc River basin
above the confluence with the West Branch is mixed forest (table 2) (Olson and others, 2005). However, in the Ely Brook basin, the percentage of mixed forest decreases to less that 20 percent. Locally, the mean annual temperature is 5.6 °C, mean summer temperature is 15 °C, and mean annual pre-cipitation varies with altitude and ranges from 91 to 102 cm (table 2) (Olson and others, 2005).
Ely Brook
Ely Brook has a total drainage area of 1.11 km2, stream reach of approximately 1,500 m, and a range in altitude from approximately 296 to 383 m. The surficial geology of the basin is predominantly till (fig. 3). A qualitative geomorphic characterization of a stream segment from river meter 0 to 1,080 found the distribution of geomorphic channel units to be approximately 45 percent riffle, 42 percent run, and 13 percent pool. Two distinct patterns in the geomorphology were also present: the channel above river meter 440 was dominated by boulder and woody debris riffles and had an average channel slope of 11 percent, whereas the channel below river meter 440 was dominated by gravel riffles and sand runs and had an average channel slope of 1.5 percent. Channel slope for 100-m reaches at each of the sampling locations ranged from 1.8 percent to 14.6 percent (table 2). Ely Brook is categorized as a small high-gradient stream by the State of Vermont, based on the stream classifications that are used in the bioassessment protocols developed for fish and invertebrate assemblages in Vermont (VTDEC, 2004).
Four tributaries flow into Ely Brook from the east, come in contact with mine wastes, and have the potential to dis-charge trace elements and acidity to Ely Brook. Ely Brook tributary 1, which may be intermittent, discharges to Ely Brook at river meter 350 and is downgradient from ore waste and roasting beds. Ely Brook tributary 2 drains a series of ponds located in the northeast section of the site, flows over a waste-rock pile in the center of the site, and discharges to Ely Brook at river meter 540. Ely Brook tributary 2 was referred to as East Branch Ely Brook by Cherau and others (2005). Ely Brook tributary 3 originates downgradient of the main shaft, flows north to south over waste rock piles, and discharges to Ely Brook tributary 2 at river meter 10. Ely Brook tribu-tary 4, which may be intermittent, originates downgradient of mine shaft 4 and discharges to Ely Brook at river meter 800. In addition, tributary 2 has a small tributary, tributary 5, that drains a small area to the east of tributary 2 and has been sampled by various studies.
A series of six ponds drain the eastern slope of the Ely Brook basin and form the headwaters for Ely Brook tribu-tary 2 (fig. 2). The ponds range in size from approximately 35 m2 (pond 6) to 3,800 m2 (pond 1) and are located at Ely Brook tributary 2 river meter 195 (pond 6), 290 (pond 5), 320 (pond 4), 345 (pond 3), 385 (pond 2), and 432 (pond 1). Pond 1, contained behind an earthen dam, is believed to have been a water-supply reservoir constructed some time between 1882 and 1899 (Cherau and others, 2005). The pond is fed

Description of Study Area 15
Table 2. Select basin and reach characteristics for sampling locations at the Ely Mine study area, Vershire, VT.
[km2, square kilometer; m, meter; cm, centimeter; %, percent; °C, degrees Celsius; SHG, small high gradient; CWIBI, coldwater index of biotic integrity; MHG, medium-size high gradient; MWIBI, mixed water index of biotic integrity]
CharacteristicEly Brook
(River meter)0a 90 600 770 1,080
BasinDrainage area (km2) 1.11 1.06 0.44 0.36 0.22Elevation (m) 297 313 329 370Lakes/Ponds (%) .13 .13 .00 .00 .00Annual precipitation (cm) 97.8Coniferous forest (%) 1Mixed forest (%) 17Mean temperature (°C) 5.6Mean summer temperature (°C) 15.0Strahler stream order 1 1 1 1 1
ReachCanopy (%) 100 100 100 100Channel slope .018 .095 .130 .146Riffle (%) 45 69 36 42 94Run (%) 42 41 58 6Pool (%) 13 31 23
VT Macroinvertebrate Category SHG SHG SHG SHG SHGSchoolhouse Brook
(River meter)0a 140 1,360 2,400 3,125 3,670
BasinDrainage area (km2) 25.2 25.2 24.7 19.4 15.6 14.2Elevation (m) 212 238 273 291 305Lakes/Ponds (%) .04 .04 .04 .05 .06 .05Annual precipitation (cm) 101Coniferous forest (%) 8Mixed forest (%) 28Mean temperature (°C) 5.4Mean summer temperature (°C) 14.8Strahler stream order 2 2 2 2 2 2
ReachCanopy (%) 25 25 50 20 10Channel slope .005 .025 .024 .028 .030Riffle (%) 95 69 94 77 100 82Run (%) 3Pool (%) 2 31 6 23 18
VT Macroinvertebrate Category SHG SHG SHG SHG SHG SHGVT Index of Biotic Integrity CWIBI CWIBI CWIBI CWIBI CWIBI CWIBI
Ompompanoosuc River(River meter)
8,350a 23,200 23,630 24,050Basin
Drainage area (km2) 168 51.0 76.9 77.4Elevation (m) 240 242 243Lakes/Ponds (%) 1.41 .09 .09 .11Annual precipitation (cm) 93.7 101Coniferous forest (%) 16 8Mixed forest (%) 37 29Mean temperature (°C) 5.7 5.3Mean summer temperature (°C) 15.2 14.7Strahler stream order 4 3 3 2
ReachCanopy (%) 50 25 40Channel slope .005 .005 .005Riffle (%) 39 39 60 89Run (%) 51 36 40Pool (%) 11 25 11
VT Macroinvertebrate Category MHG MHG MHG MHGVT Index of Biotic Integrity MWIBI MWIBI MWIBI MWIBI
a Reach characteristics are a summary of results from a habitat assessment conducted in June 2006 (appendix 1).

16 Aquatic Assessment of the Ely Copper Mine Superfund Site, Vershire, Vermont
O m
pompanoosuc
River
72°16'30"72°18'00"
43°55'30"
43°54'00"
Swamp Peat
Till
Stream / River
Lake sand
Pebbly Sand
Recent AlluviumBeach Gravel
Bedrock
Delta Gravel
4,000 Feet2,0000
2500 500 1,000 MetersExplanation
Hydrography base from 1:24,000-scale,National Hydrography Dataset, 1999.Town Boundaries from 1:24,000-scale,Digital Line Graph data, 1994.
Thetford
Vershire
West Fairlee
Strafford
Surficial Geology
Lake
Schoolhouse Brook
Ely Brook
Figure 3. The surficial geology of the Ely Mine Superfund site study area, VT.

Nature and Extent of Contamination 17
by an intermittent stream that drains from the east and pos-sibly by a spring (Cherau and others, 2005). Ponds 2 through 5 appear to be the result of beaver dams created along Ely Brook tributary 2. Pond 6, however, is a depression formed in a short exploration shaft, or other type of abandoned mine- development excavation. Two small, intermittent streams drain into the pond system below pond 1: one stream flows into pond 2 from the northeast, and one stream flows adjacent to a waste-rock pile and into pond 5 from the north. A groundwater seep also is present upgradient of pond 4.
Schoolhouse Brook
Schoolhouse Brook has a total drainage area of 25.2 km2, stream reach of approximately 7,650 m, and a range in altitude from approximately 210 to 480 m. Two tributaries flow into Schoolhouse Brook below the confluence with Ely Brook, at approximately river meter 2,100 and river meter 2,915. The contributing drainage area for these tributaries is 7.1 km2.
The surficial geology of the basin is predominantly till (fig. 3). However, the surficial geology underlying the stream channel from river meter 0 to 600 is characterized as being delta gravel and lake sand. A qualitative geomorphic charac-terization of the stream segment from river meter 0 to 3,670 found the distribution of geomorphic channel units to be approximately 95 percent riffle, 3 percent run, and 2 percent pool. The average slope for this stream segment is 2.6 percent. Below river meter 600, however, the distribution of riffle, run, and pool environments becomes more sequential as the channel slope decreases to approximately 1 percent. Chan-nel slope for 100-m reaches at each of the sampling locations ranged from 0.5 to 3.0 percent (table 2). Schoolhouse Brook is categorized as a small high-gradient stream, which is char-acteristic of a stream that could support a cold-water fishery (VTDEC, 2004). Therefore, when assessing the condition of fish assemblages, in Schoolhouse Brook, an IBI designed for coldwater fish (CWIBI) was used to indicate the relative degree of impairment to the assemblages.
Ompompanoosuc River
The Ompompanoosuc River above the confluence with the West Branch of the Ompompanoosuc River has a total drainage area of 168 km2. The surficial geology of the basin is predominantly till (fig. 3). However, the surficial geology underlying the stream channel in the study area is character-ized as delta gravel, lake sand, and pebbly sand. A qualitative geomorphic characterization of a stream segment from river meter 20,300 to 24,200 found the distribution of geomorphic channel units to be approximately 39 percent riffle, 51 percent run, and 10 percent pool. The average slope for this stream segment is 0.5 percent. Two distinct patterns in the geomor-phology were present: the channel above river meter 23,640 was dominated by boulder and cobble riffles and had an aver-age channel slope of 0.5 percent, whereas the channel below
river meter 23,640 was dominated by gravel riffles and sand runs and had an average channel slope of 0.2 percent. Channel slope for 100-m reaches at each of the sampling locations was 0.5 percent (table 2). The Ompompanoosuc River is catego-rized as a medium high-gradient stream with a mixed water fishery; therefore, a mixed water IBI (MWIBI) was used to indicate the relative degree of impairment to the fish assem-blages (VTDEC, 2004).
Nature and Extent of ContaminationAcid-mine drainage occurs when sulfide-bearing waste
rock and tailings come in contact with waters containing dissolved oxygen. The resulting oxidation reactions release associated metals and acidity, which may impact the biologi-cal community and significantly lower the pH of downstream waterways. Released metals that are transported downstream may be removed from solution through precipitation of and sorption onto iron and manganese hydroxides (Harvey and Fuller, 1998; Tonkin and others, 2004). Attenuation of metals also has been attributed to precipitation and sorption within the hyporheic zone as contaminated waters infiltrate and mix with shallow groundwater (Harvey and Fuller, 1998; Fuller and Harvey, 2000).
Waste rock and tailings at the Ely Mine site have simi-lar mineralogy and chemistry and leach comparable metal concentrations and acidity to those observed at the Elizabeth and Pike Hill mines (Seal and others, 2001; Piatak and others, 2004, 2006). The weathering of mine wastes in the Vermont copper belt has been shown to produce concentrations of met-als in downstream waterways greater than those allowed by USEPA acute and chronic standards (Holmes and others, 2002; Kiah and others, 2007).
Surface-water samples have been collected at 103 stream and 21 seep locations in the study area (table 1) (Argue and others, 2008). Concentrations greater than AWQC were observed for 15 elements: Al, Ba, Cd, Cr, Co, Cu, Fe, Pb, Mn, Hg, Ni, Se, Ag, U, and Zn (appendix 5). These results are similar to those of Piatak and others (2004), who showed the bulk geochemistry of Ely Mine waste comprised Fe >> Al > S > K > Ca, and trace elements comprised Cu > Mn > Ba ≈ U ≈ Zn > Cr > Sr > Co ≈ Mo ≈ Pb, on a mass basis. Leach tests per-formed on the mine waste also found Cd, Co, Cu, Ni, and Zn to be the dominant elements released (Piatak and others, 2004).
Surface-water data were compared to regional stream-flow characteristics computed for the Ompompanoosuc River at Union Village, VT (USGS station 01141500) to investi-gate the distribution of water samples relative to expected streamflows in the basin. A cumulative frequency duration curve showing the percentage of time that a given daily mean streamflow is expected to be equaled or exceeded at USGS station 01141500 and the distribution of water samples in each stream reach, relative to the various daily mean streamflows observed at station 01141500, are shown in figure 4. Based on

18 Aquatic Assessment of the Ely Copper Mine Superfund Site, Vershire, Vermont
A. Ely Brook
1
10
100
1,000
10,000
1
10
100
OMPO
MPA
NOO
SUC
RIVE
R ST
REAM
FLOW
(CFS
)
Flow-duration curve
Water-quality sample
EXPLANATIONYear sampled: Agency
2000-01: Arthur D. Little, Inc
2002: USACE and USGS
2004: URS Company
2005-06: USEPA
2006: USGS
1
10
100
1,000
10,000
.01 .1 1 5 10 20 30 50 70 80 90 95 99 99.9 99.991
10
100
.01 .1 1 5 10 20 30 50 70 80 90 95 99 99.9 99.99
C. Ompompanoosuc River
OMPO
MPA
NOO
SUC
RIVE
R ST
REAM
FLOW
(CFS
)
PERCENT OF TIME EXCEEDED
.01 .1 1 5 10 20 30 50 70 80 90 95 99 99.9 99.99.01 .1 1 5 10 20 30 50 70 80 90 95 99 99.9 99.99
.01 .1 1 5 10 20 30 50 70 80 90 95 99 99.9 99.99.01 .1 1 5 10 20 30 50 70 80 90 95 99 99.9 99.99
B. Schoolhouse Brook
1
10
100
1,000
10,000
1
10
100
OMPO
MPA
NOO
SUC
RIVE
R ST
REAM
FLOW
(CFS
)
Figure 4. Flow-duration curve for U.S. Geological Survey gaging station 01141500 Ompompanoosuc River at Union Village Dam, VT, with streamflow distribution of water-quality samples collected in (A) Ely Brook, (B) Schoolhouse Brook, and (C) the Ompompanoosuc River. Flow-duration curve was based on daily mean streamflows for period 1949–89. Water-quality samples reflect days that data were collected and not individual samples. CFS, cubic feet per second.

Nature and Extent of Contamination 19
this analysis, surface-water samples were well distributed over the expected range in streamflows, as greater than 95 percent of the streamflows that may be expected at the site were rep-resented by a water sample (fig. 4). Furthermore, 95 percent of the streamflows associated with the samples were within 2 standard deviations of the mean, and the median probability of exceedence for the dataset was 52 percent, indicating an equal distribution of water samples across expected stream-flows. Water samples collected in August 2006 ranged from a probability of exceedence of about 40 percent on August 21 to about 55 percent on August 23 as samples were collected over the course of a recession in streamflow.
Surface water, pore water, sediment, invertebrates, and fish were sampled to define potential areas of impact from acid-mine drainage, to assess the ability of the streams to attenuate contaminants, and to identify the fraction of contaminants that may be bioavailable. Surface water and invertebrates were sampled at 12 stream sites in August 2006 and 6 pond sites in September 2006 (figs. 1 and 2, table 1). Pore water and sediment were sampled at 10 stream sites in August 2006. Fish were sampled at eight stream sites in September 2006 (table 3). Physical parameters for surface- and pore-water samples are listed in tables 4 and 5.
A preliminary analysis was conducted to determine if the biological assemblages (RTH, DTH, QMH invertebrates, and fish) were more strongly correlated to values of metal con-centrations from surface water, pore water, or sediment. This analysis was not especially relevant for the Ompompanoosuc River locations because pore-water and sediment samples were collected at only two sites (that is, |rho| = 1). However, the results for Ely Brook, Schoolhouse Brook, and the Ely ponds indicated that the metal concentrations in the surface-water samples were most strongly correlated with the QMH, RTH, and fish samples, and metal concentrations in the pore-water samples were most strongly correlated with the DTH samples. These results are exemplified in the Spearman rho
values from correlations of in situ pore water, surface water, and sediment-metal concentrations with the total richness for invertebrates and the IBI score for fish (table 3). Based on these results, the analyses of biological data below relate a particular biological assemblage with the metal concentrations in the sample that is most directly associated with the assem-blage (RTH, QMH, fish with surface-water metals; DTH with pore-water metals).
Background Conditions
Surface-Water GeochemistrySites in the study that are considered to represent back-
ground conditions with respect to historical mining are those water-quality sites upstream from any known mining distur-bance. These sites include EB-1080M for Ely Brook, pond 1 for the northeastern tributary 2 to Ely Brook, SB-3670M for Schoolhouse Brook, and OR-24050M for the Ompompa-noosuc River. Data from these sites from this study will be used as a basis for comparison with results from previous stud-ies to gain insights into longer term variability of background water quality. Field parameters and chemical constituents for surface-water samples are summarized in table 4, and com-plete analyses are reported in appendix 6.
Field Parameters and Major Inorganic ConstituentsThe gross chemical properties of the background water
samples vary according to the size of the catchment area. Previous reports found similar results (Seal and others, 2001; Holmes and others, 2002; Argue and others, 2008). The head-waters of Ely Brook (EB-1080M and pond 1) in the vicinity of the mine have lower pH and specific conductance values than the receiving streams, Schoolhouse Brook (SB-3670M) and the Ompompanoosuc River (OR-24050M). The pH of the
Table 3. Spearman rho values from correlating metal concentrations measured in surface water (SW), in situ pore water (PW), and sediment (SED) against invertebrate richness (RTH, QMH, and DTH samples) and against the index of biotic integrity scores for the fish surveys. The RTH, QMH, and fish data were more strongly correlated to metals in SW (bold rho values) than to PW or SED. The DTH data were more strongly correlated to metals in PW (bold rho values) than to those in SW.
[RTH, riffle-targeted habitat; QMH, qualitative multi-habitat; DTH, depositional-targeted habitat; —, no value]
Sample type
Spearman rho value
Ely Brook Schoolhouse Brook Ely Ponds
SW PW SED SW PW SED SW PW SED
RTH (streams) or QMH (ponds) –1.000 –0.800 –0.800 –0.821 –0.632 –0.200 –0.886 — –0.657
DTH –0.634 –0.949 –0.949 –0.316 –0.949 –0.400 — — —
FISH — — — –0.764 –0.632 –0.200 — — —
Number of samples 4 4 4 5 4 4 6 — 6

20 Aquatic Assessment of the Ely Copper Mine Superfund Site, Vershire, Vermont
Table 4. Constituents in filtered surface waters collected in August and September 2006 from the Ely Mine study area, Vershire, VT.[The concentrations of the following elements were below their detection limits (given in parentheses in micrograms per liter, µg/L): Ag (<3), As (<1), Hg (<5), Mo (<2), Se (<1), Tl (<0.1), and V (<0.5). S.C., specific conductance; DOC, dissolved organic carbon; µS/cm, microsiemens per centimeter; mg/L, milligrams per liter; µg/L, micrograms per liter; —, not determined; <, analyte not detected at the reporting level]
Stream and location
pHS.C.
(µS/cm)
Alkalinity(mg/L as CaCO3)
DOC(mg/L)
N(mg/L)
P(mg/L)
Ca(mg/L)
Fe(µg/L)
K(mg/L)
Mg(mg/L)
Na(mg/L)
SiO2
(mg/L)Al
(µg/L)Ba
(µg/L)Be
(µg/L)
Ely Brook EB-1080M 7.2 87 41 1.9 0.07 0.003 Ea 13.4 22 1.69 1.18 1.12 9.1 3.4 18.4 <0.05 EB-770M 6.3 149 11 0.8 0.04 E 0.002 E 17.2 <20 2.43 3.2 1.64 17.2 25.1 19.9 0.06 EB-600M 7.0 123 16 0.9 0.05 E <0.004 14.9 <20 2.17 2.43 1.44 13.7 20.7 17 <0.05 EB-90M 3.2 447 — 1.6 0.07 0.004 E 21.1 6370 3.42 5.54 2.3 33.1 4,190 19 0.3Ely Ponds EM-POND1 7.0 51 19 3.5 0.46 0.036 5.77 66 1.67 1.07 1.2 2.2 15.8 9.61 <0.05 EM-POND2 6.5 65 27 2.6 0.22 0.011 7.67 353 1.78 1.11 1.34 4.6 6.5 13.5 <0.05 EM-POND3 6.7 70 31 2.6 0.25 0.006 8.72 253 1.75 1.17 1.3 5.1 6.2 12.5 <0.05 EM-POND4 6.7 78 30 2.2 0.19 0.007 9.7 105 1.86 1.37 1.32 5.5 5.5 18.6 <0.05 EM-POND5 6.5 117 17 1.4 0.11 0.003 E 13 <20 2.13 2.44 1.41 9.2 10.1 13.7 <0.05 EM-POND6 4.7 206 — 1.1 0.1 0.006 18.6 565 2.54 4.17 1.6 14.8 1,410 13.2 0.2Schoolhouse Brook SB-3670M 8.2 212 99 1.2 0.08 0.002 E 35.7 <20 2.26 1.71 3.89 7.3 12.8 20.5 <0.05 SB-3125M 7.8 215 89 1.3 0.11 0.005 35.1 49 2.34 1.99 4.16 8.9 124 19.8 <0.05 SB-2400M 8.3 210 89 1.2 0.09 0.003 E 35.8 <20 2.42 2.03 4.62 9.1 128 18.5 <0.05 SB-1360M 7.9 203 86 1.5 0.09 0.003 E 33.8 13 2.29 1.95 4.27 8.6 84.4 18.4 <0.05 SB-140M 8.2 186 80 2 0.12 0.006 30.7 20 2.2 1.82 3.77 8.5 93.5 14.8 <0.05Ompompanoosuc River OR-24050M 8.0 196 88 2.5 0.21 0.007 32 <20 2.16 1.46 5.22 7.2 13.4 19.9 <0.05 OR-23630M 8.0 198 87 2.6 0.2 0.006 32.9 <20 2.23 1.55 5.45 7.6 23.3 20.2 <0.05 OR-23200M 8.1 196 85 2.6 0.2 0.005 32.6 <20 2.24 1.61 5.15 7.8 44.6 19.1 <0.05
Stream and location
Cd(µg/L)
Co(µg/L)
Cr(µg/L)
Cu(µg/L)
Mn(µg/L)
Ni(µg/L)
Pb(µg/L)
Sb(µg/L)
Sr(µg/L)
U(µg/L)
Zn(µg/L)
NO3
(mg/L)SO4
(mg/L)Ely Brook EB-1080M <0.02 0.08 <1 1.3 124 0.5 <0.05 <0.3 47.6 <0.1 5.6 <.08 4.3 EB-770M 0.95 31.1 <1 837 217 12.1 0.1 <0.3 62.3 <0.1 114 0.5 52 EB-600M 0.48 12.5 <1 211 92.8 6.4 0.06 <0.3 52.6 <0.1 64.2 0.5 36 EB-90M 1.99 63 2.1 1,560 521 19.5 0.95 <0.3 64 0.42 373 1 143Ely Ponds EM-POND1 <0.02 0.03 <1 1.1 2.7 <0.4 0.09 <0.3 20.5 <0.1 2.3 <.08 6.3 EM-POND2 <0.02 0.13 <1 2.9 201 0.4 0.08 <0.3 29.5 <0.1 11.5 0.6 5.4 EM-POND3 <0.02 0.23 <1 1.7 435 0.6 0.1 0.62 34.8 <0.1 2.4 0.6 5 EM-POND4 0.08 0.41 <1 13.4 212 1.3 0.1 <0.3 38.2 <0.1 14.8 <.08 8.1 EM-POND5 1.02 20.4 <1 444 386 7.7 <0.05 <0.3 43.4 <0.1 143 0.6 33 EM-POND6 2.28 46.3 <1 1,380 564 16.7 0.4 0.52 50.4 0.2 325 0.6 93Schoolhouse Brook SB-3670M <0.02 <0.02 <1 <0.5 5.6 <0.4 0.05 <0.3 166 0.32 2.8 0.6 9 SB-3125M 0.12 4.31 <1 42.8 43.8 1.5 0.07 0.78 157 0.31 15.6 0.6 13 SB-2400M 0.08 2.82 <1 25 31.5 1.2 <0.05 <0.3 158 0.3 6.6 0.6 16 SB-1360M 0.07 1.94 <1 21.6 19.1 1.1 <0.05 <0.3 152 0.27 19.8 0.5 14 SB-140M 0.05 1.1 <1 20.4 13.6 1 0.1 <0.3 134 0.24 12.8 0.5 13Ompompanoosuc River OR-24050M <0.02 <0.02 <1 0.84 4.7 <0.4 0.08 <0.3 138 0.24 9.3 0.6 7.2 OR-23630M 0.02 0.11 <1 3.3 7.1 <0.4 0.06 <0.3 139 0.24 12.5 0.6 8 OR-23200M 0.1 0.31 <1 8.9 8.9 0.5 0.2 <0.3 139 0.24 6.9 0.5 8
a Estimated value, reported concentration is less than the reporting level but greater than the long-term method-detection level.

Nature and Extent of Contamination 21
Table 5. Constituents in filtered pore waters collected in August and September 2006 from the Ely Mine study area, Vershire, VT.
[The concentrations of the following elements were below their detection limits (given in parentheses in micrograms per liter, µg/L): Ag (<3), As (<1), Hg (<5), and Mo (<2). S.C., specific conductance; DOC, dissolved organic carbon; µS/cm, microsiemens per centimeter; mg/L, milligrams per liter; µg/L, micrograms per liter; —, not determined; <, analyte not detected at the reporting level; ins, insufficient sample]
Stream and location
Sample type
pHS.C.
(µS/cm)
Alkalinity(mg/L as CaCO3)
DOC(mg/L)
N(mg/L)
P(mg/L)
Ca(mg/L)
Fe(µg/L)
K(mg/L)
Mg(mg/L)
Na(mg/L)
SiO2
(mg/L)Al
(µg/L)Ba
(µg/L)Be
(µg/L)
Ely Brook EB-1080M in situ 7.1 85 40 1.6 0.08 0.003 Ea 12.6 <20 1.68 1.18 1.13 9 4.3 16.6 <0.05 EB-1080M centrifuge — — — — — — 28 436 2.78 2.53 1.71 9.7 88.8 33.4 <0.05 EB-1080M equilibrated 7.5 389 204.8 — — — 69.5 <20 4.84 6.42 2.79 12.7 12.2 74.7 <0.05 EB-770M in situ 6.1 131 11 1 0.04 E <0.004 14.3 145 2.16 2.41 1.41 12.8 4.8 12.9 <0.05 EB-770M centrifuge — — — — — — 32 32 3.45 5.38 1.95 15 50.4 31.9 <0.05 EB-770M equilibrated 6.0 400 39.6 — — — 56.1 747 7.32 9.29 3.51 25.3 7 64.5 <0.05 EB-600M in situ 6.9 119 15 1 0.05 E 0.004 E 14.4 <20 2.13 2.29 1.4 13 7.1 17 <0.05 EB-600M centrifuge — — — — — — 16.8 52 2.6 2.56 1.47 12.4 345 19.8 <0.05 EB-600M equilibrated 7.0 164.2 30.4 — — — 21.6 <20 4.04 3.16 2.4 15.9 15.4 26.7 <0.05 EB-90M in situ 2.9 594 — 1.3 0.17 0.004 20.4 11,000 4.87 5.43 2.34 32.8 3,060 17.8 0.3 EB-90M centrifuge — — — — — — 29.1 163,100 10.3 8.58 5.42 69.8 7,520 20.6 0.3 EB-90M equilibrated 3.2 1063 — — — — 28.7 47,000 5.24 7.61 4.23 39.5 6,050 21.8 0.5Schoolhouse Brook SB-3670M in situ 7.7 251 116 1.5 0.07 0.004 41.2 <20 2.48 1.88 4.12 7.6 6.1 23.8 <0.05 SB-3670M centrifuge — — — — — — 64.5 101 3.48 2.61 4.69 10 94.1 42.5 <0.05 SB-3670M equilibrated 7.8 561 284 — — — 104 <20 5.02 4.29 6.33 11.8 16.3 75.7 <0.05 SB-2400M in situ 7.7 347 126 1 0.09 0.006 46.6 <20 4.09 3.19 16.2 10.3 12.8 26.4 <0.05 SB-2400M centrifuge — — — — — — 68.8 213 4.22 6.21 15.4 11.8 197 35.4 <0.05 SB-2400M equilibrated 7.6 563 172.8 — — — 92.1 30 7.19 5.26 15.3 16.5 38.2 60.1 <0.05 SB-1360M in situ 7.7 218 92 1.6 0.24 0.006 34.6 <20 2.81 1.95 3.78 8.8 15 18.2 <0.05 SB-1360M centrifuge — — — — — — 52.1 79 3.64 3.16 4.47 10 76.8 29.2 <0.05 SB-1360M equilibrated 7.4 523 190.4 — — — 93.6 <20 7.39 5.7 6.74 16.4 8.5 68.8 <0.05 SB-140M in situ 7.6 260 107 0.9 0.15 0.004 E 39.9 <20 2.71 2.02 6.03 8.1 11.4 23.4 <0.05 SB-140M centrifuge — — — — — — 65.8 28 3.65 3.18 5.54 9.4 14 38.9 <0.05 SB-140M equilibrated 7.4 531 212.4 — — — 101 <20 7.31 5.66 9.68 15.8 10.7 69 <0.05Ompompanoosuc River OR-24050M in situ 7.6 359 150 1.4 1.04 0.006 51.6 <20 7.18 2.99 10.9 9.8 5.4 43.3 <0.05 OR-24050M centrifuge — — — — — — 68.5 30 7.99 4.05 12.6 10.6 ins ins ins OR-24050M equilibrated 7.9 709 — — — — 137 <20 12.9 7.78 16.5 16.1 21.5 126 <0.05 OR-23200M in situ 7.6 277 105 1.4 0.2 0.005 35.8 <20 3.18 1.47 14.9 7.8 12.9 21.6 <0.05 OR-23200M centrifuge — — — — — — 68.9 23 3.73 3.51 10.6 8.1 38.5 48.2 <0.05 OR-23200M equilibrated 7.4 535 250.8 — — — 86.8 <20 5.46 4.04 16.8 14.5 11.6 77.5 <0.05

22 Aquatic Assessment of the Ely Copper Mine Superfund Site, Vershire, Vermont
Stream and location
Sample type
Cd(µg/L)
Co(µg/L)
Cr(µg/L)
Cu(µg/L)
Mn(µg/L)
Ni(µg/L)
Pb(µg/L)
Sb(µg/L)
Se(µg/L)
Sr(µg/L)
Tl(µg/L)
U(µg/L)
V(µg/L)
Zn(µg/L)
Cl(mg/L)
SO4
(mg/L)Ely Brook EB-1080M in situ <0.02 <0.02 <1 2.4 0.3 0.6 0.06 <0.3 <1 46.1 <0.1 < 0.1 <0.5 1.5 1.4 4.4 EB-1080M centrifuge 1.66 0.46 <1 10.2 45.7 1.4 0.91 <0.3 <1 92.4 <0.1 < 0.1 0.8 29.2 — — EB-1080M equilibrated 0.11 0.55 <1 4.3 2,520 1.7 <0.05 <0.3 1.8 225 <0.1 0.49 <0.5 1.6 3.2 14 EB-770M in situ 0.28 2.36 <1 27.4 41.1 4.3 0.2 <0.3 <1 51 <0.1 < 0.1 <0.5 25.1 1.4 43 EB-770M centrifuge 1.25 61.7 <1 43.4 2,780 12.6 <0.05 <0.3 1.2 102 <0.1 < 0.1 <0.5 50 — — EB-770M equilibrated 1.95 71.3 <1 106 5,460 20 <0.05 <0.3 1 195 <0.1 < 0.1 <0.5 114 2.8 175 EB-600M in situ 0.3 2.37 <1 42.7 14.8 4 <0.05 <0.3 <1 50.4 <0.1 < 0.1 <0.5 31.6 1.4 35 EB-600M centrifuge 0.34 2.15 <1 108 26.5 3.9 0.08 <0.3 <1 56.2 <0.1 < 0.1 <0.5 24.8 — — EB-600M equilibrated 0.59 8.24 <1 59.6 418 4.5 <0.05 <0.3 <1 71.9 <0.1 < 0.1 <0.5 26 1.5 47 EB-90M in situ 1.85 57.9 1.4 1,800 501 17.4 1.9 0.77 1.2 63.1 0.1 0.46 <0.5 314 3.4 161 EB-90M centrifuge 2.87 272 2.1 2,140 2,810 31.1 1.2 <0.3 2.6 82 0.1 0.69 <0.5 514 — — EB-90M equilibrated 2.62 246 1.4 1,700 3,150 39 1.7 <0.3 2.9 113 0.2 1.01 <0.5 616 7 574Schoolhouse Brook SB-3670M in situ <0.02 <0.02 <1 <0.5 0.4 <0.4 0.06 <0.3 <1 191 <0.1 0.26 <0.5 1.9 3.5 6 SB-3670M centrifuge 0.04 0.12 <1 1 6.8 2.4 0.1 <0.3 <1 274 <0.1 0.42 0.6 3.8 — — SB-3670M equilibrated 0.04 0.68 <1 2.9 3,870 4.1 0.1 0.88 <1 457 0.2 1.07 1 4.4 7 16 SB-2400M in situ 0.08 0.28 <1 7.9 113 0.5 <0.05 0.53 <1 209 <0.1 0.33 <0.5 3 — — SB-2400M centrifuge 0.15 1.1 <1 16.8 149 2.9 0.1 0.33 1.2 285 <0.1 0.54 <0.5 6.4 — — SB-2400M equilibrated 0.3 2.44 <1 22.8 1,030 2.6 0.05 0.3 1.5 430 0.1 0.72 <0.5 4.9 14 99 SB-1360M in situ 0.05 0.13 <1 9.6 31.5 0.8 0.2 <0.3 <1 159 <0.1 0.23 <0.5 149 4 17 SB-1360M centrifuge 0.17 1.59 <1 18.1 171 2.2 0.09 0.44 1.3 224 <0.1 0.37 <0.5 6 — — SB-1360M equilibrated 0.27 4.28 <1 24.9 1,770 2.2 <0.05 <0.3 1.1 436 <0.1 0.62 <0.5 7 6.1 87 SB-140M in situ 0.04 0.03 <1 5.6 0.6 0.6 0.2 <0.3 <1 168 <0.1 0.2 <0.5 8 7.1 16 SB-140M centrifuge 0.22 1.05 <1 8.5 209 2.6 0.1 <0.3 <1 272 <0.1 0.4 <0.5 5.3 — — SB-140M equilibrated 0.4 3.81 <1 21.6 1,100 2.2 0.1 <0.3 1 397 <0.1 0.62 <0.5 7.4 7 64Ompompanoosuc River OR-24050M in situ <0.02 0.03 <1 0.56 196 0.4 <0.05 <0.3 <1 228 <0.1 0.4 <0.5 3.8 15 10 OR-24050M centrifuge ins ins ins ins ins ins ins ins ins ins ins ins ins ins — — OR-24050M equilibrated 0.04 0.74 <1 1.6 6,270 3.8 0.09 <0.3 1.2 559 <0.1 1.91 1.8 2.4 15 11 OR-23200M in situ 0.06 0.47 1.9 4.5 327 0.8 0.3 <0.3 <1 150 <0.1 0.32 <0.5 2.9 15 11 OR-23200M centrifuge 0.19 3.08 <1 14.2 1,500 2.8 0.09 <0.3 <1 282 <0.1 0.7 1 3.4 — — OR-23200M equilibrated 0.09 2.08 <1 19.1 3,500 2.2 0.2 <0.3 <1 386 <0.1 0.95 <0.5 5.7 12 25
a Estimated value, reported concentration is less than the reporting level but greater than the long-term method-detection level.
Table 5. Constituents in filtered pore waters collected in August and September 2006 from the Ely Mine study area, Vershire, VT.—Continued
[The concentrations of the following elements were below their detection limits (given in parentheses in micrograms per liter, µg/L): Ag (<3), As (<1), Hg (<5), and Mo (<2). S.C., specific conductance; DOC, dissolved organic carbon; µS/cm, microsiemens per centimeter; mg/L, milligrams per liter; µg/L, micrograms per liter; —, not determined; <, analyte not detected at the reporting level; ins, insufficient sample]

Nature and Extent of Contamination 23
headwaters of Ely Brook ranged from 7.0 to 7.2, compared to 8.0 to 8.2 for Schoolhouse Brook and the Ompompanoosuc River (fig. 5). Likewise, specific conductance ranged from 51 to 87 microsiemens per centimeter (µS/cm) for the Ely Brook headwaters, and from 196 to 212 µS/cm for the receiving water bodies (fig. 5). Calcium was the dominant dissolved cation (5.8 to 35.7 mg/L), and Mg (1.1 to 1.7 mg/L), Na (1.1 to 5.2 mg/L), and K (1.7 to 2.3 mg/L) occur in subequal pro-portions. Silica (SiO2) ranged from 2.2 to 9.1 mg/L and was lowest in pond 1. Alkalinity was the dominant anionic species (19 to 99 mg/L CaCO3 equivalent) (fig. 6). The increased
specific conductance of the receiving water bodies was domi-nantly reflected in higher concentrations of Ca, Mg, Na, and alkalinity compared to the headwaters of Ely Brook. Likewise, hardness values for the head waters (19 to 41 mg/L CaCO3 equivalent) were lower than those for the receiving water bod-ies (86 to 97 mg/L CaCO3 equivalent) (fig. 6).
Iron, Aluminum, and ManganeseIron, aluminum, and manganese generally had low
concentrations in the background waters at the site (fig. 7). For all background sites, dissolved iron ranged from below the detection limit (<20 μg/L) to just above (66 μg/L). Likewise, dissolved aluminum concen-trations ranged from 3.4 to 13.4 μg/L. Dissolved manganese concentrations were slightly higher and ranged from 4.7 to 124 μg/L.
Minor and Trace Inorganic ElementsMinor and trace elements gener-
ally have low concentrations in the background waters at the site (fig. 7). Dissolved Ag, As, Cd, Cr, Hg, Sb, and Se concentrations were all below their detection limits. Dissolved Ba concen-trations ranged from 18.4 to 20.5 µg/L, dissolved Cu from <0.5 to 1.3 µg/L, dissolved Ni from <0.4 to 0.5 µg/L, dissolved Pb from <0.05 to 0.09 µg/L, and dissolved Zn from 2.3 to 9.3 µg/L. HIs (Cd + Cu + Ni + Pb + Zn) compar-ing surface-water quality at these sites to hardness-based chronic ambient water-quality standards were all below 1 (0.05–0.82) for these sites.
Dissolved Organic Carbon and Nutrients
Dissolved organic carbon (DOC) concentrations in background waters throughout the study area ranged from 1.2 to 3.5 mg/L, with pond 1 having the highest values. Nutrients were gener-ally low throughout the study area. Total dissolved nitrogen ranged from 0.07 to 0.46 mg/L, and total dissolved phospho-rus ranged from 0.002 to 0.036 mg/L.
2
3
4
5
6
7
8
9
pH
Surface waterIn situ pore water
Ely Brook Schoolhouse Brook
Ompompan-oosuc River
1,080 60
0 903,6
703,1
002,4
001,3
60 140
24,05
023
,63023
,20043
238
534
532
029
019
5
Ely Ponds
770
RIVER METER AND REACH
Explanation
B
A
Ely Brook Schoolhouse Brook
Ompompan-oosuc River
1,080 60
0 903,6
703,1
002,4
001,3
60 140
24,05
023
,63023
,20043
238
534
532
029
019
5
Ely Ponds
770
RIVER METER AND REACH
Inflow of water from previous reach
1 0
1 0 0
1 ,0 0 0
SPEC
IFIC
CON
DUCT
ANCE
, IN
M
ICRO
SIEM
ENS
PER
CEN
TIM
ETER
Figure 5. Downstream variations in (A) pH and (B) specific conductance in surface and in situ pore waters at the Ely Mine Superfund site, Vershire, VT.

24 Aquatic Assessment of the Ely Copper Mine Superfund Site, Vershire, Vermont
Comparisons with Ambient Water-Quality CriteriaWater-quality data for background reaches are best inter-
preted in terms of proximity to the Ely Mine site. Ely Brook background conditions were characterized by those locations above the confluence with Ely Brook tributary 4 (river meter 800). Ely Brook tributary 2 background conditions were characterized by those locations above a series of waste-rock piles and seeps (river meter 340). Schoolhouse Brook back-ground conditions were characterized by those locations above
the confluence with Ely Brook (river meter 3,270). The Ompompanoosuc River back-ground conditions were characterized by loca-tions above the confluence with Schoolhouse Brook (river meter 23,640). Background concentrations for most elements were less than AWQC with the exception being alumi-num, which was greater than AWQC in all background reaches (appendix 5).
Pore-Water GeochemistryBackground pore-water samples were
collected from all of the same sites as surface-water samples except for pond 1. These sites include EB-1080M for Ely Brook, SB-3670M for Schoolhouse Brook, and OR-24050M for the Ompompanoosuc River. Minor but significant differences among the chemistry of the three types of pore-water samples were noted. Field parameters and chemical constitu-ents for pore-water samples are summarized in table 5, and complete analyses are reported in appendix 7.
Field Parameters and Major Inorganic Constituents
The pH and specific conductance were measured only on the in situ and equilibrated samples. Collectively, the background pore waters are near neutral with pH ranging from 7.1 to 7.9 (fig. 5). Invariably, the pH of the equilibrated water samples was 0.1 to 0.4 unit higher than the corresponding in situ values. As with the surface water, the specific conductance increased with increasing size of the catchment, going from Ely Brook to Schoolhouse Brook to the Ompompanoosuc River (fig. 5). The values from equilibrated pore waters (389–709 µS/cm) were higher than those from the in situ pore waters (85–359 µS/cm) by roughly 100 to 350 percent.
Calcium was the dominant dissolved cation, and Mg, Na, and K occurred in sub-equal proportions, similar to the surface-water samples. Invariably, the concentrations of dis-
solved major cations (Ca: 69.5–137 mg/L; Mg: 6.4–7.8 mg/L; Na: 2.8–16.5 mg/L; K: 4.8–12.9 mg/L) were highest in the equilibrated samples and lowest in the in situ samples (Ca: 12.6–51.6 mg/L; Mg: 1.2–3.0 mg/L; Na: 1.1–10.9 mg/L; K: 1.7–7.2 mg/L). Dissolved silica (SiO2) concentrations also were highest in the equilibrated samples and lowest in the in situ samples. The concentrations of silica from all sample types ranged from 7.6 to 16.1 mg/L. Alkalinity was the domi-nant anionic species, and like the major cations, was found in
Ely Brook Schoolhouse Brook
Ompompan-oosuc River
1,080 60
0 903,6
703,1
002,4
001,3
60 140
24,05
023
,63023
,20043
238
534
532
029
019
5
Ely Ponds
770
RIVER METER AND REACH
Explanation
Graph A
B
A
Ely Brook Schoolhouse Brook
Ompompan-oosuc River
1,080 60
0 903,6
703,1
002,4
001,3
60 140
24,05
023
,63023
,20043
238
534
532
029
019
5
Ely Ponds
770
RIVER METER AND REACH
Graph B
10
100
1,000
Hardness: surfaceHardness: in situ pore
1
10
100
1,000
Alkalinity: surfaceA lkalinity: in situ poreSulfate: surfaceSulfate: in situ pore
HARD
NES
S, IN
MIL
LIGR
AMS
CACO
3 PE
R LI
TER
CON
CEN
TRAT
ION
, IN
M
ILLI
GRAM
S PE
R LI
TER
Inflow of water from previous reach
Inflow of water from previous reach
Figure 6. Downstream variations in (A) hardness, (B) alkalinity and sulfate concentrations in surface and in situ pore waters at the Ely Mine Superfund site, Vershire, VT.

Nature and Extent of Contamination 25
higher concentrations in the equilibrated samples than in the in situ samples (fig. 6). Similarly, the alkalinity concentra-tions of pore waters increased with increasing drainage area in background sites. The alkalinity values of the in situ pore waters ranged from 40 to 150 mg/L CaCO3 equivalent. Sulfate and chloride occurred in subequal concentrations in pore-water samples and reached maximum concentrations of 10 and
15 mg/L, respectively, in the in situ samples (fig. 6). The hardness values of the pore waters followed identical trends. The hard-ness values increased with catchment area (fig. 6). Invariably, the in situ samples had the lowest values (36.3 to 141.3 mg/L CaCO3 equivalent), and the 28-day equilibrated samples had the highest (200.1 to 374.4 mg/L CaCO3 equivalent).
Iron, Aluminum, and ManganeseIron, aluminum, and manganese gener-
ally had low concentrations in the back-ground pore waters at the site (fig. 7). For all background sites, dissolved iron was below the detection limit (<20 µg/L) for the in situ and equilibrated splits but ranged from 30 to 436 µg/L in the centrifuged splits with the highest concentrations occurring in the Ely Brook headwaters and the lowest in the Ompompanoosuc River headwaters. Dis-solved aluminum concentrations ranged from 4.3 to 94.1 µg/L with the highest concentra-tions in the centrifuged splits. Dissolved manganese concentrations were slightly higher and ranged from 0.3 to 6,270 µg/L with concentrations increasing with catch-ment area. The in situ samples had the lowest concentrations, and the equilibrated samples had the highest, up to two orders of magni-tude higher.
Minor and Trace Inorganic ElementsMinor and trace elements generally
had low concentrations in the background pore waters at the site (fig. 7). Dissolved Ag, As, Cr, and Hg concentrations were all below their detection limits. Dissolved Ba concentrations ranged from 16.6 to 126 µg/L, dissolved Cd from <0.02 to 1.7 µg/L, dis-solved Cu from <0.5 to 10.2 µg/L, dissolved Ni from <0.4 to 4.1 µg/L, dissolved Pb from <0.05 to 0.9 µg/L, dissolved Sb from <0.3 to 0.9 µg/L, dissolved Se from <1 to 1.8 µg/L, and dissolved Zn from 1.5 to 29.2 µg/L. HIs for background pore-water samples were all below 1 (0.00–0.91) with the exception of the centrifuged split for EB-1080M, which had
an index of 9.6 due to elevated concentrations of copper and especially cadmium.
Dissolved Organic Carbon and NutrientsDOC and nutrient concentrations were determined only
on samples of in situ pore water. DOC concentrations through-out the study area ranged from 1.4 to 1.6 mg/L. Nutrients were
Ely Brook Schoolhouse Brook
Ompompan-oosuc River
1,080 60
0 903,6
703,1
002,4
001,3
60 140
24,05
023
,63023
,20043
238
534
532
029
019
5
Ely Ponds
770
RIVER METER AND REACH
Explanation
Graph A
B
A
Ely Brook Schoolhouse Brook
Ompompan-oosuc River
1,080 60
0 903,6
703,1
002,4
001,3
60 140
24,05
023
,63023
,20043
238
534
532
029
019
5
Ely Ponds
770
RIVER METER AND REACH
Graph B
Inflow of water from previous reach
Inflow of water from previous reach
CON
CEN
TRAT
ION
, IN
M
ICRO
GRAM
S PE
R LI
TER
1 .0
10
100
1,000
10,000
100,000
0.01
0.1
1
10
100
1,000
10,000
Cd: surfaceCd: in situ poreCu: surfaceCu: in situ poreZn: surfaceZn: in situ pore
CON
CEN
TRAT
ION
, IN
M
ICRO
GRAM
S PE
R LI
TER
Fe: surfaceFe: in situ poreAl: surfaceAl: in situ poreFe: detection limit
Cd: detection limitCu: detection limit
Figure 7. Downstream variations in (A) aluminum, iron, (B) cadmium, copper, and zinc concentrations in surface and in situ pore waters at the Ely Mine Superfund site, Vershire, VT.

26 Aquatic Assessment of the Ely Copper Mine Superfund Site, Vershire, Vermont
generally low throughout the study area. Total dissolved nitro-gen ranged from 0.07 to 1.04 mg/L, and total dissolved phos-phorus ranged from 0.003 to 0.006 mg/L with the Ompompa-noosuc River having the highest concentrations.
Comparisons with Ambient Water-Quality Criteria
Background concentrations for most elements in pore waters were less than AWQC with the exception being alumi-num, cadmium, and copper (appendix 7). Concentrations of these elements exceeded AWQC only locally for the centri-fuged pore-water samples. Concentrations of aluminum in the centrifuged background pore-water samples from Ely Brook and Schoolhouse Brook exceeded the chronic AWQC. Con-centrations of cadmium in the centrifuged background pore-waters samples from Ely Brook exceeded both the acute and chronic AWQC. Concentrations of copper in the centrifuged background pore-water samples from Ely Brook exceeded only the chronic AWQC.
Sediment GeochemistryThe major-element geochemistry of background sedi-
ments reflects their siliciclastic constituents. Chemical con-stituents for sediment samples are summarized in table 6, and complete analyses are reported in appendix 8. SEM-AVS data for sediment samples are summarized in table 7, and complete analyses are reported in appendix 4. Aluminum ranged from 3.1 to 4.3 weight percent in the background streams and was 6.7 weight percent in pond 1. The higher concentration of aluminum in the pond probably reflected a higher proportion of clays compared to the higher energy stream settings. Na, K, Ca, and Mg all ranged from 0.7 to 1.9 weight percent. Iron ranged from 1.4 to 2.8 weight percent in the stream sediments, and reached 4.4 weight percent in the pond 1 sediments. Car-bonate carbon was low, between 0.01 and 0.20 weight percent carbon, whereas total organic carbon in the stream sediments ranged from 0.32 to 0.37 weight percent, and was 8.0 weight percent in pond 1.
Table 6. Select chemistry results for sediments collected in August and September 2006 from the Ely Mine study area, Vershire, VT.
[wt. %, weight percent; mg/kg, milligrams per kilogram; —, not determined; <, analyte not detected at the reporting level]
Stream and location
Total C(wt. % as C)
CO2
(wt. % as C)
Carbonate(wt. % as C)
Total organic C
(wt. % as C)
Al(wt. %)
Ca(wt. %)
Fe(wt. %)
K(wt. %)
Mg(wt. %)
Na(wt. %)
S(wt. %)
Ag(mg/kg)
As(mg/kg)
Ba(mg/kg)
Cd(mg/kg)
PECa — — — — — — — — — — — — 33 — 4.98Ely Brook EB-1080M 0.35 0.04 0.01 0.34 4.26 1.05 2.76 1.03 0.98 1 0.04 <1 <1 249 0.1 EB-770M 0.55 0.07 0.02 0.53 4.81 1.24 5.5 1.06 1.01 1.06 0.3 <1 2 255 0.4 EB-600M 0.25 0.09 0.02 0.23 4.66 1.25 7.09 1.05 1.05 1.05 0.41 <1 3 236 1 EB-90M 0.28 0.06 0.02 0.26 3.98 1.13 16.7 0.95 0.76 1.06 1.7 3 2 166 1 EB-90M-OBS
(overbank sed.)
2.46 0.15 0.04 2.42 3.21 0.31 36.3 2.45 0.7 0.56 4.66 17 4 360 0.2
EB-20M 0.55 0.08 0.02 0.53 4.12 1.08 14.6 1.03 0.73 1.19 1.41 3 2 191 0.7Ely Ponds EM-POND1 8.04 0.16 0.04 8 6.68 1.93 4.39 0.89 1.56 1.78 0.42 <1 <1 276 0.8 EM-POND2 9.36 0.23 0.06 9.3 6.12 1.89 4.48 1.09 1.38 1.3 0.54 <1 <1 321 1.3 EM-POND3 10.4 0.26 0.07 10.33 5.49 1.47 5.84 0.84 1.22 0.91 0.37 <1 3 377 1.2 EM-POND4 10.1 0.18 0.05 10.05 5.63 1.11 3.88 1.11 1.25 0.69 0.34 <1 7 337 2.5 EM-POND5 9.57 0.26 0.07 9.5 6.45 0.92 4.99 0.79 1.02 0.89 0.71 <1 3 296 4 EM-POND6 6.54 0.27 0.07 6.47 11.1 0.67 3.5 0.75 0.73 0.65 0.93 <1 3 184 0.2Schoolhouse Brook SB-3670M 0.52 0.75 0.2 0.32 3.1 1.42 1.39 0.81 0.66 0.68 0.03 <1 3 207 <0.1 SB-3260M 0.39 0.48 0.13 0.26 3.56 1.43 5.88 0.82 0.62 0.8 0.42 <1 2 173 0.3 SB-2400M 0.41 0.69 0.19 0.22 3.61 1.34 2.03 0.86 0.63 0.76 0.08 <1 1 191 0.1 SB-1360M 0.4 0.56 0.15 0.25 3.48 1.62 2.78 0.85 0.67 0.79 0.1 <1 1 191 0.2 SB-140M 0.34 0.35 0.1 0.24 3.69 1.3 2.63 0.92 0.62 0.79 0.08 <1 1 198 0.2Ompompanoosuc River OR-24050M 0.41 0.15 0.04 0.37 3.27 1.13 1.4 0.8 0.73 0.72 0.02 <1 3 187 <0.1 OR-23200M 0.3 0.17 0.05 0.25 3.54 1.3 2.28 0.84 0.71 0.76 0.03 <1 5 195 0.1

Nature and Extent of Contamination 27
Table 6. Select chemistry results for sediments collected in August and September 2006 from the Ely Mine study area, Vershire, VT.—Continued
[wt. %, weight percent; mg/kg, milligrams per kilogram; —, not determined; <, analyte not detected at the reporting level]
Stream and
location
Co(mg/kg)
Cr(mg/kg)
Cu(mg/kg)
Hg(mg/kg)
Mn(mg/kg)
Mo(mg/kg)
Ni(mg/kg)
Pb(mg/kg)
Sb(mg/kg)
Se(mg/kg)
Sr(mg/kg)
Tl(mg/kg)
U(mg/kg)
V(mg/kg)
Zn(mg/kg)
PECa — 111 149 1.06 — — 48.6 128 — — — — — — 459Ely Brook EB-1080M 9.8 57 75.4 <0.02a 780 0.41 16.5 24.8 <0.05 0.3 133 0.3 0.9 73 56 EB-770M 22.4 66 1160 <0.02 2,090 2.11 20 14.6 0.06 4.1 111 0.3 1.4 96 122 EB-600M 65.5 64 2730 <0.02 1,820 8.33 23.4 174 1.15 8.1 99 0.3 1.6 97 186 EB-90M 14.4 62 5950 <0.02 2,200 17.4 10.6 38.1 2.03 30.1 73.1 0.3 0.7 112 206 EB-90M-OBS
(overbank sed.)
13.3 89 1440 0.13 429 44.5 19.9 78.6 0.53 71.1 55.3 1.3 0.9 154 147
EB-20M 15.1 67 3,700 0.03 1,020 16.2 15 38 1.15 35.2 92.2 0.3 0.8 112 196Ely Ponds EM-POND1 19.8 102 86.6 0.07 527 0.63 35.6 26.4 <0.05 0.7 172 0.4 2.3 163 126 EM-POND2 24 130 87.6 0.11 769 2.58 45.4 31.8 0.11 1.1 165 0.6 3.5 148 131 EM-POND3 30.9 85 81.7 0.15 3,130 2.15 38.6 43.7 0.3 1.4 134 0.8 3.5 125 127 EM-POND4 29.2 67 380 0.09 2,410 1.75 61.1 20.2 0.31 0.7 91.9 0.5 3.1 93 316 EM-POND5 78.3 70 3,540 0.09 1,430 2.54 56.8 23.5 0.97 1.3 76.5 0.5 5.7 79 507 EM-POND6 13.3 47 1,770 0.07 443 2.8 29.5 18.4 1.42 1.4 94.2 0.2 6.2 68 68Schoolhouse Brook SB-3670M 4.8 24 10.4 <0.02 501 0.28 13.2 11.2 0.15 <0.2 202 0.2 0.8 40 32 SB-3260M 11 40 1,390 <0.02 1,120 7.26 11.5 17.9 2.39 9.8 164 0.2 1 62 93 SB-2400M 10.8 23 167 <0.02 504 2.29 11.4 10.5 0.65 1.8 193 0.2 0.8 43 54 SB-1360M 9.6 28 198 <0.02 864 2.53 11.6 11 1.8 1.5 206 0.2 0.8 48 66 SB-140M 13.5 32 243 <0.02 869 2.59 13.6 31.4 2.14 1.1 188 0.2 0.9 52 85Ompompanoosuc River OR-24050M 4.5 37 4.5 <0.02 475 0.16 11.7 9.6 0.19 <0.2 198 0.2 0.7 38 33 OR-23200M 8.1 29 76.7 <0.02 1,120 0.5 10.8 10.4 0.22 0.3 193 0.2 0.8 49 53
a Probable effects concentration (MacDonald and others, 2000).
The concentrations of most trace elements were low, with the exception of Cr, Cu, and Ni. Maximum concentrations in the background stream and pond sediments were 3 milligrams per kilogram (mg/kg) for As, 0.07 mg/kg for Hg, 0.8 mg/kg for Cd, 102 mg/kg for Cr, 86.6 mg/kg for Cu, 35.6 mg/kg for Ni, 26.4 mg/kg for Pb, 0.7 mg/kg for Se, and 126 mg/kg for Zn.
Acid volatile sulfide for the stream-sediment samples for background sites was below the detection limit of 23 mg/kg (0.7 micromoles per gram, µmol/g) for all background stream sediments. The sum of the concentrations of simultaneously extracted metals (Cd + Cu + Pb + Ni + Zn) was low, rang-ing from 0.2 to 0.5 µmol/g with the Ely Brook site being the highest and the Ompompanoosuc River site being the lowest. Simultaneously extracted mercury was below the detection limit (0.2 mg/kg; 0.001 µmol/g).
PEC values are available for As, Cd, Cr, Cu, Hg, Ni, Pb, and Zn. In all cases for the background sites, including pond 1, the concentrations of these elements were below these limits. HIs for these elements in sediments were above 1 at
sites EB-1080M (1.1) and pond 1 (2), but below 1 at sites SB-3670M (0.6) and OR-24050M (0.4). The (ΣSEM-AVS)/fOC values for all background stream-sediment samples ranged from –160 to –60 µmol/gOC, which were well within the no-effects range, and well below the onset of uncertain effects at 150 µmol/gOC (USEPA, 2005).
Bioassay Results
Toxicity testing of sediments was done only on samples from the stream reaches. Tests were conducted using Hyalella azteca for 28-day exposures and Chironomus dilutus for 12-day exposures. For both organisms, both survival and growth endpoints were measured (table 8). For reference sites EB-1080M, SB-3670M, and OR-24050M, H. azteca had acceptable survival at 93.8 ± 1.8, 93.8 ± 4.6, and 93.8 ± 6.5 percent, respectively, during the 28-day tests. Growth in the reference organisms was 3.24 ± 0.05 mm for EB-1080M,

28 Aquatic Assessment of the Ely Copper Mine Superfund Site, Vershire, Vermont
Table 7. Acid volatile sulfide (AVS) and simultaneously extractable metals (SEM) results for stream sediments from the Ely Mine study area, Vershire, VT.
[%, percent; mg/kg, milligrams per kilogram; µmol/g, micromoles per gram]
Stream and location
Solidsa
(%)ASSb
(mg/kg)AVSc
(µmol/g)
SEMd
SEM/AVSeCd (µmol/g)
Cu (µmol/g)
Fe (µmol/g)
Pb(µmol/g)
Mn(µmol/g)
Ni (µmol/g)
Zn (µmol/g)
Hg (µmol/g)
Ely Brook EB-1080M 72.3 <10.9f <0.67 <0.0012 0.2 53.4 0.013 4.1 0.048 0.2 <0.0009 0 EB-770M 76.5 <10.5 <0.64 0.0012 5.4 48.3 0.011 2.1 0.036 0.3 <0.0008 0 EB-600M 79.4 <10.1 <0.61 0.0036 13.8 39.4 0.017 4.8 0.055 0.65 <0.00075 0 EB-90M 75.7 <10.2 <0.63 <0.0012 1.1 124.4 0.019 0.1 0.013 0.052 <0.0008 0Schoolhouse Brook SB-3670M 68.8 <11.6 <0.71 <0.0012 0.024 33.3 0.013 3.6 0.039 0.12 <0.0009 0 SB-2400M 77.9 <10.3 <0.64 <0.0012 0.99 39.8 0.0092 2.8 0.037 0.3 <0.0008 0 SB-1360M 74.9 <10.3 <0.65 <0.0012 1.0 35.8 0.0087 3.2 0.044 0.3 <0.0008 0 SB-140M 73.5 <10.8 <0.66 <0.0012 1.2 38.0 0.016 2.9 0.043 0.35 <0.00085 0Ompompanoosuc River OR-24050M 72.8 <10.9 <0.69 <0.0012 0.017 25.6 0.014 2.4 0.036 0.11 <0.00085 0 OR-23200M 69.7 <11.5 <0.68 <0.0012 0.27 19.2 0.0068 1.9 0.026 0.14 <0.0009 0
a Solids determined by Method IN623.b Acid soluble sulfide (total sulfide) detemined by SW846 Method 9030B/9034.c Acid volatile sulfide determined by SW846 Method 6010B.d Simultaneously extracteable metals detemined by SW846 Method 6010B(ICP-AES) for all metals except Hg, which was determined by Method 7471A
(cold-vapor atomic absorption).e SEM/AVS is the sum of the concentrations of all metals divided by AVS, which in this study was less than the detection limit.f <: analyte was analyzed for but not detected above reporting limit.
Table 8. Results of 28-day toxicity tests with the amphipod Hyalella azteca and of 10-day toxicity tests with the midge Chironomus dilutus exposed to sediments from Ely Mine site, fall 2006.
[%, percent; mm, millimeters; mg, milligrams; mean, mean value of eight replicates per sediment; std. err., standard error]
Stream and locationAmphipod, Hyalella azteca (28-day test) Midge, Chironomus dilutus (10-day test)
Survival (%) Total length (mm) Survival (%) Ash-free dry wt. (mg)Mean Std. err. Mean Std. err. Mean Std. err. Mean Std. err.
Control FL (C)a 96.3 1.8 3.23 0.08 86.3 4.2 1.30 0.10Ely Brook EB-1080M (R)b 93.8 1.8 3.24 0.05 63.8 6.5 1.21 0.11 EB-770M 68.8 5.8 2.45 0.06 61.3 4.8 0.61 0.11 EB-600M 6.3 2.6 1.96 0.11 65.0 6.0 0.28 0.01 EB-90M 91.3 4.0 3.39 0.06 72.5 4.5 1.73 0.37Schoolhouse Brook SB-3670M (R) 93.8 4.6 3.31 0.06 76.3 5.3 1.00 0.05 SB-2400M 52.5 7.5 2.43 0.11 80.0 4.2 0.78 0.04 SB-1360M 64.3 6.1 2.53 0.11 62.5 5.9 1.28 0.08 SB-140M 52.5 9.4 2.55 0.13 67.5 3.7 0.81 0.05 SB-140M (D)c 68.8 4.4 2.48 0.12 83.8 4.6 0.59 0.05Ompompanoosuc River OR-24050M (R) 93.8 6.5 3.21 0.02 90.0 1.9 1.06 0.08 OR-23200M 91.3 3.0 3.17 0.07 83.8 6.0 0.96 0.14
a C, indicates laboratory control sediment.b R, indicates local reference sites.c D, indicates lab duplicate.

Nature and Extent of Contamination 29
was 3.31 ± 0.06 mm for SB-3670M, and was 3.21 ± 0.02 mm for OR-24050M. In contrast, survival for C. dilutus was lower in EB-1080M (63.8 ± 6.5 percent), SB-3670M (76.3 ± 5.3 per-cent), and OR-24050M (90.0 ± 1.9 percent). Growth, on an ash-free dry-weight basis, was 1.21 ± 0.11 mg for EB-1080M, 1.00 ± 0.05 mg for SB-3670M, and 1.06 ± 0.08 mg for OR-24050M.
Ecological Indicators
An evaluation of ecological indicators used to assess the relative ecosystem health across the sites indicated that background surface-water sites had well-established aquatic communities (figs. 8–10 and table 9). RTH invertebrate data for site EB-1080M reflected a good ecological structure and function. Invertebrate richness at site EB-1080M was 43 taxa, and abundance was 1,756 individuals. Depositional-targeted habitat (DTH) invertebrate data also reflected a good eco-logical structure and function. Invertebrate richness at site EB-1080M was 34 taxa, and abundance was 415 individuals. QMH invertebrate data for pond 1 also reflected a good eco-logical structure and function. Invertebrate richness at pond 1 was 59 taxa. Invertebrate abundance was high in pond 1 (1,950 individuals).
At the Schoolhouse Brook reference site (SB-3670M), RTH inverterbrate data reflected a good ecological structure and function. Invertebrate richness at site SB-3670M was 56 taxa, and abundance was 3,900 individuals. DTH inver-tebrate data also reflected a good ecological structure and function. Invertebrate richness at site SB-3670M was 30 taxa, and abundance was 161 individuals. The index of biotic integrity for fish was 42. Likewise, at the Ompompanoosuc River reference site (OR-24050M), RTH invertebrate data
reflected a good ecological structure and function. Invertebrate richness at site OR-24050M was 84 taxa, and abundance was 2,864 individuals. DTH invertebrate data also reflected a good ecological structure and function. Invertebrate richness at site OR-24050M was 21 taxa, and abundance was 160 individuals. The index of biotic integrity for fish was 33.
Ely Brook Tributaries
Surface-Water Geochemistry
Four tributaries flow into Ely Brook from the east and come in contact with mine waste or drain mine shafts directly (fig. 2). Each of the tributaries was analyzed individually to determine if there were significant differences in water chem-istry based on previously published data (Argue and others, 2008). For this analysis, seep 13 was grouped with locations on tributary 1, seeps 6, 7, 10, 11, and 14 were grouped with locations on tributary 2, seeps 2–5, 8, 9, 15–18, 20, and 21 were grouped with locations on tributary 3, and seeps 1, 12, and 19 were grouped with locations on tributary 4. Tributary 2 includes a series of ponds (ponds 1–6), which are the focus of this study and the focus of amphibian studies in the baseline ecological risk assessment (TechLaw, Inc., 2008). Chemi-cal constituents for surface-water samples are summarized in table 4, and complete analyses are reported in appendix 6.
Field Parameters and Major Inorganic Constituents
In general, the gross chemical properties of the tribu-tary 2 pond-water samples display systematic degradation moving downstream from pond 1, the reference site, through ponds 2 through 5. The pH of tributary 2 dropped from 7.0
Ely Pond
1
10
100
1,000
0
10
20
30
40
50
60A B
Ely Pond 1 2 3 4 5 6 1 2 3 4 5 6
Inve
rtebr
ate
Abun
danc
e
2,000
Inve
rtebr
ate
Rich
ness
Figure 8. Qualitative multi-habitat (QMH) invertebrate (A) abundance and (B) richness values among the Ely ponds, Vershire, VT. Pond 1 was farthest upgradient from sources of contamination and was used to represent background conditions. Locations are situated in the frames from up- to downgradient.

30 Aquatic Assessment of the Ely Copper Mine Superfund Site, Vershire, Vermont
1
10
100
1,000
0
10
20
30
40
50A B
1
10
100
1,000
0
10
20
30
40
50
60C D
24,050 23,630 23,2001
10
100
1,000
0
10
20
30
40
50
60
70
80
90E F
River Meter and Reach
Ompompanoosuc River24,050 23,630 23,200
Ompompanoosuc River
7,000
4,000
3,670 3,100 2,400 1,360 140 Schoolhouse Brook
3,670 3,100 2,400 1,360 140 Schoolhouse Brook
2,000
1,080 770 600 90 Ely Brook
1,080 770 600 90 Ely Brook
Inve
rtebr
ate
Abun
danc
eIn
verte
brat
e Ab
unda
nce
Inve
rtebr
ate
Abun
danc
e
Inve
rtebr
ate
Rich
ness
Inve
rtebr
ate
Rich
ness
Inve
rtebr
ate
Rich
ness
Figure 9. Riffle-targeted habitat (RTH) invertebrate (A) abundance and (B) richness values in Ely Brook, (C) abundance and (D) richness values in Schoolhouse Brook, and (E) abundance and (F) richness values in the Ompompanoosuc River. The first location in each of the frames was farthest upgradient from sources of contamination and was used to represent background conditions for the stream.
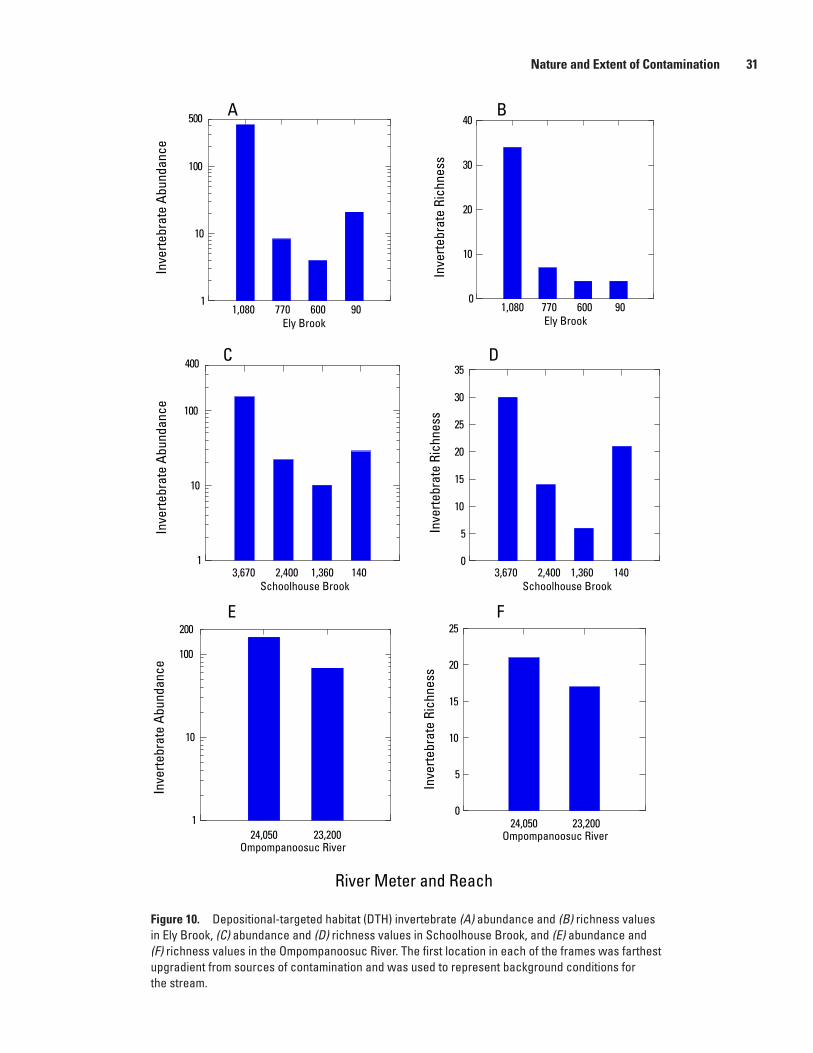
Nature and Extent of Contamination 31
1
10
100
0
10
20
30
40A B
1
10
100
0
5
10
15
20
25
30
35C D
1
10
100
0
5
10
15
20
25E F
1,080 770 600 90 Ely Brook
1,080 770 600 90 Ely Brook
3,670 2,400 1,360 140 Schoolhouse Brook
3,670 2,400 1,360 140 Schoolhouse Brook
24,050 23,200
River Meter and Reach
Ompompanoosuc River
24,050 23,200Ompompanoosuc River
500
400
200
Inve
rtebr
ate
Abun
danc
eIn
verte
brat
e Ab
unda
nce
Inve
rtebr
ate
Abun
danc
e
Inve
rtebr
ate
Rich
ness
Inve
rtebr
ate
Rich
ness
Inve
rtebr
ate
Rich
ness
Figure 10. Depositional-targeted habitat (DTH) invertebrate (A) abundance and (B) richness values in Ely Brook, (C) abundance and (D) richness values in Schoolhouse Brook, and (E) abundance and (F) richness values in the Ompompanoosuc River. The first location in each of the frames was farthest upgradient from sources of contamination and was used to represent background conditions for the stream.
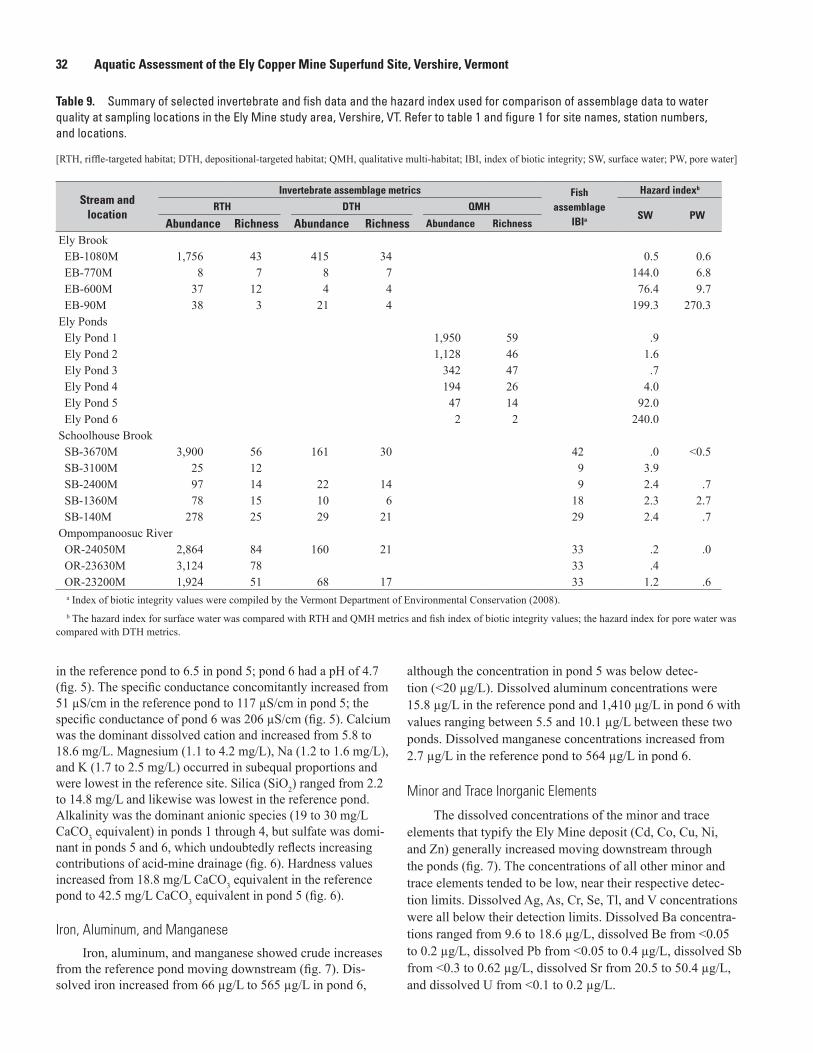
32 Aquatic Assessment of the Ely Copper Mine Superfund Site, Vershire, Vermont
in the reference pond to 6.5 in pond 5; pond 6 had a pH of 4.7 (fig. 5). The specific conductance concomitantly increased from 51 µS/cm in the reference pond to 117 µS/cm in pond 5; the specific conductance of pond 6 was 206 µS/cm (fig. 5). Calcium was the dominant dissolved cation and increased from 5.8 to 18.6 mg/L. Magnesium (1.1 to 4.2 mg/L), Na (1.2 to 1.6 mg/L), and K (1.7 to 2.5 mg/L) occurred in subequal proportions and were lowest in the reference site. Silica (SiO2) ranged from 2.2 to 14.8 mg/L and likewise was lowest in the reference pond. Alkalinity was the dominant anionic species (19 to 30 mg/L CaCO3 equivalent) in ponds 1 through 4, but sulfate was domi-nant in ponds 5 and 6, which undoubtedly reflects increasing contributions of acid-mine drainage (fig. 6). Hardness values increased from 18.8 mg/L CaCO3 equivalent in the reference pond to 42.5 mg/L CaCO3 equivalent in pond 5 (fig. 6).
Iron, Aluminum, and Manganese
Iron, aluminum, and manganese showed crude increases from the reference pond moving downstream (fig. 7). Dis-solved iron increased from 66 µg/L to 565 µg/L in pond 6,
although the concentration in pond 5 was below detec-tion (<20 µg/L). Dissolved aluminum concentrations were 15.8 µg/L in the reference pond and 1,410 µg/L in pond 6 with values ranging between 5.5 and 10.1 µg/L between these two ponds. Dissolved manganese concentrations increased from 2.7 µg/L in the reference pond to 564 µg/L in pond 6.
Minor and Trace Inorganic Elements
The dissolved concentrations of the minor and trace elements that typify the Ely Mine deposit (Cd, Co, Cu, Ni, and Zn) generally increased moving downstream through the ponds (fig. 7). The concentrations of all other minor and trace elements tended to be low, near their respective detec-tion limits. Dissolved Ag, As, Cr, Se, Tl, and V concentrations were all below their detection limits. Dissolved Ba concentra-tions ranged from 9.6 to 18.6 µg/L, dissolved Be from <0.05 to 0.2 µg/L, dissolved Pb from <0.05 to 0.4 µg/L, dissolved Sb from <0.3 to 0.62 µg/L, dissolved Sr from 20.5 to 50.4 µg/L, and dissolved U from <0.1 to 0.2 µg/L.
Table 9. Summary of selected invertebrate and fish data and the hazard index used for comparison of assemblage data to water quality at sampling locations in the Ely Mine study area, Vershire, VT. Refer to table 1 and figure 1 for site names, station numbers, and locations.
[RTH, riffle-targeted habitat; DTH, depositional-targeted habitat; QMH, qualitative multi-habitat; IBI, index of biotic integrity; SW, surface water; PW, pore water]
Stream andlocation
Invertebrate assemblage metrics Fish assemblage
IBIa
Hazard indexb
RTH DTH QMHSW PW
Abundance Richness Abundance Richness Abundance Richness
Ely Brook EB-1080M 1,756 43 415 34 0.5 0.6 EB-770M 8 7 8 7 144.0 6.8 EB-600M 37 12 4 4 76.4 9.7 EB-90M 38 3 21 4 199.3 270.3Ely Ponds Ely Pond 1 1,950 59 .9 Ely Pond 2 1,128 46 1.6 Ely Pond 3 342 47 .7 Ely Pond 4 194 26 4.0 Ely Pond 5 47 14 92.0 Ely Pond 6 2 2 240.0Schoolhouse Brook SB-3670M 3,900 56 161 30 42 .0 <0.5 SB-3100M 25 12 9 3.9 SB-2400M 97 14 22 14 9 2.4 .7 SB-1360M 78 15 10 6 18 2.3 2.7 SB-140M 278 25 29 21 29 2.4 .7Ompompanoosuc River OR-24050M 2,864 84 160 21 33 .2 .0 OR-23630M 3,124 78 33 .4 OR-23200M 1,924 51 68 17 33 1.2 .6
a Index of biotic integrity values were compiled by the Vermont Department of Environmental Conservation (2008).b The hazard index for surface water was compared with RTH and QMH metrics and fish index of biotic integrity values; the hazard index for pore water was
compared with DTH metrics.

Nature and Extent of Contamination 33
The metals associated with the deposit have distinctly higher dissolved concentrations in the ponds. Dissolved Cd concentrations ranged from <0.02 to 2.28 µg/L, dissolved Co from 0.03 to 46.3 µg/L, dissolved Cu from 1.1 to 1,380 µg/L, dissolved Ni from <0.4 to 16.7 µg/L, and dissolved Zn from 2.3 to 325 µg/L. HIs (Cd + Cu + Ni + Pb + Zn) comparing surface-water quality at these sites to hardness-based chronic ambient water-quality standards ranged from 0.82 in the reference pond up to 244 in pond 6 (table 10). HIs generally increased moving downstream and indicate significant poten-tial for impairment in ponds 5 and 6, and possibly 4.
Dissolved Organic Carbon and Nutrients
DOC concentrations throughout the study area ranged from 1.1 to 3.5 mg/L with Ely pond 1 having the highest val-ues. Nutrients were generally low throughout the study area.
Total dissolved nitrogen ranged from 0.10 to 0.46 mg/L, and total dissolved phosphorus ranged from 0.003 to 0.036 mg/L.
Comparisons with Ambient Water-Quality Criteria and Relations among Reaches
The four tributaries that flow into Ely Brook from the east all come in contact with mine waste or drain mine shafts directly (fig. 2). Concentrations of elements greater than AWQC were observed in tributary 1 for Al, Ba, Cd, Co, Cu, Mn, and Zn; in tributary 2 for Al, Ba, Cd, Cr, Co, Cu, Fe, Mn, Ni, U, and Zn; in tributary 3 for Al, Ba, Cd, Cr, Co, Cu, Fe, Pb, Mn, Se, U, and Zn; and in tributary 4 for Al, Ba, Cd, Cr, Co, Cu, Fe, Mn, Ni, Se, U, and Zn (fig. 11, appendix 2). Median concentrations of most elements in surface waters of tributary 1 were similar to or less than background condi-tions with the exception of copper, which was higher (fig. 11).
Table 10. Summary of the hazard quotient and hazard index for select constituents in waters and stream sediments at sampling locations in the Ely Mine study area, Vershire, VT, August 21 to 23, 2006. Refer to table 1 and figure 1 for site names, station numbers, and locations.
[SW, surface water; PW, in situ pore water; SED, sediment; —, not determined because analyte concentration is below the reporting level]
Stream andlocation
Hazard quotientHazard index
Cadmium Copper Nickel Lead Zinc
SW PW SED SW PW SED SW PW SED SW PW SED SW PW SED SW PW SED
Ely Brook
EB-1080M — — 0.0 0.3 0.6 0.5 0.0 0.0 0.3 — 0.1 0.2 0.1 0.6 0.1 0.4 1.3 1.1
EB-770M 5.8 2.0 0.1 153 6.0 7.8 0.4 0.2 0.4 0.07 0.2 0.1 1.6 0.8 0.3 161 9.2 8.7
EB-600M 3.3 2.1 0.2 45 9.4 18 0.2 0.2 0.5 0.05 — 1.4 1.0 0.4 0.4 50 12 21
EB-90M 9.8 9.3 0.2 222 262.2 40 0.5 0.4 0.2 0.51 1.1 0.3 4.0 5.7 0.4 237 279 41
Ely Ponds
Ely Pond 1 — 0.2 0.5 0.6 — 0.7 0.23 0.2 0.1 0.3 0.8 2
Ely Pond 2 — 0.3 1.1 0.6 0.0 0.9 0.16 0.2 0.3 0.3 1.6 2.3
Ely Pond 3 — 0.2 0.6 0.5 0.0 0.8 0.17 0.3 0.1 0.3 0.9 2.1
Ely Pond 4 0.8 0.5 4.2 2.6 0.1 1.3 0.15 0.2 0.3 0.7 5.6 5.3
Ely Pond 5 7.5 0.8 103 24 0.3 1.2 — 0.2 2.5 1.1 113 27
Ely Pond 6 12.7 0.0 227 12 0.5 0.6 0.26 0.1 4.0 0.1 244 13
Schoolhouse Brook
SB-3670M — — — — — 0.1 — — 0.3 0.02 0.0 0.1 0.0 0.0 0.1 0.0 0 0.6
SB-3100M 0.5 5.0 0.0 0.03 0.1 5.6
SB-2400M 0.3 0.3 0.0 2.8 0.7 1.1 0.0 0.0 0.2 — — 0.1 0.1 0.0 0.1 3.2 1 1.5
SB-1360M 0.3 0.2 0.0 2.6 1.1 1.3 0.0 0.0 0.2 — 0.1 0.1 0.2 0.1 0.1 3.1 1.5 1.7
SB-140M 0.2 0.2 0.0 2.6 0.6 1.6 0.0 0.0 0.3 0.05 0.1 0.2 0.1 0.0 0.2 3.0 0.9 2.3
Ompompanoosuc River
OR-24050M — — — 0.1 0.0 0.0 — 0.0 0.2 0.04 — 0.1 0.1 — 0.1 0.2 0 0.4
OR-23630M 0.1 0.4 — 0.03 0.1 0.6
OR-23200M 0.4 0.3 0.0 1.1 0.5 0.5 0.0 0.0 0.2 0.09 0.1 0.1 0.1 0.0 0.1 1.7 0.9 0.9

34 Aquatic Assessment of the Ely Copper Mine Superfund Site, Vershire, Vermont
TOTAL ALUMINUM
6
2923
6
9
AWQC
10
100
1,000
10,000
100,000
500,000DISSOLVED BARIUM
96
23
276
50
8
6 23 30
6
1
10
100
.0001
.001
.01
.1
1
10
DISSOLVED CADMIUM
DISSOLVED COBALT5,000
9
6
23 30
6
.01
.1
1
10
100
1,000
DISSOLVED CHROMIUM500
9
6
23 30
6
.01
.1
1
10
100
DISSOLVED COPPER
9
6
23 30
6
.1
1
10
100
1,000
10,000
100,000
Trib 2 Trib 4 Trib 3 Trib 2 Trib 1 Background (0-340m) (>340m)
CON
CEN
TRAT
ION
, IN
MIC
ROGR
AMS
PER
LITE
R
CON
CEN
TRAT
ION
, IN
MIC
ROGR
AMS
PER
LITE
R
ELY BROOK TRIBUTARIES
Trib 2 Trib 4 Trib 3 Trib 2 Trib 1 Background (0-340m) (>340m)
ELY BROOK TRIBUTARIES
DISSOLVED LEADDISSOLVED IRON
1
10
100
1,000
10,000
100,000
1,000,000
8
3
17 19
3
5
9
6
23
30
6
.01
.1
1
Figure 11. Select constituent concentrations in surface waters among four tributaries to Ely Brook at the Ely Mine Superfund site, Vershire, VT. Data are from this study and Argue and others (2008).
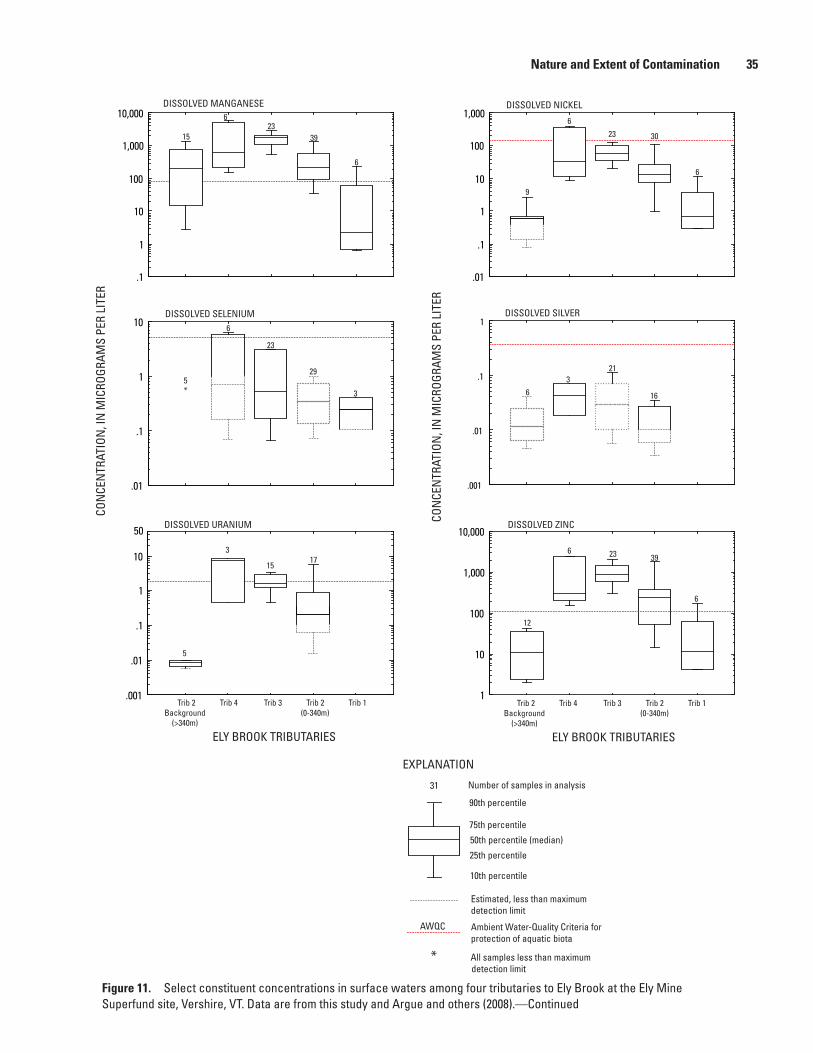
Nature and Extent of Contamination 35
DISSOLVED SILVER
63
21
16
.001
.01
.1
1
DISSOLVED URANIUM50
5
3
1517
.001
.01
.1
1
10
DISSOLVED MANGANESE
15
6
3923
6
.1
1
10
100
1,000
10,000
DISSOLVED SELENIUM6
23
29
3
.01
.1
1
10
5*
* All samples less than maximum detection limit
90th percentile
25th percentile
75th percentile
50th percentile (median)
10th percentile
EXPLANATION
31 Number of samples in analysis
Trib 2 Trib 4 Trib 3 Trib 2 Trib 1 Background (0-340m) (>340m)
ELY BROOK TRIBUTARIES
Trib 2 Trib 4 Trib 3 Trib 2 Trib 1 Background (0-340m) (>340m)
ELY BROOK TRIBUTARIES
AWQC Ambient Water-Quality Criteria forprotection of aquatic biota
Estimated, less than maximumdetection limit
DISSOLVED NICKEL
9
623 30
6
.01
.1
1
10
100
1,000
DISSOLVED ZINC
CON
CEN
TRAT
ION
, IN
MIC
ROGR
AMS
PER
LITE
R
CON
CEN
TRAT
ION
, IN
MIC
ROGR
AMS
PER
LITE
R
12
6 23 39
6
1
10
100
1,000
10,000
Figure 11. Select constituent concentrations in surface waters among four tributaries to Ely Brook at the Ely Mine Superfund site, Vershire, VT. Data are from this study and Argue and others (2008).—Continued

36 Aquatic Assessment of the Ely Copper Mine Superfund Site, Vershire, Vermont
Concentrations of most elements in surface waters of tribu-taries 2, 3, and 4 were greater than background conditions by 1 to 4 orders of magnitude (fig. 11) with the exceptions being Ba, which was similar among all tributaries and back-ground conditions (rho > 0.05), Cr, Fe, Mn, Se, and Ag, which were similar between tributary 2 and background conditions (rho > 0.05), and Se and Ag, which were similar between tributary 3 and background conditions (rho > 0.05).
Statistically significant differences were observed among tributaries for some trace-element concentrations. Most trace-element concentrations in tributary 1 were less than and significantly different from tributaries 2, 3, and 4 (rho < 0.05). However, Al and Cu concentrations were similar (rho > 0.05) between tributaries 1 and 2. Concentrations of Al, Cr, Co, Fe, Mn, Ni, U, and Zn in tributary 2 were generally less than and significantly different from tributary 3 (rho < 0.05). Concentra-tions of trace elements were similar between tributaries 2 and 4 (rho > 0.05) and between tributaries 3 and 4 (rho > 0.05) with the exception being lead in tributary 3, which was generally greater than and significantly different from tributary 4 (rho < 0.05).
Sediment GeochemistryThe major-element geochemistry of the pond sediments
reflects their siliciclastic constituents. Chemical constituents for sediment samples are summarized in table 6, and complete analyses are reported in appendix 8. Aluminum concentrations ranged from 5.5 to 11.1 weight percent in the pond sediments, and was 6.7 weight percent in the reference pond, pond 1. Na, K, Ca, and Mg all ranged from 0.7 to 1.9 weight percent. Iron concentrations ranged from 3.5 to 5.8 weight percent in the pond sediments, and was 4.4 weight percent in the sedi-ments of pond 1. Manganese concentrations were low, ranging between 443 and 3,130 mg/kg. Carbonate carbon concentra-tions are uniformly low, between 0.04 and 0.07 weight percent carbon, whereas total organic carbon concentrations in the pond sediments were high ranging from 6.5 to 10.4 weight percent. Total sulfur concentrations ranged between 0.34 and 0.93 weight percent.
The concentrations of trace elements were variable, with the exception of copper, which had a systematic increase downstream through the ponds from 81.7 to 3,540 mg/kg. The ranges in concentrations in pond sediments for Ag (<1 mg/kg), As (<1–7 mg/kg), Cd (0.2–2.5 mg/kg), Co (13.3–78.3 mg/kg), Cr (47–130 mg/kg), Hg (0.07–0.15 mg/kg), Mo (0.63–2.58 mg/kg), Ni (29.5–61.1 mg/kg), Pb (18.4–43.7 mg/kg), Sb (<0.05–1.42 mg/kg), Se (0.7–1.4 mg/kg), U (2.3–6.2 mg/kg), V (68–163 mg/kg), and Zn (68–507 mg/kg) did not correlate with distance downstream from the reference pond. None of the ponds exceeded the PEC values for As, Cd, Hg, Pb, or Zn. Pond 2 exceeded the Cr PEC, ponds 4 and 5 exceeded both the Cu and Ni PECs, and pond 6 only exceeded the Cu PEC. HIs for Cd, Cu, Ni, Pb, and Zn in pond sediments were above 1 at all sites (table 10). The values generally increase downstream from 2 in the reference pond to 27 in pond 5, and then the values drop to 13 in pond 6.
Ecological IndicatorsAn evaluation of the QMH invertebrate data sampled
within the ponds indicated that impairment sequentially increased from pond 1 to 6, but that impairment was most severe beginning at pond 4, and continued downgradient from that location (fig. 8; table 9). For example, invertebrate rich-ness at pond 1 was 59 taxa, which decreased to 47 at pond 3 (20 percent loss), but further decreased to 26 at pond 4 (56 per-cent loss). Although QMH-based invertebrate abundance is typically not considered a definitive metric of condition, it can often be used to indicate a relative degree of ecosystem function when sampling effort is standardized. Invertebrate abundance was highest at pond 1 (1,950 individuals) but was reduced an order of magnitude at pond 4 (194 individuals) and three orders of magnitude by pond 6 (2 individuals). Decreases in the values of abundance and richness were closely associ-ated with the increase in surface-water metal concentrations, as characterized by the HIs derived for the sites (fig. 12; table 9). The in situ amphibian embryo-larval toxicity testing done in 2007 provides additional insights into the ecological health of the ponds. For these tests, wood frog egg masses were col-lected from an offsite reference pond and placed within enclo-sures in Ely Mine ponds 1, 4, and 5. Ponds 4 and 5 showed high mortality in recently hatched larvae, and pond 4 also had decreased larval survival over time (TechLaw, Inc., 2008).
Ely Brook
Surface-Water GeochemistryFour sites were sampled in Ely Brook in August 2006,
one of which was upstream of mine-impacted drainage and was also discussed in the background conditions section (EB-1080M). The three other Ely Brook sites include site EB-770M located 10 m downstream of Ely Brook tributary 4, site EB-600M located 200 m downstream of Ely Brook tribu-tary 4 and upstream of Ely Brook tributary 2, and site EB-90M located downstream of Ely Brook tributary 1 and upstream of the confluence with Schoolhouse Brook. Data from these sites from this study will be used to examine downstream variations in chemistry. Chemical constituents for surface-water samples are summarized in table 4, and complete analyses are reported in appendix 6.
Field Parameters and Major Inorganic ConstituentsThe pH of Ely Brook fluctuated from 7.2 at background
site EB-1080M to 6.3 at EB-770M to 7.0 at EB-600M and then decreased drastically to 3.2 at EB-90M. In contrast to pH, specific conductance increased from 87 µS/cm (EB-1080M) to 149 µS/cm (EB-770M), then decreased to 123 µS/cm (EB-600M), and then increased drastically to 447 µS/cm (EB-90M) (fig. 5). The major dissolved cations (Ca, K, Mg, Na, SiO2) and hardness fluctuated in the same manner as the specific conductance. Calcium (13.4 to 21.1 mg/L) and SiO2 (9.1 to 33.1 mg/L) were the dominant dissolved cations and occurred in subequal proportions; other major cations include

Nature and Extent of Contamination 37
K (1.69 to 3.42 mg/L), Mg (1.18 to 5.54 mg/L), and Na (1.12 to 2.3 mg/L). Alkalinity was the dominant anionic species in the background conditions sample (EB-1080M) with a con-centration of 41 mg/L CaCO3 (fig. 6). In contrast, sulfate domi-nated in the mine-impacted Ely Brook samples (EB-770M to EB-90M) with concentrations ranging from 36 to 143 mg/L (fig. 6). In comparison, chloride concentrations only reached 2.6 mg/L. Previous reports found similar results (Seal and oth-ers, 2001; Holmes and others, 2002; Argue and others, 2008).
Iron, Aluminum, and Manganese
The concentrations of dissolved Mn (92.8 to 217 µg/L) were considerably higher than the concentrations of dissolved Al (3.4 to 25.1 µg/L) and Fe (<20 to 22 µg/L) in the three most upstream Ely Brook surface waters (EB-1080M, EB-770M, and EB-600M) (fig. 7). In contrast, Fe (6,370 µg/L) and Al (4,190 µg/L) dominated at EB-90M in comparison to Mn (521 µg/L). The concentrations of dissolved aluminum and manganese followed the same trends downstream as the major cations and anions discussed above. Specifically, the concentrations of aluminum and manganese increased from EB-1080M to EB-770M, then decreased at EB-600M, and then increased drastically at EB-90M.
Minor and Trace Inorganic Elements
The only minor and trace elements present in significant concentrations in August 2006 in Ely Brook were Ba (17 to 19.9 µg/L), Cd (<0.02 to 1.99 µg/L), Co (0.08 to 63 µg/L), Cu (1.3 to 1,560 µg/L), Ni (0.5 to 19.5 µg/L ), Sr (47.6 to 64 µg/L), and Zn (5.6 to 373 µg/L) (fig. 7). In comparison,
historical variations for Ely Brook showed a greater range (appendix 2). For example, historical dissolved copper concentrations, the most significant contaminant, approach 8,000 µg/L (Argue and others, 2008). Trace amounts of dis-solved Be (up to 0.3 µg/L), Pb (up to 0.95 µg/L), and U (up to 0.42 µg/L) were detected in some samples. The minimum value reported above was generally for background site EB-1080M, whereas the maximum value was for the farthest downstream site (EB-90M). The following elements follow this trend: Be, Cd, Co, Cu, Ni, Pb, Sr, U, and Zn. Dissolved Ag, As, Hg, Sb, Se, Tl, and V concentrations were all below their detection limits.
Dissolved Organic Carbon and Nutrients
DOC concentrations throughout Ely Brook ranged from 0.8 to 1.9 mg/L. Nutrients were generally low throughout the study area. Total dissolved nitrogen ranged from 0.04 to 0.07 mg/L, and total dissolved phosphorus ranged from 0.002 to 0.004 mg/L.
Trace Element Loads
Coupled streamflow measurements and surface-water samples obtained at sites EB-90M, EB-600M, EB-770M, and EB-1080M on August 23, 2006, were used to describe transport and attenuation of constituents in Ely Brook. Back-ground conditions were characterized by samples obtained at EB-1080M. Instantaneous loads for most elements increased above background conditions by 1 to 2 orders of magnitude at EB-770M, below the confluence with Ely Brook tributary 4 (fig. 13). Total iron loads, however, were similar. As waters
1 10 100 1,000Hazard Index
1
10
100
1,000
10,000
Inve
rtebr
ate
Abu
ndan
c e
Pond 3
Pond 1
Pond 2
Pond 6
Pond 5
Pond 4
1 10 100 1,0000
10
20
30
40
50
60
70
Inve
rtebr
ate
Ric
hnes
s
Pond 3
Pond 1
Pond 2
Pond 6
Pond 5
Pond 4
A B
Hazard Index
Explanation
Sample location and identifier Pond 6
Figure 12. Qualitative multi-habitat (QMH) invertebrate (A) abundance and (B) richness values relative to the gradient in hazard index values derived from trace metal concentration in surface-waters from the Ely ponds, Vershire, VT.

38 Aquatic Assessment of the Ely Copper Mine Superfund Site, Vershire, Vermont
.1
1
10
100
1,000
10,00020,000
.001
.01
.1
1
10
100
1,000
.0001
5,000
INST
ANTA
NEO
US L
OAD,
IN G
RAM
S PE
R DA
Y
Zinc: Total
Copper: Total
Cobalt: Total
Cadmium: Total
Zinc: Dissolved
Copper: Dissolved
Cobalt: Dissolved
Cadmium: Dissolved
Manganese: Total
Iron: Total
Aluminum: Total
Manganese: Dissolved
Iron: Dissolved
Aluminum: Dissolved
Explanation
Graph A Graph B
RIVER METER AND REACH
Ely Brook Schoolhouse Brook Ompompanoosuc River1,080 770 600 90 3,670 3,100 2,400 1,360 140 24,050 23,630 23,200
Ely Brook Schoolhouse Brook Ompompanoosuc River1,080 770 600 90 3,670 3,100 2,400 1,360 140 24,050 23,630 23,200
B
A
Figure 13. Instantaneous (A) aluminum, iron, and manganese, and (B) cadmium, cobalt, copper, and zinc loads at the Ely Mine Superfund site, Vershire, VT.
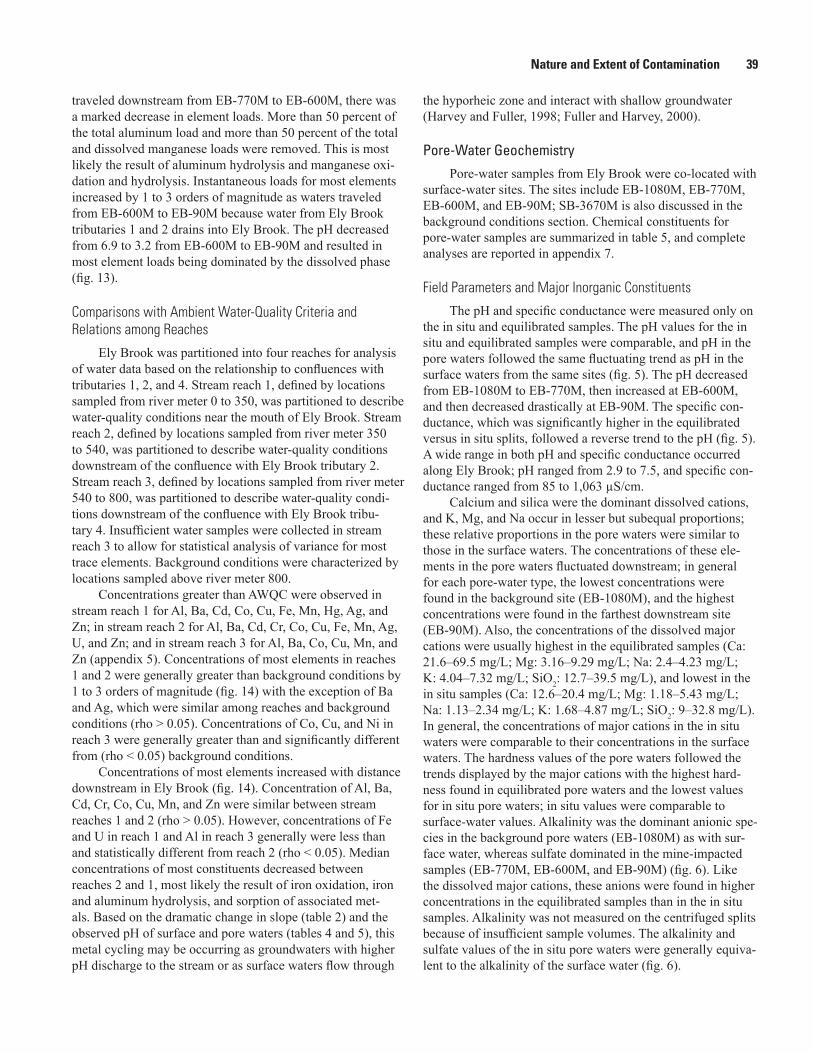
Nature and Extent of Contamination 39
traveled downstream from EB-770M to EB-600M, there was a marked decrease in element loads. More than 50 percent of the total aluminum load and more than 50 percent of the total and dissolved manganese loads were removed. This is most likely the result of aluminum hydrolysis and manganese oxi-dation and hydrolysis. Instantaneous loads for most elements increased by 1 to 3 orders of magnitude as waters traveled from EB-600M to EB-90M because water from Ely Brook tributaries 1 and 2 drains into Ely Brook. The pH decreased from 6.9 to 3.2 from EB-600M to EB-90M and resulted in most element loads being dominated by the dissolved phase (fig. 13).
Comparisons with Ambient Water-Quality Criteria and Relations among Reaches
Ely Brook was partitioned into four reaches for analysis of water data based on the relationship to confluences with tributaries 1, 2, and 4. Stream reach 1, defined by locations sampled from river meter 0 to 350, was partitioned to describe water-quality conditions near the mouth of Ely Brook. Stream reach 2, defined by locations sampled from river meter 350 to 540, was partitioned to describe water-quality conditions downstream of the confluence with Ely Brook tributary 2. Stream reach 3, defined by locations sampled from river meter 540 to 800, was partitioned to describe water-quality condi-tions downstream of the confluence with Ely Brook tribu-tary 4. Insufficient water samples were collected in stream reach 3 to allow for statistical analysis of variance for most trace elements. Background conditions were characterized by locations sampled above river meter 800.
Concentrations greater than AWQC were observed in stream reach 1 for Al, Ba, Cd, Co, Cu, Fe, Mn, Hg, Ag, and Zn; in stream reach 2 for Al, Ba, Cd, Cr, Co, Cu, Fe, Mn, Ag, U, and Zn; and in stream reach 3 for Al, Ba, Co, Cu, Mn, and Zn (appendix 5). Concentrations of most elements in reaches 1 and 2 were generally greater than background conditions by 1 to 3 orders of magnitude (fig. 14) with the exception of Ba and Ag, which were similar among reaches and background conditions (rho > 0.05). Concentrations of Co, Cu, and Ni in reach 3 were generally greater than and significantly different from (rho < 0.05) background conditions.
Concentrations of most elements increased with distance downstream in Ely Brook (fig. 14). Concentration of Al, Ba, Cd, Cr, Co, Cu, Mn, and Zn were similar between stream reaches 1 and 2 (rho > 0.05). However, concentrations of Fe and U in reach 1 and Al in reach 3 generally were less than and statistically different from reach 2 (rho < 0.05). Median concentrations of most constituents decreased between reaches 2 and 1, most likely the result of iron oxidation, iron and aluminum hydrolysis, and sorption of associated met-als. Based on the dramatic change in slope (table 2) and the observed pH of surface and pore waters (tables 4 and 5), this metal cycling may be occurring as groundwaters with higher pH discharge to the stream or as surface waters flow through
the hyporheic zone and interact with shallow groundwater (Harvey and Fuller, 1998; Fuller and Harvey, 2000).
Pore-Water GeochemistryPore-water samples from Ely Brook were co-located with
surface-water sites. The sites include EB-1080M, EB-770M, EB-600M, and EB-90M; SB-3670M is also discussed in the background conditions section. Chemical constituents for pore-water samples are summarized in table 5, and complete analyses are reported in appendix 7.
Field Parameters and Major Inorganic Constituents
The pH and specific conductance were measured only on the in situ and equilibrated samples. The pH values for the in situ and equilibrated samples were comparable, and pH in the pore waters followed the same fluctuating trend as pH in the surface waters from the same sites (fig. 5). The pH decreased from EB-1080M to EB-770M, then increased at EB-600M, and then decreased drastically at EB-90M. The specific con-ductance, which was significantly higher in the equilibrated versus in situ splits, followed a reverse trend to the pH (fig. 5). A wide range in both pH and specific conductance occurred along Ely Brook; pH ranged from 2.9 to 7.5, and specific con-ductance ranged from 85 to 1,063 µS/cm.
Calcium and silica were the dominant dissolved cations, and K, Mg, and Na occur in lesser but subequal proportions; these relative proportions in the pore waters were similar to those in the surface waters. The concentrations of these ele-ments in the pore waters fluctuated downstream; in general for each pore-water type, the lowest concentrations were found in the background site (EB-1080M), and the highest concentrations were found in the farthest downstream site (EB-90M). Also, the concentrations of the dissolved major cations were usually highest in the equilibrated samples (Ca: 21.6–69.5 mg/L; Mg: 3.16–9.29 mg/L; Na: 2.4–4.23 mg/L; K: 4.04–7.32 mg/L; SiO2: 12.7–39.5 mg/L), and lowest in the in situ samples (Ca: 12.6–20.4 mg/L; Mg: 1.18–5.43 mg/L; Na: 1.13–2.34 mg/L; K: 1.68–4.87 mg/L; SiO2: 9–32.8 mg/L). In general, the concentrations of major cations in the in situ waters were comparable to their concentrations in the surface waters. The hardness values of the pore waters followed the trends displayed by the major cations with the highest hard-ness found in equilibrated pore waters and the lowest values for in situ pore waters; in situ values were comparable to surface-water values. Alkalinity was the dominant anionic spe-cies in the background pore waters (EB-1080M) as with sur-face water, whereas sulfate dominated in the mine-impacted samples (EB-770M, EB-600M, and EB-90M) (fig. 6). Like the dissolved major cations, these anions were found in higher concentrations in the equilibrated samples than in the in situ samples. Alkalinity was not measured on the centrifuged splits because of insufficient sample volumes. The alkalinity and sulfate values of the in situ pore waters were generally equiva-lent to the alkalinity of the surface water (fig. 6).

40 Aquatic Assessment of the Ely Copper Mine Superfund Site, Vershire, Vermont
TOTAL ALUMINUM
10
100
1,000
10,000
100,000DISSOLVED BARIUM
10
5
1214
50
*
10
512
14
12
DISSOLVED CADMIUM
10
613
16
50
.01
.1
1
10
DISSOLVED COBALT
.01
.1
1
10
100
1,000
10
5
12
15
DISSOLVED CHROMIUM
AWQC
1
10
.1
1
10
50
43
12
15
DISSOLVED COPPER
.1
1
10
100
1,000
10,000
10
5
1215
1312
8
Background Reach 3 Reach 2 Reach 1 (>800m) (540-800m) (350-540m) (0-350m)
CON
CEN
TRAT
ION
, IN
MIC
ROGR
AMS
PER
LITE
R
CON
CEN
TRAT
ION
, IN
MIC
ROGR
AMS
PER
LITE
R
ELY BROOK
Background Reach 3 Reach 2 Reach 1 (>800m) (540-800m) (350-540m) (0-350m)
ELY BROOK
DISSOLVED IRON
6
11
10
100
1,000
10,000
100,000 8DISSOLVED LEAD
.001
.01
.1
1
5
Figure 14. Select constituent concentrations in surface waters among four reaches in Ely Brook at the Ely Mine Superfund site, Vershire, VT. Data are from this study and Argue and others (2008).
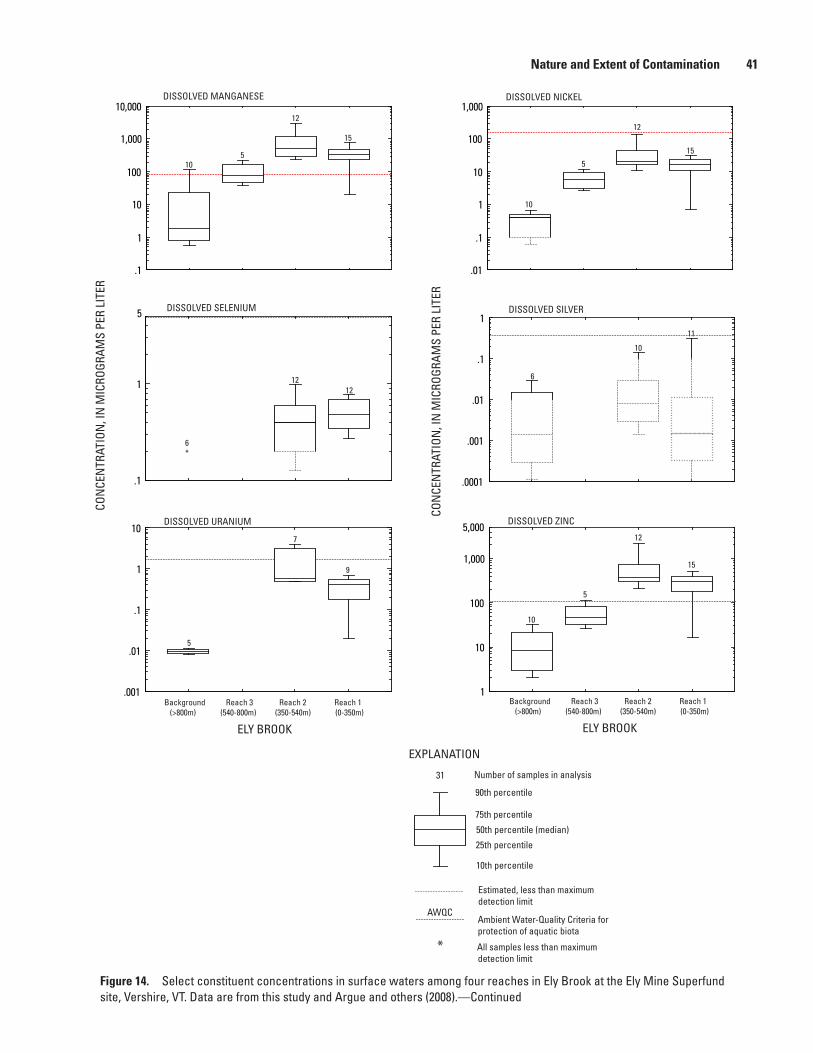
Nature and Extent of Contamination 41
DISSOLVED SILVER
.0001
.001
.01
.1
1
6
10
11
DISSOLVED URANIUM
.001
.01
.1
1
10
5
7
9
DISSOLVED MANGANESE
.1
1
10
100
1,000
10,000
105
12
15
6 *
* All samples less than maximum detection limit
DISSOLVED SELENIUM
.1
1
5
1212
AWQCAmbient Water-Quality Criteria forprotection of aquatic biota
Background Reach 3 Reach 2 Reach 1 (>800m) (540-800m) (350-540m) (0-350m)
ELY BROOK
Background Reach 3 Reach 2 Reach 1 (>800m) (540-800m) (350-540m) (0-350m)
ELY BROOK
90th percentile
25th percentile
75th percentile
50th percentile (median)
10th percentile
EXPLANATION
31 Number of samples in analysis
Estimated, less than maximumdetection limit
DISSOLVED NICKEL
.01
.1
1
10
100
1,000
10
5
12
15
DISSOLVED ZINC
CON
CEN
TRAT
ION
, IN
MIC
ROGR
AMS
PER
LITE
R
CON
CEN
TRAT
ION
, IN
MIC
ROGR
AMS
PER
LITE
R
1
10
100
1,000
5,000
10
5
12
15
Figure 14. Select constituent concentrations in surface waters among four reaches in Ely Brook at the Ely Mine Superfund site, Vershire, VT. Data are from this study and Argue and others (2008).—Continued
42 Aquatic Assessment of the Ely Copper Mine Superfund Site, Vershire, Vermont
Iron, Aluminum, and Manganese
The concentrations of dissolved Fe, Al, and Mn in pore waters fluctuated downstream according to the same varia-tions seen in the major dissolved cations and anions discussed above. For the in situ pore-water types, the lowest concentra-tions were found in the background sample (EB-1080M) and the highest were found in the farthest downstream site (EB-90M) (fig. 7). Iron was usually and Al was always the highest in the centrifuged splits with concentrations that ranged from 32 to 163,100 mg/L for Fe and 50.4 to 7,520 mg/L for Al. In contrast to Fe and Al, Mn was the highest in the equilibrated splits with concentrations that ranged from 418 to 5,460 mg/L.
Minor and Trace Inorganic Elements
The minor and trace elements present in pore waters from Ely Brook were Ba (12.9 to 74.7 µg/L), Cd (<0.02 to 2.87 µg/L), Co (<0.02 to 272 µg/L), Cu (2.4 to 2,140 µg/L), Ni (0.6 to 39 µg/L), Pb (<0.05 to 1.9 µg/L), Se (<1 to 2.9 µg/L), Sr (46.1 to 225 µg/L), and Zn (1.5 to 616 µg/L (fig. 7). The highest concentrations of Cd, Co, Cu, Ni, Pb, Se, and Zn were generally found in the pore waters from the farthest downstream site (EB-90M), and their lowest concen-trations were generally in the pore waters from the background site (EB-1080M). The equilibrated and centrifuge samples generally contained higher concentrations of these elements compared to the in situ samples. Beryllium (up to 0.3 µg/L), Cr (up 2.1 µg/L), and Sb (up to 0.77 µg/L) were only detected in the EB-90M pore waters. Uranium was detected in EB-1080M (up to 0.49 µg/L) and EB-90M (up to 1.01 µg/L). Similar to surface waters, dissolved Ag, As, Hg, Tl, and V concentrations in all pore waters were near or below their detection limits.
Dissolved Organic Carbon and Nutrients
DOC and nutrient concentrations were determined only on the in situ pore-water samples. DOC concentrations throughout Ely Brook ranged from 1.0 to 1.6 mg/L. Nutrients were generally low throughout the brook with total dissolved nitrogen ranging from 0.04 to 0.17 mg/L and total dissolved phosphorus ranging from 0.003 to 0.004 mg/L.
Comparisons with Ambient Water-Quality Criteria
In the previous section, which discussed surface water in Ely Brook, sample sites were partitioned on the basis of stream reach and compared to ambient water-quality crite-ria. Hardness-dependent criteria were calculated on the basis of the hardness of the sample. This section will refer to the same stream reaches although pore waters are from this study, whereas surface waters included all historical samples. Pore waters were not sampled prior to this investigation. As in the
previous section, stream reach 1 refers to water-quality condi-tions near the mouth of Ely Brook and downstream of Ely Brook tributary 1 (EB-90M); stream reach 3 refers to samples downstream of the confluence with Ely Brook tributary 4 and include sites EB-770M and EB-600M, and stream reach 4 refers to background samples (EB-1080M). Pore waters were not collected in stream reach 2, which was downstream of Ely Brook tributary 2 and upstream of Ely Brook tributary 1.
In stream reach 1, the concentrations of the following ele-ments exceeded their AWQCs in all samples: Al, Ba, Cd, Co, Cu, Fe, Mn, and Zn. Farther upstream in stream reach 3, the concentrations of Ba, Cd, and Cu in all pore waters exceeded their AWQC. Other exceedances in this stream reach include: Al in the centrifuged sample from EB-600M and Co and Mn from the equilibrated and centrifuged samples of EB-770M and the equilibrated sample of EB-600M. The concentra-tions for most elements in pore waters in stream reach 4, the background site (SB-3670M), were less than AWQC with the exceptions being Al and Cd in the centrifuged sample, Ba in all pore waters, and Mn in equilibrated pore water.
Sediment Geochemistry
Sediment samples from Ely Brook include the four sites previously discussed (EB-1080M, EB-770M, EB-600M, and EB-90M) and an additional sample collected from site EB-90M from the uppermost layer of the overbank sediment. Chemical constituents for sediment samples are summarized in table 6, and complete analyses are reported in appendix 8. SEM-AVS data for sediment samples are summarized in table 7, and complete analyses are reported in appendix 4. This additional sample, EB-90M-OBS, was a grab sample of one discrete area instead of a composite of a larger section of the stream reach. The major element geochemistry of the background samples from Ely Brook (EB-1080M) reflected its siliciclastic constituents with 4.26 weight percent Al, 2.76 weight percent Fe, and between 0.98 and 1.05 weight per-cent Ca, K, Mn, and Na. In contrast, the mine-impacted sedi-ment samples contained Fe > Al > Ca, K, Mg, and Na. In gen-eral, the concentration of Fe increased downstream, whereas the concentrations of Al, Ca, K, Mg, and Na decreased. The variation in Fe concentrations was the greatest and ranged from 5.5 weight percent at EB-770M to 16.7 weight percent at EB-90M and 36.3 weight percent at EB-90M-OBS. Also, sulfur increased from 0.04 weight percent at the background to 1.86 weight percent at EB-90M and 4.66 weight percent at EB-90M-OBS. Carbonate carbon was low, between 0.01 and 0.04 weight percent carbon. In contrast, total organic carbon was significantly higher than carbonate carbon and ranged from 0.23 to 0.53 weight percent for EB-1080M to EB-90M; the concentrations of organic carbon in EB-OBS was consider-ably higher at 2.42 weight percent.

Nature and Extent of Contamination 43
Maximum concentrations of trace elements in the Ely Brook stream sediments were 17 mg/kg for Ag (EB-90M-OBS), 4 mg/kg for As (EB-90M), 360 mg/kg for Ba (EB-90M-OBS), 1 mg/kg for Cd (EB-600M and EB-90M), 65.5 mg/kg for Co (EB-600M), 89 mg/kg for Cr (EB-90M-OBS), 5,950 mg/kg for Cu (EB-90M), 2,200 mg/kg for Mn (EB-90M), 44.5 mg/kg for Mo (EB-90M-OBS), 23.4 mg/kg for Ni (EB-600M), 174 mg/kg for Pb (EB-600M), 2.03 mg/kg for Sb (EB-90M), 71.1 mg/kg for Se (EB-90M-OBS), 133 mg/kg for Sr (EB-1080M), and 206 mg/kg for Zn (EB-90M). The maximum concentrations of many of these ele-ments were found in sediments from the farthest downstream reach of the stream (EB-90M and EB-90M-OBS). Mercury was below its detection limit of 0.02 mg/kg in all sediments except EB-90M-OBS with 0.13 mg/kg.
Acid volatile sulfide for the stream-sediment samples from Ely Brook was below the detection limit of 23 mg/kg (0.7 µmoles/g). The sum of the concentrations of simul-taneously extracted metals (Cd + Cu + Pb + Ni + Zn) was low in the background sample (EB-1080M) at 0.5 µmol/g and increased to 5.7 µmol/g (EB-770M) and 14.5 µmol/g (EB-600M). The concentration of SEM then decreased to 1.2 µmol/g at EB-90M. The samples from Ely Brook were the only ones in this study to contain detectable simultaneously extracted cadmium concentrations. Simultaneously extracted mercury was below its detection limit of 0.001 µmol/g.
The concentrations of As, Cd, Cr, Cu, Hg, Ni, Pb, and Zn in the sediments from Ely Brook are below the PEC limits, with the exception of Cu and Pb. The concentrations of copper in all sediments that were impacted by the mine (EB-770M, EB-600M, and EB-90M) exceeded the PEC of 149 mg/kg with values that ranged from 1,160 to 5,950 mg/kg. Also, the concentrations of lead in EB-600M sediment exceeded its PEC of 128 mg/kg with a concentration of 174. The (ΣSEM-AVS)/fOC values for the background stream sediment from Ely Brook was –61.5 µmol/gOC, which was well within the no-effects range. In contrast, the (ΣSEM-AVS)/fOC for sediments EB-770M and EB-90M were 963.8 and 213.1 µmol/gOC, respectively, which fall within the uncertain effects range (USEPA, 2005). Also, the (ΣSEM-AVS)/fOC for sediment EB-600M was 6,050 µmol/gOC, which falls within the predicted effects range, which has a lower limit of 3,000 µmol/gOC (USEPA, 2005).
Bioassay Results
For the Ely Brook sediment samples, tests were con-ducted using Hyalella azteca for 28-day exposures and Chironomus dilutus for 12-day exposures (table 8). For both organisms, survival and growth endpoints were measured. For EB-1080M, the reference site, H. azteca had an acceptable survival at 93.8 ± 1.8 percent, and growth of 3.24 ± 0.05 mm. At EB-770M, survival dropped to 68.8 ± 5.8 percent, and
growth was 2.45 ± 0.06 mm. At EB-600M, survival dropped to 6.3 ± 2.6 percent, and growth was 1.96 ± 0.11 mm. At EB-90M, the site with the most impaired surface- and pore-water quality, survival was a surprising 91.3 ± 4.0 percent, and growth was 3.39 ± 0.06 mm.
The midge (C. dilutus) results were somewhat differ-ent. Site EB-1080M, the reference, had survival at 63.8 ± 6.5 percent, and growth was 1.21 ± 0.11 mm. At EB-770M, survival was statistically identical at 61.3 ± 4.8 percent, and growth dropped to 0.61 ± 0.11 mm. At EB-600M, survival was statistically identical at 65.0 ± 6.0 percent, and growth was 0.28 ± 0.01 mm. At EB-90M, the site with the most impaired surface- and pore-water quality, survival increased to 72.5 ± 4.5 percent, and growth was 1.73 ± 0.37 mm.
Relations among Trace Elements in Surface Water, Pore Water, Sediment, and Aquatic Biota
Surface water, pore water, and sediments were sampled in August 2006, and invertebrates were sampled in Septem-ber 2006 at river meters 90, 600, 770, and 1,080 to relate water and sediment quality to aquatic biota. Background condi-tions were characterized by samples obtained at river meter 1,080. HIs at the background location were less than 1 for the surface-water sample and greater than 1 for the pore-water and sediment samples (table 10). However, no HQ greater than 1 was observed in pore water or sediments (table 10). HIs below the confluence with Ely Brook tributary 4 were greater than 1 for all samples and ranged from 50 to 237 in surface waters, 9.2 to 279 in pore waters, and 8.7 to 41 in sediments (table 10).
An evaluation of the RTH and DTH invertebrate data sampled at the Ely Brook sites indicated severe impairment below the reference location EB-1080M. Between EB-1080M and EB-770M, RTH abundance decreased from 1,756 to 8 individuals, and RTH richness decreased from 43 to 7 taxa (fig. 9); DTH abundance decreased from 415 to 8 individu-als, and DTH richness decreased from 34 to 7 taxa (figs. 9 and 10; table 9). A decrease in the values of these two metrics also was closely associated with the increase in HIs for metals concentrations in surface water (RTH abundance and richness decrease, fig. 15; table 9) and pore water (DTH abundance and richness decrease, fig. 16; table 9). This response with HI values was definite (rho = –1.000) for richness in both the RTH and DTH assemblages, even though an increase in HIs did not follow an up- to downgradient order in the surface-water samples. These results indicated that the RTH and DTH invertebrate assemblages in Ely Brook were strongly affected by acid-mine drainage and that the level of contamination in the respective habitat (surface or pore water) is a relevant environmental factor in the response.

44 Aquatic Assessment of the Ely Copper Mine Superfund Site, Vershire, Vermont
1 10 100 1,0000
10
20
30
40
50
Inve
rteb r
ate
Ric
hnes
s
A B
0 1 2 3 61
10
100
1,000
10,000
Inve
rtebr
a te
Abu
nda n
ce
SB-3670M
SB-1360M
SB-3100M
SB-140MSB-2400M
0 1 2 3 40
10
20
30
40
50
60
Inve
r tebr
ate
Ric
hnes
s
C D
F
1 10 100 1,0001
10
100
1,000
10,000
EB-600M
EB-90M
EB-770M
EB-1080M
Hazard Index
Inve
rtebr
ate
Abun
danc
e
0.00
90
1
10
100
1,000
10,000
80
70
60
50
40
30
20
10
0.5 1.0 2.0
Inve
r tebr
ate
Ric
hnes
s
EB-1080M
EB-770M
EB-600M
EB-90M
SB-3670M
SB-140M
SB-1360MSB-2400M SB-3100M
OR-24050M
OR-23630M
OR-23200M
Hazard Index
Hazard Index Hazard Index
Hazard Index
Explanation
Sample location and identifier OR-23200M
5 64 5
1.5
Hazard Index0.0 0.5 1.0 2.01.5
Inve
rtebr
ate
Abun
danc
e
OR-23630M
OR-23200MOR-24050M
E
Figure 15. Riffle-targeted habitat (RTH) invertebrate (A) abundance and (B) richness values in Ely Brook, (C) abundance and (D) richness values in Schoolhouse Brook, and (E) abundance and (F) richness values in the Ompompanoosuc River relative to the gradient in hazard index values derived from trace metal concentration in surface waters, Vershire, VT. The first location in each of the frames (lowest hazard index value) was coincidentally farthest upgradient from sources of contamination and was used to represent background conditions for the stream.

Nature and Extent of Contamination 45
0.2 0.4 0.6 0.8 1.0
1 10 100 1,000Hazard Index
1
10
100
1,000
10,000
Inve
rtebr
ate
Ab u
ndan
ce
EB-1080M
EB-770MEB-90M
EB-600M
1 10 100 1,0000
10
20
30
40
Inve
r tebr
ate
Ric h
ness
EB-1080M
A B
0 1 21
10
100
1,000
10,000
Inve
rteb r
ate
Ab
unda
nce
SB-3670M
SB-2400M SB-1360MSB-140M
0 1 20
5
10
15
20
25
30
35
Inve
rtebr
ate
Ric
hnes
s
C D
1
10
100
1,000
10,000
Inve
rtebr
ate
Abu
ndan
c e
OR-24050M
OR-23200M
0.00
5
10
15
20
25
Inve
rteb
rate
Ric
hnes
s OR-24050M
E F
EB-770M
EB-600M
EB-90M
Hazard Index
Hazard IndexHazard Index
Hazard IndexHazard Index
OR-23200M
SB-140M
SB-3670M
SB-2400M
SB-1360M
Explanation
Sample location and identifier OR-23200M
0.0 0.2 0.4 0.6 0.8 1.0
Figure 16. Depositional-targeted habitat (DTH) invertebrate (A) abundance and (B) richness values in Ely Brook, (C) abundance and (D) richness values in Schoolhouse Brook, and (E) abundance and (F) richness values in the Ompompanoosuc River relative to the gradient in hazard index values derived from trace metal concentration in pore waters, Vershire, VT. The first location in each of the frames (lowest hazard index value) was coincidentally farthest upgradient from sources of contamination and was used to represent background conditions for the stream.

46 Aquatic Assessment of the Ely Copper Mine Superfund Site, Vershire, Vermont
Schoolhouse Brook
Surface-Water Geochemistry
Five sites were sampled in Schoolhouse Brook in August 2006, one of which was upstream of the confluence with Ely Brook and was also discussed in the background conditions section (SB-3670M). Chemical constituents for surface-water samples are summarized in table 4, and com-plete analyses are reported in appendix 6. The four other Schoolhouse Brook sites include site SB-3125M, located approximately 125 m downstream from the confluence with Ely Brook, site SB-2400M, located approximately 850 m downstream from the confluence, site SB-1360M, located approximately 1,890 m downstream from the confluence, and site SB-140M, located approximately 3,110 m downstream from the confluence with Ely Brook and 140 m upstream of the confluence with the Ompompanoosuc River. Data from these sites will be used to examine downstream variations in chemistry.
Field Parameters and Major Inorganic Constituents
The pH of Schoolhouse Brook decreased slightly from 8.2 (SB-3670M) to 7.8 (SB-3125M) downstream of the confluence with Ely Brook due to mixing with acidic waters from Ely Brook (pH 3.2 at EB-90M) (fig. 5). In contrast to the pH, the specific conductance and concentrations of most major dissolved cations did not vary significantly directly downstream from Ely Brook (fig. 5). However, most major dissolved cations increased slightly from SB-3125M to SB-2400M and then decreased farther downstream (SB-1360M and SB-140M). This is reflected in the hardness (in mg/L CaCO3) increasing from 95.9 at SB-3125M to 97.8 at SB-2400M, and then decreasing to 92.5 and 84.2 at SB-1360M and SB-140M, respectively (fig. 6). The decrease down-stream may be due to dilution after mixing with a tributary downstream of SB-2400M. Alkalinity, the dominant anionic species, followed similar trends to hardness and ranged from 80 to 99 mg/L CaCO3 (fig. 6). Chloride and sulfate concentra-tions reached 5 and 16 mg/L, respectively; they did not vary significantly downstream in Schoolhouse Brook. Calcium was the dominant dissolved cation and ranged from 30.7 to 35.8 mg/L. Other major cations include K (2.2 to 2.42 mg/L), Mg (1.82 to 2.03 mg/L), Na (3.77 to 4.62 mg/L), and SiO2 (7.3 to 9.1 mg/L). Previous reports found similar results (Seal and others, 2001; Holmes and others, 2002; Argue and others, 2008).
Iron, Aluminum, and Manganese
The concentrations of dissolved Al (93.5 to 128 µg/L) were considerably higher than the concentrations of dis-solved Fe (<20 to 49 µg/L) and Mn (13.6 to 43.8 µg/L) in Schoolhouse Brook surface waters (excluding background
site SB-3670M) (fig. 7). All three elements increased directly downstream from the confluence with Ely Brook due to mix-ing with the more concentrated waters of Ely Brook. Iron and manganese generally decreased downstream from SB-3125M to SB-140M.
Minor and Trace Inorganic Elements
The only minor and trace elements present in signifi-cant concentrations in August 2006 in Schoolhouse Brook downstream of the confluence with Ely Brook were Ba (14.8 to 19.8 µg/L), Co (1.1 to 4.31 µg/L), Cu (20.4 to 42.8 µg/L), Ni (1 to 1.4 µg/L ), Sr (134 to 158 µg/L), and Zn (6.6 to 19.8 µg/L). In comparison, historical variations for School-house Brook show a greater range (Argue and others, 2008). For example, dissolved copper concentrations, the most signif-icant contaminant, ranged from approximately 6 to 100 µg/L. Trace amounts of dissolved Cd (up to 0.12 µg/L), Pb (up to 0.1 µg/L), Sb (0.78 µg/L), and U (up to 0.31 µg/L) were detected in some or all samples. The concentrations of most of these elements were below their detection limits upstream of Ely Brook at SB-3670M and increase at SB-3125M due to mixing with the more concentrated water of Ely Brook (fig. 7). Dissolved Ag, As, Be, Cr, Hg, Se, Tl, and V concentrations were all below their detection limits.
Dissolved Organic Carbon and Nutrients
DOC concentrations throughout Schoolhouse Brook ranged from 1.2 to 2 mg/L. Nutrients were generally low throughout the study area. Total dissolved nitrogen ranged from 0.09 to 0.12 mg/L, and total dissolved phosphorus ranged from 0.003 to 0.006 mg/L.
Trace-Element Loads
Coupled streamflow measurements and surface-water samples obtained at SB-140M, SB-1360M, SB-2400M, SB-3100M, and SB-3670M on August 21 and 22, 2006, were used to describe the transport and attenuation of constituents in Schoolhouse Brook. Background conditions were character-ized by samples obtained at SB-3670M. Instantaneous loads for most elements increased above background conditions at river meter 3,100, below the confluence with Ely Brook, and decreased with distance from SB-3125M to SB-1360M (fig. 13). An increase in instantaneous loads for most ele-ments was observed from SB-1360M to SB-140M, most likely the result of samples being collected at different streamflow regimes. Streamflow at SB-140M was measured on August 21 at a probability of exceedance of approximately 40 percent, whereas streamflow at the other locations was measured on August 22 at a probability of exceedance of approximately 50 percent. Normalizing streamflow by drainage area at each location shows a marked increase in runoff per unit increase in drainage area at SB-140M relative to other locations.
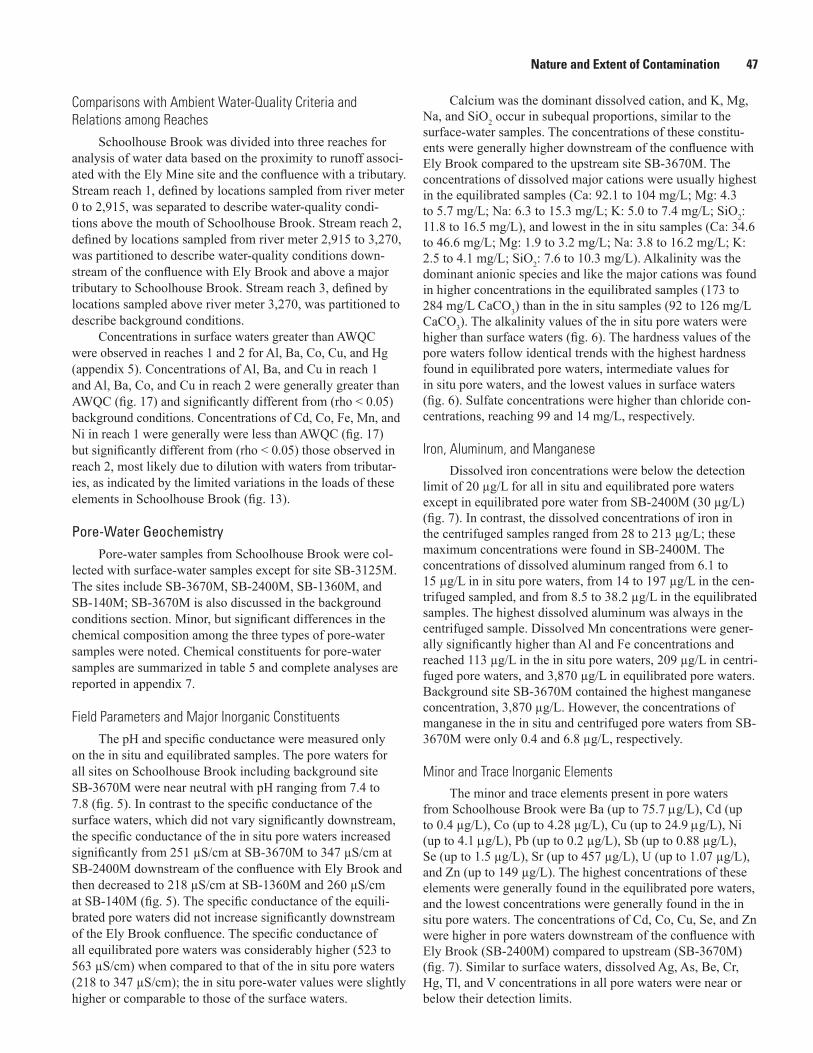
Nature and Extent of Contamination 47
Comparisons with Ambient Water-Quality Criteria and Relations among Reaches
Schoolhouse Brook was divided into three reaches for analysis of water data based on the proximity to runoff associ-ated with the Ely Mine site and the confluence with a tributary. Stream reach 1, defined by locations sampled from river meter 0 to 2,915, was separated to describe water-quality condi-tions above the mouth of Schoolhouse Brook. Stream reach 2, defined by locations sampled from river meter 2,915 to 3,270, was partitioned to describe water-quality conditions down-stream of the confluence with Ely Brook and above a major tributary to Schoolhouse Brook. Stream reach 3, defined by locations sampled above river meter 3,270, was partitioned to describe background conditions.
Concentrations in surface waters greater than AWQC were observed in reaches 1 and 2 for Al, Ba, Co, Cu, and Hg (appendix 5). Concentrations of Al, Ba, and Cu in reach 1 and Al, Ba, Co, and Cu in reach 2 were generally greater than AWQC (fig. 17) and significantly different from (rho < 0.05) background conditions. Concentrations of Cd, Co, Fe, Mn, and Ni in reach 1 were generally were less than AWQC (fig. 17) but significantly different from (rho < 0.05) those observed in reach 2, most likely due to dilution with waters from tributar-ies, as indicated by the limited variations in the loads of these elements in Schoolhouse Brook (fig. 13).
Pore-Water GeochemistryPore-water samples from Schoolhouse Brook were col-
lected with surface-water samples except for site SB-3125M. The sites include SB-3670M, SB-2400M, SB-1360M, and SB-140M; SB-3670M is also discussed in the background conditions section. Minor, but significant differences in the chemical composition among the three types of pore-water samples were noted. Chemical constituents for pore-water samples are summarized in table 5 and complete analyses are reported in appendix 7.
Field Parameters and Major Inorganic ConstituentsThe pH and specific conductance were measured only
on the in situ and equilibrated samples. The pore waters for all sites on Schoolhouse Brook including background site SB-3670M were near neutral with pH ranging from 7.4 to 7.8 (fig. 5). In contrast to the specific conductance of the surface waters, which did not vary significantly downstream, the specific conductance of the in situ pore waters increased significantly from 251 µS/cm at SB-3670M to 347 µS/cm at SB-2400M downstream of the confluence with Ely Brook and then decreased to 218 µS/cm at SB-1360M and 260 µS/cm at SB-140M (fig. 5). The specific conductance of the equili-brated pore waters did not increase significantly downstream of the Ely Brook confluence. The specific conductance of all equilibrated pore waters was considerably higher (523 to 563 µS/cm) when compared to that of the in situ pore waters (218 to 347 µS/cm); the in situ pore-water values were slightly higher or comparable to those of the surface waters.
Calcium was the dominant dissolved cation, and K, Mg, Na, and SiO2 occur in subequal proportions, similar to the surface-water samples. The concentrations of these constitu-ents were generally higher downstream of the confluence with Ely Brook compared to the upstream site SB-3670M. The concentrations of dissolved major cations were usually highest in the equilibrated samples (Ca: 92.1 to 104 mg/L; Mg: 4.3 to 5.7 mg/L; Na: 6.3 to 15.3 mg/L; K: 5.0 to 7.4 mg/L; SiO2: 11.8 to 16.5 mg/L), and lowest in the in situ samples (Ca: 34.6 to 46.6 mg/L; Mg: 1.9 to 3.2 mg/L; Na: 3.8 to 16.2 mg/L; K: 2.5 to 4.1 mg/L; SiO2: 7.6 to 10.3 mg/L). Alkalinity was the dominant anionic species and like the major cations was found in higher concentrations in the equilibrated samples (173 to 284 mg/L CaCO3) than in the in situ samples (92 to 126 mg/L CaCO3). The alkalinity values of the in situ pore waters were higher than surface waters (fig. 6). The hardness values of the pore waters follow identical trends with the highest hardness found in equilibrated pore waters, intermediate values for in situ pore waters, and the lowest values in surface waters (fig. 6). Sulfate concentrations were higher than chloride con-centrations, reaching 99 and 14 mg/L, respectively.
Iron, Aluminum, and ManganeseDissolved iron concentrations were below the detection
limit of 20 µg/L for all in situ and equilibrated pore waters except in equilibrated pore water from SB-2400M (30 µg/L) (fig. 7). In contrast, the dissolved concentrations of iron in the centrifuged samples ranged from 28 to 213 µg/L; these maximum concentrations were found in SB-2400M. The concentrations of dissolved aluminum ranged from 6.1 to 15 µg/L in in situ pore waters, from 14 to 197 µg/L in the cen-trifuged sampled, and from 8.5 to 38.2 µg/L in the equilibrated samples. The highest dissolved aluminum was always in the centrifuged sample. Dissolved Mn concentrations were gener-ally significantly higher than Al and Fe concentrations and reached 113 µg/L in the in situ pore waters, 209 µg/L in centri-fuged pore waters, and 3,870 µg/L in equilibrated pore waters. Background site SB-3670M contained the highest manganese concentration, 3,870 µg/L. However, the concentrations of manganese in the in situ and centrifuged pore waters from SB-3670M were only 0.4 and 6.8 µg/L, respectively.
Minor and Trace Inorganic ElementsThe minor and trace elements present in pore waters
from Schoolhouse Brook were Ba (up to 75.7 µg/L), Cd (up to 0.4 µg/L), Co (up to 4.28 µg/L), Cu (up to 24.9 µg/L), Ni (up to 4.1 µg/L), Pb (up to 0.2 µg/L), Sb (up to 0.88 µg/L), Se (up to 1.5 µg/L), Sr (up to 457 µg/L), U (up to 1.07 µg/L), and Zn (up to 149 µg/L). The highest concentrations of these elements were generally found in the equilibrated pore waters, and the lowest concentrations were generally found in the in situ pore waters. The concentrations of Cd, Co, Cu, Se, and Zn were higher in pore waters downstream of the confluence with Ely Brook (SB-2400M) compared to upstream (SB-3670M) (fig. 7). Similar to surface waters, dissolved Ag, As, Be, Cr, Hg, Tl, and V concentrations in all pore waters were near or below their detection limits.

48 Aquatic Assessment of the Ely Copper Mine Superfund Site, Vershire, Vermont
TOTAL ALUMINUM
10
100
1,000
5,000
1317
16
AWQC
21*
9*
DISSOLVED BARIUM
1
10
100
500
1216 15
DISSOLVED CADMIUM
.01
.1
1
17
17
DISSOLVED COBALT
.0001
.001
.01
.1
1
10
50
14
2019
A
DISSOLVED CHROMIUM
.1
1
511 8
*
DISSOLVED COPPER
.1
1
10
100
500
14
20 19
Background Reach 2 Reach 1 (>3,270m) (2,915-3,270m) (0-2,915m)
CON
CEN
TRAT
ION
, IN
MIC
ROGR
AMS
PER
LITE
R
CON
CEN
TRAT
ION
, IN
MIC
ROGR
AMS
PER
LITE
R
SCHOOLHOUSE BROOK
Background Reach 2 Reach 1 (>3,270m) (2,915-3,270m) (0-2,915m)
SCHOOLHOUSE BROOK
DISSOLVED IRON
10
100
500
13
12
DISSOLVED LEAD
.001
.01
.1
1
5
14
11
15
Figure 17. Select constituent concentrations in surface waters among three reaches in Schoolhouse Brook at the Ely Mine Superfund site, Vershire, VT. Data are from this study and Argue and others (2008).

Nature and Extent of Contamination 49
DISSOLVED URANIUM
.01
.1
19
9 11
DISSOLVED MANGANESE
1
10
100
14
2019
12*
* All samples less than maximum detection limit
DISSOLVED SELENIUM
.01
.1
1
119
90th percentile
25th percentile
75th percentile
50th percentile (median)
10th percentile
EXPLANATION
31 Number of samples
Background Reach 2 Reach 1 (>3,270m) (2,915-3,270m) (0-2,915m)
SCHOOLHOUSE BROOK
Background Reach 2 Reach 1 (>3,270m) (2,915-3,270m) (0-2,915m)
SCHOOLHOUSE BROOK
Estimated, less than maximumdetection limit
AWQC Ambient Water-Quality Criteria forprotection of aquatic biota
DISSOLVED NICKEL
.01
.1
1
10
13
2019
DISSOLVED ZINC
CON
CEN
TRAT
ION
, IN
MIC
ROGR
AMS
PER
LITE
R
CON
CEN
TRAT
ION
, IN
MIC
ROGR
AMS
PER
LITE
R
1
10
100
14 20 19
Figure 17. Select constituent concentrations in surface waters among three reaches in Schoolhouse Brook at the Ely Mine Superfund site, Vershire, VT. Data are from this study and Argue and others (2008).—Continued

50 Aquatic Assessment of the Ely Copper Mine Superfund Site, Vershire, Vermont
Dissolved Organic Carbon and Nutrients
DOC and nutrient concentrations were determined only on samples of the in situ pore water. DOC concentrations throughout Schoolhouse Brook ranged from 0.9 to 1.6 mg/L. Nutrients were generally low throughout the brook with total dissolved nitrogen ranging from 0.07 to 0.24 mg/L and total dissolved phosphorus ranging from 0.004 to 0.006 mg/L.
Comparisons with Ambient Water-Quality Criteria
In the previous section on surface water in School-house Brook, sample sites were partitioned on the basis of stream reach and compared to ambient water-quality criteria. Hardness-dependent criteria were calculated based on the hardness of the sample. This section will refer to the same stream reaches, although pore waters are from this study, whereas surface waters included all historical samples. Pore waters were not sampled prior to this investigation. As in the previous section, stream reach 1 refers to water-quality condi-tions above the mouth of Schoolhouse Brook and downstream of a major tributary (SB-2400M, SB-1360M, and SB-140M); stream reach 3 refers to background conditions (SB-3670M). Pore waters were not collected in stream reach 2, which is downstream of the confluence with Ely Brook and upstream of a major tributary to Schoolhouse Brook.
The concentrations for most elements in pore waters in stream reach 3, the background site (SB-3670M), were less than AWQC with the exceptions being Al in the centrifuged split, Ba in all pore waters, and Mn in equilibrated pore water. The concentrations of Ba in all pore waters and Mn in most pore waters in stream reach 1 exceeded their AWQC of 3.8 and 80.3 µg/L, respectively. In stream reach 1, the concentrations of copper exceeded its hardness- dependent criterion in all of the equilibrated samples, most of the centrifuged samples (two of three samples), and one in situ sample. Cobalt, Al, and Zn exceeded their criteria in one to two samples for each element.
Sediment Geochemistry
The major-element geochemistry of the four sediment samples from Schoolhouse Brook (SB-3670M, SB-2400M, SB-1360M, and SB-140M) reflects their siliciclastic constitu-ents. Chemical constituents for sediment samples are summa-rized in table 6, and complete analyses are reported in appen-dix 8. SEM-AVS data for sediment samples are summarized in table 7, and complete analyses are reported in appendix 4. Aluminum ranged from 3.1 to 3.7 weight percent, Fe from 1.39 to 2.78 weight percent, and Ca from 1.3 to 1.62 weight percent. Magnesium, K, and Na occurred in subequal propor-tions with concentrations that ranged from 0.6 to 0.9 weight percent. In general, the order of abundance of elements in the sediments was the following: Al > Fe > Ca > K > Na > Mg. Of these elements, only Al, Fe, and Na increased significantly downstream from the confluence with Ely Brook (SB-2400M) compared to the background sample site (SB-3670M). Also, sulfur increased from 0.03 to 0.08 weight percent downstream
of the confluence with Ely Brook. Carbonate carbon was low, between 0.1 and 0.2 weight percent carbon; total organic carbon was slightly higher and ranged from 0.2 to 0.3 weight percent.
Maximum concentrations of trace elements in the Schoolhouse Brook stream sediments are 3 mg/kg for As (SB-3670M), 207 mg/kg for Ba (SB-3670M), 13.5 mg/kg for Co (SB-140M), 32 mg/kg for Cr (SB-140M), 243 mg/kg for Cu (SB-140M), 869 mg/kg for Mn (SB-140M), 2.59 mg/kg for Mo (SB-140M), 13.6 mg/kg for Ni (SB-140M), 31.4 mg/kg for Pb (SB-140M), 2.14 mg/kg for Sb (SB-140M), 1.8 mg/kg for Se (SB-2400M), 206 mg/kg for Sr (SB-1360M), and 85 mg/kg for Zn (SB-140M). The concentrations of Co, Cu, Mo, Sb, Se, and Zn increased significantly downstream from the confluence with Ely Brook (SB-2400M) in comparison to the background Schoolhouse Brook site (SB-3670M). Ag, Cd, and Hg were near or below their detection limits.
Acid volatile sulfide for the stream-sediment samples from Schoolhouse Brook were below the detection limit of 23 mg/kg (0.7 µmol/g). The sum of the concentrations of simultaneously extracted metals (Cd + Cu + Pb + Ni + Zn) was low in the background sample (SB-3670M) at 0.2 µmol/g and increased downstream of the confluence with Ely Brook to 1.3 µmol/g (SB-2400M), and then increased slightly to 1.4 and 1.6 µmol/g at SB-1360M and SB-140M, respec-tively. Simultaneously extracted Cd and Hg were below their detection limits.
The concentrations of As, Cd, Cr, Cu, Hg, Ni, Pb, and Zn in the sediments from Schoolhouse Brook are below their PEC limits with the exception of Cu (table 10). The concen-trations of copper in all sediments below the confluence with Ely Brook exceeded the PEC of 149 mg/kg with values that ranged from 167 to 243 mg/kg and increased with increas-ing distance downstream. The ΣSEM-AVS)/fOC value for the background stream sediments from Schoolhouse Brook was –160 µmol/gOC, which was well within the no-effects range. In contrast, the (ΣSEM-AVS)/fOC for the sediments downstream of Ely Brook ranged from 281 to 395 µmol/gOC, which falls within the uncertain effects range (USEPA, 2005).
Bioassay Results
For the Schoolhouse Brook samples, tests were con-ducted using Hyalella azteca for 28-day exposures and Chironomus dilutus for 12-day exposures and showed impair-ment downstream of the confluence with Ely Brook (table 8). For SB-3670M, the reference site, H. azteca had acceptable survival at 93.8 ± 4.6 percent, and growth of 3.31 ± 0.06 mm. At SB-2400M, survival dropped to 52.5 ± 7.5 percent, and growth was 2.43 ± 0.11 mm. At SB-1360M, survival rose slightly to 64.3 ± 6.1 percent, and growth was 2.53 ± 0.11 mm. The results from SB-140M, which was a field duplicate, are discussed below.
The midge (C. dilutus) results were somewhat differ-ent. Site SB-3670M, the reference, had unacceptable sur-vival at 76.3 ± 5.3 percent, and growth was 1.00 ± 0.05 mm.

Nature and Extent of Contamination 51
At SB-2400M, survival was statistically identical at 80.0 ± 4.2 percent, and growth dropped to 0.78 ± 0.04 mm. At SB-1360M, survival dropped to 62.5 ± 5.9 percent, and growth rose to 1.28 ± 0.08 mm. The results from SB-140M, which was a field duplicate, are discussed below.
Moderate differences in results of toxicity tests between field duplicate sediment samples from the downstream site on Schoolhouse Brook [SB-140M and SB-140M(D)] were found. Three of the four endpoints (amphipod survival, midge survival, and midge growth) showed differences between tests ranging from 21 to 31 percent [relative percent difference (RPD), difference expressed as percent of mean]. The fourth endpoint, amphipod growth, was nearly identical between duplicate samples (RPD = 3 percent). The observed differ-ences were apparently not related to differences in physical or chemical constituents, which were generally within ± 10 per-cent for these two samples (appendixes 3 and 4). The differ-ences in midge survival between the SB-140M duplicates were less than the range observed for this endpoint across the three reference sites, apparently reflecting the overall high vari-ability of this endpoint in this test. In contrast, differences in amphipod survival and midge growth between SB-140M and SB-140M(D) were substantially greater than the range of these endpoints among the reference sites but were comparable to the range of responses in the non-reference sites in School-house Brook. Because all three toxicity indices indicated similar, moderate risks of toxicity across sites SB-2400M, SB-1360M, SB-140Ma, and SB-140Mb (figs. 15 and 16), the high variation of metal toxicity responses in these sediments may reflect a natural increase in variation of these responses near the threshold for toxic effects.
Relations among Trace Elements in Surface Water, Pore Water, Sediment, and Aquatic Biota
Surface water, pore water, and sediment were sampled in August 2006, and invertebrates and fish were sampled in Sep-tember 2006, to relate water and sediment quality to aquatic biota. Surface water, invertebrates, and fish were sampled at SB-140M, SB-1360M, SB-2400M, SB-3100M, and SB-3670M. Pore water and sediment were sampled at SB-140M, SB-1360M, SB-2400M, and SB-3670M. Background condi-tions were characterized by samples obtained at SB-3670M.
HIs less than 1 were observed in water and sediments sampled at the background location (table 10). HI values for surface-water and sediment samples below the confluence with Ely Brook were greater than 1 mainly due to elevated copper concentrations (table 10). Pore-water samples below the confluence with Ely Brook, however, generally were less than 1 except for river meter 1,360, which had an HI of 1.5 due to elevated copper and zinc concentrations.
The RTH invertebrate assemblages sampled at the Schoolhouse Brook sites indicated severe impairment below the reference location SB-3670M and also that some degree of system recovery was occurring along a downstream gradient from the confluence of Ely Brook (that is, influx
of contamination). The RTH assemblage data indicated that SB-3100M (below the Ely Brook confluence) was the location most severely impaired but that ecological condi-tion of the stream had gradually improved by SB-140M (fig. 9C,D; table 9). However, the condition at SB-140M was still impaired compared to the reference location SB-3670M, where invertebrate abundance was 14 times greater and richness was more than twice as great. Comparing the RTH assemblage data to the HIs indicated that invertebrate abundance and richness were closely associated with the metal concentrations in surface water (fig. 15C,D; table 9). The HIs for sites SB-3670M and SB-3100M were the lowest and highest respectively, with little difference in HIs among SB-2400M, SB-1360M, and SB-140M. The RTH assemblage data did indicate, however, that impairment among these three sites increased with proximity to the confluence of Ely Brook; this difference in the degree of impairment is likely related to higher contaminant concentrations in surface water from Ely Brook water during storm events that are diluted farther downstream.
Compared to the RTH assemblage data, the DTH data indicated a somewhat different response along the stream gradient. Whereas the RTH data indicated impairment was greatest below the Ely Brook confluence with incremental improvement sequentially downstream (fig. 9C,D; table 9), the DTH data indicated that impairment increased to SB-1360M, with partial recovery at SB-140M (fig. 10C,D; table 9). This difference between the RTH and DTH responses can be explained by the difference in the HI values for the School-house Brook sites. The highest HI for surface water occurred at SB-3100M, where the RTH assemblage also was the most impaired (fig. 15C,D; table 9), but the highest HI for pore water occurred at SB-1360M, where the DTH assemblage was the most impaired (fig. 16C,D; table 9). Comprehensively, these results indicate that a close association exists between biological assemblages and microhabitat conditions and that characterizing this association is crucial when making ecological assessments.
The assessment of the fish assemblages in Schoolhouse Brook, based on the fish IBI scores, essentially corresponded to the extent of impairment among sites based on the RTH invertebrate assemblages; impairment was severe below the confluence with Ely Brook, but with some recovery down-stream (fig. 18A; table 9). The association between HI val-ues for surface water and fish assemblages also was strong (fig. 19; table 9) and was similar to the response of the RTH invertebrate assemblages (fig. 15C,D; table 9). These results also imply a relation between the invertebrate and fish assem-blages, which was indicated by a strong correlation between the fish IBI scores and the invertebrate richness values for Schoolhouse Brook (rho = 0.975). However, this relation does not indicate that the fish assemblage response in Schoolhouse Brook was dependent on the RTH invertebrate response; rather, the two assemblages were likely responding similarly to levels of metal toxicity.

52 Aquatic Assessment of the Ely Copper Mine Superfund Site, Vershire, Vermont
A B
0
10
20
30
40
50F
ish
IBIS
core
(VT
-DE
C)
0
10
20
30
40
50
Fis
hIB
ISco
r e(V
T-D
EC
)River Meter and Reach
3,670 3,100 2,400 1,360 140 Schoolhouse Brook
24,050 23,630 23,200 Ompompanoosuc River
Figure 18. Fish assemblage index of biotic integrity (IBI) scores for (A) Schoolhouse Brook and (B) the Ompompanoosuc River (Vermont Department of Environmental Conservation (VT-DEC) assessment criteria). The first location in each frame was used to represent background conditions for the stream.
0 1 2 5 60
10
20
30
40
50
SB-1360M
SB-2400M
SB-140M
SB-3100M
OR-23200M
OR-23630M
OR-24050M
SB-3670M
Hazard Index
Fish
IBI S
core
(V
T-DE
C)
Explanation
Sample location and indentifierSB-140M
3 4
Figure 19. Fish assemblage index of biotic integrity (IBI) compared to the hazard index for surface waters. Upper dased line represents a threshold between an assessment of “Fair” and “Good”; the lower dashed line a threshold between “Fair” and Poor” (Vermont Department of Environmental Conservation (VT-DEC) assessment criteria). Blue symbols represent Schoolhouse Brook, and red symbols represent the Ompompanoosuc River.

Nature and Extent of Contamination 53
Analysis of the fish tissue data indicates that only copper and zinc were metals of potential concern when compared with the salmonid CBR values (Argue and others, 2008). The CBR value for copper was exceeded by more than three times in the single brook trout from SB-3100M (fig. 20A), and it is very likely that this fish had recently migrated to this location inadvertently from upstream, because no trout was captured farther downstream. Copper concentrations in the blacknose dace generally increased with distance downstream (fig. 20B), although fish at sites SB-3100M and SB-2400M also may have migrated from upstream. Only two blacknose dace were captured at each of these sites, and they were relatively mature fish of one size class (weight of 4.3 to 4.9 grams), whereas 41 dace were captured downstream at SB-140M and repre-sented several size classes (average weight of 2.5 grams).
The zinc concentrations in fish tissue exceed the CBR value for that metal at all sites, and there were no discernable patterns of variance among the sites (fig. 20C,D). Although there were not enough samples for an explicit interpretation, the greater variance in Cu concentrations in both brook trout
and blacknose dace suggests that Cu could be affecting fish more than Zn in Schoolhouse Brook.
Ompompanoosuc River
Surface-Water Geochemistry
Three sites were sampled in the Ompompanoosuc River in August 2006, one of which was upstream of the confluence with Schoolhouse Brook and was also discussed in the background conditions section (OR-24050M). The two other sites are site OR-23630M, located approximately 10 m downstream from the confluence with Schoolhouse Brook, and site OR-23200M, located farther downstream (approximately 440 m downstream from the confluence). Site OR-23200M is upstream of the confluence with Lake Fairlee outflow and the West Branch of the Ompompanoosuc River. Data from these sites will be used to examine downstream variations in water chemistry. Chemi-cal constituents for surface-water samples are summarized in table 4, and complete analyses are reported in appendix 6.
A. Brook trout B. Blacknose dace 10
0
1
2
3
4
5
6
7
8
9
Copp
e r(u
g/g,
w etw
t.)
0
1
2
3
4
5
6
7
8
9
10
Copp
er(u
g/g ,
wetw
t. )
C. Brook trout D. Blacknose dace
3,670 3,100 23,2000
10
20
30
40
50
Zinc
(ug/
g,we
twt.)
50
40
0
10
20
30
Zinc
( ug/
g,we
twt.)
Schoolhouse Brook Ompompanoosuc River
3,670 3,100 23,200Schoolhouse Brook Ompompanoosuc
River
3,670 3,100 2,400 1,360 140 24,050 23,630 23,200 Schoolhouse Brook Ompompanoosuc River
3,670 3,100 2,400 1,360 140 24,050 23,630 23,200 Schoolhouse Brook Ompompanoosuc River Figure 20. Concentrations
of copper and zinc in brook trout and blacknose dace tissue compared to the critical body residue (CBR) values for salmonids. The CBR value for copper [2.4 micrograms per gram wet weight (µg/g, wet wt.)] is based on the effects level and for zinc (16.4 micrograms per gram wet weight) is based on the no-effects level (the effects level not reported for zinc). At each location, each dot represents a single fish sample for brook trout or a composite sample for blacknose dace.

54 Aquatic Assessment of the Ely Copper Mine Superfund Site, Vershire, Vermont
Field Parameters and Major Inorganic Constituents
The pH and specific conductance of surface waters from the Ompompanoosuc River did not vary significantly among samples; pH ranged from 8.0 to 8.1, and specific conductance ranged from 196 to 198 µS/cm (fig. 5). The concentrations of the major dissolved cations also did not fluctuate consider-ably along the river reach sampled. For example, dissolved concentrations of Ca ranged from 32 to 32.9 mg/L, K ranged from 2.16 to 2.24 mg/L, Mg ranged from 1.46 to 1.61 mg/L, and Na ranged from 5.15 to 5.45 mg/L. Dissolved silica (SiO2) only ranged from 7.2 to 7.8 mg/L, and alkalinity, the domi-nant anionic species, only ranged from 85 to 87 mg/L (fig. 6). Chloride and sulfate were the next most abundant anionic spe-cies with concentrations of 5.4 to 6 mg/L and 7.2 to 8 mg/L, respectively. Previous reports found similar results or con-tained similar data (Seal and others, 2001; Holmes and others, 2002; Argue and others, 2008).
Iron, Aluminum, and Manganese
The concentrations of dissolved aluminum and man-ganese increased from 13.4 to 44.6 µg/L and from 4.7 to 8.9 µg/L, respectively, from background conditions at OR-24050M to the farthest downstream site at OR-23200M (fig. 7). The increase in concentrations from OR-24050M to OR-23630M was due to mixing of waters from Schoolhouse Brook which contained higher concentrations of these ele-ments (93.5 µg/L of Al and 13.6 µg/L of Mn at SB-140M). The concentrations of dissolved Fe are below the detection limit of 20 µg/L in all three samples.
Minor and Trace Inorganic Elements
The concentrations of several minor and trace elements, although generally low, increased from the background site of OR-24050M to the farthest downstream site of OR-23200M (fig. 7). These elements include Cd (<0.02 to 0.1 µg/L), Co (<0.02 to 0.31 µg/L), Cu (0.84 to 8.9 µg/L), and Pb (0.08 to 0.2 µg/L). The concentrations of dissolved zinc increased from 9.3 µg/L (OR-24050M) to 12.5 µg/L (OR-23630M) and then decreased to 6.9 µg/L (OR-23200M). The concentrations of Ba (19.1 to 20.2 µg/L), Sr (138 to 139 µg/L), and U (0.24 µg/L) did not vary significantly among samples. Dissolved Ag, As, Be, Cr, Hg, Sb, Se, Tl, and V concentrations were all below their detection limits. Concentrations of dissolved nickel were near or below its detection limit.
Dissolved Organic Carbon and Nutrients
DOC concentrations throughout the Ompompanoosuc River were nearly constant (2.5 to 2.6 mg/L) and slightly higher than that of Schoolhouse Brook. Nutrients were gener-ally low throughout the study area. Total dissolved nitrogen was 0.2 mg/L, and total dissolved phosphorus ranged from 0.005 to 0.007 mg/L.
Trace-Element LoadsCoupled streamflow measurements and surface-water
samples obtained at OR-23200M, OR-23630M, and OR-24050M on August 21, 2006, were used to describe the attenu-ation of constituents in the Ompompanoosuc River. Back-ground conditions were characterized by samples obtained at OR-24050M.
Most constituent loads at OR-23630M were similar to those expected from a summation of loads for SB-140M and OR-24050M (fig. 13). However, loads for total Al, Co, Cu, and Fe and dissolved Co and Cu at OR-23630M were less than expected assuming simple mixing. This is most likely the result of Fe hydroxides settling to the river bottom as waters travel from the steep gradient of Schoolhouse Brook to the more tranquil Ompompanoosuc River, as reflected by the higher Fe concentrations in the Ompompanoosuc sediments downstream of the confluence with Schoolhouse Brook (table 6).
Iron and manganese oxidation in the surface water and reductive dissolution in the hyporheic zone of the streambed are most likely driving the fate and transport of constituents in the Ompompanoosuc River from OR-23630M to OR-23200M. AVS was not detected in the streambed sediments, and sulfate loads were similar between locations. Loads for total and dissolved Cd, Co, Cu, total Fe, and dissolved Mn increased, and loads for total Mn decreased from OR-23630M to OR-23200M. Transient flow through the streambed may induce cycling of Fe and Mn hydroxides and the release of associated metals as O2 or NO3 infiltrates to reduced sections of the hyporheic zone (Koretsky and others, 2006). This also may be evident as manganese concentrations in the pore water were elevated, as is typical at the boundary of the anoxic layer (Koretsky and others, 2006). Transient flow through the streambed that diffuses upward most likely results in repre-cipitation of Fe and Mn hydroxides, whereas flow diffusing downward to more reduced sediments most likely results in Fe being associated with the sulfides and Mn being associated with carbonates (Koretsky and others, 2006).
Comparisons with Ambient Water-Quality Criteria and Relations among Reaches
The Ompompanoosuc River was partitioned into three reaches for analysis of water data on the basis of the proximity to runoff associated with the Ely Mine site and the conflu-ence with a tributary. Stream reach 1, defined by locations sampled from river meter 8,350 to 20,000, is a fourth-order stream reach (table 2) and was partitioned to describe water-quality conditions above the confluence with the West Branch Ompompanoosuc River and below the confluence with the Lake Fairlee outflow tributary. Stream reach 2, defined by locations sampled from river meter 20,000 to 23,640, is a third-order stream reach and was partitioned to describe water-quality conditions downstream of the con-fluence with Schoolhouse Brook and above the Lake Fair-lee outflow tributary. Stream reach 3, defined by locations sampled above river meter 23,640, was partitioned to describe background conditions.

Nature and Extent of Contamination 55
Concentrations in surface waters greater than AWQC were observed in stream reach 1 for Al, Ba, Mn, and Ag, and in stream reach 2 for Al, Ba, Cu, and Hg (fig. 21, appen-dix 5). Concentrations of most elements in surface waters of reaches 1 and 2 generally were similar to background condi-tions (rho > 0.05). However, concentrations of Co, Cu, and Mn in reach 1 and Cd, Co, and Cu in reach 2 generally were greater than and significantly different from background con-ditions (rho < 0.05). Concentrations of Co and Cu in reach 1 generally were less than and significantly different from those observed in reach 2 (rho < 0.05).
Pore-Water GeochemistryPore-water samples from the Ompompanoosuc River
were collected from the background conditions site OR-24050M and farthest downstream site OR-23200M. Pore water was not collected at OR-23630M, which was 10 m downstream of the confluence with Schoolhouse Brook. Chemical constituents for pore-water samples are summarized in table 5, and complete analyses are reported in appendix 7.
Field Parameters and Major Inorganic Constituents
The pH and specific conductance were measured only on the in situ and equilibrated samples. The pH of pore waters from the Ompompanoosuc River was near neutral and ranged from 7.4 to 7.9 (fig. 5). This is comparable to the pH of the pore waters from Schoolhouse Brook upstream from its mouth (SB-140M). The differences in pH between the in situ and equilibrated pore waters were not significant. In contrast to pH, the specific conductance values of the equilibrated pore water (535 to 709 µS/cm) were significantly higher than the in situ splits (277 to 359 µS/cm), which were higher than surface-water values (196 to 198 µS/cm) (fig. 5).
Calcium was the dominant dissolved cation, and K, Mg, Na, and SiO2 occurred in subequal proportions, similar to the surface-water samples. The concentrations of most of these constituents were lower in pore waters from the site downstream of the confluence with Schoolhouse Brook (OR-23200M) compared to the upstream background site (OR-24050M). The concentrations of dissolved major cations were usually highest in the equilibrated samples and lowest in the in situ samples, with the intermediate concentrations in centrifuged splits (table 5). Dissolved cation concentrations reached 137 mg/L for Ca, 12.9 mg/L for K, 7.78 mg/L for Mg, 16.8 mg/L for Na, and 16.1 mg/L for SiO2. Hardness ranged from 95.5 to 141.3 mg/L CaCO3 equivalent in the in situ samples, from 186.6 to 187.9 mg/L in centrifuged samples, and from 233.6 to 374.4 mg/L in equilibrated samples. Alka-linity was the dominant anionic species; sulfate and chloride concentrations were significantly less and occurred in sub-equal proportions (fig. 6).
Iron, Aluminum, and Manganese
Dissolved iron concentrations were below the detection limit of 20 µg/L for in situ and equilibrated pore waters; the concentrations in the centrifuged samples were 30 and 23 µg/L for OR-24050M and OR-23200M, respectively (fig. 7). The concentrations of dissolved aluminum were also low and reached 38.5 µg/L in the centrifuged pore water from site OR-23200M. Dissolved Mn concentrations were significantly higher than Al and Fe concentrations and reached 327 µg/L in the in situ pore waters, 1,500 µg/L in centrifuged pore waters, and 6,270 µg/L in equilibrated pore waters. Aluminum and manganese were not determined on centrifuged pore waters due to insufficient sample size.
Minor and Trace Inorganic Elements
The minor and trace elements present in pore waters from the Ompompanoosuc River were Ba (up to 126 µg/L), Cd (up to 0.19 µg/L), Co (up to 3.08 µg/L), Cr (up to 1.9 µg/L), Cu (up to 19.1 µg/L), Ni (up to 3.8 µg/L), Pb (up to 0.3 µg/L), Se (up to 1.2 µg/L), Sr (up to 559 µg/L), U (up to 1.91 µg/L), V (up to 1.8 µg/L), and Zn (up to 5.7 µg/L). The highest con-centrations of these elements were commonly found in the equilibrated pore waters, and the lowest concentrations were commonly found in the in situ pore waters. The concentrations of Cd, Co, Cu, and Pb were higher in pore waters downstream of the confluence with Schoolhouse Brook (OR-23200M) compared to upstream (OR-24050M) (fig. 7). Similar to sur-face waters, dissolved Ag, As, Be, Hg, Sb, and Tl concentra-tions in all pore waters were below their detection limits.
Dissolved Organic Carbon and Nutrients
DOC and nutrient concentrations were determined only on splits of the in situ pore-water samples. DOC concentra-tions were 1.4 mg/L in both OR-24050M and OR-23200M pore waters. Nutrients were low, with total dissolved nitrogen values of 1.04 mg/L for OR-24050M and 0.2 mg/L for OR-23200M, and total dissolved phosphorus of 0.006 mg/L for OR-24050M and 0.005 mg/L for OR-23200M.
Comparisons with Ambient Water Quality Criteria
In the previous section on surface water in the Ompom-panoosuc River, sample sites were divided on the basis of stream reach and compared to ambient water-quality criteria. Hardness-dependent criteria were calculated based on the hardness of the sample. This section will refer to the same stream reaches although pore waters are from this study whereas surface waters included all historical samples. Pore waters were not sampled prior to this investigation. As in the previous section, stream reach 2 refers to water-quality conditions downstream from the confluence with Schoolhouse Brook and upstream from the confluence with Lake Fairlee outflow; OR-23200M is from this reach. Stream reach 3 refers to water-quality conditions upstream of the confluence with Schoolhouse Brook and represents background concentrations;

56 Aquatic Assessment of the Ely Copper Mine Superfund Site, Vershire, Vermont
TOTAL ALUMINUM500
10
100
1,000
1211
20
AAWQC
9*
*
DISSOLVED BARIUM
1
10
100
11
10
15
DISSOLVED CADMIUM.5
.001
.01
.19
7
DISSOLVED COBALT5
10
14
.01
.1
1
10
*9
DISSOLVED CHROMIUM
11 10
15
.01
.1
1
5
DISSOLVED COPPER
10
10
15
.1
1
10
100
Background Reach 2 Reach 1 (>23,640m) (20,000-23,640m) (8,350-20,000m)
CON
CEN
TRAT
ION
, IN
MIC
ROGR
AMS
PER
LITE
R
CON
CEN
TRAT
ION
, IN
MIC
ROGR
AMS
PER
LITE
R
OMPOMPANOOSUC RIVER
5
Background Reach 2 Reach 1 (>23,640m) (20,000-23,640m) (8,350-20,000m)
OMPOMPANOOSUC RIVER
DISSOLVED LEADDISSOLVED IRON
10 9
1
10
100
.0001
.001
.01
.1
110 9
14
Figure 21. Select constituent concentrations in surface waters among three reaches in the Ompompanoosuc River at the Ely Mine Superfund site, Vershire, VT. Data are from this study and Argue and others (2008).

Nature and Extent of Contamination 57
DISSOLVED SILVER
87
12
.00001
.0001
.001
.01
.1
1DISSOLVED URANIUM
9 9
7
.01
.1
1
DISSOLVED MANGANESE
11
10
15
1
10
100
AWQC Ambient Water-Quality Criteria forprotection of aquatic biota
90th percentile
25th percentile
75th percentile
50th percentile (median)
10th percentile
EXPLANATION
31 Number of samples in analysis
Background Reach 2 Reach 1 (>23,640m) (20,000-23,640m) (8,350-20,000m)
OMPOMPANOOSUC RIVER
Background Reach 2 Reach 1 (>23,640m) (20,000-23,640m) (8,350-20,000m)
OMPOMPANOOSUC RIVER
Estimated, less than maximumdetection limit
DISSOLVED NICKEL
1010
15
.01
.1
1
5
DISSOLVED ZINCCON
CEN
TRAT
ION
, IN
MIC
ROGR
AMS
PER
LITE
R
CON
CEN
TRAT
ION
, IN
MIC
ROGR
AMS
PER
LITE
R
1110
15
1
10
100
* All samples less than maximum detection limit
Figure 21. Select constituent concentrations in surface waters among three reaches in the Ompompanoosuc River at the Ely Mine Superfund site, Vershire, VT. Data are from this study and Argue and others (2008).—Continued
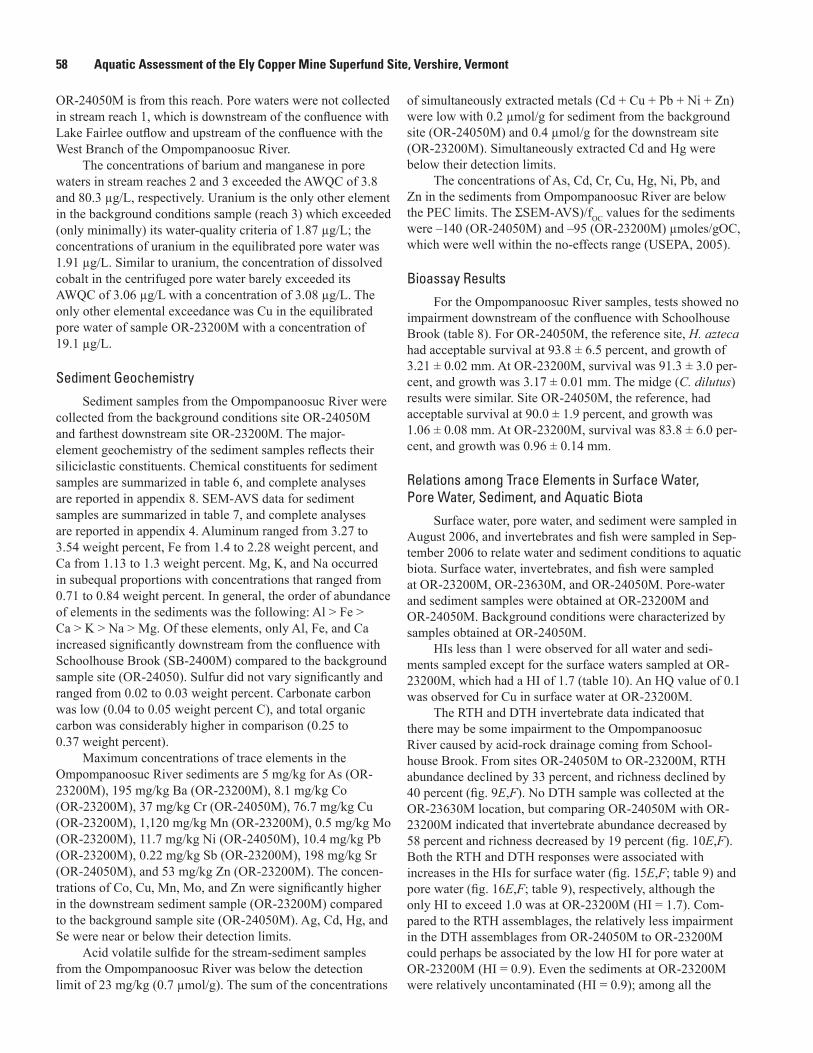
58 Aquatic Assessment of the Ely Copper Mine Superfund Site, Vershire, Vermont
OR-24050M is from this reach. Pore waters were not collected in stream reach 1, which is downstream of the confluence with Lake Fairlee outflow and upstream of the confluence with the West Branch of the Ompompanoosuc River.
The concentrations of barium and manganese in pore waters in stream reaches 2 and 3 exceeded the AWQC of 3.8 and 80.3 µg/L, respectively. Uranium is the only other element in the background conditions sample (reach 3) which exceeded (only minimally) its water-quality criteria of 1.87 µg/L; the concentrations of uranium in the equilibrated pore water was 1.91 µg/L. Similar to uranium, the concentration of dissolved cobalt in the centrifuged pore water barely exceeded its AWQC of 3.06 µg/L with a concentration of 3.08 µg/L. The only other elemental exceedance was Cu in the equilibrated pore water of sample OR-23200M with a concentration of 19.1 µg/L.
Sediment Geochemistry
Sediment samples from the Ompompanoosuc River were collected from the background conditions site OR-24050M and farthest downstream site OR-23200M. The major-element geochemistry of the sediment samples reflects their siliciclastic constituents. Chemical constituents for sediment samples are summarized in table 6, and complete analyses are reported in appendix 8. SEM-AVS data for sediment samples are summarized in table 7, and complete analyses are reported in appendix 4. Aluminum ranged from 3.27 to 3.54 weight percent, Fe from 1.4 to 2.28 weight percent, and Ca from 1.13 to 1.3 weight percent. Mg, K, and Na occurred in subequal proportions with concentrations that ranged from 0.71 to 0.84 weight percent. In general, the order of abundance of elements in the sediments was the following: Al > Fe > Ca > K > Na > Mg. Of these elements, only Al, Fe, and Ca increased significantly downstream from the confluence with Schoolhouse Brook (SB-2400M) compared to the background sample site (OR-24050). Sulfur did not vary significantly and ranged from 0.02 to 0.03 weight percent. Carbonate carbon was low (0.04 to 0.05 weight percent C), and total organic carbon was considerably higher in comparison (0.25 to 0.37 weight percent).
Maximum concentrations of trace elements in the Ompompanoosuc River sediments are 5 mg/kg for As (OR-23200M), 195 mg/kg Ba (OR-23200M), 8.1 mg/kg Co (OR-23200M), 37 mg/kg Cr (OR-24050M), 76.7 mg/kg Cu (OR-23200M), 1,120 mg/kg Mn (OR-23200M), 0.5 mg/kg Mo (OR-23200M), 11.7 mg/kg Ni (OR-24050M), 10.4 mg/kg Pb (OR-23200M), 0.22 mg/kg Sb (OR-23200M), 198 mg/kg Sr (OR-24050M), and 53 mg/kg Zn (OR-23200M). The concen-trations of Co, Cu, Mn, Mo, and Zn were significantly higher in the downstream sediment sample (OR-23200M) compared to the background sample site (OR-24050M). Ag, Cd, Hg, and Se were near or below their detection limits.
Acid volatile sulfide for the stream-sediment samples from the Ompompanoosuc River was below the detection limit of 23 mg/kg (0.7 µmol/g). The sum of the concentrations
of simultaneously extracted metals (Cd + Cu + Pb + Ni + Zn) were low with 0.2 µmol/g for sediment from the background site (OR-24050M) and 0.4 µmol/g for the downstream site (OR-23200M). Simultaneously extracted Cd and Hg were below their detection limits.
The concentrations of As, Cd, Cr, Cu, Hg, Ni, Pb, and Zn in the sediments from Ompompanoosuc River are below the PEC limits. The ΣSEM-AVS)/fOC values for the sediments were –140 (OR-24050M) and –95 (OR-23200M) µmoles/gOC, which were well within the no-effects range (USEPA, 2005).
Bioassay Results
For the Ompompanoosuc River samples, tests showed no impairment downstream of the confluence with Schoolhouse Brook (table 8). For OR-24050M, the reference site, H. azteca had acceptable survival at 93.8 ± 6.5 percent, and growth of 3.21 ± 0.02 mm. At OR-23200M, survival was 91.3 ± 3.0 per-cent, and growth was 3.17 ± 0.01 mm. The midge (C. dilutus) results were similar. Site OR-24050M, the reference, had acceptable survival at 90.0 ± 1.9 percent, and growth was 1.06 ± 0.08 mm. At OR-23200M, survival was 83.8 ± 6.0 per-cent, and growth was 0.96 ± 0.14 mm.
Relations among Trace Elements in Surface Water, Pore Water, Sediment, and Aquatic Biota
Surface water, pore water, and sediment were sampled in August 2006, and invertebrates and fish were sampled in Sep-tember 2006 to relate water and sediment conditions to aquatic biota. Surface water, invertebrates, and fish were sampled at OR-23200M, OR-23630M, and OR-24050M. Pore-water and sediment samples were obtained at OR-23200M and OR-24050M. Background conditions were characterized by samples obtained at OR-24050M.
HIs less than 1 were observed for all water and sedi-ments sampled except for the surface waters sampled at OR-23200M, which had a HI of 1.7 (table 10). An HQ value of 0.1 was observed for Cu in surface water at OR-23200M.
The RTH and DTH invertebrate data indicated that there may be some impairment to the Ompompanoosuc River caused by acid-rock drainage coming from School-house Brook. From sites OR-24050M to OR-23200M, RTH abundance declined by 33 percent, and richness declined by 40 percent (fig. 9E,F). No DTH sample was collected at the OR-23630M location, but comparing OR-24050M with OR-23200M indicated that invertebrate abundance decreased by 58 percent and richness decreased by 19 percent (fig. 10E,F). Both the RTH and DTH responses were associated with increases in the HIs for surface water (fig. 15E,F; table 9) and pore water (fig. 16E,F; table 9), respectively, although the only HI to exceed 1.0 was at OR-23200M (HI = 1.7). Com-pared to the RTH assemblages, the relatively less impairment in the DTH assemblages from OR-24050M to OR-23200M could perhaps be associated by the low HI for pore water at OR-23200M (HI = 0.9). Even the sediments at OR-23200M were relatively uncontaminated (HI = 0.9); among all the

Discussion 59
non-reference sites sampled for pore water or sediment in the study, the respective HIs at OR-23200M were the lowest.
The assessment of the fish assemblages in Ompom-panoosuc River did not clearly indicate that any degree of impairment was caused by acid-mine drainage from School-house Brook. The IBI value derived for the assemblages at all three sites was 33 (fig. 18B; table 9), which was the minimal score for a bioassessment classification of “good” by the VTDEC (2008). The assessment at OR-23200M was based on data from the survey that was conducted in 2007. Based on the fish assemblage data from the original 2006 survey, the OR-23200M was assessed as “poor,” but of the eight metrics used to derive the fish IBI, only density of individuals failed. The fish resurvey was done 1 year later (within 1 day), and the number of fish captured was exactly twice the number from the original survey (124 and 62, respectively). In comparing the fish IBI values with surface-water HIs among all locations, the Ompompanoosuc locations were between SB-3670M (HI = 0, IBI = 42) and SB-140M (HI = 3.0, IBI = 29), as might be predicted (fig. 19).
Only two brook trout were captured on the Ompompa-noosuc River for a tissue sample, and both were at location OR-23200M. Both samples of trout had Cu concentrations below the Cu CBR value and had Zn concentrations only slightly above the Zn CBR value (fig. 20A,C). However, the zinc concentrations were still less than zinc values in the five fish from the reference location (SB-3670M). The concen-trations of Cu in blacknose dace increased somewhat in the Ompompanoosuc River below Schoolhouse Brook, as based on the average concentration in the three composite samples from each location. The average concentration was 1.3 mg/kg at OR-24050M and 2.4 mg/kg at both OR-23630M and OR-23200M; however, even these averages were only equal to the CBR value for copper (fig. 20B). As seen in the Schoolhouse Brook sites, concentrations of zinc in blacknose dace showed no discernible pattern among the Ompanoosuc River sites, even though all samples were well above the CBR level for Zn (fig. 20D).
DiscussionThe health of the aquatic ecosystem surrounding the
Ely Mine Superfund site has been assessed by investigating ecological indicators of aquatic ecosystem health and then by examining geochemical attributes of associated water and sediments to explain the biological observations. Ecologi-cal indicators used in this study include parameters for both invertebrates and fish. Invertebrate measures include infauna and epifauna invertebrate assemblage abundance and rich-ness data. The fish community was assessed using an index of biotic integrity.
Several approaches are available to evaluate the potential toxicity of both the surface water and sediment. Surface-water toxicity can be evaluated on the basis of hardness-based
criterion maximum concentration (CMC) values for acute toxicity and criterion continuous concentration (CCC) values of Ag, Cd, Cu, Cr(III), Ni, Pb, and Zn (USEPA, 2006). Copper toxicity can also be evaluated on the basis of a water-quality criterion that incorporates the role of DOC through the Biotic Ligand Model (USEPA, 2007). Sediment toxicity can be evaluated through comparison of concentrations of As, Cd, Cr, Cu, Hg, Ni, Pb, and Zn with a probable effects concentration (PEC; MacDonald and others, 2000). It can also be evaluated in terms of an equilibrium-partitioning sediment benchmark (ESB; USEPA, 2005) that combines Cd, Cu, Ni, Pb, and Zn. Sediment toxicity can be evaluated additionally using pore-water concentrations relative to water-quality standards. This study used three separate approaches to investigate pore-water compositions. Sediment toxicity has also been assessed in this study through toxicity testing employing Hyalella azteca with 28-day exposures and Chironomus dilutus with 10-day exposures.
Surface-Water Quality
Surface-water chemistry throughout the site was domi-nated by streams of moderate alkalinity and hardness that become impacted from the influx of acid-mine drainage in and around the mine-waste piles, which was then followed by pro-gressive dilution by larger streams of moderate alkalinity and hardness downstream of the site. Surface water in Ely Brook and tributary 2 in Ely pond 1 started with neutral pH (7.0 to 7.2), low specific conductance (51 to 87 µS/cm), low hard-ness (18.8 to 38.3 mg/L CaCO3), moderate alkalinity (19 to 41 mg/L CaCO3 equivalent), and low DOC (1.9 to 3.5 mg/L). Ely Brook showed only modest variations in pH and increases in specific conductance from EB-1080M to EB-600M prior to reaching the area of the mine-waste piles and before its confluence with tributary 2, which drains the ponds. Through this same reach, alkalinity decreased from 41 mg/L CaCO3 to 0, dissolved sulfate concentrations increased modestly up to 52 mg/L, dissolved Fe was near the detection limit (20 µg/L), dissolved Al reached 25.1 µg/L, dissolved Cd reached 1.0 µg/L, dissolved Cu reached 837 µg/L, and dissolved Zn reached 114 µg/L.
Tributary 2 underwent significant changes in water chemistry prior to merging with Ely Brook, with the most dramatic changes taking place between Ely ponds 4 and 5. The pH dropped from 7.0 to 6.5 in pond 5 and to 4.7 in Ely pond 6. Likewise, the specific conductance increased from 51 to 117 µS/cm in pond 5 to 206 µS/cm in pond 6. Through this same reach, alkalinity reached a high of 31 mg/L CaCO3 but decreased to 17 mg/L and then 0, hardness increased to 63.6 mg/L CaCO3, dissolved sulfate concentrations increased from 6.3 mg/L in pond 1 to 33 mg/L in pond 5 and 93 mg/L in Ely pond 6. Dissolved iron and aluminum concentrations were less systematic. The dissolved iron concentration in the reference pond was 66 µg/L, reached 353 µg/L in pond 2, dropped to <20 µg/L in pond 5 before reaching a maximum of

60 Aquatic Assessment of the Ely Copper Mine Superfund Site, Vershire, Vermont
565 µg/L in pond 6. In contrast, the dissolved aluminum con-centration in pond 1 was 15.8 µg/L, then fluctuated between 5.5 and 10.1 µg/L in ponds 2 through 5 before reaching a maximum of 1,410 µg/L in pond 6. Trace metals showed a more systematic variation with dissolved Cd going from less than detection (<0.02 µg/L) in the reference pond to 2.3 µg/L in pond 6, dissolved Cu from 1.1 µg/L in the reference pond to to 1,380 µg/L in pond 6, and dissolved Zn from 2.3 µg/L in the reference pond to 325 µg/L in pond 6. For all three trace metals, the dissolved concentrations increased by a factor of 2 to 3 going from pond 5 to 6. In April 2002, Holmes and others (2002) sampled tributary 2 downstream of the ponds prior to the confluence with Ely Brook (their site EB3) on two separate occasions. They found that pH ranged between 3.3 and 4.3, hardness between 33 and 34 mg/L CaCO3 equivalent, and dissolved sulfate between 66 and 74 mg/L. Dissolved Fe concentrations ranged from 4,300 to 4,600 µg/L, dissolved Al from 2,500 to 3,600 µg/L, dissolved Cd from 1.9 to 2.4 µg/L, dissolved Cu from 1,400 to 2,000 µg/L, and dissolved Zn from 260 to 310 µg/L.
Prior to entering Schoolhouse Brook, Ely Brook (EB-90M) had low pH (3.2), high specific conductance (447 µS/cm), moderate hardness (75.5 mg/L CaCO3), no alka-linity, and low DOC (1.6 mg/L). Dissolved Fe (6,370 µg/L), Al (4,190 µg/L), Cd (2.0 µg/L), Cu (1,560 µg/L), and Zn (373 µg/L) concentrations were high.
Upon entering Schoolhouse Brook, the effluent from Ely Brook was diluted rapidly. Ely Brook only contributes approximately 7 percent of the flow to Schoolhouse Brook immediately downstream of their confluence on the basis of their drainage areas (table 2). Relative to sites EB-90M in Ely Brook and SB-3125M in Schoolhouse Brook downstream of the confluence in August 2006, dilution of Ely Brook resulted in an increase in pH from 3.2 to 7.8, a decrease in specific conductance from 447 to 215 µS/cm, and an increase in hardness from 75.5 to 95.9 mg/L CaCO3. The DOC con-centration was essentially unchanged (1.6 mg/L at EB-90M and 1.3 mg/L at SB-3125M). Dissolved constituents that could be attributed to mine drainage from Ely Brook include sulfate, which decreased from 143 to 13 mg/L, 9 percent of its orginal concentration; dissolved Fe, which dropped from 6,370 to 49 µg/L, less than 1 percent of its original concentra-tion; dissolved Al, which dropped from 4,790 to 109 µg/L, 2.3 percent of its original concentration; Cu, which dropped from 1,780 to 44 µg/L, 2.4 percent of its original concentra-tion; and Zn, which dropped from 357 to less than 20 µg/L, less than 6 percent of its original concentration. The drop in sulfate concentration was consistent with dilution considering its conservative behavior in solution; however, the magnitudes of decreases in Al, Fe, Cu, and Zn indicated that the concentra-tions of these elements were additionally reduced by precipita-tion of Fe and Al hydroxides and sorption of Cu and Zn onto these substrates.
With increasing distance downstream in Schoolhouse Brook and then the Ompompanoosuc River, contamination from the site becomes increasingly diluted. Despite decreasing
concentrations for mine-drainage constituents, the dissolved and total loads of most metals remained fairly constant from Ely Brook downstream to the Ompompanoosuc River (fig. 13). At OR-23200M, the water quality was virtually indistinguishable from background conditions with the excep-tion of slightly elevated dissolved concentrations of aluminum (44.6 µg/L) and copper (8.9 µg/L). In addition to dilution, precipitation of Fe and Al hydroxides and sorption onto these substrates are also important controls on the concentrations of Fe, Al, and trace metals in solution.
With regards to chronic toxicity for aquatic ecosystems, only five elements exceeded water-quality standards locally: Fe, Al, Cd, Cu, and Zn. Iron and Al have fixed standards, but those for Cd, Cu, and Zn are a function of water chemistry (USEPA, 2006, 2007). The hardness used to calculate the vari-ous water-quality standards was that of the sample rather than average values used for the whole site. Iron only exceeded chronic standards at 1 (EB-90M) of 18 sites, Al exceeded chronic standards at 5 of 18 sites, Cd and Zn both exceeded chronic standards at the same 5 of 18 sites, and Cu exceeded at 12 of 18 sites (fig. 22). Four of the six sites that did not exceed copper water-quality standards were reference sites upstream of mine-drainage contributions.
Problematic concentrations of dissolved iron are lim-ited to EB-90M, which represented the sum of the Ely Brook watershed prior to emptying into Schoolhouse Brook. This site is more than 500 m downstream from its nearest site on Ely Brook. This site had the lowest pH and highest specific conductance of all sites included in this aquatic ecosystem assessment. The rapid natural attenuation of iron downstream of EB-90M reflected the combined influences of neutralization with attendant oxidation of ferrous iron and hydrolysis of fer-ric iron, and dilution.
The most problematic concentrations of dissolved aluminum were found in the lowermost pond (pond 6) and at EB-90M, which are the two sampled sites with the lowest pH. In addition, Schoolhouse Brook downstream of Ely Brook had dissolved aluminium concentrations that ranged between 97 and 143 percent of its chronic value. Dilution by the Ompom-panoosuc River dropped the value well below chronic levels. The high concentrations in the Ely Brook watershed clearly reflected the control of pH on aluminum solubility, and the necessity of low pH to attack silicate minerals and release alu-minum to mine drainage. The natural attenuation of aluminum concentrations to levels just above the chronic water-quality standard was due to the neutralization of drainage from Ely Brook by Schoolhouse Brook and the associated precipita-tion of Al hydroxides. The persistence of these concentrations down to the confluence with the Ompompanoosuc River may have reflected colloidal aluminum that reported in the dis-solved fraction.
The coincidence of high concentrations of cadmium and zinc was due to their identical source in the mine waste piles—the mineral sphalerite—and the similarity of their geo-chemical behaviors (Seal and Hammarstrom, 2003). Cadmium and zinc exceeded water-quality criteria in the two lowermost

Discussion 61
0.01
0.1
1
10
100
1,000
FeAlCdZnCuSum of Cd, Cu, Ni, Pb, Zn
HAZA
RD Q
UOTI
ENT
HAZA
RD Q
UOTI
ENT
432
385
345
320
290
195
Ely Ponds Ely Brook1,0
80 600 9077
0
RIVER METER AND REACH
Explanation
B
A
RIVER METER AND REACH
Inflow of water from previous reach
0.01
0.1
1
10
100
1,000
Schoolhouse Brook OmpompanoosucRiver
3,670
3,100
2,400
1,360 14
024
,050
23,63
023
,200
Figure 22. Downstream variations in aluminum, iron, cadmium, copper, and zinc hazard quotients in surface waters at the Ely Mine Superfund site, Vershire, VT. A, Ely ponds and Ely Brook; B, Schoolhouse Brook and the Ompompanoosuc River.

62 Aquatic Assessment of the Ely Copper Mine Superfund Site, Vershire, Vermont
ponds, and throughout Ely Brook except for the reference site at the head waters (fig. 22). The fact that the HQ for cadmium relative to the chronic water-quality standards was far greater than that for zinc was a reflection of the low concentrations of the chronic standard for cadmium rather than its concentration in the watershed.
The concentrations of dissolved copper were most problematic and widespread of all of the contaminants in the vicinity of the site. In fact, comparison of HQs for copper rela-tive to hardness-based chronic water-quality standards with the sum of HQs for Cd, Cu, Ni, Pb, and Zn clearly demon-strated that Cu was the dominant contaminant at all sample sites (fig. 22). Four of the six ponds exceeded chronic water-quality standards, as do all of Ely Brook and Schoolhouse Brook, except for the reference sites. Interestingly, the most downstream site on the Ompompanoosuc River (OR-23200M) marginally exceeded the chronic standards, whereas none of the sites closer to the source did.
Copper is the only element at present to have its USEPA (2006) hardness-based aquatic water-quality criteria super-seded by aquatic criteria based on the Biotic Ligand Model
(Paquin and others, 2002; USEPA, 2007). Throughout most of the watershed, water-quality criteria calculated using both methods were similar, but significant differences were appar-ent in some of the Ely ponds and in Ely Brook as reflected by a comparison of HQs based on the two methods (fig. 23). For the ponds with the distinctly disparate HQs between the two methods (pond 5 and pond 6), the water chemistry had distinctly lower DOC concentrations and alkalinity, and higher concentrations of sulfate, Cl, K, and Na, all of which were parameters used in the Biotic Ligand approach, but not the hardness-based approach. For Ely Brook, the disparate samples (EB-770M, EB-600M, EB-90M) were distinguished by their higher sulfate, Cl, Na, and K concentrations, as well as their low alkalinity. Both calcium and magnesium were higher in the lowermost Ely ponds, and in Ely Brook, but both approaches account for these differences. In the Ompompa-noosuc River, the hardness-based HQs were higher than the Biotic Ligand Model quotients. This difference was likely due to the fact that the DOC concentrations in the Ompompa-noosuc River were roughly twice those in Schoolhouse Brook.
0.01
0.1
1
10
100
1,000
10,000
100,000
Hardness basedBiotic Ligand Model
Explanation
HAZA
RD Q
UOTI
ENT
Ely Brook Schoolhouse Brook
Ompompan-oosuc River
1,080 60
0 903,6
703,1
002,4
001,3
60 140
24,05
023
,63023
,20043
238
534
532
029
019
5
Ely Ponds
770
RIVER METER AND REACH
Inflow of water from previous reach
Figure 23. Downstream variations in hardness-based and Biotic Ligand Model–based hazard quotients for copper in surface waters at the Ely Mine Superfund site, Vershire, VT.

Discussion 63
Sediment and Pore-Water Toxicity
Sediments from the 11 Ely Mine sites had similar physical and chemical characteristics (table 6 and appen-dix 4). All samples were dominated by sand-sized particles (67–94 percent) and had low levels of silt- and clay-sized particles (5–13 percent). All sediments had low levels of TOC and AVS, and these constituents were very consistent among locations. Sediments from Ely Brook, except the reference site EB-1080M, had high concentrations of iron (>5 percent) and manganese (>1 percent). Most pore waters had neutral to slightly alkaline pH, except for slightly acidic (pH 6.1) pore waters from EB-770M and the highly acidic (pH 3.0) pore water from EB-90M sediments. Site EB-90M pore waters also had very high concentrations of aluminum and iron, typical of waters affected by acid-mine drainage.
Sediment and pore waters from sites in Ely Brook, downstream of the mining area, had greater concentrations of metals than those from sites farther downstream from the mining area. Total copper concentrations in sediments from sites EB-770M, EB-600M, and EB-90M (table 6) exceeded PEC values, which are associated with greater risks of toxic-ity in sediment toxicity tests (MacDonald and others, 2000), by factors from 8 to 40. All three sediment samples from Schoolhouse Brook downstream of the confluence of Ely Brook also exceeded the copper PEC. Sediments from sites in Ely Brook also had greatest concentrations of Cr, Cd, Ni, Zn, and Pb, although none of these metals exceeded PECs except Pb concentrations in the EB-600M sediment. Total metal concentrations did not show a pattern of consistent decrease downstream from Ely Brook, although concentra-tions of several metals were substantially lower in sediments from OR-23200M compared to upstream sites. Metals in SEM extracts followed patterns similar to those of total metals, except that greatest concentrations of SEM Cu, Cd, Ni, and Zn occurred in sediments from EB-600M rather than EB-90M. Only about 1 percent of the total copper in EB-90M sediments was in labile forms, compared to one-third of the total copper in EB-600M sediments. Metal concentrations in pore waters followed trends more similar to total metal concentrations. Pore waters of sediments from Ely Brook, particularly those from EB-90M, also had greatest concentrations of Cd, Cu, Ni, Pb, and Zn. Concentrations of Cu and Cd in pore waters from all three Ely Brook sediment sites downstream from the reference site exceeded hardness-adjusted chronic water qual-ity criteria (table 11; USEPA, 2006) for all three pore-water sample types—in situ, centrifuged, and 28-day equilibration samples. Zinc concentrations in pore waters locally exceeded hardness-adjusted chronic criteria in various sample types at EB-600M and EB-90M. Downstream in Schoolhouse Brook,
hardness-adjusted chronic water-quality criteria for copper were exceeded at all sites for at least one pore-water sample type, but no exceedances were found for Cd or Zn in any sample. In the Ompompanoosuc River, copper exceeded the hardness-adjusted chronic water-quality criteria only for the 28-day equilibrated pore-water sample at OR-23200M.
Indices of toxicity risk based on total sediment metals, metals in the SEM fraction, and pore-water metals indicated a wide range of toxicity risks among the eleven study sites (fig. 24). An index based on the probable effects quotient (PEQ) for total sediment metals (ΣPEQ = sum of [total metal concentration/PEC]) indicated greatest toxicity risk for sedi-ments from Ely Brook, with ΣPEQ values ranging from 10 (EB-770M) to 42 (EB-90M).
Ingersoll and others (2001) documented greater than 50 percent frequency of toxicity in tests with H. azteca and C. tentans in metals-contaminated sediments with mean PEQ values of 1.0 or greater—values equivalent to ΣPEQ of 6 or greater in this study. The ΣPEQ index indicated lower toxicity risks for sediments from downstream sites (ΣPEQ from 1.3 to 2.8) and reference sites (ΣPEQ from 0.7 to 1.7). An index based on pore-water toxic units (ΣTU = sum of [pore-water metal/chronic water-quality criterion]) followed a similar pattern. For each reach, the ΣTU value for each reference site was lower than those on the same reach and downstream of inputs of mine-influenced water and sediment. In the miner-alized Ely Brook watershed, the ΣTU value at the reference site (EB-1080M) was greater than 1, whereas at the reference sites in Schoolhouse Brook (SB-360M) and the Ompom-panoosuc River (OR-24050M), the values were less than 1. The pore-water toxicity units for Ely Brook steadily increase downstream, reaching a maximum of 270 at site EB-90M (fig. 25). The pore-water ΣTU values drop dramatically upon entering Schoolhouse Brook and fluctuate slightly above or below 1 throughout Schoolhouse Brook and downstream to the lowermost sampling site on the Ompompanoosuc River (OR-23200M) (fig. 25).
The ESB index proposed by USEPA (2005), which adjusts SEM concentrations to approximate binding of metals by AVS and organic carbon (ESB index = ΣSEM–AVS/fOC), suggested a slightly different pattern of toxicity risks, with greatest risks for EB-770M and EB-600M sediments, lower risks for sediments from EB-90M and Schoolhouse Brook, and no risk of metal toxicity (that is, negative index values) for sediments from OR-23200M and all reference sites. ESB indices for sediment from EB-600M exceeded the USEPA (2005) benchmark for probable toxicity (3,000 µmol/gOC). Other sediments collected from the mining-affected reach of Ely and Schoolhouse Brooks fell into the range of uncertain toxicity (130–3,000 µmol/gOC).

64 Aquatic Assessment of the Ely Copper Mine Superfund Site, Vershire, Vermont
Table 11. Summary of the concentration, hazard quotient, and hazard index for select constituents in pore waters at sampling locations in the Ely Mine study area, Vershire, VT, August and September 2006. Refer to table 1 and figure 1 for site names, station numbers, and locations.
[in situ, in situ pore water; centri., centrifuge pore water; equil., equilibrated pore water; µg/L, micrograms per liter; mg/L, milligrams per liter; <, analyte not detected at the reporting level; ins, insufficent sample; —, not determined]
Stream andlocation
Concentration (µg/L)Concentration (mg/L CaCO3)
Cadmium Copper Nickel Lead Zinc Hardness
in situ centri. equil. in situ centri. equil. in situ centri. equil. in situ centri. equil. in situ centri. equil. in situ centri. equil.
Ely Brook EB-1080M <0.02 1.66 0.11 2.4 10.2 4.3 0.6 1.4 1.7 0.06 0.91 <0.05 1.5 29.2 1.6 36 80 200 EB-770M 0.28 1.25 1.95 27.4 43.4 106 4.3 12.6 20 0.2 <0.05 <0.05 25.1 50 114 46 102 178 EB-600M 0.3 0.34 0.59 42.7 108 59.6 4 3.9 4.5 <0.05 0.08 <0.05 31.6 24.8 26 45 52 67 EB-90M 1.85 2.87 2.62 1,800 2,140 1,700 17.4 31.1 39 1.9 1.2 1.7 314 514 616 73 108 103Schoolhouse Brook SB-3670M <0.02 0.04 0.04 <0.5 1 2.9 <0.4 2.4 4.1 0.06 0.1 0.1 1.9 3.8 4.4 111 172 278 SB-2400M 0.08 0.15 0.3 7.9 16.8 22.8 0.5 2.9 2.6 <0.05 0.1 0.05 3 6.4 4.9 130 197 252 SB-1360M 0.05 0.17 0.27 9.6 18.1 24.9 0.8 2.2 2.2 0.2 0.09 <0.05 149 6 7 94 143 257 SB-140M 0.04 0.22 0.4 5.6 8.5 21.6 0.6 2.6 2.2 0.2 0.1 0.1 8 5.3 7.4 108 178 276Ompompanoosuc River OR-24050M <0.02 ins 0.04 0.56 ins 1.6 0.4 ins 3.8 <0.05 ins 0.09 3.8 ins 2.4 141 188 374 OR-23200M 0.06 0.19 0.09 4.5 14.2 19.1 0.8 2.8 2.2 0.3 0.09 0.2 2.9 3.4 5.7 96 187 234
Hazard quotient Hazard index
Ely Brook EB-1080M — 7.9 0.3 0.6 1.4 0.3 0.0 0.0 0.0 0.1 0.5 — 0.6 0.0 0.1 1.3 9.7 0.7 EB-770M 2.0 5.0 5.3 6.0 4.8 7.2 0.2 0.2 0.2 0.2 — — 0.8 0.9 0.2 9.2 11.0 12.9 EB-600M 2.1 2.2 3.2 9.4 20.9 9.4 0.2 0.1 0.1 — 0.1 — 0.4 0.4 3.7 12.0 23.7 16.4 EB-90M 9.3 11.1 10.4 262.2 223.9 185.2 0.4 0.6 0.7 1.1 0.4 0.7 5.7 4.9 0.0 278.7 240.8 197.0Schoolhouse Brook SB-3670M — 0.1 0.1 — 0.1 0.1 — 0.0 0.0 0.0 0.0 0.0 0.0 0.0 0.0 0.0 0.3 0.3 SB-2400M 0.3 0.4 0.6 0.7 1.0 1.2 0.0 0.0 0.0 — 0.0 0.0 0.0 0.0 0.6 1.0 1.5 2.4 SB-1360M 0.2 0.5 0.6 1.1 1.5 1.2 0.0 0.0 0.0 0.1 0.0 — 0.1 0.0 0.0 1.5 2.1 1.9 SB-140M 0.2 0.6 0.8 0.6 0.6 1.0 0.0 0.0 0.0 0.1 0.0 0.0 0.0 0.0 0.0 0.9 1.3 1.9Ompompanoosuc River OR-24050M — — 0.1 0.0 — 0.1 0.0 — 0.0 — — 0.0 — 0.0 0.0 0.0 0.0 0.2 OR-23200M 0.3 0.5 0.2 0.5 0.9 1.0 0.0 0.0 0.0 0.1 0.0 0.0 0.0 0.0 0.0 0.9 1.5 1.3

Discussion 65
0.01
0.1
1
10
100
1,000
10,000
0 10 20 30 40 50 60 70 80 90
HB reference
HB Ely Brook
HB Schoolhouse Brook
HB Ompompanoosuc River
BLM reference
BLM Ely Brook
BLM Schoolhouse Brook
BLM Ompompanoosuc River
Explanation
RTH TAXA
HAZA
RD Q
UOTI
ENT
Figure 24. Chronic copper water-quality criteria for surface water based on hardness (HB) (U.S. Environmental Protection Agency, 2006) and the Biotic Ligand Model (BLM) (USEPA, 2007) with the number of riffle-targeted habitat (RTH) taxa.
0.1
1
10
100
1,000
10,000
PEC quotientsESB index (µmol/gOC)Pore-water toxic units
* * * *
TOXI
CITY
RIS
K IN
DEX
(background sites)
Explanation
EB-1080
M
SB-3670
M
OR-2405
0M
EB-600M
EB-90M
EB-770M
SB-2400
M
SB-1360
M
SB-140M
SB-140M
-R
OR-2320
0M
Figure 25. Three indices of metal toxicity risks for instream sediments from the Ely Mine site, August 2006. The probable effects concentration (PEC) quotients are sums of total sediment metal concentration divided by probable effect concentration (MacDonald and others, 2000). The equilibrium-partitioning sediment benchmark (ESB) index is the difference between the sum of the concentration of simultaneously extractable metals and the acid volatile sulfide concentration, both expressed as micromoles per kilogram of sediment, divided by the fraction of total organic carbon (OC) on a mass basis [ΣSEM-AVS/fOC] (USEPA, 2005). Toxic units are sums of pore-water metal concentration divided by water-quality criterion (U.S. Environmental Protection Agency, 2004). Asterisks indicate values less than zero. Sample SB-140M-R is a lab replicate of SB-140M.
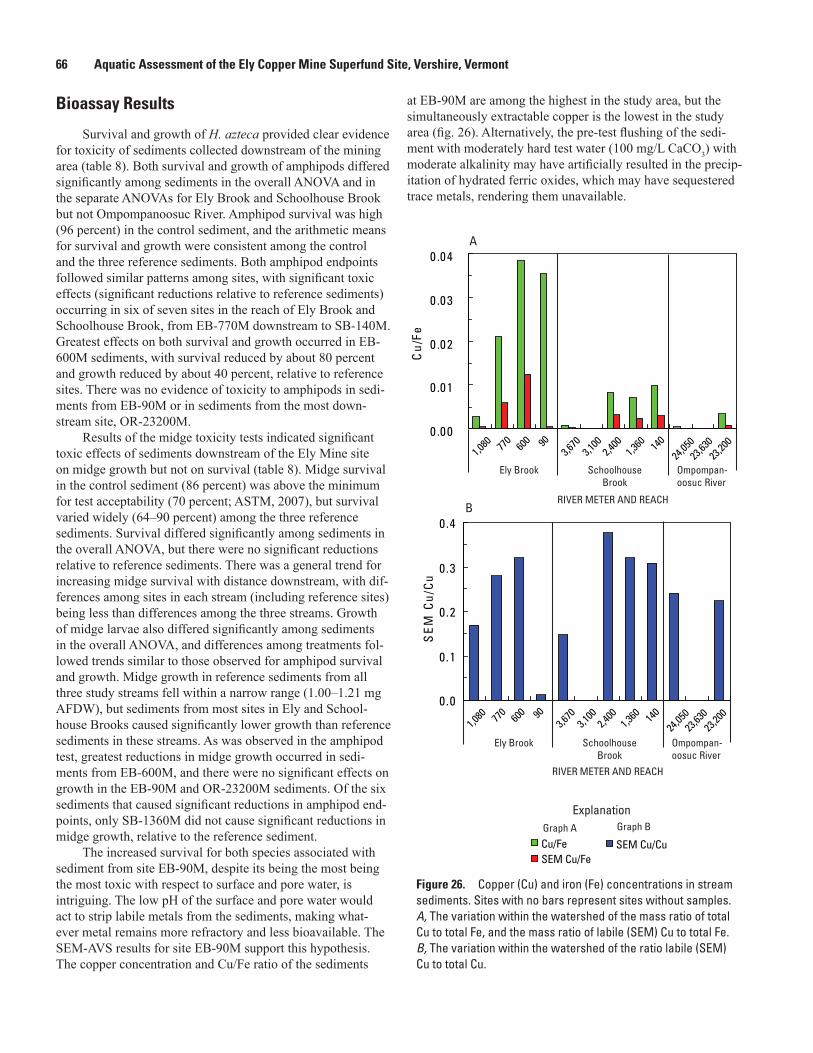
66 Aquatic Assessment of the Ely Copper Mine Superfund Site, Vershire, Vermont
Bioassay Results
Survival and growth of H. azteca provided clear evidence for toxicity of sediments collected downstream of the mining area (table 8). Both survival and growth of amphipods differed significantly among sediments in the overall ANOVA and in the separate ANOVAs for Ely Brook and Schoolhouse Brook but not Ompompanoosuc River. Amphipod survival was high (96 percent) in the control sediment, and the arithmetic means for survival and growth were consistent among the control and the three reference sediments. Both amphipod endpoints followed similar patterns among sites, with significant toxic effects (significant reductions relative to reference sediments) occurring in six of seven sites in the reach of Ely Brook and Schoolhouse Brook, from EB-770M downstream to SB-140M. Greatest effects on both survival and growth occurred in EB-600M sediments, with survival reduced by about 80 percent and growth reduced by about 40 percent, relative to reference sites. There was no evidence of toxicity to amphipods in sedi-ments from EB-90M or in sediments from the most down-stream site, OR-23200M.
Results of the midge toxicity tests indicated significant toxic effects of sediments downstream of the Ely Mine site on midge growth but not on survival (table 8). Midge survival in the control sediment (86 percent) was above the minimum for test acceptability (70 percent; ASTM, 2007), but survival varied widely (64–90 percent) among the three reference sediments. Survival differed significantly among sediments in the overall ANOVA, but there were no significant reductions relative to reference sediments. There was a general trend for increasing midge survival with distance downstream, with dif-ferences among sites in each stream (including reference sites) being less than differences among the three streams. Growth of midge larvae also differed significantly among sediments in the overall ANOVA, and differences among treatments fol-lowed trends similar to those observed for amphipod survival and growth. Midge growth in reference sediments from all three study streams fell within a narrow range (1.00–1.21 mg AFDW), but sediments from most sites in Ely and School-house Brooks caused significantly lower growth than reference sediments in these streams. As was observed in the amphipod test, greatest reductions in midge growth occurred in sedi-ments from EB-600M, and there were no significant effects on growth in the EB-90M and OR-23200M sediments. Of the six sediments that caused significant reductions in amphipod end-points, only SB-1360M did not cause significant reductions in midge growth, relative to the reference sediment.
The increased survival for both species associated with sediment from site EB-90M, despite its being the most being the most toxic with respect to surface and pore water, is intriguing. The low pH of the surface and pore water would act to strip labile metals from the sediments, making what-ever metal remains more refractory and less bioavailable. The SEM-AVS results for site EB-90M support this hypothesis. The copper concentration and Cu/Fe ratio of the sediments
at EB-90M are among the highest in the study area, but the simultaneously extractable copper is the lowest in the study area (fig. 26). Alternatively, the pre-test flushing of the sedi-ment with moderately hard test water (100 mg/L CaCO3) with moderate alkalinity may have artificially resulted in the precip-itation of hydrated ferric oxides, which may have sequestered trace metals, rendering them unavailable.
0 .00
0 .01
0 .02
0 .03
0 .04
Cu/
Fe
Cu/FeSEM Cu/Fe
0.0
0.1
0.2
0.3
0.4
SE
M C
u/C
u
SEM Cu/Cu
ExplanationGraph A Graph B
B
A
Ely Brook Schoolhouse Brook
Ompompan-oosuc River
1,080 60
0 903,6
703,1
002,4
001,3
60 140
24,05
023
,63023
,20077
0
RIVER METER AND REACH
Ely Brook Schoolhouse Brook
Ompompan-oosuc River
1,080 60
0 903,6
703,1
002,4
001,3
60 140
24,05
023
,63023
,20077
0
RIVER METER AND REACH
Figure 26. Copper (Cu) and iron (Fe) concentrations in stream sediments. Sites with no bars represent sites without samples. A, The variation within the watershed of the mass ratio of total Cu to total Fe, and the mass ratio of labile (SEM) Cu to total Fe. B, The variation within the watershed of the ratio labile (SEM) Cu to total Cu.

Discussion 67
Ecological Indicators
The results of this study strongly indicated that the waterways that were investigated were impaired by acid-mine drainage from the Ely Mine site. Values of invertebrate abun-dance and richness were highest at reference sites, which were located above acid-rock drainage inflow for all waterways: Ely Brook, Ely ponds, Schoolhouse Brook, and Ompompanoosuc River. Fish IBI scores followed the same trend except in the Ompompanoosuc River, where the scores were as high as the reference-site IBI score. The extent of impairment to inver-tebrates and fish also appeared to be related to the HI values derived from the surface-water and pore-water samples.
Surface-water HI values were less than 1.0 at all refer-ence sites for all streams, and an increase in the HI values cor-responded to an increase in impairment (lower abundance and richness in RTH samples). The Ompompanoosuc River site downstream from the confluence of Schoolhouse Brook (OR-23630) was one of only two non-reference sites for a stream that had a surface-water HI value below 1.0; RTH taxa rich-ness was only slightly lower than the reference (OR-24050), and the site was not categorized as impaired by VTDEC. The QMH invertebrate data from the ponds also indicated that impairment was related to the surface-water HIs. Although the HI at pond 2 was 1.6, impairment was relatively minor com-pared to pond 4, which had substantially lower invertebrate abundance and richness values, and the HI was 5.6.
Pore-water HIs were also less than 1.0 at all reference sites except for the in situ and centrifuged samples at EB-1080M. Impairment to the RTH invertebrate assemblages in Ely Brook strongly corresponded to a very large increase in the HIs downstream of the reference (HI from 1.3 to 279). However, severe impairment to the DTH invertebrate assem-blages also occurred in Schoolhouse Brook downstream from the confluence with Ely Brook, although the pore-water HI was only 1 at the first site downstream from the conflu-ence of Ely Brook that was sampled for DTH invertebrate assemblages (SB-2400M), although this was not the site immediately below the confluence (SB-3100M). This stream was characterized as high gradient, and there were only a few depositional areas from which to collect samples. These areas were typically small and the depositional material most likely transient in its placement. Therefore, the DTH inver-tebrate assemblages are probably affected by surface-water flows and contamination as well as pore-water contamination. Such interactions are also likely throughout the water bod-ies affected by acid-rock drainage, where a certain amount of residual toxicity in the sediments affects invertebrate assem-blages, but toxicity would increase during storm events as contaminant concentrations increase in the overlying surface waters. Furthermore, this interaction would be most pro-nounced nearer the source of contamination because contami-nants in surface water would be diluted farther downstream as additional water is added from the increasing area of the drainage basin.
To determine the extent of impairment to streams affected by Ely Mine, the VTDEC has made biological assessments to Ely Brook and Schoolhouse Brook for two decades and to the Ompompanoosuc River since 2001 (VTDEC, 2008). These assessments have been based on the fish and macroinvertebrate assemblages (for example, RTH) similar to the surveys con-ducted for this report, and the results are directly comparable (table 9). Ely Brook was first assessed as “poor” in 1987, based on the invertebrate assemblage surveyed that year at a site that corresponds to EB-90M from this study. Using the RTH invertebrate data from this study, VTDEC assessed the four Ely Brook sites below the acid-rock drainage inflow as “poor” and the site above the acid-rock drainage inflow as “very good to good.” The VTDEC also made determinations of whether stream segments were supporting of aquatic life for Class B waters in Vermont, and only the segment above acid-rock drainage inflow was supporting for Ely Brook.
Surveys of fish, invertebrates, or both have occurred at sites along Schoolhouse Brook in 1987, 1988, 1997, 2000, 2001, and for this study in 2006 (table 12). Assessments based on fish assemblages have ranged from “good” to “excellent” at sites above acid-rock drainage inflow (that is, Ely Brook con-fluence), and “poor” for sites below acid-rock drainage inflow except for a “fair” assessment for the most downstream site for 2006, based on the fish survey from this study. Invertebrate assemblages in Schoolhouse Brook were assessed as “good” to “excellent” at two sites above acid-rock drainage inflow, and consistently “poor” at sites below acid-rock drainage inflow. The aquatic-life use determination by VTDEC was that the segment of Schoolhouse Brook above acid-rock drainage inflow was supporting for Class B waters but that the entire section below acid-rock drainage was non-supporting.
Surveys of fish in the Ompompanoosuc River were conducted in 2001, 2002, 2006, and 2007, and invertebrate assemblages were surveyed in 2005 and 2006 (table 12). Data from the 2006 and 2007 surveys were collected for this study. Assessments based on fish assemblages were either “good” or “very good” upstream of acid-rock drainage inflow (that is, Schoolhouse Brook confluence) but were either “poor” or “good” below the acid-rock drainage inflow. Only in this seg-ment of the Ompompanoosuc River (below the confluence with Schoolhouse Brook) was there any variation in the assessment over time, which may have been caused by acid-rock drainage or by other factors. From the data collected for this study, the difference in the 2006 and 2007 “poor” and “good” assess-ments, respectively, was based on fewer fish collected and not a difference in assemblage structure. Lower abundance could be a result of contamination but also a result of less habitat struc-ture or low capturing efficiency during the sampling effort. In 2002, the VTDEC made an assessment of “poor” based on a fish survey at a site about 3 km below the Schoolhouse Brook confluence. However, the VTDEC had conducted a fish survey at a site about 6 km farther downstream; this site was assessed as “good” and had an IBI score (35) that exceeded the Ompom-panoosuc reference site score (33).

68 Aquatic Assessment of the Ely Copper Mine Superfund Site, Vershire, Vermont
The invertebrate assemblages at the Ompompanoosuc River reference site were surveyed only once (data from this study) but were assessed as “excellent” to “very good.” Down-stream from the acid-rock drainage inflow, the assessments were slightly downgraded to “good,” based on the 2006 data for this study, but “very good” for a 2005 invertebrate survey at a site about 13.5 km downstream from Schoolhouse Brook. Com-prehensively, the results from the fish and invertebrate surveys on the Ompompanoosuc River indicate that there may be some degree of impairment to the river from acid-rock drainage.
The indication of a slight increase in the impairment at site OR-23200M, even compared to site OR-23630 (immediately below Schoolhouse Brook), was supported by the HI values for surface water; of the three Ompompanoosuc River sites in this study, the HI exceeded 1.0 only at site OR-23200M. However, if acid-rock drainage is responsible for any degree of impairment to bio-logical assemblages in the Ompompanoosuc River, they were relatively minor; the determination by VTDEC was that the segments upstream and downstream from the acid-rock drainage inflow were all supporting of Class B waters (table 12).
Table 12. Summary of the aquatic-life use (ALU) assessments for streams associated with the Ely Mine site.
[The assessments were derived by the State of Vermont (VTDEC) with data from this study (dates in red font) and from previous studies (VTDEC, 2008). Note that VTDEC uses river mile to designate site locations. The designation “ARD inflow” indicates the relative location along the stream where acid-rock drainage affects water quality. For the fish index of biotic integrity (IBI) scores, MW or CW next to the value indicates a mixed water or cold water index, respectively, was used for the assessment. The ALU determination (last column) indicates whether or not the stream is supporting of Class B waters in Vermont, based on the assessments of fish and invertebrate assemblages]
VTDEC site
(river mile)
USGS sitedesignation
Fish surveydate
Fishassess-
ment
Fish IBI score
Invertebratesurvey date
Invertebrateassessment
Inverte-brate
densitya
Inverte-brate
richnessa
ALUdetermination
Ely Brook (Schoolhouse Brook Tributary 3)—small high-gradient stream (SHG)0.9 EB-1080M 09-06-2006 Very good/Good 1,744 40 Supporting→ARD inflow ~~~~~~~~~~~~~~~~~~~~~~~~~~~~~~~~~~~~~~~~~~~~~~~~~~~~~~~~~~~~~~~~~~~~~~~~~~~~~~~~~~~~~~0.7 EB-770M 09-06-2006 Poor 8 7 Non-supporting0.4 EB-600M 09-06-2006 Poor 37 11 Non-supporting
0.1 EB-90M09-06-2006 Poor 38 3
Non-supporting09-30-1987 Poor 1 1
Schoolhouse Brook—small high-gradient stream (SHG)2.4 SB-3670M 09-13-2006 Excellent 42 CW 09-06-1006 Good 3,440 48 Supporting
2.309-19-2000 Excellent 45 CW 10-25-2001 Excellent 1,175 44 Supporting09-10-1997 Very Good 39 CW 09-10-1997 Excellent 574 4507-08-1988 Good 33 CW 09-30-1987 Excellent 224 42
→ ARD inflow ~~~~~~~~~~~~~~~~~~~~~~~~~~~~~~~~~~~~~~~~~~~~~~~~~~~~~~~~~~~~~~~~~~~~~~~~~~~~~~~~~~~~~~2.2 SB-3100M 09-13-2006 Poor 9 CW 09-06-2006 Poor 25 12 Non-supporting
09-19-2000 Poor 9 CW 10-25-2001 Poor 14 809-10-1997 Poor 9 CW 09-10-1997 Poor 29 1307-07-1988 Poor 9 CW 09-30-1987 Poor 8 6
1.7 SB-2400M 09-13-2006 Poor 9 CW 09-06-2006 Poor 96 12 Non-supporting1.0 SB-1360M 09-13-2006 Poor 18 CW 09-06-2006 Poor 73 13 Non-supporting0.4 10-25-2001 Poor 9 MW 10-25-2001 Poor 82 18 Non-supporting
09-30-1987 Poor 3 3 Non-supporting0.2 SB-140M 09-13-2006 Fair 29 MW 09-06-2006 Poor 274 17 Non-supporting
Ompompanoosuc River—medium-gradient stream (MHG)16.1 OR-24050M 10-25-2001 Very Good 37 MW Supporting
09-12-2006 Good 33 MW 09/06/2006 Excellent/Very good 2,862 69→ ARD inflow ~~~~~~~~~~~~~~~~~~~~~~~~~~~~~~~~~~~~~~~~~~~~~~~~~~~~~~~~~~~~~~~~~~~~~~~~~~~~~~~~~~~~~~
15.9 OR-23630M 09-12-2006 Good 33 MW 09/06/2006 Good 3,114 63 Supporting15.6 OR-23200M 09-12-2006 Poor 9 MW 09/06/2006 Good 1,920 48 Supporting
09-11-2007 Good 33 MW13.8 07-11-2002 Poor 9 MW10.1 09-11-2001 Good 35 MW Supporting
7.3 09-26-2005 Very good 1,325 46 Supportinga Invertebrate density and richness values that are based on data from this study (dates shown in red font) are shown here as lower than abundance and rich-
ness values in table 9 in some cases. This difference occurs because VTDEC does not include all taxa in deriving metrics used for biological assessments.
Discussion 69
Comparison of Aquatic Ecosystem Health Indicators
The geochemical data for surface waters and sediments, along with toxicity testing data, and ecological data all provide a reasonably consistent assessment of downstream aquatic ecosystem impairment related to the Ely Mine and are sum-marized in table 13 for the stream habitat and table 14 for the pond habitat. The results provide strong evidence that acidity and metals from the Ely Mine site have contaminated surface waters and sediments in Ely and Schoolhouse Brooks, leading to toxic effects on fish and benthic invertebrates. Analyses of metal concentration in surface waters, sediment, and pore water indicated that toxicity risks downstream of the Ely Mine site were driven primarily by high copper concentrations in all media, although other metals (Al, Cd, Cr, Fe, Ni, Pb, and Zn) may have contributed locally to toxicity.
In terms of surface water, there are essentially no dif-ferences in the reaches exceeding acute and chronic water-quality criteria with the exception of site OR-23200M, which exceeds the chronic but not acute criterion. Surface-water toxicity tests showed identical impairment throughout Ely Brook and Schoolhouse Brook. Riffle-habitat invertebrates downstream of reference sites in Ely Brook and Schoolhouse Brook showed significant decreases in both the number of taxa and the number of individuals. Riffle-habitat invertebrates in the Ompompanoosuc River showed no significant differ-ences above or below the confluence with Schoolhouse Brook. For the fish community, similar results were found. The IBI showed significant impairment in Schoolhouse Brook down-stream of Ely Brook, but no variation was observed in the Ompompanoosuc River.
Locally significant differences in the level of predicted copper toxicity are found when comparing water-quality stan-dards calculated on the basis of the hardness-based criterion for copper relative to those calculated using the Biotic Ligand Model (fig. 24). The hardness-based criteria suggest signifi-cant, but lower, toxicity in the Ely Brook watershed, similar toxicity in Schoolhouse Brook, and slightly higher toxicity in the Ompompanoosuc River compared to the Biotic Ligand Model criteria. Nevertheless, both approaches identify similar reaches of impairment, which are consistent with ecological indicators such as the number of riffle-habitat invertebrate taxa present (fig. 24).
Indicators of surface-water quality in the ponds along tributary 2 to Ely Brook were consistent. Ponds with impaired water quality exceeded both the acute and chronic criteria (ponds 4, 5, and 6), whereas pond 2 only minimally exceeded the chronic criterion (HQ = 1.1). Qualitative multi-habitat measures of the number of taxa and the number of individu-als showed systematic decreases relative to the reference site (pond 1).
Results of the whole-sediment toxicity tests for Ely Brook, Schoolhouse Brook, and the Ompompanoosuc River were generally consistent with other measures of biological impacts of sediment and pore water of streams draining the
Ely Mine site. Copper concentrations in sediments indicate impairment relative to probable effects concentrations at all sites in Ely Brook and Schoolhouse Brook, except the refer-ence sites. In contrast, partitioning sediment benchmarks predict no toxicity at the reference sites and in the Ompom-panoosuc River and uncertain toxicity at all others sites in Ely Brook and Schoolhouse Brook, except site EB-600M for which toxicity is predicted.
Acute toxicity tests conducted by the USEPA with pore waters sampled in situ at the time of whole sediment sampling indicated acute lethal effects on amphipods in pore waters from Ely Brook (including 100 percent lethality in EB-90M pore waters), where our test indicated no chronic toxicity, but the acute tests indicated no toxic effects of pore water from Schoolhouse Brook, where our chronic, whole-sediment tests found effects on both amphipods and midges (fig. 25). These differences may be due to two separate factors. The differ-ences may reflect the greater sensitivity of the chronic tests, and they may also be due to an apparent loss of toxicity due to the neutralization of acidic EB-90M pore waters as an artifact of the chronic test protocol. Results of both sets of toxicity tests are consistent with surveys of resident benthic inverte-brates at these study sites, which demonstrated severe effects on communities at sites downgradient of mining in Ely Brook and lesser effects in the Schoolhouse Brook study reach.
Significant toxic effects on amphipods (reduced sur-vival and growth) and midges (reduced survival) occurred in sediments from Ely Brook. These toxic effects persisted throughout the reach of Schoolhouse Brook downstream of the confluence of Ely Brook, but there was no evidence of sedi-ment toxicity in the Ompompanoosuc River downstream of the confluence of Schoolhouse Brook. Midge survival did not indicate significant toxic effects of these sediments, consistent with previous studies with metal-contaminated sediments that have reported that amphipod survival and midge growth are more sensitive endpoints than midge survival (Phipps and oth-ers, 1995; Besser and others, 2008). Within the affected reach, all sediment samples caused significant reductions of all three sensitive endpoints (relative to reference sites) except sedi-ments from EB-90M, which were not toxic to either amphi-pods or midges, and sediments from SB-1360M, which were toxic to amphipods but not to midges (table 8).
The absence of toxic effects of the EB-90M sediment is remarkable, given the high total copper concentrations in this sediment and the high concentration of copper in the pore water. The lack of toxicity in the laboratory test with EB-90M sediments is probably related to the very acidic pH (2.9–3.2) of surface and pore waters collected from this site. The small fraction of total copper recovered in the SEM frac-tion (1.1 percent of total copper) suggests that almost all labile copper had been leached from the EB-90M sediment and that the high copper concentrations in EB-90M pore water origi-nated from contaminated surface water or groundwater mov-ing downgradient into the EB-90M sediments. Labile copper in the stream sediments is likely sorbed onto hydrated ferric hydroxides, which is strongly dependent upon pH. Below a

70 Aquatic Assessment of the Ely Copper Mine Superfund Site, Vershire, VermontTa
ble
13.
Sum
mar
y of
geo
chem
ical
and
bio
logi
cal i
ndic
ator
s of
stre
am h
ealth
in th
e El
y M
ine
stud
y ar
ea, V
ersh
ire, V
T, J
une
to S
epte
mbe
r 200
6.[A
WQ
C, a
mbi
ent w
ater
-qua
lity
crite
ria; H
Q, h
azar
d qu
otie
nt; B
LM, B
iotic
Lig
and
Mod
el; R
TH, r
iffle-
targ
eted
hab
itat;
DH
T, d
epos
ition
al-ta
rget
ed h
abita
t; IB
I, fis
h as
sem
blag
e in
dex
of b
iotic
inte
grity
; PEC
, pro
babl
e ef
fect
s con
cent
ratio
n; S
EM, s
imul
tane
ously
ext
ract
able
met
als;
AVS,
aci
d vo
latil
e su
lfide
; fO
C, conc
entra
tion
of o
rgan
ic c
arbo
n; N
A, n
ot a
pplic
able
; —, n
ot d
eter
min
ed; <
, ana
lyte
not
det
ecte
d at
repo
rting
leve
l; Pi
nk c
ells
in
dica
te u
nifo
rmly
impa
ired
cond
ition
s, gr
een
cells
indi
cate
uni
mpa
ired
cond
ition
s, ye
llow
cel
ls in
dica
te u
ncer
tain
leve
l of i
mpa
irmen
t, w
hite
cel
ls in
dica
te th
at n
o cr
iteria
wer
e av
aila
ble
for c
ompa
rison
or t
hat t
he
QA
/QC
for t
he te
st fa
iled]
Site
ID fo
r var
ious
stu
dies
Ely
Bro
okSc
hool
hous
e B
rook
Om
pom
pano
osuc
Riv
erU
SGS
wat
er ID
(Aug
ust 2
006)
EB-1
080M
EB-7
70M
EB-6
00M
EB-9
0MSB
-367
0MSB
-312
5MSB
-240
0MSB
-136
0MSB
-140
MO
R-2
4050
MO
R-2
3630
MO
R-2
3200
MU
SEPA
surfa
ce-w
ater
toxi
city
test
ID
(Jun
e 20
06)
——
—EM
TT-3
EMTT
-4EM
TT-5
EMTT
-6EM
TT-7
——
—EM
MT-
8—
——
USG
S se
dim
ent t
oxic
ity te
st ID
(Aug
ust 2
006)
EB (r
ef)
EB2
EB3
EB4
SB1(
ref)
——
—SB
3SB
4SB
5a—
OR
1(re
f)—
OR
3U
SEPA
por
e-w
ater
toxi
city
test
ID
(Aug
ust 2
006)
—EB
2EB
3EB
4SB
1(re
f)—
——
SB3
SB4
SB5a
——
—O
MP3
Surf
ace-
wat
er q
ualit
y in
dica
tors
Surf
ace-
wat
er c
hem
istry
HQ
for C
u, c
om-
pare
d to
chr
onic
har
dnes
s-ba
sed
AWQ
C0.
315
345
222
<0.0
4—
5—
53
3—
0.1
0.4
1.1
Surf
ace-
wat
er c
hem
istry
HQ
for C
u,
com
pare
d to
chr
onic
BLM
AW
QC
0.3
2,23
115
31,
508
<0.0
4—
6—
62
2—
0.1
0.2
0.5
USE
PA su
rfac
e-w
ater
toxi
city
test
, 7-d
ay
surv
ival
, fat
head
min
now
(in
perc
ent)
——
—0
903
1815
——
—48
——
—
USE
PA su
rfac
e-w
ater
toxi
city
test
, 7-d
ay
grow
th, f
athe
ad m
inno
w, a
vera
ge d
ry
biom
ass (
in m
illig
ram
s)
——
—0.
000.
390.
000.
030.
02—
——
0.10
——
—
RTH
taxa
437
123
56—
12—
1415
25—
8478
51IB
I—
——
—42
—9
—9
1829
—33
339
(hab
itat?
)Su
mm
ary
asse
ssm
ent b
ased
on
su
rfac
e-w
ater
qua
lity
indi
cato
rsgo
odim
pact
edim
pact
edim
pact
edgo
odim
pact
edim
pact
edim
pact
edim
pact
edim
pact
edim
pact
edim
pact
edgo
odun
certa
inun
certa
in
Sedi
men
t-qu
ality
indi
cato
rsB
ulk
sedi
men
t che
mis
try H
Q fo
r Cu,
co
mpa
red
to P
EC0.
58
1840
0.1
——
—1
12
—0.
03—
0.5
(SEM
- AV
S)/f O
C–6
296
36,
050
213
–161
——
—31
728
131
9—
–139
—–9
5B
enth
ic D
TH ta
xa34
74
430
——
—14
621
—21
—17
Sedi
men
t tox
icity
test
, 28-
day
surv
ival
, H
yale
ala
azte
ca (i
n pe
rcen
t)94
696
9194
——
—53
6453
, 69a
—94
—91
Sedi
men
t tox
icity
test
, 28-
day
grow
th,
Hya
lella
azt
eca
(in m
illim
eter
s)3.
242.
451.
963.
393.
31—
——
2.43
2.53
2.55
, 2.4
8—
3.21
—3.
17
Sedi
men
t tox
icity
test
, 10-
day
surv
ival
, C
hiro
nom
us d
ilutu
s (in
per
cent
)64
6165
7376
——
—80
6368
, 84
—90
—84
Sedi
men
t tox
icity
test
, 10-
day
grow
th,
Chi
rono
mus
dilu
tus,
ash-
free
dry
wei
ght
(in m
illig
ram
s)
1.21
0.61
0.28
1.73
1.00
——
—0.
781.
280.
81, 0
.59
—1.
06—
0.96
Cop
per S
EM (i
n m
icro
mol
es p
er g
ram
)0.
25.
413
.81.
1<0
.024
——
—0.
99—
1.2
—<0
.017
—0.
27In
situ
por
e-w
ater
toxi
city
test
, 96-
hour
sur-
viva
l, H
yale
lla a
ztec
a (in
per
cent
)—
4010
085
——
—10
085
85—
——
90
In si
tu p
ore-
wat
er to
xici
ty te
st, 9
6-ho
ur su
r-vi
val,
Chi
rono
mus
tent
ans (
in p
erce
nt)
—10
010
050
100
——
—90
100
90—
——
100
In si
tu p
ore-
wat
er c
hem
istry
HQ
for C
u, c
om-
pare
d to
chr
onic
har
dnes
s-ba
sed
AWQ
C0.
66
926
2<0
.04
——
—0.
71.
11.
6—
0—
0.5
Cen
trifu
ged
pore
-wat
er c
hem
istry
HQ
fo
r Cu,
com
pare
d to
chr
onic
har
dnes
s-ba
sed
AWQ
C
1.4
521
224
0.1
——
—1.
01.
50.
6—
——
0.9
Equi
libra
ted
pore
-wat
er c
hem
istry
HQ
fo
r Cu,
com
pare
d to
chr
onic
har
dnes
s-ba
sed
AWQ
C
0.3
79
185
0.1
——
—1.
21.
21.
0—
0.1
—1.
0
Sum
mar
y as
sess
men
t bas
ed o
n
sedi
men
t-qu
ality
indi
cato
rsgo
odim
pact
edim
pact
edim
pact
edgo
od—
——
unce
rtain
unce
rtain
unce
rtain
—go
od—
unce
rtain
a Sed
imen
t tox
icity
test
ing
cond
ucte
d in
dup
licat
e fo
r thi
s sam
ple.
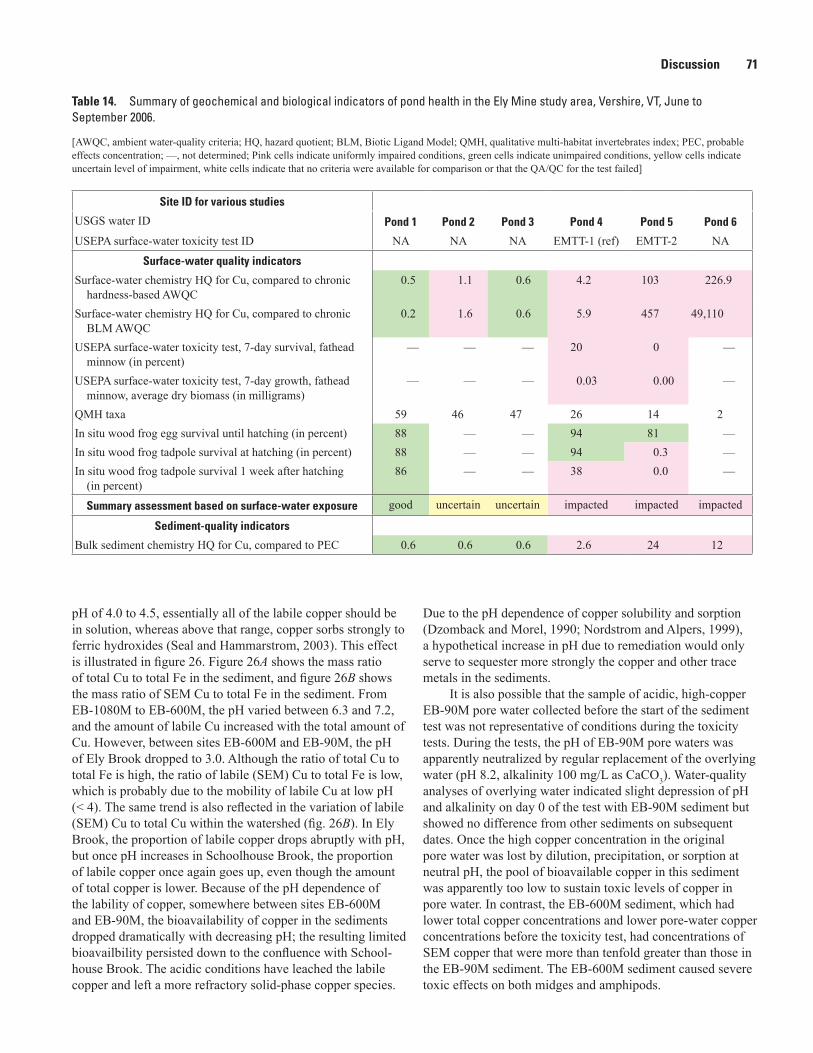
Discussion 71
pH of 4.0 to 4.5, essentially all of the labile copper should be in solution, whereas above that range, copper sorbs strongly to ferric hydroxides (Seal and Hammarstrom, 2003). This effect is illustrated in figure 26. Figure 26A shows the mass ratio of total Cu to total Fe in the sediment, and figure 26B shows the mass ratio of SEM Cu to total Fe in the sediment. From EB-1080M to EB-600M, the pH varied between 6.3 and 7.2, and the amount of labile Cu increased with the total amount of Cu. However, between sites EB-600M and EB-90M, the pH of Ely Brook dropped to 3.0. Although the ratio of total Cu to total Fe is high, the ratio of labile (SEM) Cu to total Fe is low, which is probably due to the mobility of labile Cu at low pH (< 4). The same trend is also reflected in the variation of labile (SEM) Cu to total Cu within the watershed (fig. 26B). In Ely Brook, the proportion of labile copper drops abruptly with pH, but once pH increases in Schoolhouse Brook, the proportion of labile copper once again goes up, even though the amount of total copper is lower. Because of the pH dependence of the lability of copper, somewhere between sites EB-600M and EB-90M, the bioavailability of copper in the sediments dropped dramatically with decreasing pH; the resulting limited bioavailbility persisted down to the confluence with School-house Brook. The acidic conditions have leached the labile copper and left a more refractory solid-phase copper species.
Due to the pH dependence of copper solubility and sorption (Dzomback and Morel, 1990; Nordstrom and Alpers, 1999), a hypothetical increase in pH due to remediation would only serve to sequester more strongly the copper and other trace metals in the sediments.
It is also possible that the sample of acidic, high-copper EB-90M pore water collected before the start of the sediment test was not representative of conditions during the toxicity tests. During the tests, the pH of EB-90M pore waters was apparently neutralized by regular replacement of the overlying water (pH 8.2, alkalinity 100 mg/L as CaCO3). Water-quality analyses of overlying water indicated slight depression of pH and alkalinity on day 0 of the test with EB-90M sediment but showed no difference from other sediments on subsequent dates. Once the high copper concentration in the original pore water was lost by dilution, precipitation, or sorption at neutral pH, the pool of bioavailable copper in this sediment was apparently too low to sustain toxic levels of copper in pore water. In contrast, the EB-600M sediment, which had lower total copper concentrations and lower pore-water copper concentrations before the toxicity test, had concentrations of SEM copper that were more than tenfold greater than those in the EB-90M sediment. The EB-600M sediment caused severe toxic effects on both midges and amphipods.
Table 14. Summary of geochemical and biological indicators of pond health in the Ely Mine study area, Vershire, VT, June to September 2006.
[AWQC, ambient water-quality criteria; HQ, hazard quotient; BLM, Biotic Ligand Model; QMH, qualitative multi-habitat invertebrates index; PEC, probable effects concentration; —, not determined; Pink cells indicate uniformly impaired conditions, green cells indicate unimpaired conditions, yellow cells indicate uncertain level of impairment, white cells indicate that no criteria were available for comparison or that the QA/QC for the test failed]
Site ID for various studies
USGS water ID Pond 1 Pond 2 Pond 3 Pond 4 Pond 5 Pond 6
USEPA surface-water toxicity test ID NA NA NA EMTT-1 (ref) EMTT-2 NA
Surface-water quality indicators
Surface-water chemistry HQ for Cu, compared to chronic hardness-based AWQC
0.5 1.1 0.6 4.2 103 226.9
Surface-water chemistry HQ for Cu, compared to chronic BLM AWQC
0.2 1.6 0.6 5.9 457 49,110
USEPA surface-water toxicity test, 7-day survival, fathead minnow (in percent)
— — — 20 0 —
USEPA surface-water toxicity test, 7-day growth, fathead minnow, average dry biomass (in milligrams)
— — — 0.03 0.00 —
QMH taxa 59 46 47 26 14 2In situ wood frog egg survival until hatching (in percent) 88 — — 94 81 —In situ wood frog tadpole survival at hatching (in percent) 88 — — 94 0.3 —In situ wood frog tadpole survival 1 week after hatching
(in percent)86 — — 38 0.0 —
Summary assessment based on surface-water exposure good uncertain uncertain impacted impacted impacted
Sediment-quality indicators
Bulk sediment chemistry HQ for Cu, compared to PEC 0.6 0.6 0.6 2.6 24 12
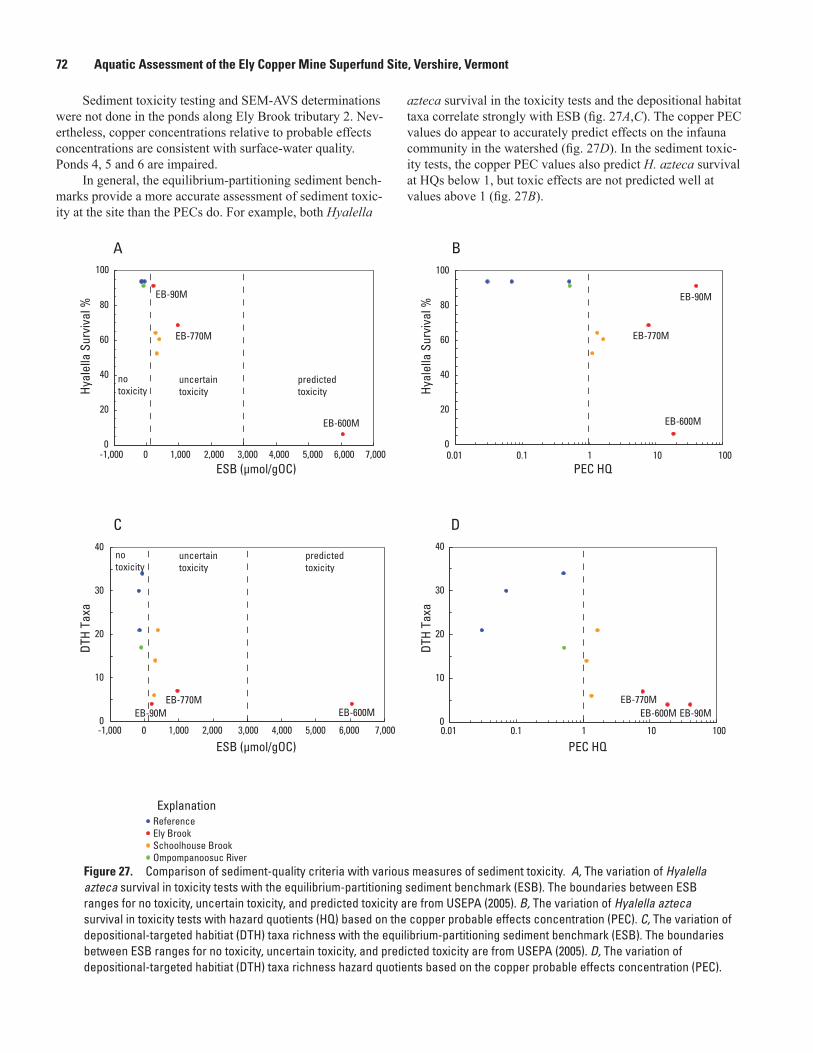
72 Aquatic Assessment of the Ely Copper Mine Superfund Site, Vershire, Vermont
Sediment toxicity testing and SEM-AVS determinations were not done in the ponds along Ely Brook tributary 2. Nev-ertheless, copper concentrations relative to probable effects concentrations are consistent with surface-water quality. Ponds 4, 5 and 6 are impaired.
In general, the equilibrium-partitioning sediment bench-marks provide a more accurate assessment of sediment toxic-ity at the site than the PECs do. For example, both Hyalella
azteca survival in the toxicity tests and the depositional habitat taxa correlate strongly with ESB (fig. 27A,C). The copper PEC values do appear to accurately predict effects on the infauna community in the watershed (fig. 27D). In the sediment toxic-ity tests, the copper PEC values also predict H. azteca survival at HQs below 1, but toxic effects are not predicted well at values above 1 (fig. 27B).
0
20
40
60
80
100
Hyal
ella
Sur
viva
l %
no toxicity
A
EB-90M
EB-90M
0
20
40
60
80
100
PEC HQ
Hyal
ella
Sur
viva
l %
B
Explanation
EB-600M
0
10
20
30
40
ESB (µmol/gOC)
DTH
Taxa
ReferenceEly BrookSchoolhouse BrookOmpompanoosuc River
C
EB-600MEB-770M
EB-90M
EB-600M
EB-770M
EB-90M
EB-770M
EB-770M
0
10
20
30
40
PEC HQ
DTH
Taxa
D
EB-600M
ESB (µmol/gOC)
uncertain toxicity
predicted toxicity
no toxicity
uncertain toxicity
predicted toxicity
0.01 0.1 1 10 100
0.01 0.1 1 10 100
-1,000 0 1,000 2,000 3,000 4,000 5,000 6,000 7,000
-1,000 0 1,000 2,000 3,000 4,000 5,000 6,000 7,000
Figure 27. Comparison of sediment-quality criteria with various measures of sediment toxicity. A, The variation of Hyalella azteca survival in toxicity tests with the equilibrium-partitioning sediment benchmark (ESB). The boundaries between ESB ranges for no toxicity, uncertain toxicity, and predicted toxicity are from USEPA (2005). B, The variation of Hyalella azteca survival in toxicity tests with hazard quotients (HQ) based on the copper probable effects concentration (PEC). C, The variation of depositional-targeted habitiat (DTH) taxa richness with the equilibrium-partitioning sediment benchmark (ESB). The boundaries between ESB ranges for no toxicity, uncertain toxicity, and predicted toxicity are from USEPA (2005). D, The variation of depositional-targeted habitiat (DTH) taxa richness hazard quotients based on the copper probable effects concentration (PEC).
References Cited 73
ConclusionsIn summary, the aquatic ecosystem at the site was
assessed using a variety of approaches that investigated surface-water quality, sediment quality, and various ecological indicators of stream health. The degradation of surface-water quality is dominated by Cu with localized degradation caused by Fe, Al, Cd, and Zn. Chronic water-quality criteria for cop-per are exceeded by four of the six ponds on the Ely Brook tributary, all of Ely Brook and Schoolhouse Brook except for the reference sites, and only the most downstream site on the Ompompanoosuc River. Comparison of hardness-based and Biotic Ligand Model-based water-quality criteria for copper yields similar results with respect to extent of impairment. However, the Biotic Ligand Model criteria are more stringent than the hardness-based criteria and suggest a greater degree of impairment, particularly in the Ely Brook watershed, where dissolved organic carbon concentrations and pH values are lower. Surface-water toxicity testing correlates strongly with the extent of impact. Likewise, riffle-habitat benthic inver-tebrate richness and abundance data support these results through the stream environment. Similarly, the index of biotic integrity for the fish community in Schoolhouse Brook and the Ompompanoosuc River document degraded habitats through-out Schoolhouse Brook from Ely Brook down to the Ompom-panoosuc River.
The sediment environment shows similar extents of impairment dominated by copper, although localized degrada-tion due to Cr, Ni, Pb, and Zn were documented on the basis of probable effects concentrations. In contrast, equilibrium-partitioning sediment benchmarks indicate no toxic effects would be expected in sediments at the reference sites, and uncertain toxic effects expected throughout Ely Brook and Schoolhouse Brook, except for site EB-600M. The results for site EB-600M indicate predicted toxic effects. Acute toxicity testing of in situ pore waters using Hyalella azteca indicates severe impacts in Ely Brook reaching 100 percent lethality at EB-90M. Acute toxicity testing of in situ pore waters using Chironomus dilutus shows similar, but not as severe, toxicity. Neither set of in situ pore-water toxicity tests showed sig-nificant impairment in Schoolhouse Brook or the Ompompa-noosuc River. Chronic sediment toxicity testing using Hyalella azteca indicated significant toxicity in Ely Brook, except at EB-90M, and in Schoolhouse Brook. The low toxicity of EB-90M may be a reflection of the low lability of copper in that sediment, as indicated by a low proportion of extractable cop-per (1.1 percent). Toxicity testing was not done with the pond pore waters or sediments. Depositional habitat invertebrate richness and abundance data support these conclusions, as do the index of biotic integrity data from the fish community.
In general, degraded surface-water quality, particularly from copper, appears to be the dominant cause of toxicity at the site. Sediment quality is less uniformly affected, particu-larly downstream of Ely Brook; however, copper is also the dominant contaminant of concern in this medium.
References Cited
Abbott, Collamer, 1973, Green Mountain copper—The story of Vermont’s red metal: Thetford, VT, Thetford Historical Society, 36 p.
Agency for Toxic Substances and Disease Registry, 2008, Public health assessment—Ely copper mine site, Vershire, VT: Agency for Toxic Substances and Disease Registry, 29 p., 3 apps.
American Society for Testing and Materials, 2007, ASTM E1706-05 Standard—Test method for measuring the toxic-ity of sediment-associated contaminants with freshwater invertebrates: West Conshohocken, PA, ASTM Interna-tional, 118 p.
Arcement, G.J., Jr., and Schneider, V.R., 1989, Guide for selecting Manning’s roughness coefficients for natural chan-nels and flood plains: U.S. Geological Survey Water-Supply Paper 2339, 38 p.
Argue, D.M., Kiah, R.G., Piatak, N.M., Seal, R.R., II, Ham-marstrom, J.M., Hathaway, Edward, and Coles, J.F., 2008, Selected water- and sediment-quality, aquatic biology, and mine-waste data from the Ely Copper Mine Superfund site, Vershire, VT, 1998–2007: U.S. Geological Survey Data Series 378, available online only at http://pubs.usgs.gov/ds/378/
Besser, J.M., Brumbaugh, W.G., Ivey, C.D., Ingersoll, C., and Moran, P.W., 2008, Biological and chemical charac-terization of metal bioavailability in sediments from Lake Roosevelt, Columbia River, Washington, USA: Archives of Environmental Contamination and Toxicology, v. 54, no. 4, p. 557–570.
Buchanan, T.J., and Somers, W.P., 1969, Discharge measure-ments at gaging stations: U.S. Geological Survey Tech-niques of Water-Resources Investigations, book 3, chap. A8, 65 p.
Buerger, N.W., 1935, The copper ores of Orange County, Ver-mont: Economic Geology, v. 30, no. 4, p. 434–443.
Cherau, S.G., Ford, B., and Kierstead, M., 2005, Historical/archaeological mapping and testing—Ely mine site, vol-ume 1: Public Archaeology Laboratory Incorporated Report No. 1386, 434 p.
Crawford, J.K., and Luoma, S.N., 1993, Guidelines for studies of contaminants in biological tissues for the National Water-Quality Assessment Program: U.S. Geological Survey Open-File Report 92–0494, 69 p.

74 Aquatic Assessment of the Ely Copper Mine Superfund Site, Vershire, Vermont
Di Toro, D.M., McGrath, J.M., Hansen, D.J., Berry, W.J., Paquin, P.R., Mathew, R., Wu, K.B., and Santore, R.C., 2005, Predicting sediment metal toxicity using a sediment biotic ligand model—Methodology and initial application: Environmental Toxicology and Chemistry, v. 24, no. 10, p. 2410–2427.
Dzombak, D.A., and Morel, F.M.M., 1990, Surface complex-ation modeling—Hydrous ferric oxide: New York, John Wiley and Sons, 393 p.
Fitzpatrick, F.A., Waite, I.R., D’Arconte, P.J., Meador, M.R., Maupin, M.A., and Gurtz, M.E., 1998, Revised methods for characterizing stream habitat in the National Water-Quality Assessment Program: U.S. Geological Survey Water-Resources Investigations Report 98–4052, 67 p.
Fuller, C.C., and Harvey, J.W., 2000, Reactive uptake of trace metals in the hyporheic zone of a mining-contaminated stream, Pinal Creek, Arizona: Environmental Science and Technology, v. 34, no. 7, p. 1150–1155.
Hammarstrom, J.M., Seal, R.R., II, Meier, A.L., and Jackson, J.C., 2003, Weathering of sulfidic shale and copper mine waste: Secondary minerals and metal cycling in Great Smoky Mountains National Park, Tennessee and North Car-olina, USA: Environmental Geology, v. 45, no. 1, p. 35–57.
Hammarstrom, J.M., Seal, R.R., II, Ouimette, A.P., and Foster, S.A., 2001a, Sources of metals and acidity at the Elizabeth and Ely mines—Geochemistry and mineralogy of solid mine waste and the role of secondary minerals in metal recycling, in Hammarstrom, J.M., and Seal, R.R., II, eds., Environmental geochemistry and mining history of mas-sive sulfide deposits in the Vermont Copper Belt: Society of Economic Geologists Guidebook Series, v. 35, p. 213–248.
Hammarstrom, J.M., Seal, R.R., II, Slack, J.F., Kierstead, M.A., and Hathaway, E.M., 2001b, Field trip days 1 and 2: Road log for the Elizabeth and Ely mines and vicinity, in Hammarstrom, J.M., and Seal, R.R., II, eds., Environmental geochemistry and mining history of massive sulfide deposits in the Vermont Copper Belt: Society of Economic Geolo-gists Guidebook Series, v. 35, p. 119–163.
Harvey, J.W., and Fuller, C.C., 1998, Effect of enhanced manganese oxidation in the hyporheic zone on basin-scale geochemical mass balance: Water Resources Research, v. 34, no. 4, p. 623–636.
Helsel, D.R., 2005, Nondetects and data analysis: Statistics for censored environmental data: New York, John Wiley and Sons, 268 p.
Helsel, D.R., and Cohn, T.A., 1988, Estimation of descriptive statistics for multiply censored water quality data: Water Resources Research, v. 24, no. 12, p. 1997–2004.
Helsel, D.R., and Hirsch, R.M., 1992, Statistical methods in water resources: New York, Elsevier Science Publishers, 522 p.
Hermance, H.P., Neumann, G.L., and Moiser, M., 1949, Inves-tigation of Ely Mine copper deposit, Orange County, Vt.: U.S. Bureau of Mines Report of Investigations 4395, 11 p.
Holmes, J.V., Bigl, S.R., Lawson, D.E., Seal, R.R., and Piatak, N.M., 2002, Spring runoff characterization, Ely Mine, Ver-shire, Vermont, Spring 2002: Hanover, NH, Cold Regions Research and Engineering Laboratory, ERDC/CRREL Let-ter Report LR-02-65.
Ingersoll, C.G., MacDonald, D.D., Wang, N., Crane, J.L., Field, L.J., Haverland, P.S., Kemble, N.E., Lindskoog, R.A., Severn, C., and Smorong, D.E., 2001, Predictions of sedi-ment toxicity using consensus-based freshwater-sediment quality guidelines: Archives of Environmental Contamina-tion and Toxicology, v. 41, no. 1, p. 8–21.
Kiah, R.G., Deacon, J.R., Piatak, N.M., Seal, R.R., II, Coles, J.F., and Hammarstrom, J.M., 2007, Surface-water hydrol-ogy and quality at the Pike Hill Superfund Site, Corinth, Vermont, October 2004 to December 2005: U.S. Geological Survey Scientific Investigations Report 2007–5003, 61 p.
Kierstead, M.A., 2001, History and historical resources of the Vermont Copper Belt, in Hammarstrom, J.M., and Seal, R.R., II, eds., Environmental geochemistry and mining his-tory of massive sulfide deposits in the Vermont Copper Belt: Society of Economic Geologists Guidebook Series, v. 35, p. 165–191.
Kilpatrick, F.A., and Schneider, V.R., 1983, Use of flumes in measuring discharge: U.S. Geological Survey Techniques of Water-Resources Investigations, book 3, chap. A14, 46 p.
Koretsky, C.M., Johnson, R.H., Miller, Douglas, and Ndenga, N.T., 2006, Seasonal variations in pore water and sediment geochemistry of littoral lake sediments (Asylum Lake, MI, USA): Geochemical Transactions, v. 7, no. 11.
Long, E.R., and Chapman, P.M., 1985, A sediment quality triad—Measures of sediment contamination, toxicity and infaunal community composition in Puget Sound: Marine Pollution Bulletin, v. 16, no. 10, p. 405–415.
MacDonald, D.D., Ingersoll, C.G., and Berger, T.A., 2000, Development and evaluation of consensus-based sediment quality guidelines for freshwater ecosystems: Archives of Environmental Contamination and Toxicology, v. 39, no. 1, p. 20–31.
McSurdy, S., Dvorak, D., and Cooper, A., 1995, Ely mine site report of activities—Experimental passive mine water treat-ment system: Pittsburgh, PA, U.S. Bureau of Mines, 51 p.
Moulton, S.R., Kennan, J.G., Goldstein, R.M., and Hambrook, J.A., 2002, Revised protocols for sampling algal, inverte-brate, and fish communities as part of the National Water-Quality Assessment Program: U.S. Geological Survey Open-File Report 02–150, 75 p.
References Cited 75
Nordstrom, D.K., and Alpers, C.N., 1999, Geochemistry of acid mine waters, in Plumlee, G.S., and Logsdon, M.J., eds., The environmental geochemistry of mineral deposits, Part A. Processes, techniques, and health issues: Reviews in Economic Geology, 6A, p. 133–160 (Chapter 6).
Offield, T.W., Slack, J.F., and Wittinbrink, S.A., 1993, Structure and origin of the Ely copper deposit, east-central Vermont: U.S. Geological Survey Bulletin 2039, p. 59–68.
Olson, S.A., Flynn, R.H., Johnston, C.M., and Tasker, G.D., 2005, The New Hampshire Watershed Tool: A geographic information system tool to estimate statistics and ground-water-recharge rates: U.S. Geological Survey Open-File Report 2005–1172, 20 p.
Paquin, P.R., Gorsuch, J.W., Apte, Simon, Batley, G.E., Bowles, K.C., Campbell, P.G.C., Delos, C.G., Di Toro, D.M., Dwyer, R.L., Galvez, Fernando, Gensemer, R.W., Goss, G.G., Hogstrand, Christer, Janssen, C.R., McGeer, J.C., Naddy, R.B., Playle, R.C., Santore, R.C., Schneider, Uwe, Stubblefield, W.A., Wood, C.M., and Wu, K.B., 2002, The biotic ligand model—A historical overview: Compara-tive Biochemistry and Physiology, v. 133, no. 1–2, p. 3–35.
Phipps, G.L., Mattson, V.R., and Ankley, G.T., 1995, Relative sensitivity of three freshwater benthic macroinvertebrates to ten contaminants: Archives of Environmental Contamina-tion and Toxicology, v. 28, no. 3, p. 281–286.
Piatak, N.M., Seal, R.R., II, Hammarstrom, J.M., Meier, A.L., and Briggs, P.H., 2003, Geochemical characteriza-tion of slags, other mine waste, and their leachate from the Elizabeth and Ely mines (Vermont), the Ducktown mining district (Tennessee), and the Clayton smelter site (Idaho): U.S. Geological Survey Open-File Report 2003–260, 53 p.
Piatak, N.M., Hammarstrom, J.M., Seal, R.R., II, Briggs, P.H., Meier, A.L., Muzik, T.L., and Jackson, J.C., 2004, Geo-chemical characterization of mine waste at the Ely copper mine Superfund site, Orange County, Vermont: U.S. Geo-logical Survey Open-File Report 2004–1248, 55 p.
Piatak, N.M., Seal, R.R., II, Hammarstrom, J.M., Kiah, R.G., Deacon, J.R., Adams, Monique, Anthony, M.W., Briggs, P.H., and Jackson, J.C., 2006, Geochemical characteriza-tion of mine waste, mine drainage, and stream sediments at the Pike Hill Copper Mine Superfund Site, Orange County, Vermont: U.S. Geological Survey Scientific Investigations Report 2006–5303, 131 p.
Rantz, S.E., and others, 1982, Measurement and computation of streamflow, volume 1—Measurement of stage and dis-charge: U.S. Geological Survey Water-Supply Paper 2175, 284 p.
SAS Institute, Inc., 1998, Statview user’s guide, version 5: Cary, NC, SAS Institute Inc., 528 p.
Sauer, V.B., and Meyer, R.W., 1992, Determination of error in individual discharge measurements: U.S. Geological Survey Open-File Report 92–144, 21 p.
Seal, R.R., II, and Hammarstrom, J.M., 2003, Geoenvi-ronmental models of mineral deposits—Examples from massive sulfide and gold deposits, in Jambor, J.L., Blowes, D.W., and Ritchie, A.I.M., eds., Environmental aspects of mine wastes: Mineralogical Association of Canada Short Series, v. 31, p. 11–50.
Seal, R.R., II, Kornfeld, J.M., Meier, A.L., and Hammarstrom, J.M., 2001, Geochemical settings of mine drainage in the Vermont Copper Belt, in Hammarstrom, J.M., and Seal, R.R., II, eds., Environmental geochemistry and mining his-tory of massive sulfide deposits in the Vermont Copper Belt: Society of Economic Geologists Guidebook Series, v. 35, p. 255–276.
Shelton, L.R., and Capel, P.D., 1994, Guidelines for collecting and processing samples of stream bed sediment for analysis of trace elements and organic contaminants for the National Water-Quality Assessment Program: U.S. Geological Sur-vey Open-File Report 94–0458, 20 p.
Slack, J.F., Offield, T.W., Shanks, W.C., III, and Woodruff, L.G., 1993, Besshi-type massive sulfide deposits of the Ver-mont Copper Belt: Society of Economic Geologists Field Trip Guidebook Series, v. 17, p. 32–73.
Slack, J.F., Offield, T.W., Woodruff, L.G., and Shanks, W.C., III, 2001, Geology and geochemistry of Besshi-type massive sulfide deposits of the Vermont Copper Belt, in Hammarstrom, J.M., and Seal, R.R., II, eds., Environmental geochemistry and mining history of massive sulfide deposits in the Vermont Copper Belt: Society of Economic Geolo-gists Field Trip Guidebook Series, v. 35, p. 193–211.
Smyth, H.L., and Smith, P.S., 1904, The copper deposits of Orange County, Vermont: Engineering and Mining Journal, v. 77, no. 17, p. 677–678.
Spahr, N.E., and Boulger, R.W., 1997, Interim results of quality-control sampling of surface water for the upper Colorado River National Water-Quality Assessment Study Unit, water years 1995–96: U.S. Geological Survey Water-Resources Investigations Report 97–4227, 34 p.
Suter, G.W., II, 1996, Toxicological benchmarks for screening contaminants of potential concern for effects on freshwa-ter biota: Environmental Toxicology and Chemistry, v. 15, no. 7, p. 1232–1241.
Taggart, J.E., Jr., ed., 2002, Analytical methods for chemical analysis of geologic and other materials, U.S. Geological Survey: U.S. Geological Survey Open-File Report 2002–223, variously paginated.

76 Aquatic Assessment of the Ely Copper Mine Superfund Site, Vershire, Vermont
TechLaw, Inc., 2006a, Two-species, 96-hour, acute toxicity testing results using pore water samples collected from the Ely Mine in Vershire, VT. Environmental Services Assis-tance Team (ESAT) report submitted to the U.S. Environ-mental Protection Agency, Office of Environmental Mea-surement and Evaluation, October 12, 2006.
TechLaw, Inc., 2006b, Toxicity testing results using surface water samples collected from the Pike Hill Mine in Corinth, VT, and the Ely Mine in Vershire, VT. Environmental Ser-vices Assistance Team (ESAT) report submitted to the U.S. Environmental Protection Agency, Office of Environmental Measurement and Evaluation, August 10, 2006.
TechLaw, Inc., 2008, Aquatic baseline ecological assess-ment—Ely copper mine Superfund site, Vershire, Vermont: Lowell, MA, TechLaw, Inc., variously paginated.
Tonkin, J.W., Balistrieri, L.S., and Murray, J.W., 2004, Model-ing sorption of divalent metal cations on hydrous manga-nese oxide using the diffuse double layer model: Applied Geochemistry, v. 19, no. 1, p. 29–53.
URS Corporation, 2009, Phase 1A remedial investigation report, Ely mine, Vershire, Vermont: Portland, ME, URS, variously paginated.
U.S. Environmental Protection Agency, 1986, Guidelines for the health risk assessment of chemical mixtures: U.S. Environmental Protection Agency 630/R-98/002: Federal Register, v. 51, no. 185, p. 34014–34025.
U.S. Environmental Protection Agency, 2000, Methods for measuring the toxicity and bioaccumulation of sediment-associated contaminants with freshwater invertebrates: U.S. Environmental Protection Agency 600/R-94/024, 192 p.
U.S. Environmental Protection Agency, 2004, National recom-mended water quality criteria: Washington, DC, U.S. Envi-ronmental Protection Agency, 22 p.
U.S. Environmental Protection Agency, 2005, Procedures for the derivation of equilibrium partitioning sediment bench-marks (ESBs) for the protection of benthic organisms—Metal mixtures (cadmium, copper, lead, nickel, silver, and zinc): U.S. Environmental Protection Agency 600-R-02-011, variously paginated.
U.S. Environmental Protection Agency, 2006, National recom-mended water quality criteria, accessed March 2006, at http://www.epa.gov/waterscience/criteria/wqcriteria.html
U.S. Environmental Protection Agency, 2007, Aquatic life ambient freshwater quality criteria—Copper 2007 revision: U.S. Environmental Protection Agency 822-F-07-001, 49 p.
Vermont Department of Environmental Conservation, 2004, Biocriteria for fish and macroinvertebrate assemblages in Vermont wadeable streams and rivers, accessed April 2007, at http://www.vtwaterquality.org/bass/docs/bs_wadeablestream2.pdf
Vermont Department of Environmental Conservation, 2006, Water Quality Division field methods manual, accessed June 2006, at http://www.anr.state.vt.us/dec/waterq/bass/docs/bs_fieldmethodsmanual.pdf
Vermont Department of Environmental Conservation, 2008, Aquatic life use attainment assessment of streams influ-enced by the Ely Mine site, Vermont: Ompompanoosuc River, Schoolhouse Brook, and Schoolhouse Brook Tribu-tary 3: Waterbury, VT, Vermont Department of Environmen-tal Conservation.
Vermont Natural Resources Board, 2006, Vermont water qual-ity standards, accessed April 2007, at http://www.nrb.state.vt.us/wrp/publications/wqs.pdf
Weed, W.H., 1911, Copper deposits of the Appalachian States: U.S. Geological Survey Bulletin 455, 166 p.
Wheeler, H.A., 1883, The copper deposits of Vermont: School of Mines Quarterly, v. 4, no. 3, p. 219–224.
White, W.S., and Eric, J.H., 1944, Preliminary report on the geology of the Orange County copper district, Vermont: U.S. Geological Survey Open-File Report 44–19, 36 p.
Wilde, F.D., and Radtke, D.B., eds., 1998, Field mea-surements: U.S. Geological Survey Techniques of Water-Resources Investigations, book 9, chap. A6, vari-ously paginated.
Wilde, F.D., Radtke, D.B., Gibs, J., and Iwatsubo, R.T., eds., 1999, Collection of water samples: U.S. Geological Survey Techniques of Water-Resources Investigations, book 9, chap. A4, 156 p.
Zimmerman, M.J., Massey, A.J., and Campo, K.W., 2005, Pushpoint sampling for defined spatial and temporal varia-tions in contaminant concentrations in sediment pore water near the ground water/surface water interface: U.S. Geologi-cal Survey Scientific Investigations Report 2005–5036, 75 p.

Appendixes 1–8
1. Summary of test conditions for sediment toxicity tests with sediments from the Ely Mine site, September 2006, conducted in accordance with USEPA (2000) and ASTM (2007) standard methods ..............................................................79
2. Quality-assurance, quality-control water samples for the Ely Mine study, Vershire, VT .....................................................................................................81
3. Quality-assurance, quality-control sediment samples for the Ely Mine study, Vershire, VT .....................................................................................................89
4. Acid volatile sulfide, simultaneously extractable metals, and particle-size results for stream sediments and quality-assurance, quality-control samples for the Ely Mine study area, Vershire, VT ...............................................................93
5. Summary of select constituents in surface waters relative to ambient water-quality criteria for stream reaches in the Ely Mine study area, Vershire, VT, 2000 to 2007 .....................................................................97
6. Constituents in surface waters collected in August and September 2006 from the Ely Mine study area, Vershire, VT ..........................................................................113
7. Constituents in pore waters collected in August and September 2006 from the Ely Mine study area, Vershire, VT ..........................................................................121
8. Chemistry results for sediments collected in August and September 2006 from the Ely Mine study area, Vershire, VT ..........................................................................129


Appendix 1 79
Appendix 1. Summary of test conditions for sediment toxicity tests with sediments from the Ely Mine site, September 2006, conducted in accordance with USEPA (2000) and ASTM (2007) standard methods.
Test type Whole-sediment toxicity testsTemperature 23 °C
Lighting 16 hours light: 8 hours dark; wide-spectrum fluorescent, about 200 lux
Test sediments Ely Mine sediments (11 samples, including reference sites) and laboratory control (soil from Florissant, MO)
Exposure chambers 300-ml high-form beaker (with 100 mL sediment)
Test water Diluted Columbia Environmental Research Center (CERC) well water (target hardness 100 mg/L)
Water renewal 2 volume-additions per day
Test organisms Amphipod, Hyalella azteca; Midge, Chironomus dilutusAge of organisms Amphipods, about 8 days old; midge larvae, about 10 days old (second instar)
Number of organisms 10 per replicate
Replication 8 replicates of each species per sediment
Feeding Amphipods: 6 mg yeast-cerophyll-trout chow (YCT) per day (USEPA, 2000) Midges, 6 mg flake fish food suspension per day
Water quality Dissolved oxygen, conductivity, pH, alkalinity, hardness, ammonia (biweekly in overlying water)
Sediment analyses Sediment: particle-size distribution, total organic carbon, total metals, simultaneously extractable metals, acid-volatile sulfides
Pore water: dissolved metals, dissolved organic carbon
Test duration 28 days (amphipods); 10 days (midges)
Test endpoints Amphipods: survival and growth (length) Midges: survival and growth (ash-free dry weight)
Test acceptability Control survival: ≥80 percent for amphipods, ≥70 percent for midges

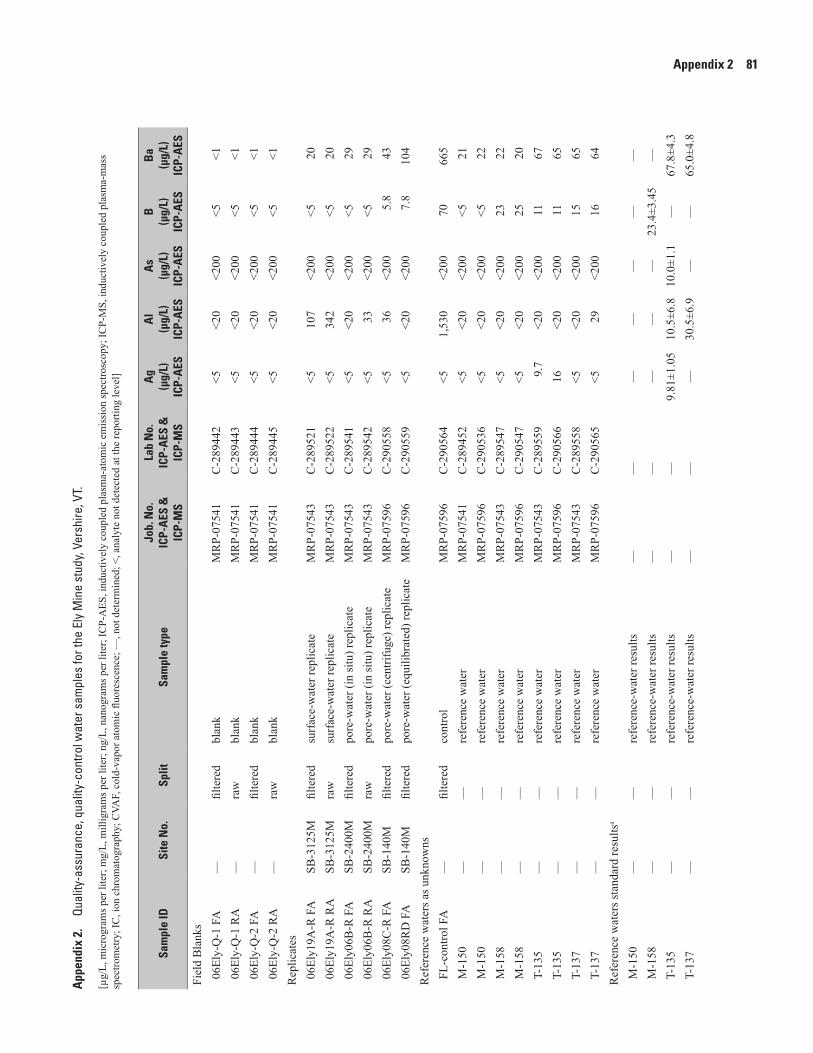
Appendix 2 81A
ppen
dix
2.
Qual
ity-a
ssur
ance
, qua
lity-
cont
rol w
ater
sam
ples
for t
he E
ly M
ine
stud
y, V
ersh
ire, V
T.
[µg/
L, m
icro
gram
s per
lite
r; m
g/L,
mill
igra
ms p
er li
ter;
ng/L
, nan
ogra
ms p
er li
ter;
ICP-
AES
, ind
uctiv
ely
coup
led
plas
ma-
atom
ic e
mis
sion
spec
trosc
opy;
ICP-
MS,
indu
ctiv
ely
coup
led
plas
ma-
mas
s sp
ectro
met
ry; I
C, i
on c
hrom
atog
raph
y; C
VAF,
col
d-va
por a
tom
ic fl
uore
scen
ce; —
, not
det
erm
ined
; <, a
naly
te n
ot d
etec
ted
at th
e re
porti
ng le
vel]
Sam
ple
IDSi
te N
o.Sp
litSa
mpl
e ty
peJo
b. N
o.IC
P-A
ES &
IC
P-M
S
Lab
No.
ICP-
AES
&
ICP-
MS
Ag
(µg/
L)IC
P-A
ES
Al
(µg/
L)IC
P-A
ES
As
(µg/
L)IC
P-A
ES
B(µ
g/L)
ICP-
AES
Ba
(µg/
L)IC
P-A
ES
Fiel
d B
lank
s 0
6Ely
-Q-1
FA
—fil
tere
dbl
ank
MR
P-07
541
C-2
8944
2<5
<20
<200
<5<1
06E
ly-Q
-1 R
A—
raw
blan
kM
RP-
0754
1C
-289
443
<5<2
0<2
00<5
<1 0
6Ely
-Q-2
FA
—fil
tere
dbl
ank
MR
P-07
541
C-2
8944
4<5
<20
<200
<5<1
06E
ly-Q
-2 R
A—
raw
blan
kM
RP-
0754
1C
-289
445
<5<2
0<2
00<5
<1R
eplic
ates
06E
ly19
A-R
FA
SB-3
125M
filte
red
surf
ace-
wat
er re
plic
ate
MR
P-07
543
C-2
8952
1<5
107
<200
<520
06E
ly19
A-R
RA
SB-3
125M
raw
surf
ace-
wat
er re
plic
ate
MR
P-07
543
C-2
8952
2<5
342
<200
<520
06E
ly06
B-R
FA
SB-2
400M
filte
red
pore
-wat
er (i
n si
tu) r
eplic
ate
MR
P-07
543
C-2
8954
1<5
<20
<200
<529
06E
ly06
B-R
RA
SB-2
400M
raw
pore
-wat
er (i
n si
tu) r
eplic
ate
MR
P-07
543
C-2
8954
2<5
33<2
00<5
29 0
6Ely
08C
-R F
ASB
-140
Mfil
tere
dpo
re-w
ater
(cen
trifu
ge) r
eplic
ate
MR
P-07
596
C-2
9055
8<5
36<2
005.
843
06E
ly08
RD
FA
SB-1
40M
filte
red
pore
-wat
er (e
quili
brat
ed) r
eplic
ate
MR
P-07
596
C-2
9055
9<5
<20
<200
7.8
104
Ref
eren
ce w
ater
s as u
nkno
wns
FL-
cont
rol F
A—
filte
red
cont
rol
MR
P-07
596
C-2
9056
4<5
1,53
0<2
0070
665
M-1
50—
—re
fere
nce
wat
erM
RP-
0754
1C
-289
452
<5<2
0<2
00<5
21 M
-150
——
refe
renc
e w
ater
MR
P-07
596
C-2
9053
6<5
<20
<200
<522
M-1
58—
—re
fere
nce
wat
erM
RP-
0754
3C
-289
547
<5<2
0<2
0023
22 M
-158
——
refe
renc
e w
ater
MR
P-07
596
C-2
9054
7<5
<20
<200
2520
T-1
35—
—re
fere
nce
wat
erM
RP-
0754
3C
-289
559
9.7
<20
<200
1167
T-1
35—
—re
fere
nce
wat
erM
RP-
0759
6C
-290
566
16<2
0<2
0011
65 T
-137
——
refe
renc
e w
ater
MR
P-07
543
C-2
8955
8<5
<20
<200
1565
T-1
37—
—re
fere
nce
wat
erM
RP-
0759
6C
-290
565
<529
<200
1664
Ref
eren
ce w
ater
s sta
ndar
d re
sults
a
M-1
50—
—re
fere
nce-
wat
er re
sults
——
——
——
— M
-158
——
refe
renc
e-w
ater
resu
lts—
——
——
23.4
±3.4
5—
T-1
35—
—re
fere
nce-
wat
er re
sults
——
9.81
±1.0
510
.5±6
.810
.0±1
.1—
67.8
±4.3
T-1
37—
—re
fere
nce-
wat
er re
sults
——
—30
.5±6
.9—
—65
.0±4
.8

82 Aquatic Assessment of the Ely Copper Mine Superfund Site, Vershire, Vermont
Sam
ple
IDB
e(µ
g/L)
ICP-
AES
Ca(m
g/L)
ICP-
AES
Cd(µ
g/L)
ICP-
AES
Co(µ
g/L)
ICP-
AES
Cr(µ
g/L)
ICP-
AES
Cu(µ
g/L)
ICP-
AES
Fe(µ
g/L)
ICP-
AES
K(m
g/L)
ICP-
AES
Li(µ
g/L)
ICP-
AES
Mg
(mg/
L)IC
P-A
ES
Mn
(µg/
L)IC
P-A
ES
Mo
(µg/
L)IC
P-A
ES
Ni
(µg/
L)IC
P-A
ES
P(m
g/L)
ICP-
AES
Fiel
d B
lank
s 0
6Ely
-Q-1
FA
<10
<0.1
<5<1
0<1
0<1
0<2
0<0
.1<5
<0.1
<10
<20
<10
<0.5
06E
ly-Q
-1 R
A<1
0<0
.1<5
<10
<10
<10
<20
<0.1
<5<0
.1<1
0<2
0<1
0<0
.5 0
6Ely
-Q-2
FA
<10
<0.1
<5<1
0<1
0<1
0<2
0<0
.1<5
<0.1
<10
<20
<10
<0.5
06E
ly-Q
-2 R
A<1
0<0
.1<5
<10
<10
<10
<20
<0.1
<5<0
.1<1
0<2
0<1
0<0
.5R
eplic
ates
06E
ly19
A-R
FA
<10
35.2
<5<1
0<1
041
342.
37<5
244
<20
<10
<0.5
06E
ly19
A-R
RA
<10
35.7
<5<1
0<1
011
737
32.
41<5
2.02
48<2
0<1
0<0
.5 0
6Ely
06B
-R F
A<1
046
.7<5
<10
<10
<10
<20
4.12
<53.
2111
7<2
0<1
0<0
.5 0
6Ely
06B
-R R
A<1
046
.8<5
<10
<10
1132
4.09
<53.
2211
8<2
0<1
0<0
.5 0
6Ely
08C
-R F
A<1
060
.5<5
<10
<10
1436
3.88
<53.
2642
<20
<10
<0.5
06E
ly08
RD
FA
<10
125
<512
<10
46<2
08.
38<5
6.91
3,98
0<2
0<1
0<0
.5R
efer
ence
wat
ers a
s unk
now
ns F
L-co
ntro
l FA
<10
372
<5<1
0<1
0<1
010
207.
0411
82.7
11,0
00<2
029
<0.5
M-1
50<1
06.
9<5
<10
<10
<10
<20
1.11
<51.
45<1
0<2
0<1
0<0
.5 M
-150
<10
6.83
<5<1
0<1
0<1
0<2
01.
14<5
1.47
<10
<20
<10
<0.5
M-1
58<1
038
.3<5
<10
<10
<10
<20
1.66
<512
<10
<20
<10
<0.5
M-1
58<1
038
.1<5
<10
<10
<10
<20
1.65
<512
<10
<20
<10
<0.5
T-1
3557
10.3
5344
8362
210
0.92
762.
0643
647
69<0
.5 T
-135
5710
.454
4483
6420
10.
9275
2.09
432
4569
<0.5
T-1
37<1
037
.87.
1<1
021
<10
581.
18.
89.
8497
<20
15<0
.5 T
-137
<10
36.7
7<1
019
<10
491.
118.
810
.195
<20
14<0
.5R
efer
ence
wat
ers s
tand
ard
resu
lts M
-150
—6.
82±0
.41
——
——
—1.
12±0
.09
—1.
43±0
.09
——
——
M-1
58—
38.1
±1.5
9—
——
——
1.71
±0.1
19—
11.8
±0.4
8—
——
0.19
0±0.
013
T-1
3559
.0±2
.610
.4±0
.650
.5±3
.240
.0±2
.679
.0±5
.562
.0±4
.222
8±11
0.96
±0.0
973
.7±5
.22.
00±0
.09
423±
2063
.0±5
.165
.6±5
.0—
T-1
375.
2±0.
538
.1±1
.56.
80±0
.52
—19
.4±2
.01.
9±1.
271
±91.
19±0
.13
8.7±
1.5
10.1
±0.5
98±5
8.9±
1.8
15.0
±2.5
—
App
endi
x 2.
Qu
ality
-ass
uran
ce, q
ualit
y-co
ntro
l wat
er s
ampl
es fo
r the
Ely
Min
e st
udy,
Ver
shire
, VT.
—Co
ntin
ued
[µg/
L, m
icro
gram
s per
lite
r; m
g/L,
mill
igra
ms p
er li
ter;
ng/L
, nan
ogra
ms p
er li
ter;
ICP-
AES
, ind
uctiv
ely
coup
led
plas
ma-
atom
ic e
mis
sion
spec
trosc
opy;
ICP-
MS,
indu
ctiv
ely
coup
led
plas
ma-
mas
s spe
ctro
met
ry;
IC, i
on c
hrom
atog
raph
y; C
VAF,
col
d-va
por a
tom
ic fl
uore
scen
ce; —
, not
det
erm
ined
; <, a
naly
te n
ot d
etec
ted
at th
e re
porti
ng le
vel]

Appendix 2 83
Sam
ple
IDPb
(µg/
L)IC
P-A
ES
Sb(µ
g/L)
ICP-
AES
SiO
2
(mg/
L)IC
P-A
ES
SO4
(mg/
L)IC
P-A
ES
Sr(µ
g/L)
ICP-
AES
Ti(µ
g/L)
ICP-
AES
V(µ
g/L)
ICP-
AES
Zn(µ
g/L)
ICP-
AES
Ag
(µg/
L)IC
P-M
S
Al
(µg/
L)IC
P-M
S
As
(µg/
L)IC
P-M
S
Ba
(µg/
L)IC
P-M
S
Be
(µg/
L)IC
P-M
S
Bi
(µg/
L)IC
P-M
S
Fiel
d B
lank
s 0
6Ely
-Q-1
FA
<50
<50
<0.1
<1<1
<50
<10
<20
<3<2
<1<0
.2<0
.05
<0.2
06E
ly-Q
-1 R
A<5
0<5
0<0
.1<1
<1<5
0<1
0<2
0<3
<2<1
<0.2
<0.0
5<0
.2 0
6Ely
-Q-2
FA
<50
<50
<0.1
<1<1
<50
<10
<20
<3<2
<1<0
.2<0
.05
<0.2
06E
ly-Q
-2 R
A<5
0<5
0<0
.1<1
<1<5
0<1
0<2
0<3
<2<1
<0.2
<0.0
5<0
.2R
eplic
ates
06E
ly19
A-R
FA
<50
<50
917
175
<50
<10
<20
<394
.9<1
17.7
<0.0
5<0
.2 0
6Ely
19A
-R R
A<5
0<5
09.
317
.217
8<5
0<1
024
<329
3<1
18.4
<0.0
5<0
.2 0
6Ely
06B
-R F
A<5
0<5
010
.320
.722
0<5
0<1
0<2
0<3
13<1
27.1
<0.0
5<0
.2 0
6Ely
06B
-R R
A<5
0<5
010
.320
.722
0<5
0<1
0<2
0<3
34<1
26.7
<0.0
5<0
.2 0
6Ely
08C
-R F
A<5
0<5
09.
834
.226
8<5
0<1
0<2
0<3
24.4
<136
.4<0
.05
<0.2
06E
ly08
RD
FA
<50
<50
16.3
92.2
576
<50
<10
<20
<311
.8<1
93.2
<0.0
5<0
.2R
efer
ence
wat
ers a
s unk
now
ns F
L-co
ntro
l FA
<50
<50
27.6
71.8
1,25
055
1527
<31,
100
3.3
581
0.05
<0.2
M-1
50<5
0<5
013
.95.
653
<50
25<2
0<3
3.2
<16.
86<0
.05
<0.2
M-1
50<5
0<5
013
.85.
650
<50
23<2
0<3
4.3
<19.
190.
05<0
.2 M
-158
<50
<50
16.3
106
62<5
0<1
0<2
0<3
<2<1
8.47
<0.0
5<0
.2 M
-158
<50
<50
16.7
109
62<5
0<1
0<2
0<3
<2<1
6.6
<0.0
5<0
.2 T
-135
109
764.
76.
646
<50
5346
8.95
8.6
9.5
57.6
56.9
<0.2
T-1
3511
179
56.
844
<50
5346
8.14
6.8
8.1
53.1
52.4
<0.2
T-1
37<5
0<5
07.
749
.923
6<5
013
48<3
19.7
<155
.74.
7<0
.2 T
-137
<50
<50
7.7
5021
5<5
012
48<3
21.8
<151
.14.
6<0
.2R
efer
ence
wat
ers s
tand
ard
resu
lts M
-150
——
12.6
±0.8
5.50
±0.5
451
.0±2
.5—
31.0
±1.9
——
——
——
— M
-158
——
15.0
±0.6
710
5±3.
763
.6±1
.85
—11
.3±0
.82
——
——
——
— T
-135
103±
776
.3±8
.74.
28±0
.31
—46
.0±2
.3—
52.8
±3.6
48.2
±4.7
9.81
±1.0
510
.5±6
.810
.0±1
.167
.8±4
.359
.0±2
.6—
T-1
376.
3±1.
015
.5±2
.76.
96±0
.56
—23
0±14
—14
.0±1
.649
.5±4
.2—
30.5
±6.9
—65
.0±4
.85.
2±0.
5—
App
endi
x 2.
Qu
ality
-ass
uran
ce, q
ualit
y-co
ntro
l wat
er s
ampl
es fo
r the
Ely
Min
e st
udy,
Ver
shire
, VT.
—Co
ntin
ued
[µg/
L, m
icro
gram
s per
lite
r; m
g/L,
mill
igra
ms p
er li
ter;
ng/L
, nan
ogra
ms p
er li
ter;
ICP-
AES
, ind
uctiv
ely
coup
led
plas
ma-
atom
ic e
mis
sion
spec
trosc
opy;
ICP-
MS,
indu
ctiv
ely
coup
led
plas
ma-
mas
s spe
ctro
met
ry;
IC, i
on c
hrom
atog
raph
y; C
VAF,
col
d-va
por a
tom
ic fl
uore
scen
ce; —
, not
det
erm
ined
; <, a
naly
te n
ot d
etec
ted
at th
e re
porti
ng le
vel]

84 Aquatic Assessment of the Ely Copper Mine Superfund Site, Vershire, Vermont
Sam
ple
IDCa
(mg/
L)IC
P-M
S
Cd(µ
g/L)
ICP-
MS
Ce(µ
g/L)
ICP-
MS
Co(µ
g/L)
ICP-
MS
Cr(µ
g/L)
ICP-
MS
Cs(µ
g/L)
ICP-
MS
Cu(µ
g/L)
ICP-
MS
Dy
(µg/
L)IC
P-M
S
Er(µ
g/L)
ICP-
MS
Eu(µ
g/L)
ICP-
MS
Fe(µ
g/L)
ICP-
MS
Ga
(µg/
L)IC
P-M
S
Gd
(µg/
L)IC
P-M
S
Ge
(µg/
L)IC
P-M
S
Ho
(µg/
L)IC
P-M
S
Fiel
d B
lank
s 0
6Ely
-Q-1
FA
<0.2
<0.0
2<0
.01
<0.0
2<1
<0.0
2<0
.5<0
.005
<0.0
05<0
.005
<50
<0.0
5<0
.005
<0.0
5<0
.005
06E
ly-Q
-1 R
A<0
.2<0
.02
<0.0
1<0
.02
<1<0
.02
<0.5
<0.0
05<0
.005
<0.0
05<5
0<0
.05
<0.0
05<0
.05
<0.0
05 0
6Ely
-Q-2
FA
<0.2
<0.0
2<0
.01
<0.0
2<1
<0.0
2<0
.5<0
.005
<0.0
05<0
.005
<50
<0.0
5<0
.005
<0.0
5<0
.005
06E
ly-Q
-2 R
A<0
.2<0
.02
<0.0
1<0
.02
<1<0
.02
<0.5
<0.0
05<0
.005
<0.0
05<5
0<0
.05
<0.0
05<0
.05
<0.0
05R
eplic
ates
06E
ly19
A-R
FA
30.7
0.12
0.22
4.04
<10.
1338
.60.
020.
006
0.00
5<5
0<0
.05
0.03
<0.0
5<0
.005
06E
ly19
A-R
RA
310.
141.
524.
26<1
0.14
112
0.12
0.05
0.04
345
<0.0
50.
18<0
.05
0.02
06E
ly06
B-R
FA
45.6
0.07
0.02
0.31
<10.
158.
4<0
.005
<0.0
05<0
.005
<50
<0.0
5<0
.005
<0.0
5<0
.005
06E
ly06
B-R
RA
44.4
0.07
0.08
0.33
<10.
1512
.30.
009
<0.0
050.
007
<50
<0.0
50.
01<0
.05
<0.0
05 0
6Ely
08C
-R F
A52
.30.
210.
080.
73<1
0.16
14.4
0.00
6<0
.005
0.00
7<5
0<0
.05
0.01
<0.0
5<0
.005
06E
ly08
RD
FA
112
0.37
0.13
9.93
<10.
5544
.70.
010.
007
0.02
<50
0.09
0.01
<0.0
5<0
.005
Ref
eren
ce w
ater
s as u
nkno
wns
FL-
cont
rol F
A34
21.
282.
218.
312.
90.
16.
40.
290.
160.
1889
50.
510.
38<0
.05
0.05
1 M
-150
5.59
<0.0
20.
010.
02<1
<0.0
2<0
.5<0
.005
<0.0
05<0
.005
<50
<0.0
5<0
.005
<0.0
5<0
.005
M-1
506.
5<0
.02
0.01
0.02
1.3
<0.0
2<0
.5<0
.005
<0.0
05<0
.005
<50
<0.0
5<0
.005
<0.0
5<0
.005
M-1
5834
.6<0
.02
<0.0
1<0
.02
3.1
<0.0
2<0
.5<0
.005
<0.0
05<0
.005
<50
<0.0
5<0
.005
<0.0
5<0
.005
M-1
5827
.8<0
.02
<0.0
1<0
.02
3.1
<0.0
2<0
.5<0
.005
<0.0
05<0
.005
<50
<0.0
5<0
.005
<0.0
5<0
.005
T-1
359.
0751
.70.
0336
.871
<0.0
259
.80.
005
<0.0
050.
007
162
<0.0
50.
01<0
.05
<0.0
05 T
-135
8.28
44.3
0.03
3159
.9<0
.02
50.4
<0.0
050.
005
0.00
811
9<0
.05
0.00
8<0
.05
<0.0
05 T
-137
30.5
6.77
0.05
0.14
16.6
0.02
1.7
0.00
90.
007
0.00
6<5
0<0
.05
0.01
<0.0
5<0
.005
T-1
3729
.35.
980.
040.
1414
.6<0
.02
1.5
0.00
60.
006
0.01
<50
<0.0
50.
007
<0.0
5<0
.005
Ref
eren
ce w
ater
s sta
ndar
d re
sults
M-1
506.
82±0
.41
——
——
——
——
——
——
——
M-1
5838
.1±1
.59
——
——
——
——
——
——
——
T-1
3510
.4±0
.650
.5±3
.2—
40.0
±2.6
79.0
±5.5
—62
.0±4
.2—
——
228±
11—
——
— T
-137
38.1
±1.5
6.80
±0.5
2—
—19
.4±2
.0—
1.9±
1.2
——
—71
±9—
——
—
App
endi
x 2.
Qu
ality
-ass
uran
ce, q
ualit
y-co
ntro
l wat
er s
ampl
es fo
r the
Ely
Min
e st
udy,
Ver
shire
, VT.
—Co
ntin
ued
[µg/
L, m
icro
gram
s per
lite
r; m
g/L,
mill
igra
ms p
er li
ter;
ng/L
, nan
ogra
ms p
er li
ter;
ICP-
AES
, ind
uctiv
ely
coup
led
plas
ma-
atom
ic e
mis
sion
spec
trosc
opy;
ICP-
MS,
indu
ctiv
ely
coup
led
plas
ma-
mas
s spe
ctro
met
ry;
IC, i
on c
hrom
atog
raph
y; C
VAF,
col
d-va
por a
tom
ic fl
uore
scen
ce; —
, not
det
erm
ined
; <, a
naly
te n
ot d
etec
ted
at th
e re
porti
ng le
vel]

Appendix 2 85
Sam
ple
IDK
(mg/
L)IC
P-M
S
La(µ
g/L)
ICP-
MS
Li(µ
g/L)
ICP-
MS
Lu(µ
g/L)
ICP-
MS
Mg
(mg/
L)IC
P-M
S
Mn
(µg/
L)IC
P-M
S
Mo
(µg/
L)IC
P-M
S
Na
(mg/
L)IC
P-M
S
Nb
(µg/
L)IC
P-M
S
Nd
(µg/
L)IC
P-M
S
Ni
(µg/
L)IC
P-M
S
P(m
g/L)
ICP-
MS
Pb(µ
g/L)
ICP-
MS
Pr(µ
g/L)
ICP-
MS
Sb(µ
g/L)
ICP-
MS
Fiel
d B
lank
s 0
6Ely
-Q-1
FA
<0.0
3<0
.01
0.2
<0.1
<0.0
1<0
.2<2
<0.0
1<0
.2<0
.01
<0.4
<0.0
10.
7<0
.01
<0.3
06E
ly-Q
-1 R
A<0
.03
<0.0
10.
3<0
.1<0
.01
<0.2
<20.
01<0
.2<0
.01
<0.4
<0.0
1<0
.05
<0.0
1<0
.3 0
6Ely
-Q-2
FA
<0.0
3<0
.01
0.2
<0.1
<0.0
1<0
.2<2
<0.0
1<0
.2<0
.01
<0.4
<0.0
1<0
.05
<0.0
1<0
.3 0
6Ely
-Q-2
RA
<0.0
3<0
.01
0.2
<0.1
<0.0
1<0
.2<2
<0.0
1<0
.2<0
.01
<0.4
<0.0
1<0
.05
<0.0
1<0
.3R
eplic
ates
06E
ly19
A-R
FA
2.13
0.12
1.6
<0.1
1.7
40.5
<23.
62<0
.20.
133.
2<0
.01
0.2
0.03
<0.3
06E
ly19
A-R
RA
2.11
0.75
1.6
<0.1
1.69
44<2
3.59
<0.2
0.86
1.5
<0.0
10.
080.
21<0
.3 0
6Ely
06B
-R F
A4.
180.
031.
6<0
.13.
2111
5<2
16<0
.20.
030.
5<0
.01
<0.0
5<0
.01
<0.3
06E
ly06
B-R
RA
4.1
0.06
1.5
<0.1
3.14
113
<215
.6<0
.20.
060.
4<0
.01
<0.0
50.
02<0
.3 0
6Ely
08C
-R F
A3.
450.
051
<0.1
2.73
35.2
<25.
55<0
.20.
052.
1<0
.01
0.1
0.01
<0.3
06E
ly08
RD
FA
7.42
0.08
2.2
<0.1
6.07
3,57
0<2
9.4
<0.2
0.06
4.2
<0.0
10.
20.
02<0
.3R
efer
ence
wat
ers a
s unk
now
ns F
L-co
ntro
l FA
5.95
1.57
7.2
<0.1
66.9
9,81
0<2
14.8
<0.2
1.8
34.4
0.3
0.63
0.39
0.41
M-1
500.
960.
010.
8<0
.11.
191.
8<2
14.7
<0.2
<0.0
1<0
.4<0
.01
0.09
<0.0
1<0
.3 M
-150
1.1
<0.0
11.
6<0
.11.
272
<216
.5<0
.20.
01<0
.4<0
.01
<0.0
5<0
.01
<0.3
M-1
581.
58<0
.01
1.2
<0.1
10.4
<0.2
2.1
64.8
0.94
<0.0
1<0
.40.
20.
05<0
.01
0.9
M-1
581.
18<0
.01
0.5
<0.1
7.07
<0.2
<243
.50.
26<0
.01
<0.4
0.1
<0.0
5<0
.01
<0.3
T-1
350.
770.
0371
.5<0
.11.
5538
654
.424
<0.2
0.03
60.2
0.02
100
<0.0
178
.7 T
-135
0.72
0.02
63.9
<0.1
1.48
325
44.1
23.7
<0.2
0.03
51.5
0.02
89.1
<0.0
169
T-1
370.
870.
046.
8<0
.16.
6486
.86.
314
.6<0
.20.
0313
.50.
035.
9<0
.01
15.8
T-1
370.
870.
037.
9<0
.17.
5477
.45.
516
.1<0
.20.
0312
.80.
045.
1<0
.01
14.4
Ref
eren
ce w
ater
s sta
ndar
d re
sults
M-1
501.
12±0
.09
——
—1.
43±0
.09
——
17.5
±1.0
——
——
——
— M
-158
1.71
±0.1
19—
——
11.8
±0.4
8—
—71
.7±2
.22
——
—0.
190±
0.01
3—
——
T-1
350.
96±0
.09
—73
.7±5
.2—
2.00
±0.0
942
3±20
63.0
±5.1
30.8
±1.2
——
65.6
±5.0
—10
3±7
—76
.3±8
.7 T
-137
1.19
±0.1
3—
8.7±
1.5
—10
.1±0
.598
±58.
9±1.
822
.0±1
.1—
—15
.0±2
.5—
6.3±
1.0
—15
.5±2
.7
App
endi
x 2.
Qu
ality
-ass
uran
ce, q
ualit
y-co
ntro
l wat
er s
ampl
es fo
r the
Ely
Min
e st
udy,
Ver
shire
, VT.
—Co
ntin
ued
[µg/
L, m
icro
gram
s per
lite
r; m
g/L,
mill
igra
ms p
er li
ter;
ng/L
, nan
ogra
ms p
er li
ter;
ICP-
AES
, ind
uctiv
ely
coup
led
plas
ma-
atom
ic e
mis
sion
spec
trosc
opy;
ICP-
MS,
indu
ctiv
ely
coup
led
plas
ma-
mas
s spe
ctro
met
ry;
IC, i
on c
hrom
atog
raph
y; C
VAF,
col
d-va
por a
tom
ic fl
uore
scen
ce; —
, not
det
erm
ined
; <, a
naly
te n
ot d
etec
ted
at th
e re
porti
ng le
vel]

86 Aquatic Assessment of the Ely Copper Mine Superfund Site, Vershire, Vermont
Sam
ple
IDSc
(µg/
L)IC
P-M
S
Se(µ
g/L)
ICP-
MS
SiO
2
(mg/
L)IC
P-M
S
Sm (µg/
L)IC
P-M
S
SO4
(mg/
L)IC
P-M
S
Sr(µ
g/L)
ICP-
MS
Ta(µ
g/L)
ICP-
MS
Tb(µ
g/L)
ICP-
MS
Ti(µ
g/L)
ICP-
MS
Tl(µ
g/L)
ICP-
MS
Tm (µg/
L)IC
P-M
S
U(µ
g/L)
ICP-
MS
V(µ
g/L)
ICP-
MS
W(µ
g/L)
ICP-
MS
Y(µ
g/L)
ICP-
MS
Fiel
d B
lank
s 0
6Ely
-Q-1
FA
<0.6
<1<0
.2<0
.01
<2<0
.5<0
.02
<0.0
05<0
.5<0
.1<0
.005
<0.1
<0.5
<0.5
<0.0
1 0
6Ely
-Q-1
RA
<0.6
<1<0
.2<0
.01
<2<0
.5<0
.02
<0.0
05<0
.5<0
.1<0
.005
<0.1
<0.5
<0.5
<0.0
1 0
6Ely
-Q-2
FA
<0.6
<1<0
.2<0
.01
<2<0
.5<0
.02
<0.0
05<0
.5<0
.1<0
.005
<0.1
<0.5
<0.5
<0.0
1 0
6Ely
-Q-2
RA
<0.6
<1<0
.2<0
.01
<2<0
.5<0
.02
<0.0
05<0
.5<0
.1<0
.005
<0.1
<0.5
<0.5
<0.0
1R
eplic
ates
06E
ly19
A-R
FA
0.8
<17
0.01
1415
8<0
.02
<0.0
05<0
.5<0
.1<0
.005
0.3
<0.5
<0.5
0.07
06E
ly19
A-R
RA
0.8
<17.
20.
1714
158
<0.0
20.
021.
1<0
.10.
005
0.32
<0.5
<0.5
0.44
06E
ly06
B-R
FA
0.9
<19.
4<0
.01
2121
5<0
.02
<0.0
05<0
.5<0
.1<0
.005
0.33
<0.5
<0.5
0.03
06E
ly06
B-R
RA
0.9
<19.
30.
0121
209
<0.0
2<0
.005
1.3
<0.1
<0.0
050.
33<0
.5<0
.50.
04 0
6Ely
08C
-R F
A1.
11
7.5
<0.0
130
238
<0.0
2<0
.005
1<0
.1<0
.005
0.35
<0.5
<0.5
0.04
06E
ly08
RD
FA
1.8
112
.80.
0185
527
<0.0
2<0
.005
1.2
<0.1
<0.0
051.
09<0
.5<0
.50.
1R
efer
ence
wat
ers a
s unk
now
ns F
L-co
ntro
l FA
3.5
9.5
20.5
0.36
541,
140
<0.0
20.
0542
0.1
0.02
0.12
15<0
.51.
41 M
-150
0.9
<110
.6<0
.01
246
.30.
24<0
.005
1.1
<0.1
<0.0
05<0
.120
.83.
360.
01 M
-150
1.5
<111
.8<0
.01
746
.6<0
.02
<0.0
05<0
.5<0
.1<0
.005
<0.1
22.5
2.38
<0.0
1 M
-158
1.4
<113
.2<0
.01
9760
.40.
38<0
.005
1.8
<0.1
<0.0
05<0
.17.
96.
68<0
.01
M-1
581.
2<1
9.4
<0.0
179
54.2
<0.0
2<0
.005
1.1
<0.1
<0.0
05<0
.17.
12.
71<0
.01
T-1
35<0
.611
.13.
1<0
.01
345
.2<0
.02
<0.0
05<0
.50.
1<0
.005
0.24
47.9
<0.5
0.02
T-1
35<0
.69.
13.
1<0
.01
436
.6<0
.02
<0.0
05<0
.5<0
.1<0
.005
0.21
39.5
<0.5
0.02
T-1
37<0
.6<1
4.5
<0.0
133
216
<0.0
2<0
.005
0.8
168
<0.0
058.
6711
.3<0
.50.
05 T
-137
0.6
<15
<0.0
138
191
<0.0
2<0
.005
0.8
148
<0.0
057.
2410
.1<0
.50.
04R
efer
ence
wat
ers s
tand
ard
resu
lts M
-150
——
12.6
±0.8
—5.
50±0
.54
51.0
±2.5
——
——
——
31.0
±1.9
——
M-1
58—
—15
.0±0
.67
—10
5±3.
763
.6±1
.85
——
——
——
11.3
±0.8
2—
— T
-135
—10
.0±1
.44.
28±0
.31
——
46.0
±2.3
——
——
——
52.8
±3.6
——
T-1
37—
—6.
96±0
.56
——
230±
14—
——
162±
23—
10.0
±0.5
14.0
±1.6
——
App
endi
x 2.
Qu
ality
-ass
uran
ce, q
ualit
y-co
ntro
l wat
er s
ampl
es fo
r the
Ely
Min
e st
udy,
Ver
shire
, VT.
—Co
ntin
ued
[µg/
L, m
icro
gram
s per
lite
r; m
g/L,
mill
igra
ms p
er li
ter;
ng/L
, nan
ogra
ms p
er li
ter;
ICP-
AES
, ind
uctiv
ely
coup
led
plas
ma-
atom
ic e
mis
sion
spec
trosc
opy;
ICP-
MS,
indu
ctiv
ely
coup
led
plas
ma-
mas
s spe
ctro
met
ry;
IC, i
on c
hrom
atog
raph
y; C
VAF,
col
d-va
por a
tom
ic fl
uore
scen
ce; —
, not
det
erm
ined
; <, a
naly
te n
ot d
etec
ted
at th
e re
porti
ng le
vel]

Appendix 2 87
Sam
ple
IDYb
(µg/
L)IC
P-M
S
Zn(µ
g/L)
ICP-
MS
Zr(µ
g/L)
ICP-
MS
Job
No.
ICLa
b N
o.IC
Fiel
d N
o.IC
Cl(m
g/L)
IC
F(m
g/L)
IC
NO
3
(mg/
L)IC
SO4
(mg/
L)IC
Job
No.
CVA
FLa
b N
o.CV
AF
Fiel
d N
o.CV
AF
Hg
(ng/
L)CV
AF
Fiel
d B
lank
s
06E
ly-Q
-1 F
A<0
.005
2.4
<0.2
MR
P-07
540
C-2
8942
306
Ely-
Q-1
FU
<0.0
8<0
.08
<0.0
826
MR
P-07
542
C-2
8949
906
Ely-
Q-1
Hg
<5 0
6Ely
-Q-1
RA
<0.0
051.
9<0
.2—
——
——
——
——
——
06E
ly-Q
-2 F
A<0
.005
0.6
<0.2
MR
P-07
540
C-2
8942
706
Ely-
Q-2
FU
<0.0
8<0
.08
<0.0
8<0
.08
MR
P-07
542
C-2
8950
306
Ely-
Q-2
Hg
<5 0
6Ely
-Q-2
RA
<0.0
051.
3<0
.2—
——
——
——
——
——
Rep
licat
es 0
6Ely
19A
-R F
A0.
005
27<0
.2M
RP-
0754
0C
-289
426
06El
y19A
-R F
U4.
60.
090.
612
MR
P-07
542
C-2
8950
206
Ely1
9A-R
Hg
<5 0
6Ely
19A
-R R
A0.
0323
.6<0
.2—
——
——
——
——
——
06E
ly06
B-R
FA
<0.0
057.
4<0
.2M
RP-
0754
0C
-289
430
06El
y06B
-R F
U21
<0.0
8<0
.08
21M
RP-
0754
2C
-289
506
06El
y06B
-R H
g<5
06E
ly06
B-R
RA
<0.0
054
<0.2
——
——
——
——
——
— 0
6Ely
08C
-R F
A<0
.005
4.4
<0.2
——
——
——
——
——
— 0
6Ely
08R
D F
A0.
006
10<0
.2M
RP-
0759
7C
-290
581
06El
y08R
D F
U7.
50.
31.
882
——
——
Ref
eren
ce w
ater
s as u
nkno
wns
FL-
cont
rol F
A0.
1325
.51.
6—
——
——
——
——
——
M-1
50<0
.005
0.8
0.2
MR
P-07
540
C-2
8941
2M
-150
170.
98.
25.
6—
——
— M
-150
<0.0
050.
7<0
.2M
RP-
0759
7C
-290
584
M-1
5018
1<0
.08
5.8
——
——
M-1
58<0
.005
<0.5
<0.2
MR
P-07
540
C-2
8941
3M
-158
88.5
0.4
1.4
104
——
——
M-1
58<0
.005
<0.5
<0.2
MR
P-07
597
C-2
9058
5M
-158
91.1
0.45
1.6
106.
5—
——
— T
-135
0.00
549
.7<0
.2—
——
——
——
——
——
T-1
350.
005
40.9
<0.2
——
——
——
——
——
— T
-137
0.00
747
.9<0
.2—
——
——
——
——
——
T-1
370.
008
41.8
<0.2
——
——
——
——
——
—R
efer
ence
wat
ers s
tand
ard
resu
lts M
-150
——
——
—M
-150
17.0
±1.5
1.00
±0.0
7—
5.50
±0.5
4—
——
— M
-158
——
——
—M
-158
90.7
±2.7
40.
350±
0.04
5—
105±
3.7
——
——
T-1
35—
48.2
±4.7
——
—T-
135
——
——
——
——
T-1
37—
49.5
±4.2
——
—T-
137
——
——
——
——
a Rou
nd ro
bin
resu
lts w
ith o
ne st
anda
rd d
evia
tion.
App
endi
x 2.
Qu
ality
-ass
uran
ce, q
ualit
y-co
ntro
l wat
er s
ampl
es fo
r the
Ely
Min
e st
udy,
Ver
shire
, VT.
—Co
ntin
ued
[µg/
L, m
icro
gram
s per
lite
r; m
g/L,
mill
igra
ms p
er li
ter;
ng/L
, nan
ogra
ms p
er li
ter;
ICP-
AES
, ind
uctiv
ely
coup
led
plas
ma-
atom
ic e
mis
sion
spec
trosc
opy;
ICP-
MS,
indu
ctiv
ely
coup
led
plas
ma-
mas
s spe
ctro
met
ry;
IC, i
on c
hrom
atog
raph
y; C
VAF,
col
d-va
por a
tom
ic fl
uore
scen
ce; —
, not
det
erm
ined
; <, a
naly
te n
ot d
etec
ted
at th
e re
porti
ng le
vel]


Appendix 3 89
Sam
ple
IDSi
te N
o.Sa
mpl
e ty
peJo
b N
o.La
b N
o.A
l(w
t. %
)Ca
(wt.
%)
Fe(w
t. %
)K
(wt.
%)
Fiel
d B
lank
s B
lank
—bl
ank
——
<0.0
1<0
.01
<0.0
1<0
.01
Rep
licat
es 0
6Ely
09O
R-2
4050
Mla
b re
plic
ate
—D
UP-
C-2
9059
83.
381.
161.
480.
82 0
6Ely
02-2
EB-7
70M
lab
repl
icat
eM
RP-
0759
8C
-290
588
5.01
1.33
5.84
1.1
06E
ly04
-RD
EB-9
0Mfie
ld re
plic
ate
with
bot
tle sa
mpl
erM
RP-
0759
8C
-290
591
3.44
0.89
16.9
0.86
06E
ly08
RSB
-140
Mfie
ld re
plic
ate
MR
P-07
598
C-2
9059
73.
661.
322.
420.
87R
efer
ence
mat
eria
ls a
s unk
now
ns S
O-3
—re
fere
nce
mat
eria
l—
—3.
0914
.41.
511.
35 N
BS8
8B—
refe
renc
e m
ater
ial
——
——
——
SO
-2—
refe
renc
e m
ater
ial
——
——
——
NIS
T860
3—
refe
renc
e m
ater
ial
——
——
——
SA
RL.
1—
refe
renc
e m
ater
ial
MR
P-07
599
C-2
9060
85.
350.
942.
482.
96 S
AR
M.1
—re
fere
nce
mat
eria
lM
RP-
0759
9C
-290
609
5.45
0.5
2.98
2.97
Ref
eren
ce m
ater
ial s
tand
ard
resu
ltsa
SO
-3—
certi
fied
valu
e w
ith 9
5% c
onfid
ence
in
terv
al—
—3.
05 ±
0.1
114
.63
± 0.
41.
51 ±
0.0
61.
61 ±
0.0
5
NB
S88B
—N
BS8
8B c
ertifi
ed v
alue
with
two
stan
-da
rd d
evia
tions
——
——
——
SO
-2—
certi
fied
valu
e w
ith 9
5% c
onfid
ence
in
terv
al—
——
——
—
NIS
T860
3—
NIS
T860
3 re
fere
nce
conc
entra
tion
with
95
% c
onfid
ence
inte
rval
——
——
——
SA
RL.
1—
refe
renc
e sa
mpl
e m
ean
valu
es—
—5.
841.
062.
63.
02 S
AR
M.1
—re
fere
nce
sam
ple
mea
n va
lues
——
6.13
0.59
3.10
2.88
App
endi
x 3.
Qu
ality
-ass
uran
ce, q
ualit
y-co
ntro
l sed
imen
t sam
ples
for t
he E
ly M
ine
stud
y, V
ersh
ire, V
T.
[wt.
%, w
eigh
t per
cent
; mg/
kg, m
illig
ram
s per
kilo
gram
; —, n
ot d
eter
min
ed; <
, ana
lyte
not
det
ecte
d at
the
repo
rting
leve
l]

90 Aquatic Assessment of the Ely Copper Mine Superfund Site, Vershire, Vermont
Sam
ple
IDM
g(w
t. %
)N
a(w
t. %
)S
(wt.
%)
Ti(w
t. %
)A
g(m
g/kg
)A
s(m
g/kg
)B
a(m
g/kg
)B
e(m
g/kg
)B
i(m
g/kg
)Cd
(mg/
kg)
Ce(m
g/kg
)Co
(mg/
kg)
Cr(m
g/kg
)Cs
(mg/
kg)
Cu(m
g/kg
)G
a(m
g/kg
)H
g(m
g/kg
)
Fiel
d B
lank
s B
lank
<0.0
1<0
.01
<0.0
1<0
.01
<1<1
<5<0
.1<0
.04
<0.1
<0.0
5<0
.1<1
<5<0
.5<0
.05
<0.0
2R
eplic
ates
06E
ly09
0.78
0.75
0.02
0.16
<14
190
1.6
0.08
<0.1
16.3
6.4
39<5
57.
66<0
.02
06E
ly02
-21.
041.
120.
30.
38<1
423
91.
60.
340.
628
.922
.465
<51,
230
11.9
<0.0
2 0
6Ely
04-R
D0.
650.
911.
860.
263
615
21
1.55
0.6
9.6
15.3
62<5
5,97
09.
59<0
.02
06E
ly08
R0.
70.
780.
070.
19<1
119
91.
50.
180.
221
.512
.129
<525
58.
1<0
.02
Ref
eren
ce m
ater
ials
as u
nkno
wns
SO
-35.
120.
750.
020.
15<1
328
60.
80.
070.
232
.75.
226
<517
.26.
55—
NB
S88B
——
——
——
——
——
——
——
——
— S
O-2
——
——
——
——
——
——
——
——
0.09
NIS
T860
3—
——
——
——
——
——
——
——
——
SA
RL.
10.
511.
380.
090.
213
1690
73
133
489
0.99
3.1
147
6.6
75<5
0.18
SA
RM
.10.
441.
090.
160.
243
4078
92.
264
1020
1.75
5.7
110
10.2
78<5
0.13
Ref
eren
ce m
ater
ial s
tand
ard
resu
lts S
O-3
4.98
± 0
.10.
74 ±
0.0
4—
0.2
± 0.
02—
—29
6 ±
39—
——
—8
± 3
26 ±
3—
17 ±
1—
— N
BS8
8B—
——
——
——
——
——
——
——
——
SO
-2—
——
——
——
——
——
——
——
—0.
082
± 0.
009
NIS
T860
3—
——
——
——
——
——
——
——
——
SA
RL.
10.
535
1.51
0.07
80.
233.
0416
.391
03.
6513
745
71.
192.
9515
47.
1495
.94.
160.
175
SA
RM
.10.
491.
160.
120.
273.
6438
.880
12.
1667
.293
01.
945.
2712
210
.779
.75.
150.
130
App
endi
x 3.
Qu
ality
-ass
uran
ce, q
ualit
y-co
ntro
l sed
imen
t sam
ples
for t
he E
ly M
ine
stud
y, V
ersh
ire, V
T. —
Cont
inue
d
[wt.
%, w
eigh
t per
cent
; mg/
kg, m
illig
ram
s per
kilo
gram
; —, n
ot d
eter
min
ed; <
, ana
lyte
not
det
ecte
d at
the
repo
rting
leve
l]

Appendix 3 91
Sam
ple
IDIn
(mg/
kg)
La(m
g/kg
)Li
(mg/
kg)
Mn
(mg/
kg)
Mo
(mg/
kg)
Nb
(mg/
kg)
Ni
(mg/
kg)
P(m
g/kg
)Pb
(mg/
kg)
Rb(m
g/kg
)Sb
(mg/
kg)
Sc(m
g/kg
)Se
(mg/
kg)
Sn(m
g/kg
)Sr
(mg/
kg)
Te(m
g/kg
)Th
(mg/
kg)
Tl(m
g/kg
)
Fiel
d B
lank
s B
lank
<0.0
2<0
.5<1
<5<0
.05
<0.1
<0.5
<50
<0.5
<0.2
<0.0
5<0
.1<0
.2<0
.1<0
.5<0
.1<0
.2<0
.1R
eplic
ates
06E
ly09
0.02
9.3
3149
50.
213.
812
.527
010
.643
.80.
225.
2<0
.21.
120
6<0
.13
0.2
06E
ly02
-20.
0815
.223
2,20
03.
915.
220
.236
015
49.4
0.37
16.5
3.9
1.4
116
0.2
4.1
0.3
06E
ly04
-RD
0.25
5.4
92,
080
213.
38.
512
030
.833
.70.
2911
.631
.71.
957
.71
2.3
0.3
06E
ly08
R0.
0311
.224
784
1.76
4.7
12.1
280
2443
.11.
359.
51.
21.
218
7<0
.13.
60.
2R
efer
ence
mat
eria
ls a
s unk
now
ns S
O-3
0.03
16.6
1352
51.
124.
313
.550
012
.936
0.26
4.8
—0.
822
6<0
.13.
60.
2 N
BS8
8B—
——
——
——
——
——
——
——
——
— S
O-2
——
——
——
——
——
——
——
——
——
NIS
T860
3—
——
——
——
——
——
—0.
7—
——
——
SA
RL.
136
315
.90.
3266
.327
14.8
37.1
1,97
050
512
65.
148.
20.
85.
254
.40.
917
.81.
1 S
AR
M.1
321
15.4
1.11
50.8
2614
.332
.45,
050
852
139
7.4
90.
32.
743
1.1
172.
7R
efer
ence
mat
eria
l sta
ndar
d re
sults
SO
-3—
——
520±
20—
——
480±
5014
±339
±3—
——
—21
7±29
——
— N
BS8
8B—
——
——
——
——
——
——
——
——
— S
O-2
——
——
——
——
——
——
——
——
——
NIS
T860
3—
——
——
——
——
——
—0.
81±0
.08
——
——
— S
AR
L.1
386
16.5
0.29
570
.526
.413
.729
.42,
190
589
140
4.91
7.51
0.86
84.
453
0.58
18.7
1.35
SA
RM
.133
116
.81.
0857
.427
.413
.129
.95,
220
982
146
6.36
7.83
0.38
62.
7641
.50.
9817
.22.
88
App
endi
x 3.
Qu
ality
-ass
uran
ce, q
ualit
y-co
ntro
l sed
imen
t sam
ples
for t
he E
ly M
ine
stud
y, V
ersh
ire, V
T. —
Cont
inue
d
[wt.
%, w
eigh
t per
cent
; mg/
kg, m
illig
ram
s per
kilo
gram
; —, n
ot d
eter
min
ed; <
, ana
lyte
not
det
ecte
d at
the
repo
rting
leve
l]

92 Aquatic Assessment of the Ely Copper Mine Superfund Site, Vershire, Vermont
Sam
ple
IDU
(mg/
kg)
V(m
g/kg
)W
(mg/
kg)
Y(m
g/kg
)Zn
(mg/
kg)
Carb
onat
e(w
t. %
as
C)CO
2
(wt.
% a
s C)
Tota
l C(w
t. %
as
C)
Fiel
d B
lank
s B
lank
<0.1
<1<0
.1<0
.1<1
—<0
.01
n.a.
Rep
licat
es 0
6Ely
090.
840
0.4
837
—0.
150.
4 0
6Ely
02-2
1.3
900.
521
.213
90.
020.
070.
54 0
6Ely
04-R
D0.
710
20.
511
.814
40.
020.
070.
28 0
6Ely
08R
0.8
500.
410
.977
0.1
0.38
0.42
Ref
eren
ce m
ater
ials
as u
nkno
wns
SO
-31
350.
514
.248
——
6.7
NB
S88B
——
——
——
46.4
— S
O-2
——
——
——
——
NIS
T860
3—
——
——
——
— S
AR
L.1
3.9
750
3.1
31.9
140
0.1
0.37
1.04
SA
RM
.13
700
9.1
23.6
138
0.02
0.08
0.33
Ref
eren
ce m
ater
ial s
tand
ard
resu
lts S
O-3
—38
±6—
—52
±3—
——
NB
S88B
——
——
——
46.3
7±0.
12—
SO
-2—
——
——
——
— N
IST8
603
——
——
——
——
SA
RL.
14.
220
830
3.09
38.2
156
0.10
20.
378
1.06
SA
RM
.13.
5777
59.
7828
.015
10.
020
0.08
20.
35a R
ound
robi
n re
sults
with
one
stan
dard
dev
iatio
n.
App
endi
x 3.
Qu
ality
-ass
uran
ce, q
ualit
y-co
ntro
l sed
imen
t sam
ples
for t
he E
ly M
ine
stud
y, V
ersh
ire, V
T. —
Cont
inue
d
[wt.
%, w
eigh
t per
cent
; mg/
kg, m
illig
ram
s per
kilo
gram
; -, n
ot d
eter
min
ed; <
, ana
lyte
not
det
ecte
d at
the
repo
rting
leve
l]
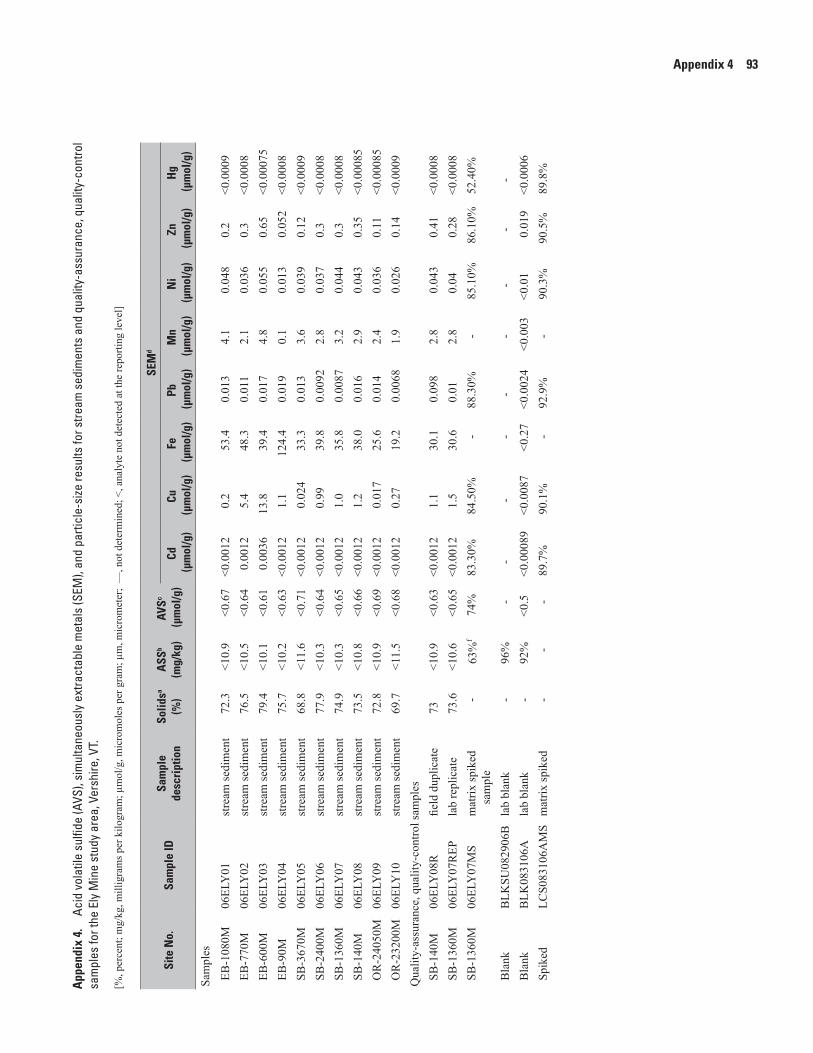
Appendix 4 93
Site
No.
Sam
ple
ID
Sam
ple
de
scri
ptio
nSo
lidsa
(%)
ASS
b
(mg/
kg)
AVSc
(µm
ol/g
)
SEM
d
Cd (µ
mol
/g)
Cu (µ
mol
/g)
Fe (µ
mol
/g)
Pb (µ
mol
/g)
Mn
(µm
ol/g
)N
i (µ
mol
/g)
Zn (µ
mol
/g)
Hg
(µm
ol/g
)
Sam
ples
EB
-108
0M06
ELY
01st
ream
sedi
men
t72
.3<1
0.9
<0.6
7<0
.001
20.
253
.40.
013
4.1
0.04
80.
2<0
.000
9 E
B-7
70M
06EL
Y02
stre
am se
dim
ent
76.5
<10.
5<0
.64
0.00
125.
448
.30.
011
2.1
0.03
60.
3<0
.000
8 E
B-6
00M
06EL
Y03
stre
am se
dim
ent
79.4
<10.
1<0
.61
0.00
3613
.839
.40.
017
4.8
0.05
50.
65<0
.000
75 E
B-9
0M06
ELY
04st
ream
sedi
men
t75
.7<1
0.2
<0.6
3<0
.001
21.
112
4.4
0.01
90.
10.
013
0.05
2<0
.000
8 S
B-3
670M
06EL
Y05
stre
am se
dim
ent
68.8
<11.
6<0
.71
<0.0
012
0.02
433
.30.
013
3.6
0.03
90.
12<0
.000
9 S
B-2
400M
06EL
Y06
stre
am se
dim
ent
77.9
<10.
3<0
.64
<0.0
012
0.99
39.8
0.00
922.
80.
037
0.3
<0.0
008
SB
-136
0M06
ELY
07st
ream
sedi
men
t74
.9<1
0.3
<0.6
5<0
.001
21.
035
.80.
0087
3.2
0.04
40.
3<0
.000
8 S
B-1
40M
06EL
Y08
stre
am se
dim
ent
73.5
<10.
8<0
.66
<0.0
012
1.2
38.0
0.01
62.
90.
043
0.35
<0.0
0085
OR
-240
50M
06EL
Y09
stre
am se
dim
ent
72.8
<10.
9<0
.69
<0.0
012
0.01
725
.60.
014
2.4
0.03
60.
11<0
.000
85 O
R-2
3200
M06
ELY
10st
ream
sedi
men
t69
.7<1
1.5
<0.6
8<0
.001
20.
2719
.20.
0068
1.9
0.02
60.
14<0
.000
9Q
ualit
y-as
sura
nce,
qua
lity-
cont
rol s
ampl
es S
B-1
40M
06EL
Y08
Rfie
ld d
uplic
ate
73<1
0.9
<0.6
3<0
.001
21.
130
.10.
098
2.8
0.04
30.
41<0
.000
8 S
B-1
360M
06EL
Y07
REP
lab
repl
icat
e73
.6<1
0.6
<0.6
5<0
.001
21.
530
.60.
012.
80.
040.
28<0
.000
8 S
B-1
360M
06EL
Y07
MS
mat
rix sp
iked
sa
mpl
e-
63%
f74
%83
.30%
84.5
0%-
88.3
0%-
85.1
0%86
.10%
52.4
0%
Bla
nkB
LKSU
0829
06B
lab
blan
k-
96%
--
--
--
--
- B
lank
BLK
0831
06A
lab
blan
k-
92%
<0.5
<0.0
0089
<0.0
087
<0.2
7<0
.002
4<0
.003
<0.0
10.
019
<0.0
006
Spi
ked
LCS0
8310
6AM
Sm
atrix
spik
ed-
--
89.7
%90
.1%
-92
.9%
-90
.3%
90.5
%89
.8%
App
endi
x 4.
Ac
id v
olat
ile s
ulfid
e (A
VS),
sim
ulta
neou
sly
extra
ctab
le m
etal
s (S
EM),
and
parti
cle-
size
resu
lts fo
r stre
am s
edim
ents
and
qua
lity-
assu
ranc
e, q
ualit
y-co
ntro
l sa
mpl
es fo
r the
Ely
Min
e st
udy
area
, Ver
shire
, VT.
[%, p
erce
nt; m
g/kg
, mill
igra
ms p
er k
ilogr
am; µ
mol
/g, m
icro
mol
es p
er g
ram
; µm
, mic
rom
eter
; —
, not
det
erm
ined
; <, a
naly
te n
ot d
etec
ted
at th
e re
porti
ng le
vel]

94 Aquatic Assessment of the Ely Copper Mine Superfund Site, Vershire, Vermont
Site
No.
SEM
/AVS
e
Part
icle
siz
e of
soi
ls (p
erce
nt p
assi
ng)g
1.4
µm(%
)3.
2 µm
(%)
3.3
µm(%
)3.
4 µm
(%)
6.6
µm(%
)6.
7 µm
(%)
6.8
µm(%
)7
µm (%)
9.2
µm(%
)9.
3 µm
(%)
9.4
µm(%
)9.
5 µm
(%)
9.6
µm(%
)9.
7 µm
(%)
13.2
µm
(%)
13.3
µm
(%)
13.4
µm
(%)
Sam
ples
EB
-108
0M0
0.6
——
1—
2—
——
2—
——
—2.
6—
— E
B-7
70M
0–0
.4—
—–0
.1—
0.8
——
—1.
4—
——
——
—1.
4 E
B-6
00M
0–0
.3—
–0.3
—–0
.3—
——
——
——
—0.
3—
—0.
8 E
B-9
0M0
0.1
—0.
3—
——
0.8
——
——
—1.
4—
——
1.4
SB
-367
0M0
0.3
——
0.8
——
—0.
8—
—1.
1—
——
——
— S
B-2
400M
00.
2—
—0.
70.
7—
——
——
—1.
3—
——
—1.
8 S
B-1
360M
00.
1—
0.3
——
—0.
8—
——
—0.
8—
——
—1.
3 S
B-1
40M
00.
7—
0.9
—1.
2—
——
——
—2
——
——
2 O
R-2
4050
M0
0.9
1.6
——
——
1.6
——
2.5
——
——
——
2.5
OR
-232
00M
00.
7—
0.9
——
—1.
2—
1.4
——
——
——
—1.
8Q
ualit
y-as
sura
nce,
qua
lity-
cont
rol s
ampl
es S
B-1
40M
00.
3—
—0.
8—
——
0.8
——
——
0.8
——
——
SB
-136
0M0
0.7
0.9
——
——
1.5
——
—1.
5—
——
—2
— S
B-1
360M
——
——
——
——
——
——
——
——
——
Bla
nk—
——
——
——
——
——
——
——
——
— B
lank
——
——
——
——
——
——
——
——
——
Spi
ked
——
——
——
——
——
——
——
——
——
App
endi
x 4.
Ac
id v
olat
ile s
ulfid
e (A
VS),
sim
ulta
neou
sly
extra
ctab
le m
etal
s (S
EM),
and
parti
cle-
size
resu
lts fo
r stre
am s
edim
ents
and
qua
lity-
assu
ranc
e, q
ualit
y-co
ntro
l sa
mpl
es fo
r the
Ely
Min
e st
udy
area
, Ver
shire
, VT.
—Co
ntin
ued
[%, p
erce
nt; m
g/kg
, mill
igra
ms p
er k
ilogr
am; µ
mol
/g, m
icro
mol
es p
er g
ram
; µm
, mic
rom
eter
; —
, not
det
erm
ined
; <, a
naly
te n
ot d
etec
ted
at th
e re
porti
ng le
vel]

Appendix 4 95
Site
No.
Part
icle
siz
e of
soi
ls (p
erce
nt p
assi
ng)g (c
ont.)
13.5
µm
(%)
23 µ
m(%
)36
µm
(%)
37 µ
m(%
)75
µm
(%)
150
µm(%
)18
0 µm
(%)
250
µm(%
)42
5 µm
(%)
850
µm(%
)2,
000
µm(%
)4,
750
µm(%
)9,
500
µm(%
)19
,000
µm
(%)
25,0
00 µ
m(%
)37
,500
µm
(%)
Sam
ples
EB
-108
0M—
2.6
3.1
—6.
712
.916
.426
.243
.369
.993
.799
.110
010
010
010
0 E
B-7
70M
—1.
91.
9—
12.3
17.2
19.3
24.9
34.4
47.8
62.2
79.3
89.6
100
100
100
EB
-600
M—
0.8
—0.
812
.213
.414
16.5
23.3
39.5
62.8
86.5
9910
010
010
0 E
B-9
0M—
1.4
2—
5.5
8.6
11.1
18.1
29.2
42.5
58.7
8810
010
010
010
0 S
B-3
670M
1.7
2.2
—2.
25.
67.
78.
516
.438
.876
.897
.899
.899
.810
010
010
0 S
B-2
400M
—1.
8—
1.8
12.7
14.1
14.8
19.1
2844
.264
.584
.196
.410
010
010
0 S
B-1
360M
—1.
3—
1.3
1112
.313
.418
.532
.963
91.2
98.7
100
100
100
100
SB
-140
M—
2—
25.
76.
77.
211
.326
.763
.387
.795
.910
010
010
010
0 O
R-2
4050
M—
2.5
—2.
55.
711
12.9
27.5
59.9
86.4
95.4
99.6
100
100
100
100
OR
-232
00M
—1.
8—
1.8
7.9
8.5
8.9
13.1
3361
.375
.283
.792
.710
010
010
0Q
ualit
y-as
sura
nce,
qua
lity-
cont
rol s
ampl
es S
B-1
40M
1.7
1.7
—1.
74.
45.
45.
911
.130
6889
.997
.199
.110
010
010
0 S
B-1
360M
—2
2—
6.3
7.6
8.8
14.1
29.1
59.8
89.1
98.5
100
100
100
100
SB
-136
0M—
——
——
——
——
——
——
——
— B
lank
——
——
——
——
——
——
——
——
Bla
nk—
——
——
——
——
——
——
——
— S
pike
d—
——
——
——
——
——
——
——
—
App
endi
x 4.
Ac
id v
olat
ile s
ulfid
e (A
VS),
sim
ulta
neou
sly
extra
ctab
le m
etal
s (S
EM),
and
parti
cle-
size
resu
lts fo
r stre
am s
edim
ents
and
qua
lity-
assu
ranc
e, q
ualit
y-co
ntro
l sa
mpl
es fo
r the
Ely
Min
e st
udy
area
, Ver
shire
, VT.
—Co
ntin
ued
[%, p
erce
nt; m
g/kg
, mill
igra
ms p
er k
ilogr
am; µ
mol
/g, m
icro
mol
es p
er g
ram
; µm
, mic
rom
eter
; —
, not
det
erm
ined
; <, a
naly
te n
ot d
etec
ted
at th
e re
porti
ng le
vel]

96 Aquatic Assessment of the Ely Copper Mine Superfund Site, Vershire, Vermont
Site
No.
Soil
frac
tions
50,0
00 µ
m(%
)75
,000
µm
(%)
Gra
vel
(%)
Coar
se s
and
(%)
Med
ium
san
d(%
)Fi
ne s
and
(%)
Silt
(%)
Clay
(%
)
Sam
ples
EB
-108
0M10
010
00.
95.
450
.436
.74.
72
EB
-770
M10
010
020
.717
27.8
22.1
11.5
0.8
EB
-600
M10
010
013
.523
.739
.511
.112
.4–0
.3 E
B-9
0M10
010
012
29.3
29.4
23.7
4.6
0.8
SB
-367
0M10
010
00.
22
5933
.24.
80.
8 S
B-2
400M
100
100
15.9
19.7
36.5
15.3
120.
7 S
B-1
360M
100
100
1.3
7.5
58.3
21.9
10.2
0.8
SB
-140
M10
010
04.
18.
260
.921
4.5
1.2
OR
-240
50M
100
100
0.4
4.2
35.5
54.2
4.1
1.6
OR
-232
00M
100
100
16.3
8.5
42.2
25.1
6.7
1.2
Qua
lity-
assu
ranc
e, q
ualit
y-co
ntro
l sam
ples
SB
-140
M10
010
02.
97.
259
.925
.63.
60.
8 S
B-1
360M
100
100
1.5
9.3
60.1
22.8
4.8
1.5
SB
-136
0M—
——
——
——
— B
lank
——
——
——
——
Bla
nk—
——
——
——
— S
pike
d—
——
——
——
—a S
olid
s det
erm
ined
by
Met
hod
IN62
3.b A
cid
solu
ble
sulfi
de (t
otal
sulfi
de) d
etem
ined
by
SW84
6 M
etho
d 90
30B
/903
4.c A
cid
vola
tile
sulfi
de d
eter
min
ed b
y SW
846
Met
hod
6010
B.
d Sim
ulta
neou
sly
extra
ctab
le m
etal
s det
emin
ed b
y SW
846
Met
hod
6010
B(I
CP-
AES
) for
all
met
als e
xcep
t Hg,
whi
ch w
as d
eter
min
ed b
y M
etho
d 74
71A
(col
d-va
por a
tom
ic a
bsor
ptio
n).
e SEM
/AV
S is
the
sum
of t
he c
once
ntra
tions
of a
ll m
etal
s div
ided
by
AVS,
whi
ch in
this
stud
y w
as le
ss th
an th
e de
tect
ion
limit.
f Rec
over
y fo
r spi
ked
sam
ple.
g Per
cent
age
of p
artic
les t
hat p
asse
d th
roug
h si
eve
size
det
erm
ined
by
AST
M D
422.
App
endi
x 4.
Ac
id v
olat
ile s
ulfid
e (A
VS),
sim
ulta
neou
sly
extra
ctab
le m
etal
s (S
EM),
and
parti
cle-
size
resu
lts fo
r stre
am s
edim
ents
and
qu
ality
-ass
uran
ce, q
ualit
y-co
ntro
l sam
ples
for t
he E
ly M
ine
stud
y ar
ea, V
ersh
ire, V
T.—
Cont
inue
d
[%, p
erce
nt; m
g/kg
, mill
igra
ms p
er k
ilogr
am; µ
mol
/g, m
icro
mol
es p
er g
ram
; µm
, mic
rom
eter
; —
, not
det
erm
ined
; <, a
naly
te n
ot d
etec
ted
at th
e re
porti
ng le
vel]

Appendix 5 97
Appendix 5. Summary of select constituents in surface waters relative to ambient water-quality criteria (AWQC) for stream reaches in the Ely Mine study area, Vershire, VT, 2000 to 2007.
[Values in italics are estimated; chronic, average allowable concentration; >, greater than; <, less than; %, percent; SE, standard error; UCL, upper confidence level; Q3, 75th percentile; Q1, 25th percentile; mg/L, micrograms per liter]
ElementAWQC
chronic(µg/L)
Ely Brook from river meter 0 to 350
Samples DetectsDetects>AWQC
Samplesused inanalysis
Maximum(µg/L)
MeanQ3
(µg/L)Median(µg/L)
Q1(µg/L)Value
(µg/L)SE
(µg/L)95% UCL
(µg/L)
Aluminuma 87 16 16 15 16 7,900 3,830 491 4,690 5,100 4,000 2,750Antimonyb 104 14 6 0 10 0.13 0.04 0.01 0.07 0.06 0.03 0.02Arsenicc 190 14 3 0 11 .51 .15 .04 .22 .14 .08 .08Bariumb 3.8 14 14 14 14 40 19 2.1 23 23 16 13Berylliumb 5.09 14 11 0 14 .50 .18 .03 .23 .23 .16 .09Cadmiumc, d 1.1 14 14 12 14 4.70 2.27 .37 2.92 3.23 2.25 1.28Chromiumc 11 15 12 0 15 5.0 1.9 .3 2.5 2.4 1.4 1.0Cobaltb 3.06 15 15 14 15 170 66.4 11.5 86.6 86.0 63.0 36.9Copperc, d 11.8 15 15 14 15 3,400 1,580 218 1,960 1,900 1,560 1,270Ironc 1,000 11 10 9 11 13,000 5,990 1,380 8,500 11,900 5,600 2,180Leadc, d 3.2 15 9 0 13 .95 .38 .08 .52 .51 .28 .22Manganeseb 80.3 15 15 13 15 1,100 362 66 479 460 320 223Mercurya .012 8 1 1 3 .01 Nickelc, d 158 15 15 0 15 36 17 2.4 21 23 17 11
Seleniumc 5 15 8 0 12 .8 .5 .1 .6 .7 .5 .3
Silverb .36 15 4 1 11 .40 .04 .04 .10 .01 <.01 <.01Strontiumb 620 13 13 0 13 120 63 8 78 80 60 40Thalliumb 18 15 4 0 12 .06 .04 .003 .04 .05 .04 .03 Uraniumb 1.87 9 9 0 9 .68 .37 .07 .51 .53 .41 .18Vanadiumb 19.1 15 5 0 12 .20 .10 .01 .12 .11 .09 .08Zincc, d 106 15 15 13 15 590 290 40 360 391 300 182
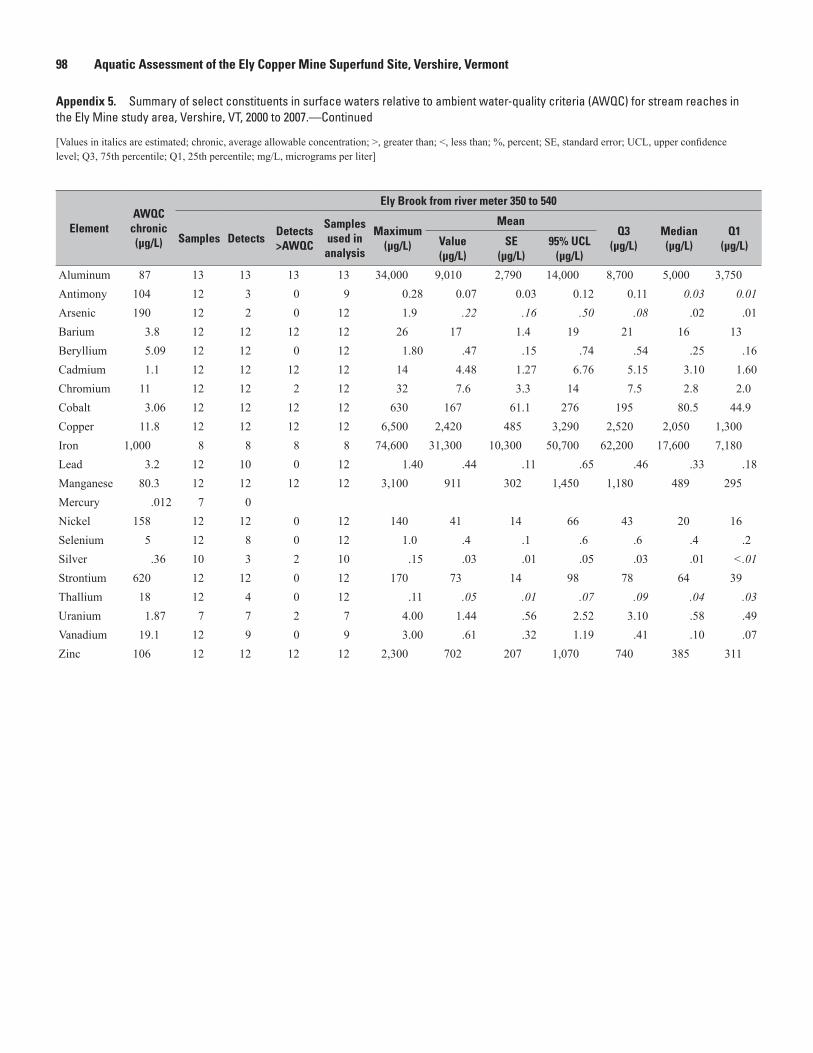
98 Aquatic Assessment of the Ely Copper Mine Superfund Site, Vershire, Vermont
ElementAWQC
chronic(µg/L)
Ely Brook from river meter 350 to 540
Samples DetectsDetects>AWQC
Samplesused inanalysis
Maximum(µg/L)
MeanQ3
(µg/L)Median(µg/L)
Q1(µg/L)Value
(µg/L)SE
(µg/L)95% UCL
(µg/L)
Aluminum 87 13 13 13 13 34,000 9,010 2,790 14,000 8,700 5,000 3,750Antimony 104 12 3 0 9 0.28 0.07 0.03 0.12 0.11 0.03 0.01Arsenic 190 12 2 0 12 1.9 .22 .16 .50 .08 .02 .01Barium 3.8 12 12 12 12 26 17 1.4 19 21 16 13Beryllium 5.09 12 12 0 12 1.80 .47 .15 .74 .54 .25 .16Cadmium 1.1 12 12 12 12 14 4.48 1.27 6.76 5.15 3.10 1.60Chromium 11 12 12 2 12 32 7.6 3.3 14 7.5 2.8 2.0Cobalt 3.06 12 12 12 12 630 167 61.1 276 195 80.5 44.9Copper 11.8 12 12 12 12 6,500 2,420 485 3,290 2,520 2,050 1,300Iron 1,000 8 8 8 8 74,600 31,300 10,300 50,700 62,200 17,600 7,180Lead 3.2 12 10 0 12 1.40 .44 .11 .65 .46 .33 .18Manganese 80.3 12 12 12 12 3,100 911 302 1,450 1,180 489 295Mercury .012 7 0 Nickel 158 12 12 0 12 140 41 14 66 43 20 16Selenium 5 12 8 0 12 1.0 .4 .1 .6 .6 .4 .2Silver .36 10 3 2 10 .15 .03 .01 .05 .03 .01 <.01Strontium 620 12 12 0 12 170 73 14 98 78 64 39Thallium 18 12 4 0 12 .11 .05 .01 .07 .09 .04 .03Uranium 1.87 7 7 2 7 4.00 1.44 .56 2.52 3.10 .58 .49Vanadium 19.1 12 9 0 9 3.00 .61 .32 1.19 .41 .10 .07Zinc 106 12 12 12 12 2,300 702 207 1,070 740 385 311
Appendix 5. Summary of select constituents in surface waters relative to ambient water-quality criteria (AWQC) for stream reaches in the Ely Mine study area, Vershire, VT, 2000 to 2007.—Continued
[Values in italics are estimated; chronic, average allowable concentration; >, greater than; <, less than; %, percent; SE, standard error; UCL, upper confidence level; Q3, 75th percentile; Q1, 25th percentile; mg/L, micrograms per liter]

Appendix 5 99
ElementAWQC
chronic(µg/L)
Ely Brook from river meter 540 to 800
Samples DetectsDetects>AWQC
Samplesused inanalysis
Maximum(µg/L)
MeanQ3
(µg/L)Median(µg/L)
Q1(µg/L)Value
(µg/L)SE
(µg/L)95% UCL
(µg/L)
Aluminum 87 6 6 5 6 17,900 3,380 2,910 9,250 5,460 445 140Antimony 104 5 0Arsenic 190 5 0Barium 3.8 5 5 5 5 20 16 1.3 19 19 16 13Beryllium 5.09 5 2 0 2 .06Cadmium 1.1 5 5 0 5 .95 .47 .14 .75 .73 .45 .21Chromium 11 5 3 0 3 .10Cobalt 3.06 5 5 5 5 31.1 13.3 4.64 23.1 22.0 10.0 6.20Copper 11.8 5 5 5 5 837 344 131 625 611 218 142Iron 1,000 2 1 0 2 52 Lead 3.2 5 2 0 2 .1Manganese 80.3 5 5 2 5 217 96.3 31.7 164 155 78.0 46.2Mercury .012 5 0Nickel 158 5 5 0 5 12 6.0 1.7 9.5 9.2 5.6 3.0Selenium 5 5 1 1 .2Silver .36 5 0Strontium 620 5 5 0 5 62 45 6 58 57 50 30Thallium 18 5 0Uranium 1.87 2 1 2 .11Vanadium 19.1 5 3 0 3 .10Zinc 106 5 5 1 5 114 56 15 88 84 47 31
Appendix 5. Summary of select constituents in surface waters relative to ambient water-quality criteria (AWQC) for stream reaches in the Ely Mine study area, Vershire, VT, 2000 to 2007.—Continued
[Values in italics are estimated; chronic, average allowable concentration; >, greater than; <, less than; %, percent; SE, standard error; UCL, upper confidence level; Q3, 75th percentile; Q1, 25th percentile; mg/L, micrograms per liter]

100 Aquatic Assessment of the Ely Copper Mine Superfund Site, Vershire, Vermont
ElementAWQC
chronic(µg/L)
Ely Brook above river meter 800
Samples DetectsDetects>AWQC
Samplesused in
analysis
Maximum(µg/L)
MeanQ3
(µg/L)Median(µg/L)
Q1(µg/L)Value
(µg/L)SE
(µg/L)95% UCL
(µg/L)
Aluminum 87 10 10 4 10 240 81 25 126 135 48 15Antimony 104 10 3 0 7 0.31 0.06 0.04 0.15 0.05 0.01 <0.01Arsenic 190 10 2 0 8 .40 .12 .04 .20 .16 .08 .04Barium 3.8 10 10 10 10 30 19 1.6 22 22 18 15Beryllium 5.09 10 0Cadmium 1.1 10 0Chromium 11 10 4 0 4 .2Cobalt 3.06 10 4 0 10 .14 .05 .01 .08 .09 .03 .02Copper 11.8 10 8 0 10 6.9 1.9 .6 3.0 1.9 1.4 1.1Iron 1,000 6 1 0 6 22Lead 3.2 10 3 0 8 .09 .04 .009 .05 .05 .03 .02Manganese 80.3 10 10 2 10 124 22.4 14.3 48.5 24 1.75 .76Mercury .012 5 0Nickel 158 10 8 0 10 .7 .3 .1 .4 .5 .4 .1Selenium 5 10 0Silver .36 10 2 0 6 .03 .01 .004 .02 .02 <.01 <.01Strontium 620 10 10 0 10 48 32 3 38 41 30 22Thallium 18 10 0Uranium 1.87 6 5 0 5 .01 .01 .0005 .01 .01 .01 .01Vanadium 19.1 10 4 0 9 .2 .11 .01 .14 .14 .10 .09Zinc 106 10 10 0 10 33 12 3 18 22 8 3
Appendix 5. Summary of select constituents in surface waters relative to ambient water-quality criteria (AWQC) for stream reaches in the Ely Mine study area, Vershire, VT, 2000 to 2007.—Continued
[Values in italics are estimated; chronic, average allowable concentration; >, greater than; <, less than; %, percent; SE, standard error; UCL, upper confidence level; Q3, 75th percentile; Q1, 25th percentile; mg/L, micrograms per liter]

Appendix 5 101
ElementAWQC
chronic(µg/L)
Ely Brook Tributary 1
Samples DetectsDetects>AWQC
Samplesused inanalysis
Maximum(µg/L)
MeanQ3
(µg/L)Median(µg/L)
Q1(µg/L)Value
(µg/L)SE
(µg/L)95% UCL
(µg/L)
Aluminum 87 6 6 2 6 3,300 597 541 1,990 892 62 39Antimony 104 6 0Arsenic 190 6 2 0 2 .14Barium 3.8 6 6 6 6 31 16 3.2 23 23 14 10Beryllium 5.09 6 1 0 .2Cadmium 1.1 6 4 1 4 1.90 .35 .31 .98 Chromium 11 6 4 0 4 .5 .3 .1 .5 Cobalt 3.06 6 6 1 6 32.7 5.59 5.42 16.5 8.44 .18 .06Copper 11.8 6 6 5 6 2,460 420 407 1,240 629 14.9 10.3Iron 1,000 3 2 0 3 133 52 41 171Lead 3.2 6 1 0 3 .05Manganese 80.3 6 6 1 6 224 39.3 37.1 114 60.3 2.2 .7Mercury .012 5 0Nickel 158 6 6 0 6 12.1 2.5 1.9 6.4 3.7 .7 .3Selenium 5 6 2 0 3 .4 Silver .36 6 0Strontium 620 6 6 0 6 40 24 4 31 32 20 16Thallium 18 6 0Uranium 1.87 2 2 0 2 .03Vanadium 19.1 6 2 0 5 .15 .08 .02 .13 .13 .06 .05 Zinc 106 6 6 1 6 171 38 27 92 63 12 4
Appendix 5. Summary of select constituents in surface waters relative to ambient water-quality criteria (AWQC) for stream reaches in the Ely Mine study area, Vershire, VT, 2000 to 2007.—Continued
[Values in italics are estimated; chronic, average allowable concentration; >, greater than; <, less than; %, percent; SE, standard error; UCL, upper confidence level; Q3, 75th percentile; Q1, 25th percentile; mg/L, micrograms per liter]
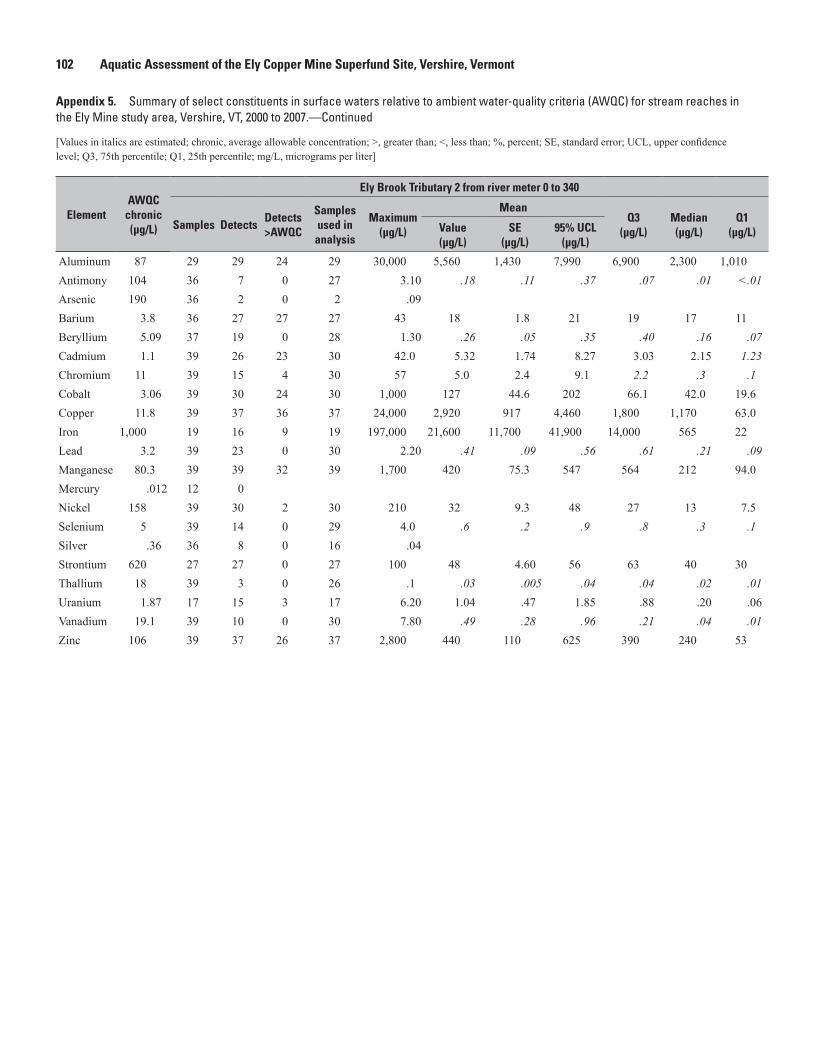
102 Aquatic Assessment of the Ely Copper Mine Superfund Site, Vershire, Vermont
ElementAWQC
chronic(µg/L)
Ely Brook Tributary 2 from river meter 0 to 340
Samples DetectsDetects>AWQC
Samplesused inanalysis
Maximum(µg/L)
MeanQ3
(µg/L)Median(µg/L)
Q1(µg/L)Value
(µg/L)SE
(µg/L)95% UCL
(µg/L)
Aluminum 87 29 29 24 29 30,000 5,560 1,430 7,990 6,900 2,300 1,010Antimony 104 36 7 0 27 3.10 .18 .11 .37 .07 .01 <.01 Arsenic 190 36 2 0 2 .09Barium 3.8 36 27 27 27 43 18 1.8 21 19 17 11Beryllium 5.09 37 19 0 28 1.30 .26 .05 .35 .40 .16 .07 Cadmium 1.1 39 26 23 30 42.0 5.32 1.74 8.27 3.03 2.15 1.23Chromium 11 39 15 4 30 57 5.0 2.4 9.1 2.2 .3 .1Cobalt 3.06 39 30 24 30 1,000 127 44.6 202 66.1 42.0 19.6Copper 11.8 39 37 36 37 24,000 2,920 917 4,460 1,800 1,170 63.0Iron 1,000 19 16 9 19 197,000 21,600 11,700 41,900 14,000 565 22Lead 3.2 39 23 0 30 2.20 .41 .09 .56 .61 .21 .09Manganese 80.3 39 39 32 39 1,700 420 75.3 547 564 212 94.0Mercury .012 12 0Nickel 158 39 30 2 30 210 32 9.3 48 27 13 7.5Selenium 5 39 14 0 29 4.0 .6 .2 .9 .8 .3 .1Silver .36 36 8 0 16 .04Strontium 620 27 27 0 27 100 48 4.60 56 63 40 30Thallium 18 39 3 0 26 .1 .03 .005 .04 .04 .02 .01Uranium 1.87 17 15 3 17 6.20 1.04 .47 1.85 .88 .20 .06Vanadium 19.1 39 10 0 30 7.80 .49 .28 .96 .21 .04 .01Zinc 106 39 37 26 37 2,800 440 110 625 390 240 53
Appendix 5. Summary of select constituents in surface waters relative to ambient water-quality criteria (AWQC) for stream reaches in the Ely Mine study area, Vershire, VT, 2000 to 2007.—Continued
[Values in italics are estimated; chronic, average allowable concentration; >, greater than; <, less than; %, percent; SE, standard error; UCL, upper confidence level; Q3, 75th percentile; Q1, 25th percentile; mg/L, micrograms per liter]

Appendix 5 103
ElementAWQC
chronic(µg/L)
Ely Brook Tributary 2 above river meter 340
Samples DetectsDetects>AWQC
Samplesused inanalysis
Maximum(µg/L)
MeanQ3
(µg/L)Median(µg/L)
Q1(µg/L)Value
(µg/L)SE
(µg/L)95% UCL
(µg/L)
Aluminum 87 9 9 2 9 430 114 56 219 232 30 18Antimony 104 15 4 0 9 1.10 .48 .10 .66 .70 .36 .26Arsenic 190 15 2 0 9 1.00 .24 .10 .42 .23 .13 .11Barium 3.8 15 9 9 9 30 17 1.9 20 18 17 13Beryllium 5.09 15 0Cadmium 1.1 15 2 0 8 .08 .01 .01 .03 .02 <.01 <.01Chromium 11 15 2 0 9 2.0 .4 .2 .8 .5 .2 .1Cobalt 3.06 15 9 0 9 .66 .23 .08 .37 .42 .13 .04Copper 11.8 15 9 0 9 11.0 2.3 1.1 4.4 2.3 1.0 .7Iron 1000 8 8 0 8 560 297 63 415 415 316 113Lead 3.2 15 6 0 9 .10 .07 .01 .08 .10 .06 .04Manganese 80.3 15 9 6 9 1,300 395 161 695 767 201 15.1Mercury .012 1 0Nickel 158 15 7 0 9 2.7 .7 .3 1.2 .7 .6 .1Selenium 5 15 1 0 5 .5Silver .36 11 3 0 6 .04 .02 .005 .03 .02 .01 .01Strontium 620 9 9 0 9 57 32 4 40 42 30 20Thallium 18 15 0Uranium 1.87 8 4 0 5 .01 .01 .001 .01 .01 .01 <.01Vanadium 19.1 15 6 0 9 .70 .25 .06 .36 .32 .20 .12Zinc 106 15 12 0 12 44 18 5 27 37 11 2
Appendix 5. Summary of select constituents in surface waters relative to ambient water-quality criteria (AWQC) for stream reaches in the Ely Mine study area, Vershire, VT, 2000 to 2007.—Continued
[Values in italics are estimated; chronic, average allowable concentration; >, greater than; <, less than; %, percent; SE, standard error; UCL, upper confidence level; Q3, 75th percentile; Q1, 25th percentile; mg/L, micrograms per liter]

104 Aquatic Assessment of the Ely Copper Mine Superfund Site, Vershire, Vermont
ElementAWQC
chronic(µg/L)
Ely Brook Tributary 3
Samples DetectsDetects>AWQC
Samplesused inanalysis
Maximum(µg/L)
MeanQ3
(µg/L)Median(µg/L)
Q1(µg/L)Value
(µg/L)SE
(µg/L)95% UCL
(µg/L)
Aluminum 87 23 23 23 23 30,000 19,300 1,710 22,300 26,000 22,000 9,900Antimony 104 23 4 0 18 .45 .03 .02 .08 .02 <.01 <.01Arsenic 190 23 0Barium 3.8 23 23 22 23 25 14 1.3 16 20 12 10Beryllium 5.09 23 23 0 23 1.90 .88 .11 1.06 1.20 .80 .47Cadmium 1.1 23 23 22 23 23.0 8.33 1.33 10.6 11.3 6.20 3.00Chromium 11 23 22 9 23 21 9.7 1.0 11 12 9 6.3Cobalt 3.06 23 23 23 23 490 231 29.0 281 360 220 94.0Copper 11.8 23 23 22 23 19,000 7,200 1,150 9,150 12,000 7,000 2,600Iron 1,000 17 17 16 17 100,000 26,300 7,580 39,500 32,400 15,000 4,500Lead 3.2 23 22 1 23 5.00 .89 .22 1.27 1.10 .60 .27Manganese 80.3 23 23 23 23 3,600 1,660 172 1,960 2,100 1,780 1,080Mercury .012 10 0Nickel 158 23 23 0 23 140 67 7.6 80 100 60 35Selenium 5 23 14 1 23 5.0 1.2 .3 1.7 3.0 .5 .2Silver .36 23 16 0 21 .12 .04 .01 .06 .07 .03 .01Strontium 620 23 23 0 23 180 93 9 108 130 100 60Thallium 18 23 12 0 21 .16 .07 .01 .08 .10 .06 .04Uranium 1.87 15 15 6 15 3.60 1.87 .28 2.36 2.90 1.60 1.20Vanadium 19.1 23 9 0 23 5.80 .77 .37 1.41 .30 .05 .01Zinc 106 23 23 23 23 2,700 1,080 135 1,310 1,460 850 590
Appendix 5. Summary of select constituents in surface waters relative to ambient water-quality criteria (AWQC) for stream reaches in the Ely Mine study area, Vershire, VT, 2000 to 2007.—Continued
[Values in italics are estimated; chronic, average allowable concentration; >, greater than; <, less than; %, percent; SE, standard error; UCL, upper confidence level; Q3, 75th percentile; Q1, 25th percentile; mg/L, micrograms per liter]

Appendix 5 105
ElementAWQC
chronic(µg/L)
Ely Brook Tributary 4
Samples DetectsDetects>AWQC
Samplesused inanalysis
Maximum(µg/L)
MeanQ3
(µg/L)Median(µg/L)
Q1(µg/L)Value
(µg/L)SE
(µg/L)95% UCL
(µg/L)
Aluminum 87 5 5 5 5 >200,000 47,600 32,300 112,800 102,500 5,850 2,250Antimony 104 6 2 0 6 .08 .04 .01 .06 .06 .03 .02Arsenic 190 6 2 0 3 .42Barium 3.8 6 6 6 6 38 24 5.2 35 37 26 12Beryllium 5.09 6 6 0 6 2.70 1.05 .48 2.01 2.48 .42 .19Cadmium 1.1 6 6 6 6 25.0 9.48 4.61 18.8 23.5 2.85 1.80Chromium 11 6 5 2 6 120 33 21 77 88 .6 .4Cobalt 3.06 6 6 6 6 1,600 539 305 1,150 1,450 85.2 37.0Copper 11.8 6 6 6 6 76,000 22,800 13,400 49,800 58,000 3,260 1,260Iron 1000 3 2 2 3 17,000Lead 3.2 6 5 0 6 .29 .17 .04 .24 .22 .18 .08Manganese 80.3 6 6 6 6 5,700 2,090 1,070 4,240 5,320 616 217Mercury .012 3 0Nickel 158 6 6 2 6 380 136 72.6 283 358 33.0 12.0Selenium 5 6 4 2 6 6.4 2.3 1.2 4.7 5.9 .7 .2Silver .36 6 2 0 3 .07Strontium 620 6 6 0 6 180 106 29 164 180 110 30Thallium 18 6 4 0 6 .20 .11 .03 .16 .18 .08 .06Uranium 1.87 3 3 2 3 8.20Vanadium 19.1 6 1 0 2 .07Zinc 106 6 6 6 6 2,500 965 456 1,880 2,350 308 202
Appendix 5. Summary of select constituents in surface waters relative to ambient water-quality criteria (AWQC) for stream reaches in the Ely Mine study area, Vershire, VT, 2000 to 2007.—Continued
[Values in italics are estimated; chronic, average allowable concentration; >, greater than; <, less than; %, percent; SE, standard error; UCL, upper confidence level; Q3, 75th percentile; Q1, 25th percentile; mg/L, micrograms per liter]

106 Aquatic Assessment of the Ely Copper Mine Superfund Site, Vershire, Vermont
ElementAWQC
chronic(µg/L)
Schoolhouse Brook from river meter 0 to 2,915
Samples DetectsDetects>AWQC
Samplesused inanalysis
Maximum(µg/L)
MeanQ3
(µg/L)Median(µg/L)
Q1(µg/L)Value
(µg/L)SE
(µg/L)95% UCL
(µg/L)
Aluminum 87 16 16 14 16 700 226 39 293 263 208 142Antimony 104 15 5 0 14 1.70 .16 .12 .37 .08 .02 <.01Arsenic 190 15 0Barium 3.8 15 15 15 15 325 42 20 78 25 18 15Beryllium 5.09 15 0Cadmium 1.1 19 12 0 17 .25 .09 .01 .12 .13 .08 .05Chromium 11 19 3 0 3 .21Cobalt 3.06 19 17 8 19 5.80 2.39 .34 2.98 3.40 2.30 1.40Copper 11.8 19 18 16 19 85.0 32.1 4.9 40.6 41.0 26.2 20.4Iron 1,000 12 7 0 12 120 39 11 58 62 20 12Lead 3.2 19 5 0 15 .87 .10 .06 .20 .10 .03 .01Manganese 80.3 19 19 0 19 35.9 17.2 2.2 20.9 23.0 16.6 13.6Mercury .012 8 1 1 2 .17Nickel 158 19 18 0 19 1.7 1.0 1.0 1.1 1.3 1.0 .7Selenium 5 19 3 0 9 .5Silver .36 19 1 0 8 .06Strontium 620 14 14 0 14 230 133 14 158 161 145 77Thallium 18 19 0Uranium 1.87 11 11 0 11 .52 .23 .05 .32 .32 .24 .05Vanadium 19.1 19 5 0 15 .30 .11 .02 .14 .13 .09 .06Zinc 106 19 19 0 19 69 18 4 25 20 14 8
Appendix 5. Summary of select constituents in surface waters relative to ambient water-quality criteria (AWQC) for stream reaches in the Ely Mine study area, Vershire, VT, 2000 to 2007.—Continued
[Values in italics are estimated; chronic, average allowable concentration; >, greater than; <, less than; %, percent; SE, standard error; UCL, upper confidence level; Q3, 75th percentile; Q1, 25th percentile; mg/L, micrograms per liter]

Appendix 5 107
ElementAWQC
chronic(µg/L)
Schoolhouse Brook from river meter 2,915 to 3,270
Samples DetectsDetects>AWQC
Samplesused inanalysis
Maximum(µg/L)
MeanQ3
(µg/L)Median(µg/L)
Q1(µg/L)Value
(µg/L)SE
(µg/L)95% UCL
(µg/L)
Aluminum 87 17 17 15 17 1,400 409 75 540 455 360 280Antimony 104 16 6 0 11 .78 .11 .07 .23 .10 .02 .01Arsenic 190 16 3 0Barium 3.8 16 16 16 16 289 41 17 71 28 19 16Beryllium 5.09 16 0Cadmium 1.1 20 12 0 17 .46 .16 .02 .20 .21 .13 .10Chromium 11 20 6 0 11 .54 .23 .04 .30 .29 .18 .15Cobalt 3.06 20 20 16 20 11.0 4.56 .48 5.40 5.28 3.95 3.22Copper 11.8 20 20 20 20 110 54.8 6.2 65.5 79.5 47.5 33.4Iron 1,000 13 9 0 13 190 72 17 103 135 49 19Lead 3.2 20 2 0 11 .07 .04 .004 .04 .04 .03 .02Manganese 80.3 20 20 0 20 62.0 33.6 2.3 37.7 39.9 34.0 27.4Mercury .012 12 2 2 4 .14Nickel 158 20 19 0 20 2.3 1.4 .1 1.6 1.7 1.4 1.2Selenium 5 20 4 0 11 .4 .2 .03 .2 .3 .1 .1Silver .36 20 1 0 8 .02Strontium 620 15 15 0 15 260 135 16 162 160 157 76Thallium 18 20 0Uranium 1.87 9 9 0 9 .55 .23 .07 .36 .42 .14 .05Vanadium 19.1 20 7 0 18 .20 .11 .01 .12 .13 .10 .08Zinc 106 20 20 0 20 63 26 3 31 29 20 17
Appendix 5. Summary of select constituents in surface waters relative to ambient water-quality criteria (AWQC) for stream reaches in the Ely Mine study area, Vershire, VT, 2000 to 2007.—Continued
[Values in italics are estimated; chronic, average allowable concentration; >, greater than; <, less than; %, percent; SE, standard error; UCL, upper confidence level; Q3, 75th percentile; Q1, 25th percentile; mg/L, micrograms per liter]

108 Aquatic Assessment of the Ely Copper Mine Superfund Site, Vershire, Vermont
ElementAWQC
chronic(µg/L)
Schoolhouse Brook above river meter 3,270
Samples DetectsDetects>AWQC
Samplesused inanalysis
Maximum(µg/L)
MeanQ3
(µg/L)Median(µg/L)
Q1(µg/L)Value
(µg/L)SE
(µg/L)95% UCL
(µg/L)
Aluminum 87 13 13 6 13 730 163 60 270 228 52 32Antimony 104 12 4 0 9 .22 .06 .02 .10 .09 .02 .01Arsenic 190 12 0Barium 3.8 12 12 12 12 110 33 8.4 48 28 23 18Beryllium 5.09 12 0Cadmium 1.1 14 1 0 14 .02Chromium 11 14 3 0 5 .58Cobalt 3.06 14 4 0 14 1.90 .17 .14 .42 .04 <.01 <.01Copper 11.8 14 6 0 14 1.1 .5 .1 .7 .9 .4 .3Iron 1,000 9 0Lead 3.2 14 5 0 14 1.90 .16 .13 .40 .05 .01 <.01Manganese 80.3 14 14 0 14 8.5 5.6 .3 6.2 6.0 5.5 5.0Mercury .012 4 0Nickel 158 14 6 0 13 .9 .3 .1 .4 .5 .2 .1Selenium 5 14 0Silver .36 14 0Strontium 620 11 11 0 11 230 134 19 168 170 130 82Thallium 18 14 0Uranium 1.87 9 9 0 9 .64 .25 .08 .39 .44 .16 .07Vanadium 19.1 14 5 0 12 .40 .16 .03 .21 .20 .13 .07Zinc 106 14 13 0 14 49 13 4 20 24 4 2
Appendix 5. Summary of select constituents in surface waters relative to ambient water-quality criteria (AWQC) for stream reaches in the Ely Mine study area, Vershire, VT, 2000 to 2007.—Continued
[Values in italics are estimated; chronic, average allowable concentration; >, greater than; <, less than; %, percent; SE, standard error; UCL, upper confidence level; Q3, 75th percentile; Q1, 25th percentile; mg/L, micrograms per liter]

Appendix 5 109
ElementAWQC
chronic(µg/L)
Ompompanoosuc River from river meter 8,350 to 20,000
Samples DetectsDetects>AWQC
Samplesused inanalysis
Maximum(µg/L)
MeanQ3
(µg/L)Median(µg/L)
Q1(µg/L)Value
(µg/L)SE
(µg/L)95% UCL
(µg/L)
Aluminum 87 20 17 13 20 379 131 23 172 198 94 62Antimony 104 15 4 0 7 .28Arsenic 190 15 1 0 6 0.3Barium 3.8 15 15 15 15 374 112 38 180 337 24 19Beryllium 5.09 15 1 0 15 1.2Cadmium 1.1 15 3 0 7 .03Chromium 11 15 4 0 15 3.4 .7 .3 1.2 .6 .2 .1Cobalt 3.06 15 6 0 14 1.10 .25 .07 .38 .31 .17 .07Copper 11.8 15 14 0 15 11.0 4.6 .9 6.2 8.5 3.0 1.5Iron 1,000 9 3 0 9 42 17 4 24 25 13 8Lead 3.2 15 4 0 14 2.60 .53 .27 1.01 .57 .01 <.01Manganese 80.3 15 15 1 15 160 25.0 9.9 42.4 21.9 15.1 9.5Mercury .012 10 2 2 10 .16 .06 .01 .09 .09 .05 .03Nickel 158 15 6 0 15 4.2 .4 .3 .9 .3 .1 .1Selenium 5 15 1 0 15 3.6Silver .36 15 2 2 12 .42 .23 .02 .28 .27 .21 .16Strontium 620 7 7 0 7 230 118 26 168 190 99 60Thallium 18 15 1 0 10 5.0Uranium 1.87 7 7 0 7 .64 .21 .08 .36 .32 .12 .05Vanadium 19.1 15 3 0 7 .30Zinc 106 15 15 0 15 62 16 4 24 21 13 2
Appendix 5. Summary of select constituents in surface waters relative to ambient water-quality criteria (AWQC) for stream reaches in the Ely Mine study area, Vershire, VT, 2000 to 2007.—Continued
[Values in italics are estimated; chronic, average allowable concentration; >, greater than; <, less than; %, percent; SE, standard error; UCL, upper confidence level; Q3, 75th percentile; Q1, 25th percentile; mg/L, micrograms per liter]

110 Aquatic Assessment of the Ely Copper Mine Superfund Site, Vershire, Vermont
ElementAWQC
chronic(µg/L)
Ompompanoosuc River from river meter 20,000 to 23,640
Samples DetectsDetects>AWQC
Samplesused in
analysis
Maximum(µg/L)
MeanQ3
(µg/L)Median(µg/L)
Q1(µg/L)Value
(µg/L)SE
(µg/L)95% UCL
(µg/L)
Aluminum 87 11 11 6 11 470 144 46 227 140 118 38Antimony 104 10 6 0 10 3.00 .34 .30 .88 .09 .04 .02Arsenic 190 10 1 0 4 .29 Barium 3.8 10 10 10 10 46 25 2.8 30 28 24 19Beryllium 5.09 10 0Cadmium 1.1 10 6 0 9 .10 .04 .01 .06 .07 .02 .01Chromium 11 10 2 0 10 1.0 .3 .1 .4 .3 .2 .1Cobalt 3.06 10 9 0 10 1.70 .60 .19 .94 1.15 .38 .09Copper 11.8 10 10 4 10 12.0 10.2 2.4 14.5 17.3 9.3 3.2Iron 1,000 10 4 0 10 48 19 5 28 30 12 6Lead 3.2 10 3 0 9 .22 .06 .03 .12 .13 .02 .01Manganese 80.3 10 10 0 10 14.0 10.0 .9 11.7 12.3 9.8 8.4Mercury .012 4 1 1 1 .2Nickel 158 10 8 0 10 .8 .3 .1 .5 .5 .3 .2Selenium 5 10 0Silver .36 10 2 0 7 .05 .01 .01 .02 .01 <.01 <.01Strontium 620 10 10 0 10 190 128 14 155 158 139 80Thallium 18 10 1 0 7 .09Uranium 1.87 9 9 0 9 .32 .18 .03 .25 .26 .24 .07Vanadium 19.1 10 4 0 8 .44 .15 .05 .24 .20 .10 .06Zinc 106 10 10 0 10 29 11 3 16 16 10 3
Appendix 5. Summary of select constituents in surface waters relative to ambient water-quality criteria (AWQC) for stream reaches in the Ely Mine study area, Vershire, VT, 2000 to 2007.—Continued
[Values in italics are estimated; chronic, average allowable concentration; >, greater than; <, less than; %, percent; SE, standard error; UCL, upper confidence level; Q3, 75th percentile; Q1, 25th percentile; mg/L, micrograms per liter]

Appendix 5 111
ElementAWQC
chronic(µg/L)
Ompompanoosuc River above river meter 23,640
Samples DetectsDetects>AWQC
Samplesused inanalysis
Maximum(µg/L)
MeanQ3
(µg/L)Median(µg/L)
Q1(µg/L)Value
(µg/L)SE
(µg/L)95% UCL
(µg/L)
Aluminum 87 12 12 5 12 390 118 35 182 162 72 33Antimony 104 11 5 0 8 .09 .04 .01 .06 .07 .04 .02 Arsenic 190 11 3 0 8 .63 .21 .07 .34 .34 .13 .07Barium 3.8 11 11 11 11 296 58 25 103 56 29 21Beryllium 5.09 11 0Cadmium 1.1 11 0Chromium 11 11 2 0 11 1.1 .25 .09 .42 .3 .14 .09Cobalt 3.06 11 1 0 1 .03Copper 11.8 11 3 0 10 .84 .36 .06 .48 .45 .31 .23Iron 1,000 9 1 0 9 21Lead 3.2 11 2 0 10 .29 .04 .03 .09 .03 <.01 <.01Manganese 80.3 11 11 0 11 26.0 9.1 2.1 12.8 12.0 6.4 4.4Mercury .012 3 0Nickel 158 11 3 0 10 .6 .2 .06 .3 .2 .1 <.1Selenium 5 11 1 0 8 .2Silver .36 11 4 0 8 .03 .01 .003 .02 .02 .01 <.1Strontium 620 10 10 0 10 190 128 15 155 165 139 84Thallium 18 11 0Uranium 1.87 9 9 0 9 .29 .16 .03 .22 .24 .16 .07Vanadium 19.1 11 5 0 9 .41 .19 .04 .27 .30 .16 .08Zinc 106 11 11 0 11 43 15 4 23 31 10 3
a Chronic toxicity standards for waters with pH 6.5–9.0 and for total recoverable concentrations (USEPA, 2006).b From Suter, 1996.c From VTDEC, 2006.d Toxicity is hardness dependent and shown at hardness of 100 milligrams per liter.
Appendix 5. Summary of select constituents in surface waters relative to ambient water-quality criteria (AWQC) for stream reaches in the Ely Mine study area, Vershire, VT, 2000 to 2007.—Continued
[Values in italics are estimated; chronic, average allowable concentration; >, greater than; <, less than; %, percent; SE, standard error; UCL, upper confidence level; Q3, 75th percentile; Q1, 25th percentile; mg/L, micrograms per liter]


Appendix 6 113A
ppen
dix
6.
Cons
titue
nts
in s
urfa
ce w
ater
s co
llect
ed in
Aug
ust a
nd S
epte
mbe
r 200
6 fro
m th
e El
y M
ine
stud
y ar
ea, V
ersh
ire, V
T.
[S.C
., sp
ecifi
c co
nduc
tanc
e; D
OC
, dis
solv
ed o
rgan
ic c
arbo
n; µ
S/cm
, mic
rosi
emen
s per
cen
timet
er; m
g/L,
mill
igra
ms p
er li
ter;
cfs,
cubi
c fe
et p
er se
cond
; L/s
, lite
rs p
er se
cond
; µg/
L, m
icro
gram
s per
lite
r; ng
/L,
nano
gram
s per
lite
r; IC
P-A
ES, i
nduc
tivel
y co
uple
d pl
asm
a-at
omic
em
issi
on sp
ectro
scop
y; IC
P-M
S, in
duct
ivel
y co
uple
d pl
asm
a-m
ass s
pect
rom
etry
; IC
, ion
chr
omat
ogra
phy;
CVA
F, c
old-
vapo
r ato
mic
fluo
res-
cenc
e; —
, not
det
erm
ined
; <, a
naly
te n
ot d
etec
ted
at th
e re
porti
ng le
vel]
Site
No.
Prev
ious
sa
mpl
e ID
Split
Dat
epH
S.C.
(µS/
cm)
Alk
alin
ity(m
g/L
as C
aCO
3)D
isch
arge
(cfs
)St
ream
flow
(L/s
)D
OC
(mg/
L)A
mm
onia
(mg/
L as
N)
Nitr
ite(m
g/L
as N
)N
O2+N
O3
(mg/
L as
N)
Tota
l N(m
g/L)
Phos
phor
us(m
g/L)
EB-1
080M
06El
y01A
FA
filte
red
8/23
/200
67.
287
410.
040.
991.
9<0
.01
<0.0
02<0
.06
0.07
0.00
3 Ea
EB-1
080M
06El
y01A
RA
raw
8/23
/200
67.
287
——
——
——
——
—EB
-770
M06
Ely0
2A F
Afil
tere
d8/
23/2
006
6.3
149
110.
041.
130.
80.
005
E<0
.002
<0.0
60.
04 E
0.00
2 E
EB-7
70M
06El
y02A
RA
raw
8/23
/200
66.
314
9—
——
——
——
——
EB-6
00M
06El
y03A
FA
filte
red
8/23
/200
67.
012
316
0.05
1.3
0.9
<0.0
1<0
.002
<0.0
60.
05 E
<0.0
04EB
-600
M06
Ely0
3A R
Ara
w8/
23/2
006
7.0
123
——
——
——
——
—EB
-90M
06El
y04A
FA
filte
red
8/23
/200
63.
244
7—
0.22
6.23
1.6
0.02
3<0
.002
<0.0
60.
070.
004
EEB
-90M
06El
y04A
RA
raw
8/23
/200
63.
244
7—
——
——
——
——
SB-3
670M
06El
y05A
FA
filte
red
8/22
/200
68.
221
299
2.9
82.4
1.2
<0.0
10.
001
0.04
E0.
080.
002
ESB
-367
0M06
Ely0
5A R
Ara
w8/
22/2
006
8.2
212
——
——
——
——
—SB
-312
5M06
Ely1
9A F
Afil
tere
d8/
22/2
006
7.8
215
893.
496
.91.
3<0
.01
<0.0
020.
04 E
0.11
0.00
5SB
-312
5M06
Ely1
9A R
Ara
w8/
22/2
006
7.8
215
——
——
——
——
—SB
-240
0M06
Ely0
6A F
Afil
tere
d8/
22/2
006
8.3
210
894.
211
81.
2<0
.01
<0.0
020.
04 E
0.09
0.00
3 E
SB-2
400M
06El
y06A
RA
raw
8/22
/200
68.
321
0—
——
——
——
——
SB-1
360M
06El
y07A
FA
filte
red
8/23
/200
67.
920
386
4.7
132
1.5
<0.0
10.
001
E0.
03 E
0.09
0.00
3 E
SB-1
360M
06El
y07A
RA
raw
8/23
/200
67.
920
3—
——
——
——
——
SB-1
40M
06El
y08A
FA
filte
red
8/21
/200
68.
218
680
7.4
209
2<0
.01
0.00
1 E
<0.0
60.
120.
006
SB-1
40M
06El
y08A
RA
raw
8/21
/200
68.
218
6—
——
——
——
——
OR
-240
50M
06El
y09A
FA
filte
red
8/21
/200
68.
019
688
2776
52.
5<0
.01
0.00
1 E
0.07
0.21
0.00
7O
R-2
4050
M06
Ely0
9A R
Ara
w8/
21/2
006
8.0
196
——
——
——
——
—O
R-2
3630
M06
Ely2
0A F
Afil
tere
d8/
21/2
006
8.0
198
8734
974
2.6
<0.0
10.
001
E0.
070.
20.
006
OR
-236
30M
06El
y20A
RA
raw
8/21
/200
68.
019
8—
——
——
——
——
OR
-232
00M
06El
y10A
FA
filte
red
8/21
/200
68.
119
685
3598
02.
6<0
.01
0.00
1 E
0.06
0.2
0.00
5O
R-2
3200
M06
Ely1
0A R
Ara
w8/
21/2
006
8.1
196
——
——
——
——
—EM
-PO
ND
106
ElyP
ond1
FA
filte
red
09/1
9/06
7.0
5119
——
3.5
0.00
8 E
<0.0
02<0
.06
0.46
0.03
6EM
-PO
ND
106
ElyP
ond1
RA
raw
09/1
9/06
7.0
51—
——
——
——
——
EM-P
ON
D2
06El
yPon
d2 F
Afil
tere
d09
/19/
066.
565
27—
—2.
60.
01<0
.002
<0.0
60.
220.
011
EM-P
ON
D2
06El
yPon
d2 R
Ara
w09
/19/
066.
565
——
——
——
——
—EM
-PO
ND
306
ElyP
ond3
FA
filte
red
09/1
9/06
6.7
7031
——
2.6
0.03
1<0
.002
0.03
E0.
250.
006
EM-P
ON
D3
06El
yPon
d3 R
Ara
w09
/19/
066.
770
——
——
——
——
—EM
-PO
ND
406
ElyP
ond4
FA
filte
red
09/1
9/06
6.7
7830
——
2.2
0.01
E<0
.002
<0.0
60.
190.
007
EM-P
ON
D4
06El
yPon
d4 R
Ara
w09
/19/
066.
778
——
——
——
——
—EM
-PO
ND
506
ElyP
ond5
FA
filte
red
09/1
9/06
6.5
117
17—
—1.
40.
009
E<0
.002
<0.0
60.
110.
003
EEM
-PO
ND
506
ElyP
ond5
RA
raw
09/1
9/06
6.5
117
——
——
——
——
—EM
-PO
ND
606
ElyP
ond6
FA
filte
red
09/1
9/06
4.7
206
——
—1.
10.
015
<0.0
020.
03 E
0.1
0.00
6EM
-PO
ND
606
ElyP
ond6
RA
raw
09/1
9/06
4.7
206
——
——
——
——
—
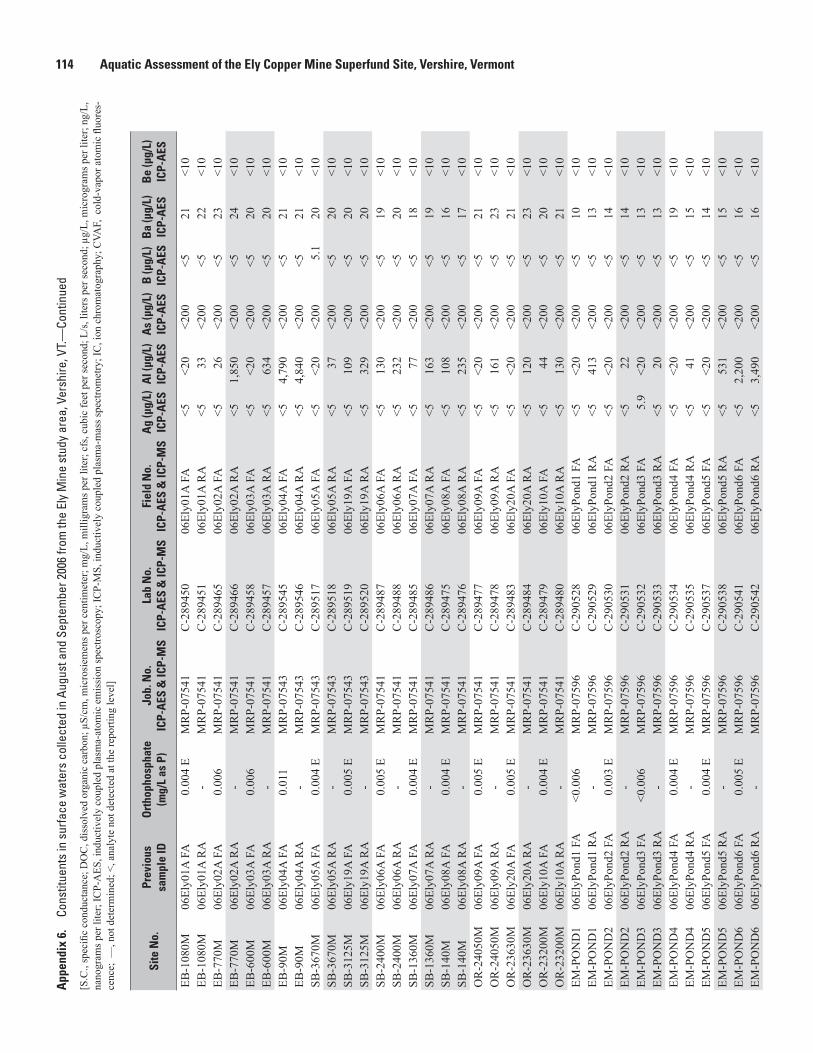
114 Aquatic Assessment of the Ely Copper Mine Superfund Site, Vershire, VermontA
ppen
dix
6.
Cons
titue
nts
in s
urfa
ce w
ater
s co
llect
ed in
Aug
ust a
nd S
epte
mbe
r 200
6 fro
m th
e El
y M
ine
stud
y ar
ea, V
ersh
ire, V
T.—
Cont
inue
d
[S.C
., sp
ecifi
c co
nduc
tanc
e; D
OC
, dis
solv
ed o
rgan
ic c
arbo
n; µ
S/cm
, mic
rosi
emen
s per
cen
timet
er; m
g/L,
mill
igra
ms p
er li
ter;
cfs,
cubi
c fe
et p
er se
cond
; L/s
, lite
rs p
er se
cond
; µg/
L, m
icro
gram
s per
lite
r; ng
/L,
nano
gram
s per
lite
r; IC
P-A
ES, i
nduc
tivel
y co
uple
d pl
asm
a-at
omic
em
issi
on sp
ectro
scop
y; IC
P-M
S, in
duct
ivel
y co
uple
d pl
asm
a-m
ass s
pect
rom
etry
; IC
, ion
chr
omat
ogra
phy;
CVA
F, c
old-
vapo
r ato
mic
fluo
res-
cenc
e; —
, not
det
erm
ined
; <, a
naly
te n
ot d
etec
ted
at th
e re
porti
ng le
vel]
Site
No.
Prev
ious
sa
mpl
e ID
Ort
hoph
osph
ate
(mg/
L as
P)
Job.
No.
ICP-
AES
& IC
P-M
SLa
b N
o.IC
P-A
ES &
ICP-
MS
Fiel
d N
o.IC
P-A
ES &
ICP-
MS
Ag
(µg/
L)IC
P-A
ESA
l (µg
/L)
ICP-
AES
As
(µg/
L)IC
P-A
ESB
(µg/
L)IC
P-A
ESB
a (µ
g/L)
ICP-
AES
Be
(µg/
L)IC
P-A
ES
EB-1
080M
06El
y01A
FA
0.00
4 E
MR
P-07
541
C-2
8945
006
Ely0
1A F
A<5
<20
<200
<521
<10
EB-1
080M
06El
y01A
RA
-M
RP-
0754
1C
-289
451
06El
y01A
RA
<533
<200
<522
<10
EB-7
70M
06El
y02A
FA
0.00
6M
RP-
0754
1C
-289
465
06El
y02A
FA
<526
<200
<523
<10
EB-7
70M
06El
y02A
RA
-M
RP-
0754
1C
-289
466
06El
y02A
RA
<51,
850
<200
<524
<10
EB-6
00M
06El
y03A
FA
0.00
6M
RP-
0754
1C
-289
458
06El
y03A
FA
<5<2
0<2
00<5
20<1
0EB
-600
M06
Ely0
3A R
A-
MR
P-07
541
C-2
8945
706
Ely0
3A R
A<5
634
<200
<520
<10
EB-9
0M06
Ely0
4A F
A0.
011
MR
P-07
543
C-2
8954
506
Ely0
4A F
A<5
4,79
0<2
00<5
21<1
0EB
-90M
06El
y04A
RA
-M
RP-
0754
3C
-289
546
06El
y04A
RA
<54,
840
<200
<521
<10
SB-3
670M
06El
y05A
FA
0.00
4 E
MR
P-07
543
C-2
8951
706
Ely0
5A F
A<5
<20
<200
5.1
20<1
0SB
-367
0M06
Ely0
5A R
A-
MR
P-07
543
C-2
8951
806
Ely0
5A R
A<5
37<2
00<5
20<1
0SB
-312
5M06
Ely1
9A F
A0.
005
EM
RP-
0754
3C
-289
519
06El
y19A
FA
<510
9<2
00<5
20<1
0SB
-312
5M06
Ely1
9A R
A-
MR
P-07
543
C-2
8952
006
Ely1
9A R
A<5
329
<200
<520
<10
SB-2
400M
06El
y06A
FA
0.00
5 E
MR
P-07
541
C-2
8948
706
Ely0
6A F
A<5
130
<200
<519
<10
SB-2
400M
06El
y06A
RA
-M
RP-
0754
1C
-289
488
06El
y06A
RA
<523
2<2
00<5
20<1
0SB
-136
0M06
Ely0
7A F
A0.
004
EM
RP-
0754
1C
-289
485
06El
y07A
FA
<577
<200
<518
<10
SB-1
360M
06El
y07A
RA
-M
RP-
0754
1C
-289
486
06El
y07A
RA
<516
3<2
00<5
19<1
0SB
-140
M06
Ely0
8A F
A0.
004
EM
RP-
0754
1C
-289
475
06El
y08A
FA
<510
8<2
00<5
16<1
0SB
-140
M06
Ely0
8A R
A-
MR
P-07
541
C-2
8947
606
Ely0
8A R
A<5
235
<200
<517
<10
OR
-240
50M
06El
y09A
FA
0.00
5 E
MR
P-07
541
C-2
8947
706
Ely0
9A F
A<5
<20
<200
<521
<10
OR
-240
50M
06El
y09A
RA
-M
RP-
0754
1C
-289
478
06El
y09A
RA
<516
1<2
00<5
23<1
0O
R-2
3630
M06
Ely2
0A F
A0.
005
EM
RP-
0754
1C
-289
483
06El
y20A
FA
<5<2
0<2
00<5
21<1
0O
R-2
3630
M06
Ely2
0A R
A-
MR
P-07
541
C-2
8948
406
Ely2
0A R
A<5
120
<200
<523
<10
OR
-232
00M
06El
y10A
FA
0.00
4 E
MR
P-07
541
C-2
8947
906
Ely1
0A F
A<5
44<2
00<5
20<1
0O
R-2
3200
M06
Ely1
0A R
A-
MR
P-07
541
C-2
8948
006
Ely1
0A R
A<5
130
<200
<521
<10
EM-P
ON
D1
06El
yPon
d1 F
A<0
.006
MR
P-07
596
C-2
9052
806
ElyP
ond1
FA
<5<2
0<2
00<5
10<1
0EM
-PO
ND
106
ElyP
ond1
RA
-M
RP-
0759
6C
-290
529
06El
yPon
d1 R
A<5
413
<200
<513
<10
EM-P
ON
D2
06El
yPon
d2 F
A0.
003
EM
RP-
0759
6C
-290
530
06El
yPon
d2 F
A<5
<20
<200
<514
<10
EM-P
ON
D2
06El
yPon
d2 R
A-
MR
P-07
596
C-2
9053
106
ElyP
ond2
RA
<522
<200
<514
<10
EM-P
ON
D3
06El
yPon
d3 F
A<0
.006
MR
P-07
596
C-2
9053
206
ElyP
ond3
FA
5.9
<20
<200
<513
<10
EM-P
ON
D3
06El
yPon
d3 R
A-
MR
P-07
596
C-2
9053
306
ElyP
ond3
RA
<520
<200
<513
<10
EM-P
ON
D4
06El
yPon
d4 F
A0.
004
EM
RP-
0759
6C
-290
534
06El
yPon
d4 F
A<5
<20
<200
<519
<10
EM-P
ON
D4
06El
yPon
d4 R
A-
MR
P-07
596
C-2
9053
506
ElyP
ond4
RA
<541
<200
<515
<10
EM-P
ON
D5
06El
yPon
d5 F
A0.
004
EM
RP-
0759
6C
-290
537
06El
yPon
d5 F
A<5
<20
<200
<514
<10
EM-P
ON
D5
06El
yPon
d5 R
A-
MR
P-07
596
C-2
9053
806
ElyP
ond5
RA
<553
1<2
00<5
15<1
0EM
-PO
ND
606
ElyP
ond6
FA
0.00
5 E
MR
P-07
596
C-2
9054
106
ElyP
ond6
FA
<52,
200
<200
<516
<10
EM-P
ON
D6
06El
yPon
d6 R
A-
MR
P-07
596
C-2
9054
206
ElyP
ond6
RA
<53,
490
<200
<516
<10

Appendix 6 115A
ppen
dix
6.
Cons
titue
nts
in s
urfa
ce w
ater
s co
llect
ed in
Aug
ust a
nd S
epte
mbe
r 200
6 fro
m th
e El
y M
ine
stud
y ar
ea, V
ersh
ire, V
T.—
Cont
inue
d
[S.C
., sp
ecifi
c co
nduc
tanc
e; D
OC
, dis
solv
ed o
rgan
ic c
arbo
n; µ
S/cm
, mic
rosi
emen
s per
cen
timet
er; m
g/L,
mill
igra
ms p
er li
ter;
cfs,
cubi
c fe
et p
er se
cond
; L/s
, lite
rs p
er se
cond
; µg/
L, m
icro
gram
s per
lite
r; ng
/L,
nano
gram
s per
lite
r; IC
P-A
ES, i
nduc
tivel
y co
uple
d pl
asm
a-at
omic
em
issi
on sp
ectro
scop
y; IC
P-M
S, in
duct
ivel
y co
uple
d pl
asm
a-m
ass s
pect
rom
etry
; IC
, ion
chr
omat
ogra
phy;
CVA
F, c
old-
vapo
r ato
mic
fluo
res-
cenc
e; —
, not
det
erm
ined
; <, a
naly
te n
ot d
etec
ted
at th
e re
porti
ng le
vel]
Site
No.
Prev
ious
sa
mpl
e ID
Ca (m
g/L)
ICP-
AES
Cd (µ
g/L)
ICP-
AES
Co (µ
g/L)
ICP-
AES
Cr (µ
g/L)
ICP-
AES
Cu (µ
g/L)
ICP-
AES
Fe (µ
g/L)
ICP-
AES
K (m
g/L)
ICP-
AES
Li (µ
g/L)
ICP-
AES
Mg
(mg/
L)IC
P-A
ESM
n (µ
g/L)
ICP-
AES
Mo
(µg/
L)IC
P-A
ESN
a (m
g/L)
ICP-
AES
Ni (
µg/L
)IC
P-A
ESP
(mg/
L)IC
P-A
ESEB
-108
0M06
Ely0
1A F
A13
.4<5
<10
<10
<10
221.
69<5
1.18
136
<20
1.12
<10
<0.5
EB-1
080M
06El
y01A
RA
13.6
<5<1
0<1
0<1
012
11.
74<5
1.21
182
<20
1.13
<10
<0.5
EB-7
70M
06El
y02A
FA
17.2
<537
<10
981
<20
2.43
7.6
3.2
247
<20
1.64
14<0
.5EB
-770
M06
Ely0
2A R
A17
.7<5
38<1
01,
240
822.
57.
83.
3125
5<2
01.
6915
<0.5
EB-6
00M
06El
y03A
FA
14.9
<515
<10
240
<20
2.17
<52.
4310
1<2
01.
44<1
0<0
.5EB
-600
M06
Ely0
3A R
A15
.1<5
16<1
044
752
2.19
<52.
4710
4<2
01.
46<1
0<0
.5EB
-90M
06El
y04A
FA
21.1
<577
<10
1,78
06,
370
3.42
165.
5459
9<2
02.
321
<0.5
EB-9
0M06
Ely0
4A R
A21
.1<5
74<1
01,
800
6,51
03.
4416
5.58
601
<20
2.31
21<0
.5SB
-367
0M06
Ely0
5A F
A35
.7<5
<10
<10
<10
<20
2.26
<51.
71<1
0<2
03.
89<1
0<0
.5SB
-367
0M06
Ely0
5A R
A36
.6<5
<10
<10
<10
422.
34<5
1.75
<10
<20
3.96
<10
<0.5
SB-3
125M
06El
y19A
FA
35.1
<5<1
0<1
044
492.
34<5
1.99
44<2
04.
16<1
0<0
.5SB
-312
5M06
Ely1
9A R
A35
.5<5
<10
<10
118
382
2.39
<52.
0348
<20
4.25
<10
<0.5
SB-2
400M
06El
y06A
FA
35.8
<5<1
0<1
023
<20
2.42
<52.
0332
<20
4.62
<10
<0.5
SB-2
400M
06El
y06A
RA
36.4
<5<1
0<1
069
197
2.46
<52.
0735
<20
4.67
<10
<0.5
SB-1
360M
06El
y07A
FA
33.8
<5<1
0<1
020
132.
29<5
1.95
19<2
04.
27<1
0<0
.5SB
-136
0M06
Ely0
7A R
A34
.3<5
<10
<10
5419
32.
31<5
1.98
21<2
04.
33<1
0<0
.5SB
-140
M06
Ely0
8A F
A30
.7<5
<10
<10
2020
2.2
<51.
8215
<20
3.77
<10
<0.5
SB-1
40M
06El
y08A
RA
31.8
<5<1
0<1
055
262
2.27
<51.
8821
<20
3.88
<10
<0.5
OR
-240
50M
06El
y09A
FA
32<5
<10
<10
<10
<20
2.16
<51.
46<1
0<2
05.
22<1
0<0
.5O
R-2
4050
M06
Ely0
9A R
A33
.1<5
<10
<10
<10
179
2.22
<51.
5829
<20
5.37
<10
<0.5
OR
-236
30M
06El
y20A
FA
32.9
<5<1
0<1
0<1
0<2
02.
23<5
1.55
<10
<20
5.45
<10
<0.5
OR
-236
30M
06El
y20A
RA
32.9
<5<1
0<1
0<1
012
32.
26<5
1.59
30<2
05.
46<1
0<0
.5O
R-2
3200
M06
Ely1
0A F
A32
.6<5
<10
<10
<10
<20
2.24
<51.
61<1
0<2
05.
15<1
0<0
.5O
R-2
3200
M06
Ely1
0A R
A32
.7<5
<10
<10
1414
62.
27<5
1.64
20<2
05.
13<1
0<0
.5EM
-PO
ND
106
ElyP
ond1
FA
5.77
<5<1
0<1
0<1
066
1.67
<51.
07<1
0<2
01.
2<1
0<0
.5EM
-PO
ND
106
ElyP
ond1
RA
5.98
<5<1
0<1
0<1
053
71.
7<5
1.25
<10
<20
1.22
<10
<0.5
EM-P
ON
D2
06El
yPon
d2 F
A7.
67<5
<10
<10
<10
353
1.78
<51.
1120
1<2
01.
34<1
0<0
.5EM
-PO
ND
206
ElyP
ond2
RA
7.99
<5<1
0<1
0<1
01,
190
1.83
<51.
1622
0<2
01.
37<1
0<0
.5EM
-PO
ND
306
ElyP
ond3
FA
8.72
<5<1
0<1
0<1
025
31.
75<5
1.17
444
<20
1.3
<10
<0.5
EM-P
ON
D3
06El
yPon
d3 R
A8.
98<5
<10
<10
<10
1010
1.78
<51.
2146
4<2
01.
34<1
0<0
.5EM
-PO
ND
406
ElyP
ond4
FA
9.7
<5<1
0<1
013
105
1.86
<51.
3721
2<2
01.
32<1
0<0
.5EM
-PO
ND
406
ElyP
ond4
RA
9.74
<5<1
0<1
017
423
1.86
<51.
3824
0<2
01.
31<1
0<0
.5EM
-PO
ND
506
ElyP
ond5
FA
13<5
24<1
049
4<2
02.
13<5
2.44
425
<20
1.41
<10
<0.5
EM-P
ON
D5
06El
yPon
d5 R
A13
.4<5
24<1
059
513
02.
17<5
2.49
435
<20
1.41
<10
<0.5
EM-P
ON
D6
06El
yPon
d6 F
A18
.6<5
62<1
01,
800
565
2.54
9.3
4.17
709
<20
1.6
20<0
.5EM
-PO
ND
606
ElyP
ond6
RA
19.2
<564
<10
1,89
070
12.
619.
64.
372
9<2
01.
6421
<0.5

116 Aquatic Assessment of the Ely Copper Mine Superfund Site, Vershire, VermontA
ppen
dix
6.
Cons
titue
nts
in s
urfa
ce w
ater
s co
llect
ed in
Aug
ust a
nd S
epte
mbe
r 200
6 fro
m th
e El
y M
ine
stud
y ar
ea, V
ersh
ire, V
T.—
Cont
inue
d
[S.C
., sp
ecifi
c co
nduc
tanc
e; D
OC
, dis
solv
ed o
rgan
ic c
arbo
n; µ
S/cm
, mic
rosi
emen
s per
cen
timet
er; m
g/L,
mill
igra
ms p
er li
ter;
cfs,
cubi
c fe
et p
er se
cond
; L/s
, lite
rs p
er se
cond
; µg/
L, m
icro
gram
s per
lite
r; ng
/L,
nano
gram
s per
lite
r; IC
P-A
ES, i
nduc
tivel
y co
uple
d pl
asm
a-at
omic
em
issi
on sp
ectro
scop
y; IC
P-M
S, in
duct
ivel
y co
uple
d pl
asm
a-m
ass s
pect
rom
etry
; IC
, ion
chr
omat
ogra
phy;
CVA
F, c
old-
vapo
r ato
mic
fluo
res-
cenc
e; —
, not
det
erm
ined
; <, a
naly
te n
ot d
etec
ted
at th
e re
porti
ng le
vel]
Site
No.
Prev
ious
sa
mpl
e ID
Pb (µ
g/L)
ICP-
AES
Sb (µ
g/L)
ICP-
AES
SiO
2 (mg/
L)IC
P-A
ESSO
4 (mg/
L)IC
P-A
ESSr
(µg/
L)IC
P-A
ESTi
(µg/
L)IC
P-A
ESV
(µg/
L)IC
P-A
ESZn
(µg/
L)IC
P-A
ESA
g (µ
g/L)
ICP-
MS
Al (
µg/L
)IC
P-M
SA
s (µ
g/L)
ICP-
MS
Ba
(µg/
L)IC
P-M
SB
e (µ
g/L)
ICP-
MS
Bi (
µg/L
)IC
P-M
SCa
(mg/
L)IC
P-M
SEB
-108
0M06
Ely0
1A F
A<5
0<5
09.
13.
950
<50
<10
<20
<33.
4<1
18.4
<0.0
5<0
.211
.3EB
-108
0M06
Ely0
1A R
A<5
0<5
09.
24
51<5
0<1
0<2
0<3
33.9
<120
.3<0
.05
<0.2
12EB
-770
M06
Ely0
2A F
A<5
0<5
017
.252
.564
<50
<10
105
<325
.1<1
19.9
0.06
<0.2
13.9
EB-7
70M
06El
y02A
RA
<50
<50
18.3
54.5
66<5
0<1
010
9<3
1,32
0<1
20.1
0.1
<0.2
14.5
EB-6
00M
06El
y03A
FA
<50
<50
13.7
37.6
54<5
0<1
049
<320
.7<1
17<0
.05
<0.2
12.2
EB-6
00M
06El
y03A
RA
<50
<50
14.2
38.2
54<5
0<1
052
<348
4<1
17.4
0.05
<0.2
12.1
EB-9
0M06
Ely0
4A F
A<5
0<5
033
.114
065
<50
<10
357
<34,
190
<119
0.3
<0.2
18.2
EB-9
0M06
Ely0
4A R
A<5
0<5
033
.314
065
<50
<10
354
<33,
890
<118
.90.
3<0
.217
.8SB
-367
0M06
Ely0
5A F
A<5
0<5
07.
37.
718
1<5
0<1
0<2
0<3
12.8
<120
.5<0
.05
<0.2
36SB
-367
0M06
Ely0
5A R
A<5
0<5
07.
58
185
<50
<10
<20
<333
.3<1
20.4
<0.0
5<0
.236
.8SB
-312
5M06
Ely1
9A F
A<5
0<5
08.
917
174
<50
<10
<20
<312
4<1
19.8
<0.0
5<0
.236
SB-3
125M
06El
y19A
RA
<50
<50
9.3
17.3
177
<50
<10
23<3
364
<120
.6<0
.05
<0.2
36.7
SB-2
400M
06El
y06A
FA
<50
<50
9.1
16.6
181
<50
<10
<20
<312
8<1
18.5
<0.0
5<0
.234
.6SB
-240
0M06
Ely0
6A R
A<5
0<5
09.
316
.918
4<5
0<1
0<2
0<3
234
<119
.5<0
.05
<0.2
35.2
SB-1
360M
06El
y07A
FA
<50
<50
8.6
14.1
172
<50
<10
5.6
<384
.4<1
18.4
<0.0
5<0
.233
.5SB
-136
0M06
Ely0
7A R
A<5
0<5
08.
914
.317
5<5
0<1
0<2
0<3
170
<118
.5<0
.05
<0.2
33.6
SB-1
40M
06El
y08A
FA
<50
<50
8.5
1315
8<5
0<1
0<2
0<3
93.5
<114
.8<0
.05
<0.2
27.7
SB-1
40M
06El
y08A
RA
<50
<50
913
.216
3<5
0<1
0<2
0<3
215
<116
.6<0
.05
<0.2
29.7
OR
-240
50M
06El
y09A
FA
<50
<50
7.2
715
6<5
0<1
0<2
0<3
13.4
<119
.9<0
.05
<0.2
30.3
OR
-240
50M
06El
y09A
RA
<50
<50
7.8
7.3
161
<50
<10
<20
<316
0<1
22.1
<0.0
5<0
.231
.5O
R-2
3630
M06
Ely2
0A F
A<5
0<5
07.
67.
816
1<5
0<1
0<2
0<3
23.3
<120
.2<0
.05
<0.2
31.4
OR
-236
30M
06El
y20A
RA
<50
<50
7.8
7.8
161
<50
<10
<20
<311
8<1
22.6
<0.0
5<0
.232
.8O
R-2
3200
M06
Ely1
0A F
A<5
0<5
07.
88.
916
1<5
0<1
0<2
0<3
44.6
<119
.1<0
.05
<0.2
30.4
OR
-232
00M
06El
y10A
RA
<50
<50
89
161
<50
<10
<20
<312
7<1
19.9
<0.0
5<0
.231
.5EM
-PO
ND
106
ElyP
ond1
FA
<50
<50
2.2
6.2
24<5
0<1
0<2
0<3
15.8
<19.
61<0
.05
<0.2
5.47
EM-P
ON
D1
06El
yPon
d1 R
A<5
0<5
03.
36.
325
<50
<10
<20
<338
8<1
12.2
<0.0
5<0
.25.
76EM
-PO
ND
206
ElyP
ond2
FA
<50
<50
4.6
4.9
30<5
0<1
0<2
0<3
6.5
<113
.5<0
.05
<0.2
7.74
EM-P
ON
D2
06El
yPon
d2 R
A<5
0<5
04.
95.
132
<50
<10
<20
<334
.4<1
14.1
<0.0
5<0
.28.
4EM
-PO
ND
306
ElyP
ond3
FA
<50
<50
5.1
4.5
35<5
0<1
0<2
0<3
6.2
<112
.5<0
.05
<0.2
9.06
EM-P
ON
D3
06El
yPon
d3 R
A<5
0<5
05.
34.
736
<50
<10
<20
<321
.2<1
13<0
.05
<0.2
9.36
EM-P
ON
D4
06El
yPon
d4 F
A<5
0<5
05.
58.
339
<50
<10
<20
<35.
5<1
18.6
<0.0
5<0
.29.
88EM
-PO
ND
406
ElyP
ond4
RA
<50
<50
5.5
8.4
39<5
0<1
0<2
0<3
41.2
<114
.6<0
.05
<0.2
9.92
EM-P
ON
D5
06El
yPon
d5 F
A<5
0<5
09.
234
.144
<50
<10
147
<310
.1<1
13.7
<0.0
5<0
.211
.8EM
-PO
ND
506
ElyP
ond5
RA
<50
<50
9.5
34.7
45<5
0<1
015
0<3
427
<113
.50.
06<0
.211
.6EM
-PO
ND
606
ElyP
ond6
FA
<50
<50
14.8
82.8
54<5
0<1
036
7<3
1,41
0<1
13.2
0.2
<0.2
13.9
EM-P
ON
D6
06El
yPon
d6 R
A<5
0<5
015
.686
.556
<50
<10
378
<32,
040
<112
.60.
2<0
.213
.6

Appendix 6 117A
ppen
dix
6.
Cons
titue
nts
in s
urfa
ce w
ater
s co
llect
ed in
Aug
ust a
nd S
epte
mbe
r 200
6 fro
m th
e El
y M
ine
stud
y ar
ea, V
ersh
ire, V
T.—
Cont
inue
d
[S.C
., sp
ecifi
c co
nduc
tanc
e; D
OC
, dis
solv
ed o
rgan
ic c
arbo
n; µ
S/cm
, mic
rosi
emen
s per
cen
timet
er; m
g/L,
mill
igra
ms p
er li
ter;
cfs,
cubi
c fe
et p
er se
cond
; L/s
, lite
rs p
er se
cond
; µg/
L, m
icro
gram
s per
lite
r; ng
/L,
nano
gram
s per
lite
r; IC
P-A
ES, i
nduc
tivel
y co
uple
d pl
asm
a-at
omic
em
issi
on sp
ectro
scop
y; IC
P-M
S, in
duct
ivel
y co
uple
d pl
asm
a-m
ass s
pect
rom
etry
; IC
, ion
chr
omat
ogra
phy;
CVA
F, c
old-
vapo
r ato
mic
fluo
res-
cenc
e; —
, not
det
erm
ined
; <, a
naly
te n
ot d
etec
ted
at th
e re
porti
ng le
vel]
Site
No.
Prev
ious
sa
mpl
e ID
Cd
(µg/
L)IC
P-M
S
Ce
(µg/
L)IC
P-M
S
Co
(µg/
L)IC
P-M
S
Cr
(µg/
L)IC
P-M
S
Cs
(µg/
L)IC
P-M
S
Cu
(µg/
L)IC
P-M
S
Dy
(µ
g/L)
ICP-
MS
Er
(µg/
L)IC
P-M
S
Eu
(µg/
L)IC
P-M
S
Fe
(µg/
L)IC
P-M
S
Ga
(µ
g/L)
ICP-
MS
Gd
(µ
g/L)
ICP-
MS
Ge
(µ
g/L)
ICP-
MS
Ho
(µ
g/L)
ICP-
MS
K
(mg/
L)IC
P-M
S
La
(µg/
L)IC
P-M
SEB
-108
0M06
Ely0
1A F
A<0
.02
0.02
0.08
<10.
021.
30.
006
<0.0
05<0
.005
<50
<0.0
50.
007
<0.0
5<0
.005
1.42
0.03
EB-1
080M
06El
y01A
RA
<0.0
20.
120.
16<1
0.04
1.7
0.01
0.00
70.
005
86<0
.05
0.02
<0.0
5<0
.005
1.52
0.08
EB-7
70M
06El
y02A
FA
0.95
8.8
31.1
<10.
0683
70.
430.
210.
13<5
00.
060.
71<0
.05
0.07
21.
984.
88EB
-770
M06
Ely0
2A R
A0.
9411
.932
.2<1
0.07
1,04
00.
940.
430.
2654
0.1
1.35
<0.0
50.
152.
045.
79EB
-600
M06
Ely0
3A F
A0.
481.
2112
.5<1
0.05
211
0.04
0.02
0.02
<50
<0.0
50.
08<0
.05
0.00
81.
790.
86EB
-600
M06
Ely0
3A R
A0.
513.
8212
.9<1
0.05
385
0.33
0.15
0.09
<50
<0.0
50.
44<0
.05
0.05
1.76
1.93
EB-9
0M06
Ely0
4A F
A1.
9922
.463
2.1
1.29
1,56
01.
680.
710.
475,
920
0.2
2.41
<0.0
50.
293.
0410
.8EB
-90M
06El
y04A
RA
1.93
23.4
64.4
2.2
1.26
1,56
01.
740.
750.
495,
950
0.2
2.53
0.05
0.29
2.95
11.3
SB-3
670M
06El
y05A
FA
<0.0
2<0
.01
<0.0
2<1
0.06
<0.5
<0.0
05<0
.005
<0.0
05<5
0<0
.05
<0.0
05<0
.05
<0.0
052.
450.
01SB
-367
0M06
Ely0
5A R
A<0
.02
0.06
<0.0
2<1
0.07
<0.5
<0.0
05<0
.005
<0.0
05<5
0<0
.05
0.00
6<0
.05
<0.0
052.
510.
04SB
-312
5M06
Ely1
9A F
A0.
120.
214.
31<1
0.15
42.8
0.02
0.00
80.
007
<50
<0.0
50.
02<0
.05
<0.0
052.
580.
11SB
-312
5M06
Ely1
9A R
A0.
151.
364.
5<1
0.15
118
0.11
0.05
0.03
368
<0.0
50.
15<0
.05
0.02
2.6
0.65
SB-2
400M
06El
y06A
FA
0.08
0.04
2.82
<10.
1325
0.00
6<0
.005
<0.0
05<5
0<0
.05
0.00
5<0
.05
<0.0
052.
50.
03SB
-240
0M06
Ely0
6A R
A0.
110.
723.
16<1
0.14
68.4
0.05
10.
030.
0217
9<0
.05
0.07
3<0
.05
0.00
92.
560.
36SB
-136
0M06
Ely0
7A F
A0.
070.
071.
94<1
0.1
21.6
0.00
5<0
.005
<0.0
05<5
0<0
.05
0.00
9<0
.05
<0.0
052.
390.
04SB
-136
0M06
Ely0
7A R
A0.
090.
642.
09<1
0.11
55.2
0.05
20.
020.
0217
5<0
.05
0.07
6<0
.05
0.00
82.
440.
32SB
-140
M06
Ely0
8A F
A0.
050.
091.
1<1
0.08
20.4
0.00
9<0
.005
<0.0
05<5
0<0
.05
0.01
<0.0
5<0
.005
20.
05SB
-140
M06
Ely0
8A R
A0.
070.
791.
47<1
0.12
550.
066
0.03
0.02
236
<0.0
50.
094
<0.0
50.
009
2.18
0.4
OR
-240
50M
06El
y09A
FA
<0.0
20.
02<0
.02
<10.
080.
840.
006
<0.0
05<0
.005
<50
<0.0
50.
008
<0.0
5<0
.005
2.16
0.03
OR
-240
50M
06El
y09A
RA
<0.0
20.
460.
11<1
0.12
0.6
0.03
0.02
0.01
162
0.05
0.04
<0.0
50.
005
2.24
0.25
OR
-236
30M
06El
y20A
FA
0.02
0.04
0.11
<10.
083.
30.
008
<0.0
05<0
.005
<50
<0.0
50.
007
<0.0
5<0
.005
2.3
0.03
OR
-236
30M
06El
y20A
RA
<0.0
20.
310.
18<1
0.11
5.9
0.03
0.01
0.00
911
3<0
.05
0.03
<0.0
50.
005
2.4
0.17
OR
-232
00M
06El
y10A
FA
0.1
0.08
0.31
<10.
088.
90.
008
<0.0
05<0
.005
<50
<0.0
50.
01<0
.05
<0.0
052.
240.
05O
R-2
3200
M06
Ely1
0A R
A0.
020.
380.
42<1
0.1
150.
030.
020.
0112
6<0
.05
0.05
<0.0
50.
006
2.29
0.21
EM-P
ON
D1
06El
yPon
d1 F
A<0
.02
0.02
0.03
<10.
051.
1<0
.005
<0.0
05<0
.005
<50
<0.0
50.
006
<0.0
5<0
.005
1.61
0.02
EM-P
ON
D1
06El
yPon
d1 R
A0.
030.
60.
361.
20.
153.
10.
093
0.04
0.03
522
0.2
0.14
<0.0
50.
021.
720.
49EM
-PO
ND
206
ElyP
ond2
FA
<0.0
20.
060.
13<1
0.04
2.9
0.00
80.
006
<0.0
0532
4<0
.05
0.01
<0.0
5<0
.005
1.74
0.03
EM-P
ON
D2
06El
yPon
d2 R
A<0
.02
0.16
0.18
<10.
051.
30.
020.
010.
008
1240
<0.0
50.
03<0
.05
<0.0
051.
880.
09EM
-PO
ND
306
ElyP
ond3
FA
<0.0
20.
050.
23<1
0.05
1.7
0.00
90.
005
0.00
524
3<0
.05
0.00
8<0
.05
<0.0
051.
780.
02EM
-PO
ND
306
ElyP
ond3
RA
<0.0
20.
130.
26<1
0.05
1.4
0.01
0.00
90.
005
1020
<0.0
50.
02<0
.05
<0.0
051.
830.
06EM
-PO
ND
406
ElyP
ond4
FA
0.08
0.07
0.41
<10.
0513
.40.
009
0.00
50.
005
84<0
.05
0.01
<0.0
5<0
.005
1.87
0.06
EM-P
ON
D4
06El
yPon
d4 R
A0.
070.
240.
56<1
0.05
19.3
0.02
0.01
0.00
741
2<0
.05
0.04
<0.0
5<0
.005
1.92
0.15
EM-P
ON
D5
06El
yPon
d5 F
A1.
022.
9420
.4<1
0.13
444
0.14
0.07
10.
05<5
0<0
.05
0.25
<0.0
50.
031.
962.
06EM
-PO
ND
506
ElyP
ond5
RA
1.04
4.22
20.2
<10.
1351
80.
320.
140.
089
870.
050.
47<0
.05
0.05
31.
92.
67EM
-PO
ND
606
ElyP
ond6
FA
2.28
18.3
46.3
<10.
231,
380
1.54
0.66
0.4
434
0.2
2.24
<0.0
50.
251.
8310
.5EM
-PO
ND
606
ElyP
ond6
RA
2.28
19.8
46.4
<10.
231,
440
1.61
0.71
0.44
528
0.2
2.37
0.05
0.27
1.82
11.1

118 Aquatic Assessment of the Ely Copper Mine Superfund Site, Vershire, VermontA
ppen
dix
6.
Cons
titue
nts
in s
urfa
ce w
ater
s co
llect
ed in
Aug
ust a
nd S
epte
mbe
r 200
6 fro
m th
e El
y M
ine
stud
y ar
ea, V
ersh
ire, V
T.—
Cont
inue
d
[S.C
., sp
ecifi
c co
nduc
tanc
e; D
OC
, dis
solv
ed o
rgan
ic c
arbo
n; µ
S/cm
, mic
rosi
emen
s per
cen
timet
er; m
g/L,
mill
igra
ms p
er li
ter;
cfs,
cubi
c fe
et p
er se
cond
; L/s
, lite
rs p
er se
cond
; µg/
L, m
icro
gram
s per
lite
r; ng
/L,
nano
gram
s per
lite
r; IC
P-A
ES, i
nduc
tivel
y co
uple
d pl
asm
a-at
omic
em
issi
on sp
ectro
scop
y; IC
P-M
S, in
duct
ivel
y co
uple
d pl
asm
a-m
ass s
pect
rom
etry
; IC
, ion
chr
omat
ogra
phy;
CVA
F, c
old-
vapo
r ato
mic
fluo
res-
cenc
e; —
, not
det
erm
ined
; <, a
naly
te n
ot d
etec
ted
at th
e re
porti
ng le
vel]
Site
No.
Prev
ious
sa
mpl
e ID
Li(µ
g/L)
ICP-
MS
Lu(µ
g/L)
ICP-
MS
Mg
(mg/
L)IC
P-M
S
Mn
(µg/
L)IC
P-M
S
Mo
(µg/
L)IC
P-M
S
Na
(mg/
L)IC
P-M
S
Nb
(µg/
L)IC
P-M
S
Nd
(µg/
L)IC
P-M
S
Ni
(µg/
L)IC
P-M
S
P(m
g/L)
ICP-
MS
Pb(µ
g/L)
ICP-
MS
Pr(µ
g/L)
ICP-
MS
Rb(µ
g/L)
ICP-
MS
Sb(µ
g/L)
ICP-
MS
EB-1
080M
06El
y01A
FA
0.2
<0.1
0.95
124
<20.
93<0
.20.
030.
5<0
.01
<0.0
5<0
.01
3.3
<0.3
EB-1
080M
06El
y01A
RA
<0.1
<0.1
1.02
169
<20.
98<0
.20.
080.
5<0
.01
<0.0
50.
023.
61<0
.3EB
-770
M06
Ely0
2A F
A6.
7<0
.12.
5421
7<2
1.28
<0.2
4.17
12.1
<0.0
10.
11.
067.
87<0
.3EB
-770
M06
Ely0
2A R
A7.
3<0
.12.
622
4<2
1.31
<0.2
6.87
12.2
<0.0
10.
21.
657.
940.
34EB
-600
M06
Ely0
3A F
A3.
8<0
.11.
9192
.8<2
1.14
0.6
0.53
6.4
<0.0
10.
060.
156.
03<0
.3EB
-600
M06
Ely0
3A R
A3.
2<0
.11.
9193
.9<2
1.15
<0.2
2.29
6.2
<0.0
10.
070.
546
<0.3
EB-9
0M06
Ely0
4A F
A15
.2<0
.14.
6952
1<2
2<0
.212
.219
.5<0
.01
0.95
3.05
15<0
.3EB
-90M
06El
y04A
RA
15.1
<0.1
4.41
528
<21.
87<0
.212
.819
.5<0
.01
0.87
3.2
15.6
<0.3
SB-3
670M
06El
y05A
FA
2.8
<0.1
1.92
5.6
<24.
4<0
.2<0
.01
<0.4
<0.0
10.
05<0
.01
4.79
<0.3
SB-3
670M
06El
y05A
RA
3.1
<0.1
2.02
8.8
<24.
5<0
.20.
04<0
.4<0
.01
<0.0
50.
014.
91<0
.3SB
-312
5M06
Ely1
9A F
A3.
4<0
.12.
3543
.8<2
4.94
0.67
0.13
1.5
<0.0
10.
070.
035.
340.
78SB
-312
5M06
Ely1
9A R
A4.
2<0
.12.
3448
<24.
90.
290.
761.
7<0
.01
0.08
0.18
5.41
<0.3
SB-2
400M
06El
y06A
FA
3.2
<0.1
2.17
31.5
<24.
94<0
.20.
021.
2<0
.01
<0.0
5<0
.01
5.37
<0.3
SB-2
400M
06El
y06A
RA
3.3
<0.1
2.21
34.2
<25.
02<0
.20.
41.
1<0
.01
0.07
0.1
5.44
<0.3
SB-1
360M
06El
y07A
FA
2.7
<0.1
2.09
19.1
<24.
56<0
.20.
041.
1<0
.01
<0.0
50.
015.
04<0
.3SB
-136
0M06
Ely0
7A R
A3.
3<0
.12.
1520
.9<2
4.67
<0.2
0.36
0.9
<0.0
10.
060.
085.
18<0
.3SB
-140
M06
Ely0
8A F
A1.
4<0
.11.
6113
.6<2
3.41
<0.2
0.06
1<0
.01
0.1
0.01
4.58
<0.3
SB-1
40M
06El
y08A
RA
2.5
<0.1
1.81
20.3
<23.
680.
670.
470.
8<0
.01
0.1
0.1
50.
67O
R-2
4050
M06
Ely0
9A F
A1.
9<0
.11.
464.
7<2
5.22
0.28
0.03
<0.4
<0.0
10.
08<0
.01
5.22
<0.3
OR
-240
50M
06El
y09A
RA
2.8
<0.1
1.56
28.2
<25.
38<0
.20.
240.
5<0
.01
0.2
0.06
5.53
<0.3
OR
-236
30M
06El
y20A
FA
2.6
<0.1
1.61
7.1
<25.
61<0
.20.
03<0
.4<0
.01
0.06
<0.0
15.
23<0
.3O
R-2
3630
M06
Ely2
0A R
A2.
8<0
.11.
7530
.2<2
5.98
<0.2
0.15
0.4
<0.0
10.
10.
045.
480.
76O
R-2
3200
M06
Ely1
0A F
A2.
2<0
.11.
588.
9<2
5.26
<0.2
0.05
0.5
<0.0
10.
20.
015.
05<0
.3O
R-2
3200
M06
Ely1
0A R
A2.
6<0
.11.
6719
.3<2
5.27
<0.2
0.22
0.5
<0.0
10.
10.
065.
25<0
.3EM
-PO
ND
106
ElyP
ond1
FA
0.2
<0.1
0.92
2.7
<21.
08<0
.20.
02<0
.4<0
.01
0.09
<0.0
13.
42<0
.3EM
-PO
ND
106
ElyP
ond1
RA
1.2
<0.1
1.1
7.5
<21.
11<0
.20.
661
0.02
0.3
0.15
4.13
<0.3
EM-P
ON
D2
06El
yPon
d2 F
A0.
2<0
.10.
9820
1<2
1.25
<0.2
0.05
0.4
<0.0
10.
08<0
.01
3.61
<0.3
EM-P
ON
D2
06El
yPon
d2 R
A0.
1<0
.11.
0722
6<2
1.38
<0.2
0.12
0.4
0.01
0.09
0.03
3.83
<0.3
EM-P
ON
D3
06El
yPon
d3 F
A0.
2<0
.11.
143
5<2
1.31
0.38
0.04
0.6
<0.0
10.
1<0
.01
3.73
0.62
EM-P
ON
D3
06El
yPon
d3 R
A<0
.1<0
.11.
1445
4<2
1.34
<0.2
0.09
<0.4
0.01
0.07
0.02
3.85
<0.3
EM-P
ON
D4
06El
yPon
d4 F
A0.
3<0
.11.
2521
2<2
1.29
<0.2
0.06
1.3
<0.0
10.
10.
014.
08<0
.3EM
-PO
ND
406
ElyP
ond4
RA
0.3
<0.1
1.3
241
<21.
33<0
.20.
160.
90.
010.
090.
044.
2<0
.3EM
-PO
ND
506
ElyP
ond5
FA
2.2
<0.1
1.99
386
<21.
24<0
.21.
617.
7<0
.01
<0.0
50.
425.
75<0
.3EM
-PO
ND
506
ElyP
ond5
RA
2.3
<0.1
1.88
387
<21.
14<0
.22.
657.
5<0
.01
<0.0
50.
645.
76<0
.3EM
-PO
ND
606
ElyP
ond6
FA
5.6
<0.1
2.55
564
<21.
020.
311
.916
.7<0
.01
0.4
2.9
7.78
0.52
EM-P
ON
D6
06El
yPon
d6 R
A5.
3<0
.12.
3757
9<2
0.96
<0.2
12.6
16.7
<0.0
10.
43.
117.
95<0
.3

Appendix 6 119A
ppen
dix
6.
Cons
titue
nts
in s
urfa
ce w
ater
s co
llect
ed in
Aug
ust a
nd S
epte
mbe
r 200
6 fro
m th
e El
y M
ine
stud
y ar
ea, V
ersh
ire, V
T.—
Cont
inue
d
[S.C
., sp
ecifi
c co
nduc
tanc
e; D
OC
, dis
solv
ed o
rgan
ic c
arbo
n; µ
S/cm
, mic
rosi
emen
s per
cen
timet
er; m
g/L,
mill
igra
ms p
er li
ter;
cfs,
cubi
c fe
et p
er se
cond
; L/s
, lite
rs p
er se
cond
; µg/
L, m
icro
gram
s per
lite
r; ng
/L,
nano
gram
s per
lite
r; IC
P-A
ES, i
nduc
tivel
y co
uple
d pl
asm
a-at
omic
em
issi
on sp
ectro
scop
y; IC
P-M
S, in
duct
ivel
y co
uple
d pl
asm
a-m
ass s
pect
rom
etry
; IC
, ion
chr
omat
ogra
phy;
CVA
F, c
old-
vapo
r ato
mic
fluo
res-
cenc
e; —
, not
det
erm
ined
; <, a
naly
te n
ot d
etec
ted
at th
e re
porti
ng le
vel]
Site
No.
Prev
ious
sa
mpl
e ID
Sc(µ
g/L)
ICP-
MS
Se(µ
g/L)
ICP-
MS
SiO
2
(mg/
L)IC
P-M
S
Sm (µg/
L)IC
P-M
S
Sr(µ
g/L)
ICP-
MS
Ta(µ
g/L)
ICP-
MS
Tb(µ
g/L)
ICP-
MS
Th(µ
g/L)
ICP-
MS
Ti(µ
g/L)
ICP-
MS
Tl(µ
g/L)
ICP-
MS
Tm (µg/
L)IC
P-M
S
U(µ
g/L)
ICP-
MS
V(µ
g/L)
ICP-
MS
W(µ
g/L)
ICP-
MS
Y(µ
g/L)
ICP-
MS
EB-1
080M
06El
y01A
FA
<0.6
<16.
8<0
.01
47.6
<0.0
2<0
.005
<0.2
<0.5
<0.1
<0.0
05<0
.1<0
.5<0
.50.
03EB
-108
0M06
Ely0
1A R
A0.
6<1
70.
0250
.9<0
.02
<0.0
05<0
.21.
9<0
.1<0
.005
<0.1
<0.5
<0.5
0.07
EB-7
70M
06El
y02A
FA
1.1
<112
.60.
6662
.3<0
.02
0.07
9<0
.2<0
.5<0
.10.
02<0
.1<0
.5<0
.52.
3EB
-770
M06
Ely0
2A R
A1.
4<1
12.2
1.35
61.6
0.04
0.17
<0.2
3.3
<0.1
0.05
0.29
<0.5
<0.5
3.62
EB-6
00M
06El
y03A
FA
0.9
<19.
90.
0752
.60.
090.
009
<0.2
<0.5
<0.1
<0.0
05<0
.1<0
.50.
580.
27EB
-600
M06
Ely0
3A R
A0.
9<1
10.1
0.45
51.9
<0.0
20.
054
<0.2
1.7
<0.1
0.02
0.11
<0.5
<0.5
1.26
EB-9
0M06
Ely0
4A F
A2.
9<1
26.7
2.36
64<0
.02
0.33
<0.2
2.1
<0.1
0.08
10.
42<0
.5<0
.55.
99EB
-90M
06El
y04A
RA
2.8
<124
.92.
5165
.7<0
.02
0.34
<0.2
2.6
<0.1
0.08
50.
43<0
.5<0
.56.
14SB
-367
0M06
Ely0
5A F
A0.
7<1
6.8
<0.0
116
6<0
.02
<0.0
05<0
.2<0
.5<0
.1<0
.005
0.32
<0.5
<0.5
0.02
SB-3
670M
06El
y05A
RA
0.7
<17.
20.
0116
6<0
.02
<0.0
05<0
.21.
3<0
.1<0
.005
0.33
<0.5
<0.5
0.03
SB-3
125M
06El
y19A
FA
0.8
<18.
80.
0215
70.
1<0
.005
<0.2
<0.5
<0.1
<0.0
050.
31<0
.50.
610.
08SB
-312
5M06
Ely1
9A R
A0.
9<1
9.1
0.15
157
0.04
0.02
<0.2
1.4
<0.1
<0.0
050.
32<0
.5<0
.50.
43SB
-240
0M06
Ely0
6A F
A0.
8<1
8.1
<0.0
115
8<0
.02
<0.0
05<0
.2<0
.5<0
.1<0
.005
0.3
<0.5
<0.5
0.03
SB-2
400M
06El
y06A
RA
0.9
<18.
40.
0815
8<0
.02
0.01
<0.2
1<0
.1<0
.005
0.31
<0.5
<0.5
0.23
SB-1
360M
06El
y07A
FA
0.8
<17.
70.
0115
2<0
.02
<0.0
05<0
.2<0
.5<0
.1<0
.005
0.27
<0.5
<0.5
0.04
SB-1
360M
06El
y07A
RA
0.8
<18.
10.
0715
5<0
.02
0.01
<0.2
0.9
<0.1
<0.0
050.
28<0
.5<0
.50.
22SB
-140
M06
Ely0
8A F
A0.
7<1
6.5
<0.0
113
4<0
.02
<0.0
05<0
.2<0
.5<0
.1<0
.005
0.24
<0.5
<0.5
0.04
SB-1
40M
06El
y08A
RA
0.8
<17.
30.
0914
40.
10.
01<0
.23.
4<0
.1<0
.005
0.28
<0.5
0.56
0.26
OR
-240
50M
06El
y09A
FA
0.6
<16
<0.0
113
80.
05<0
.005
<0.2
<0.5
<0.1
<0.0
050.
24<0
.5<0
.50.
03O
R-2
4050
M06
Ely0
9A R
A0.
7<1
6.6
0.04
141
<0.0
20.
006
<0.2
7.2
<0.1
<0.0
050.
260.
5<0
.50.
18O
R-2
3630
M06
Ely2
0A F
A0.
7<1
6.5
<0.0
113
9<0
.02
<0.0
05<0
.2<0
.5<0
.1<0
.005
0.24
<0.5
<0.5
0.03
OR
-236
30M
06El
y20A
RA
0.8
<17.
20.
0314
20.
06<0
.005
<0.2
4.3
<0.1
<0.0
050.
25<0
.5<0
.50.
13O
R-2
3200
M06
Ely1
0A F
A0.
7<1
6.5
<0.0
113
9<0
.02
<0.0
05<0
.20.
6<0
.1<0
.005
0.24
<0.5
<0.5
0.04
OR
-232
00M
06El
y10A
RA
0.7
<16.
90.
0414
1<0
.02
0.00
6<0
.23.
8<0
.1<0
.005
0.25
<0.5
<0.5
0.15
EM-P
ON
D1
06El
yPon
d1 F
A<0
.6<1
1.8
<0.0
120
.5<0
.02
<0.0
05<0
.2<0
.5<0
.1<0
.005
<0.1
<0.5
<0.5
0.02
EM-P
ON
D1
06El
yPon
d1 R
A<0
.6<1
2.7
0.16
21.8
<0.0
20.
02<0
.230
.4<0
.10.
005
<0.1
1.4
<0.5
0.4
EM-P
ON
D2
06El
yPon
d2 F
A<0
.6<1
3.9
<0.0
129
.5<0
.02
<0.0
05<0
.2<0
.5<0
.1<0
.005
<0.1
<0.5
<0.5
0.05
EM-P
ON
D2
06El
yPon
d2 R
A0.
6<1
4.3
0.02
31.9
<0.0
20.
005
<0.2
2.2
<0.1
<0.0
05<0
.1<0
.5<0
.50.
1EM
-PO
ND
306
ElyP
ond3
FA
0.6
<14.
50.
0134
.8<0
.02
<0.0
05<0
.2<0
.5<0
.1<0
.005
<0.1
<0.5
0.51
0.04
EM-P
ON
D3
06El
yPon
d3 R
A0.
7<1
4.7
0.02
36.1
<0.0
2<0
.005
<0.2
1<0
.1<0
.005
<0.1
<0.5
<0.5
0.08
EM-P
ON
D4
06El
yPon
d4 F
A0.
7<1
4.7
0.01
38.2
<0.0
2<0
.005
<0.2
<0.5
<0.1
<0.0
05<0
.1<0
.5<0
.50.
06EM
-PO
ND
406
ElyP
ond4
RA
0.7
<14.
90.
0339
.6<0
.02
0.00
5<0
.21.
9<0
.1<0
.005
<0.1
<0.5
<0.5
0.12
EM-P
ON
D5
06El
yPon
d5 F
A0.
9<1
70.
2243
.4<0
.02
0.03
<0.2
<0.5
<0.1
0.00
7<0
.1<0
.5<0
.50.
88EM
-PO
ND
506
ElyP
ond5
RA
0.9
<16.
70.
4543
.3<0
.02
0.06
3<0
.20.
7<0
.10.
02<0
.1<0
.5<0
.51.
37EM
-PO
ND
606
ElyP
ond6
FA
1.1
<18.
32.
0950
.4<0
.02
0.29
<0.2
0.9
<0.1
0.07
20.
2<0
.50.
535.
91EM
-PO
ND
606
ElyP
ond6
RA
1<1
82.
2452
.6<0
.02
0.31
<0.2
1.9
<0.1
0.07
60.
225.
1<0
.56.
16

120 Aquatic Assessment of the Ely Copper Mine Superfund Site, Vershire, VermontA
ppen
dix
6.
Cons
titue
nts
in s
urfa
ce w
ater
s co
llect
ed in
Aug
ust a
nd S
epte
mbe
r 200
6 fro
m th
e El
y M
ine
stud
y ar
ea, V
ersh
ire, V
T.—
Cont
inue
d
[S.C
., sp
ecifi
c co
nduc
tanc
e; D
OC
, dis
solv
ed o
rgan
ic c
arbo
n; µ
S/cm
, mic
rosi
emen
s per
cen
timet
er; m
g/L,
mill
igra
ms p
er li
ter;
cfs,
cubi
c fe
et p
er se
cond
; L/s
, lite
rs p
er se
cond
; µg/
L, m
icro
gram
s per
lite
r; ng
/L,
nano
gram
s per
lite
r; IC
P-A
ES, i
nduc
tivel
y co
uple
d pl
asm
a-at
omic
em
issi
on sp
ectro
scop
y; IC
P-M
S, in
duct
ivel
y co
uple
d pl
asm
a-m
ass s
pect
rom
etry
; IC
, ion
chr
omat
ogra
phy;
CVA
F, c
old-
vapo
r ato
mic
fluo
res-
cenc
e; —
, not
det
erm
ined
; <, a
naly
te n
ot d
etec
ted
at th
e re
porti
ng le
vel]
Site
No.
Prev
ious
sa
mpl
e ID
Yb(µ
g/L)
ICP-
MS
Zn(µ
g/L)
ICP-
MS
Zr(µ
g/L)
ICP-
MS
Job
No.
ICLa
b N
o.IC
Fiel
d N
o.IC
Cl(m
g/L)
IC
F(m
g/L)
IC
NO
3
(mg/
L)IC
SO4
(mg/
L)IC
Job
No.
CVA
FLa
b N
o.CV
AF
Fiel
d N
o.CV
AF
Hg
(ng/
L)CV
AF
EB-1
080M
06El
y01A
FA
<0.0
055.
6<0
.2M
RP-
0754
0C
-289
414
06El
y01A
FU
1.4
<.08
<.08
4.3
MR
P-07
542
C-2
8949
006
Ely0
1A H
g<5
EB-1
080M
06El
y01A
RA
0.00
616
.4<0
.2—
——
——
——
——
——
EB-7
70M
06El
y02A
FA
0.14
114
<0.2
MR
P-07
540
C-2
8941
606
Ely0
2A F
U1.
40.
10.
552
MR
P-07
542
C-2
8949
206
Ely0
2A H
g<5
EB-7
70M
06El
y02A
RA
0.3
109
<0.2
——
——
——
——
——
—EB
-600
M06
Ely0
3A F
A0.
0264
.2<0
.2M
RP-
0754
0C
-289
418
06El
y03A
FU
1.5
0.1
0.5
36M
RP-
0754
2C
-289
494
06El
y03A
Hg
<5EB
-600
M06
Ely0
3A R
A0.
1154
.9<0
.2—
——
——
——
——
——
EB-9
0M06
Ely0
4A F
A0.
537
3<0
.2M
RP-
0754
0C
-289
420
06El
y04A
FU
2.6
0.5
114
3M
RP-
0754
2C
-289
496
06El
y04A
Hg
<5EB
-90M
06El
y04A
RA
0.52
342
<0.2
——
——
——
——
——
—SB
-367
0M06
Ely0
5A F
A<0
.005
2.8
<0.2
MR
P-07
540
C-2
8942
206
Ely0
5A F
U4.
20.
30.
69
MR
P-07
542
C-2
8949
806
Ely0
5A H
g<5
SB-3
670M
06El
y05A
RA
<0.0
052.
8<0
.2—
——
——
——
——
——
SB-3
125M
06El
y19A
FA
0.00
715
.6<0
.2M
RP-
0754
0C
-289
425
06El
y19A
FU
4.6
0.09
0.6
13M
RP-
0754
2C
-289
501
06El
y19A
Hg
<5SB
-312
5M06
Ely1
9A R
A0.
0424
.7<0
.2—
——
——
——
——
——
SB-2
400M
06El
y06A
FA
<0.0
056.
6<0
.2M
RP-
0754
0C
-289
428
06El
y06A
FU
5<.
080.
616
MR
P-07
542
C-2
8950
406
Ely0
6A H
g<5
SB-2
400M
06El
y06A
RA
0.02
15.8
<0.2
——
——
——
——
——
—SB
-136
0M06
Ely0
7A F
A<0
.005
19.8
<0.2
MR
P-07
540
C-2
8943
106
Ely0
7A F
U4.
6<.
080.
514
MR
P-07
542
C-2
8950
706
Ely0
7A H
g<5
SB-1
360M
06El
y07A
RA
0.02
13<0
.2—
——
——
——
——
——
SB-1
40M
06El
y08A
FA
<0.0
0512
.8<0
.2M
RP-
0754
0C
-289
433
06El
y08A
FU
4<.
080.
513
MR
P-07
542
C-2
8950
906
Ely0
8A H
g<5
SB-1
40M
06El
y08A
RA
0.02
10.3
<0.2
——
——
——
——
——
—O
R-2
4050
M06
Ely0
9A F
A<0
.005
9.3
<0.2
MR
P-07
540
C-2
8943
506
Ely0
9A F
U5.
7<.
080.
67.
2M
RP-
0754
2C
-289
511
06El
y09A
Hg
<5O
R-2
4050
M06
Ely0
9A R
A0.
0216
.3<0
.2—
——
——
——
——
——
OR
-236
30M
06El
y20A
FA
<0.0
0512
.5<0
.2M
RP-
0754
0C
-289
437
06El
y20A
FU
6<.
080.
68
MR
P-07
542
C-2
8951
306
Ely2
0A H
g<5
OR
-236
30M
06El
y20A
RA
0.01
3<0
.2—
——
——
——
——
——
OR
-232
00M
06El
y10A
FA
<0.0
056.
9<0
.2M
RP-
0754
0C
-289
438
06El
y10A
FU
5.4
0.1
0.5
8M
RP-
0754
2C
-289
514
06El
y10A
Hg
<5O
R-2
3200
M06
Ely1
0A R
A0.
013.
3<0
.2—
——
——
——
——
——
EM-P
ON
D1
06El
yPon
d1 F
A<0
.005
2.3
<0.2
MR
P-07
597
C-2
9056
706
ElyP
ond1
FU
0.11
<.08
<.08
6.3
——
——
EM-P
ON
D1
06El
yPon
d1 R
A0.
033
<0.2
——
——
——
——
——
—EM
-PO
ND
206
ElyP
ond2
FA
<0.0
0511
.5<0
.2M
RP-
0759
7C
-290
568
06El
yPon
d2 F
U1.
40.
10.
65.
4—
——
—EM
-PO
ND
206
ElyP
ond2
RA
0.00
81.
1<0
.2—
——
——
——
——
——
EM-P
ON
D3
06El
yPon
d3 F
A0.
006
2.4
<0.2
MR
P-07
597
C-2
9056
906
ElyP
ond3
FU
1.3
<.08
0.6
5—
——
—EM
-PO
ND
306
ElyP
ond3
RA
0.00
80.
8<0
.2—
——
——
——
——
——
EM-P
ON
D4
06El
yPon
d4 F
A<0
.005
14.8
<0.2
MR
P-07
597
C-2
9057
006
ElyP
ond4
FU
0.21
0.1
<.08
8.1
——
——
EM-P
ON
D4
06El
yPon
d4 R
A0.
0117
.7<0
.2—
——
——
——
——
——
EM-P
ON
D5
06El
yPon
d5 F
A0.
0414
3<0
.2M
RP-
0759
7C
-290
571
06El
yPon
d5 F
U1.
30.
10.
633
——
——
EM-P
ON
D5
06El
yPon
d5 R
A0.
114
3<0
.2—
——
——
——
——
——
EM-P
ON
D6
06El
yPon
d6 F
A0.
4332
5<0
.2M
RP-
0759
7C
-290
572
06El
yPon
d6 F
U0.
20.
40.
693
——
——
EM-P
ON
D6
06El
yPon
d6 R
A0.
4632
8<0
.2—
——
——
——
——
——
a Est
imat
ed v
alue
, rep
orte
d co
ncen
tratio
n is
less
than
the
repo
rting
leve
l but
gre
ater
than
the
long
-term
met
hod-
dete
ctio
n le
vel.

Appendix 7 121A
ppen
dix
7.
Cons
titue
nts
in p
ore
wat
ers
colle
cted
in A
ugus
t and
Sep
tem
ber 2
006
from
the
Ely
Min
e st
udy
area
, Ver
shire
, VT.
[S.C
., sp
ecifi
c co
nduc
tanc
e; D
OC
, dis
solv
ed o
rgan
ic c
arbo
n; µ
S/cm
, mic
rosi
emen
s per
cen
timet
er; m
g/L,
mill
igra
ms p
er li
ter;
cfs,
cubi
c fe
et p
er se
cond
; L/s
, lite
rs p
er se
cond
; µg/
L, m
icro
gram
s per
lite
r; ng
/L,
nano
gram
s per
lite
r; IC
P-A
ES, i
nduc
tivel
y co
uple
d pl
asm
a-at
omic
em
issi
on sp
ectro
scop
y; IC
P-M
S, in
duct
ivel
y co
uple
d pl
asm
a-m
ass s
pect
rom
etry
; IC
, ion
chr
omat
ogra
phy;
CVA
F, c
old-
vapo
r ato
mic
fluo
res-
cenc
e; —
, not
det
erm
ined
; <, a
naly
te n
ot d
etec
ted
at th
e re
porti
ng le
vel;
ins,
insu
ffici
ent s
ampl
e]
Site
No.
Prev
ious
sa
mpl
e ID
Split
Sam
ple
type
Dat
epH
S.C.
(µS/
cm)
Alk
alin
ity(m
g/L
as
CaCO
3)
DO
C(m
g/L)
Am
mon
ia(m
g/L
as
N)
Nitr
ite(m
g/L
as
N)
NO
2+NO
3
(mg/
L
as N
)
Tota
l N(m
g/L)
Phos
phor
us(m
g/L)
Ort
hoph
os-
phat
e(m
g/L
as P
)
Job.
No.
ICP-
AES
&
ICP-
MS
EB-1
080M
06El
y01B
FA
filte
red
in si
tu8/
23/2
006
7.1
8540
1.6
<0.0
1<0
.002
<0.0
60.
080.
003
Ea0.
005
EM
RP-
0754
1EB
-108
0M06
Ely0
1B R
Ara
win
situ
8/23
/200
67.
185
——
——
——
——
MR
P-07
541
EB-1
080M
06El
y01C
FA
filte
red
cent
rifug
e8/
23/2
006
——
——
——
——
——
MR
P-07
596
EB-1
080M
06El
y01D
FA
filte
red
equi
lbra
ted
9/20
/200
67.
538
920
4.8
——
——
——
—M
RP-
0759
6EB
-770
M06
Ely0
2B F
Afil
tere
din
situ
8/23
/200
66.
113
111
10.
009
E<0
.002
<0.0
60.
04 E
<0.0
040.
005
EM
RP-
0754
1EB
-770
M06
Ely0
2B R
Ara
win
situ
8/23
/200
66.
113
1—
——
——
——
—M
RP-
0754
1EB
-770
M06
Ely0
2C F
Afil
tere
dce
ntrif
uge
8/23
/200
6—
——
——
——
——
—M
RP-
0759
6EB
-770
M06
Ely0
2D F
Afil
tere
deq
uilb
rate
d9/
20/2
006
6.0
400
39.6
——
——
——
—M
RP-
0759
6EB
-600
M06
Ely0
3B F
Afil
tere
din
situ
8/23
/200
66.
911
915
1<0
.01
<0.0
02<0
.06
0.05
E0.
004
E0.
005
EM
RP-
0754
1EB
-600
M06
Ely0
3B R
Ara
win
situ
8/23
/200
66.
911
9—
——
——
——
—M
RP-
0754
1EB
-600
M06
Ely0
3C F
Afil
tere
dce
ntrif
uge
8/23
/200
6—
——
——
——
——
—M
RP-
0759
6EB
-600
M06
Ely0
3D F
Afil
tere
deq
uilb
rate
d9/
20/2
006
7.0
164.
230
.4—
——
——
——
MR
P-07
596
EB-9
0M06
Ely0
4B F
Afil
tere
din
situ
8/23
/200
62.
959
4—
1.3
0.1
<0.0
02<0
.06
0.17
0.00
40.
009
MR
P-07
543
EB-9
0M06
Ely0
4B R
Ara
win
situ
8/23
/200
62.
959
4—
——
——
——
—M
RP-
0754
3EB
-90M
06El
y04C
FA
filte
red
cent
rifug
e8/
23/2
006
——
——
——
——
——
MR
P-07
596
EB-9
0M06
Ely0
4D F
Afil
tere
deq
uilb
rate
d9/
20/2
006
3.2
1,06
3—
——
——
——
—M
RP-
0759
6SB
-367
0M06
Ely0
5B F
Afil
tere
din
situ
8/22
/200
67.
725
111
61.
5<0
.01
0.00
2 E
<0.0
60.
070.
004
0.00
4 E
MR
P-07
543
SB-3
670M
06El
y05B
RA
raw
in si
tu8/
22/2
006
7.7
251
——
——
——
——
MR
P-07
543
SB-3
670M
06El
y05C
FA
filte
red
cent
rifug
e8/
22/2
006
——
——
——
——
——
MR
P-07
596
SB-3
670M
06El
y05D
FA
filte
red
equi
lbra
ted
9/19
/200
67.
856
128
4—
——
——
——
MR
P-07
596
SB-2
400M
06El
y06B
FA
filte
red
in si
tu8/
22/2
006
7.7
347
126
10.
029
0.00
2 E
<0.0
60.
090.
006
0.00
6M
RP-
0754
3SB
-240
0M06
Ely0
6B R
Ara
win
situ
8/22
/200
67.
734
7—
——
——
——
—M
RP-
0754
3SB
-240
0M06
Ely0
6C F
Afil
tere
dce
ntrif
uge
8/22
/200
6—
——
——
——
——
—M
RP-
0759
6SB
-240
0M06
Ely0
6D F
Afil
tere
deq
uilb
rate
d9/
19/2
006
7.6
563
172.
8—
——
——
——
MR
P-07
596
SB-1
360M
06El
y07B
FA
filte
red
in si
tu8/
23/2
006
7.7
218
921.
60.
036
0.00
60.
110.
240.
006
0.00
6 E
MR
P-07
543
SB-1
360M
06El
y07B
RA
raw
in si
tu8/
23/2
006
7.7
218
——
——
——
——
MR
P-07
543
SB-1
360M
06El
y07C
FA
filte
red
cent
rifug
e8/
23/2
006
——
——
——
——
——
MR
P-07
596
SB-1
360M
06El
y07D
FA
filte
red
equi
lbra
ted
9/20
/200
67.
452
319
0.4
——
——
——
—M
RP-
0759
6SB
-140
M06
Ely0
8B F
Afil
tere
din
situ
8/21
/200
67.
626
010
70.
9<0
.01
<0.0
020.
110.
150.
004
E0.
004
EM
RP-
0754
3SB
-140
M06
Ely0
8B R
Ara
win
situ
8/21
/200
67.
626
0—
——
——
——
—M
RP-
0754
3SB
-140
M06
Ely0
8C F
Afil
tere
dce
ntrif
uge
8/22
/200
6—
——
——
——
——
—M
RP-
0759
6SB
-140
M06
Ely0
8D F
Afil
tere
deq
uilb
rate
d9/
19/2
006
7.4
531
212.
4—
——
——
——
MR
P-07
596
OR
-240
50M
06El
y09B
FA
filte
red
in si
tu8/
21/2
006
7.6
359
150
1.4
0.05
10.
039
0.85
1.04
0.00
60.
006
MR
P-07
543
OR
-240
50M
06El
y09B
RA
raw
in si
tu8/
21/2
006
7.6
359
——
——
——
——
MR
P-07
543
OR
-240
50M
06El
y09C
FA
filte
red
cent
rifug
e8/
22/2
006
——
——
——
——
——
MR
P-07
596
OR
-240
50M
06El
y09D
FA
filte
red
equi
lbra
ted
9/19
/200
67.
970
9—
——
——
——
—M
RP-
0759
6O
R-2
3200
M06
Ely1
0B F
Afil
tere
din
situ
8/21
/200
67.
627
710
51.
40.
077
0.00
50.
04 E
0.2
0.00
50.
004
EM
RP-
0754
3O
R-2
3200
M06
Ely1
0B R
Ara
win
situ
8/21
/200
67.
627
7—
——
——
——
—M
RP-
0754
3O
R-2
3200
M06
Ely1
0C F
Afil
tere
dce
ntrif
uge
8/22
/200
6—
——
——
——
——
—M
RP-
0759
6O
R-2
3200
M06
Ely1
0D F
Afil
tere
deq
uilb
rate
d9/
19/2
006
7.4
535
250.
8—
——
——
——
MR
P-07
596

122 Aquatic Assessment of the Ely Copper Mine Superfund Site, Vershire, VermontA
ppen
dix
7.
Cons
titue
nts
in p
ore
wat
ers
colle
cted
in A
ugus
t and
Sep
tem
ber 2
006
from
the
Ely
Min
e st
udy
area
, Ver
shire
, VT.
—Co
ntin
ued
[S.C
., sp
ecifi
c co
nduc
tanc
e; D
OC
, dis
solv
ed o
rgan
ic c
arbo
n; µ
S/cm
, mic
rosi
emen
s per
cen
timet
er; m
g/L,
mill
igra
ms p
er li
ter;
cfs,
cubi
c fe
et p
er se
cond
; L/s
, lite
rs p
er se
cond
; µg/
L, m
icro
gram
s per
lite
r; ng
/L,
nano
gram
s per
lite
r; IC
P-A
ES, i
nduc
tivel
y co
uple
d pl
asm
a-at
omic
em
issi
on sp
ectro
scop
y; IC
P-M
S, in
duct
ivel
y co
uple
d pl
asm
a-m
ass s
pect
rom
etry
; IC
, ion
chr
omat
ogra
phy;
CVA
F, c
old-
vapo
r ato
mic
fluo
res-
cenc
e; —
, not
det
erm
ined
; <, a
naly
te n
ot d
etec
ted
at th
e re
porti
ng le
vel;
ins,
insu
ffici
ent s
ampl
e]
Site
No.
Prev
ious
sa
mpl
e ID
Lab
No.
ICP-
AES
&
ICP-
MS
Ag
(µg/
L)IC
P-A
ES
Al
(µg/
L)IC
P-A
ES
As
(µg/
L)IC
P-A
ES
B(µ
g/L)
ICP-
AES
Ba
(µg/
L)IC
P-A
ES
Be
(µg/
L)IC
P-A
ES
Ca(m
g/L)
ICP-
AES
Cd(µ
g/L)
ICP-
AES
Co(µ
g/L)
ICP-
AES
Cr(µ
g/L)
ICP-
AES
Cu(µ
g/L)
ICP-
AES
Fe(µ
g/L)
ICP-
AES
K(m
g/L)
ICP-
AES
Li(µ
g/L)
ICP-
AES
EB-1
080M
06El
y01B
FA
C-2
8944
8<5
<20
<200
<519
<10
12.6
<5<1
0<1
0<1
0<2
01.
68<5
EB-1
080M
06El
y01B
RA
C-2
8944
9<5
<20
<200
<518
<10
13<5
<10
<10
<10
381.
69<5
EB-1
080M
06El
y01C
FA
C-2
9054
3<5
135
<200
<542
<10
28<5
<10
<10
1243
62.
78<5
EB-1
080M
06El
y01D
FA
C-2
9054
4<5
<20
<200
<589
<10
69.5
<5<1
0<1
0<1
0<2
04.
84<5
EB-7
70M
06El
y02B
FA
C-2
8946
1<5
<20
<200
<514
<10
14.3
<5<1
0<1
029
145
2.16
<5EB
-770
M06
Ely0
2B R
AC
-289
462
<535
<200
<516
<10
15.6
<5<1
0<1
039
186
2.37
<5EB
-770
M06
Ely0
2C F
AC
-290
545
<580
<200
<540
<10
32<5
85<1
054
323.
45<5
EB-7
70M
06El
y02D
FA
C-2
9054
6<5
<20
<200
6.2
86<1
056
.1<5
95<1
013
174
77.
32<5
EB-6
00M
06El
y03B
FA
C-2
8945
5<5
<20
<200
<519
<10
14.4
<5<1
0<1
045
<20
2.13
<5EB
-600
M06
Ely0
3B R
AC
-289
456
<521
6<2
00<5
20<1
014
.8<5
<10
<10
8721
22.
2<5
EB-6
00M
06El
y03C
FA
C-2
9053
9<5
456
<200
<522
<10
16.8
<5<1
0<1
012
552
2.6
5.8
EB-6
00M
06El
y03D
FA
C-2
9054
0<5
<20
<200
<531
<10
21.6
<510
<10
68<2
04.
045.
8EB
-90M
06El
y04B
FA
C-2
8955
4<5
4,83
0<2
00<5
21<1
020
.4<5
74<1
02,
180
11,0
004.
8715
EB-9
0M06
Ely0
4B R
AC
-289
555
<54,
990
<200
<522
<10
21<5
76<1
02,
240
12,0
005.
0415
EB-9
0M06
Ely0
4C F
AC
-290
562
<58,
760
<200
<528
<10
29.1
<575
<10
2,03
016
3,10
010
.333
EB-9
0M06
Ely0
4D F
AC
-290
563
<510
,000
<200
<525
<10
28.7
<529
9<1
02,
640
47,0
005.
2422
SB-3
670M
06El
y05B
FA
C-2
8952
9<5
<20
<200
<526
<10
41.2
<5<1
0<1
0<1
0<2
02.
48<5
SB-3
670M
06El
y05B
RA
C-2
8953
0<5
42<2
00<5
27<1
042
.1<5
<10
<10
<10
242.
57<5
SB-3
670M
06El
y05C
FA
C-2
9055
4<5
98<2
005.
347
<10
64.5
<5<1
0<1
0<1
010
13.
48<5
SB-3
670M
06El
y05D
FA
C-2
9055
55.
4<2
0<2
005.
982
<10
104
<5<1
0<1
0<1
0<2
05.
02<5
SB-2
400M
06El
y06B
FA
C-2
8953
9<5
<20
<200
<529
<10
46.6
<5<1
0<1
0<1
0<2
04.
09<5
SB-2
400M
06El
y06B
RA
C-2
8954
0<5
26<2
00<5
29<1
047
.2<5
<10
<10
1128
4.15
<5SB
-240
0M06
Ely0
6C F
AC
-290
556
<520
2<2
0031
40<1
068
.8<5
<10
<10
1621
34.
22<5
SB-2
400M
06El
y06D
FA
C-2
9055
7<5
45<2
006.
967
<10
92.1
<5<1
0<1
022
307.
19<5
SB-1
360M
06El
y07B
FA
C-2
8952
5<5
<20
<200
<520
<10
34.6
<5<1
0<1
0<1
0<2
02.
81<5
SB-1
360M
06El
y07B
RA
C-2
8952
6<5
82<2
00<5
21<1
036
.3<5
<10
<10
1154
2.94
<5SB
-136
0M06
Ely0
7C F
AC
-290
548
<574
<200
<532
<10
52.1
<5<1
0<1
017
793.
64<5
SB-1
360M
06El
y07D
FA
C-2
9054
9<5
20<2
007.
179
<10
93.6
<5<1
0<1
025
<20
7.39
<5SB
-140
M06
Ely0
8B F
AC
-289
535
<5<2
0<2
00<5
26<1
039
.9<5
<10
<10
<10
<20
2.71
<5SB
-140
M06
Ely0
8B R
AC
-289
536
<528
<200
<527
<10
41.1
<5<1
0<1
0<1
0<2
02.
78<5
SB-1
40M
06El
y08C
FA
C-2
9055
0<5
<20
<200
5.7
45<1
065
.8<5
<10
<10
<10
283.
65<5
SB-1
40M
06El
y08D
FA
C-2
9055
1<5
<20
<200
8.3
88<1
010
1<5
<10
<10
25<2
07.
31<5
OR
-240
50M
06El
y09B
FA
C-2
8954
3<5
<20
<200
1248
<10
51.6
<5<1
0<1
0<1
0<2
07.
18<5
OR
-240
50M
06El
y09B
RA
C-2
8954
4<5
27<2
0012
54<1
051
.7<5
<10
<10
<10
<20
7.26
<5O
R-2
4050
M06
Ely0
9C F
AC
-290
560
<5<2
0<2
0014
69<1
068
.5<5
<10
<10
<10
307.
99<5
OR
-240
50M
06El
y09D
FA
C-2
9056
1<5
<20
<200
1514
3<1
013
7<5
<10
<10
<10
<20
12.9
<5O
R-2
3200
M06
Ely1
0B F
AC
-289
537
<5<2
0<2
00<5
23<1
035
.8<5
<10
<10
<10
<20
3.18
<5O
R-2
3200
M06
Ely1
0B R
AC
-289
538
<547
<200
<524
<10
36.6
<5<1
0<1
0<1
047
3.24
<5O
R-2
3200
M06
Ely1
0C F
AC
-290
552
<549
<200
<556
<10
68.9
<5<1
0<1
013
233.
73<5
OR
-232
00M
06El
y10D
FA
C-2
9055
3<5
<20
<200
6.3
85<1
086
.8<5
<10
<10
17<2
05.
46<5

Appendix 7 123A
ppen
dix
7.
Cons
titue
nts
in p
ore
wat
ers
colle
cted
in A
ugus
t and
Sep
tem
ber 2
006
from
the
Ely
Min
e st
udy
area
, Ver
shire
, VT.
—Co
ntin
ued
[S.C
., sp
ecifi
c co
nduc
tanc
e; D
OC
, dis
solv
ed o
rgan
ic c
arbo
n; µ
S/cm
, mic
rosi
emen
s per
cen
timet
er; m
g/L,
mill
igra
ms p
er li
ter;
cfs,
cubi
c fe
et p
er se
cond
; L/s
, lite
rs p
er se
cond
; µg/
L, m
icro
gram
s per
lite
r; ng
/L,
nano
gram
s per
lite
r; IC
P-A
ES, i
nduc
tivel
y co
uple
d pl
asm
a-at
omic
em
issi
on sp
ectro
scop
y; IC
P-M
S, in
duct
ivel
y co
uple
d pl
asm
a-m
ass s
pect
rom
etry
; IC
, ion
chr
omat
ogra
phy;
CVA
F, c
old-
vapo
r ato
mic
fluo
res-
cenc
e; —
, not
det
erm
ined
; <, a
naly
te n
ot d
etec
ted
at th
e re
porti
ng le
vel;
ins,
insu
ffici
ent s
ampl
e]
Site
No.
Prev
ious
sa
mpl
e ID
Mg
(mg/
L)IC
P-A
ES
Mn
(µg/
L)IC
P-A
ES
Mo
(µg/
L)IC
P-A
ES
Na
(mg/
L)IC
P-A
ES
Ni
(µg/
L)IC
P-A
ES
P(m
g/L)
ICP-
AES
Pb(µ
g/L)
ICP-
AES
Sb(µ
g/L)
ICP-
AES
SiO
2
(mg/
L)IC
P-A
ES
SO4
(mg/
L)IC
P-A
ES
Sr(µ
g/L)
ICP-
AES
Ti(µ
g/L)
ICP-
AES
V(µ
g/L)
ICP-
AES
Zn(µ
g/L)
ICP-
AES
Ag
(µg/
L)IC
P-M
SEB
-108
0M06
Ely0
1B F
A1.
18<1
0<2
01.
13<1
0<0
.5<5
0<5
09
449
<50
<10
<20
<3EB
-108
0M06
Ely0
1B R
A1.
18<1
0<2
01.
11<1
0<0
.5<5
0<5
09.
14.
149
<50
<10
<20
<3EB
-108
0M06
Ely0
1C F
A2.
5357
<20
1.71
<10
<0.5
<50
<50
9.7
10.7
114
<50
<10
33<3
EB-1
080M
06El
y01D
FA
6.42
3,00
0<2
02.
79<1
0<0
.5<5
0<5
012
.715
.825
8<5
0<1
0<2
0<3
EB-7
70M
06El
y02B
FA
2.41
46<2
01.
41<1
0<0
.5<5
0<5
012
.840
.753
<50
<10
25<3
EB-7
70M
06El
y02B
RA
2.65
51<2
01.
51<1
0<0
.5<5
0<5
014
44.3
58<5
0<1
024
<3EB
-770
M06
Ely0
2C F
A5.
383,
510
<20
1.95
15<0
.5<5
0<5
015
97.6
124
<50
<10
59<3
EB-7
70M
06El
y02D
FA
9.29
6,59
0<2
03.
5124
<0.5
<50
<50
25.3
170
212
<50
<10
126
<3EB
-600
M06
Ely0
3B F
A2.
2917
<20
1.4
<10
<0.5
<50
<50
1336
.251
<50
<10
26<3
EB-6
00M
06El
y03B
RA
2.38
22<2
01.
43<1
0<0
.5<5
0<5
013
.636
.753
<50
<10
28<3
EB-6
00M
06El
y03C
FA
2.56
31<2
01.
47<1
0<0
.5<5
0<5
012
.439
.658
<50
<10
28<3
EB-6
00M
06El
y03D
FA
3.16
495
<20
2.4
<10
<0.5
<50
<50
15.9
48.7
87<5
0<1
027
<3EB
-90M
06El
y04B
FA
5.43
606
<20
2.34
21<0
.5<5
0<5
032
.816
265
<50
<10
345
<3EB
-90M
06El
y04B
RA
5.58
623
<20
2.4
21<0
.5<5
0<5
033
.616
667
<50
<10
350
<3EB
-90M
06El
y04C
FA
8.58
3,47
0<2
05.
4246
<0.5
<50
<50
69.8
515
114
<50
<10
643
<3EB
-90M
06El
y04D
FA
7.61
3,31
0<2
04.
2336
<0.5
<50
<50
39.5
280
97<5
0<1
057
7<3
SB-3
670M
06El
y05B
FA
1.88
<10
<20
4.12
<10
<0.5
<50
<50
7.6
8.9
198
<50
<10
<20
<3SB
-367
0M06
Ely0
5B R
A1.
94<1
0<2
04.
2<1
0<0
.5<5
0<5
07.
88.
920
5<5
0<1
0<2
0<3
SB-3
670M
06El
y05C
FA
2.61
<10
<20
4.69
<10
<0.5
<50
<50
1015
.429
8<5
0<1
0<2
0<3
SB-3
670M
06El
y05D
FA
4.29
4,00
0<2
06.
33<1
0<0
.5<5
0<5
011
.817
.847
5<5
0<1
0<2
0<3
SB-2
400M
06El
y06B
FA
3.19
117
<20
16.2
<10
<0.5
<50
<50
10.3
2121
9<5
0<1
0<2
0<3
SB-2
400M
06El
y06B
RA
3.23
118
<20
16.3
<10
<0.5
<50
<50
10.3
20.9
222
<50
<10
<20
<3SB
-240
0M06
Ely0
6C F
A6.
2116
5<2
015
.4<1
0<0
.5<5
0<5
011
.843
.731
7<5
0<1
0<2
0<3
SB-2
400M
06El
y06D
FA
5.26
1,14
0<2
015
.3<1
0<0
.5<5
0<5
016
.510
844
7<5
0<1
0<2
0<3
SB-1
360M
06El
y07B
FA
1.95
33<2
03.
78<1
0<0
.5<5
0<5
08.
816
.317
4<5
0<1
0<2
0<3
SB-1
360M
06El
y07B
RA
2.07
37<2
03.
94<1
0<0
.5<5
0<5
09.
417
183
<50
<10
<20
<3SB
-136
0M06
Ely0
7C F
A3.
1618
3<2
04.
47<1
0<0
.5<5
0<5
010
34.1
242
<50
<10
<20
<3SB
-136
0M06
Ely0
7D F
A5.
72,
030
<20
6.74
<10
<0.5
<50
<50
16.4
95.8
464
<50
<10
<20
<3SB
-140
M06
Ely0
8B F
A2.
02<1
0<2
06.
03<1
0<0
.5<5
0<5
08.
116
184
<50
<10
<20
<3SB
-140
M06
Ely0
8B R
A2.
07<1
0<2
06.
18<1
0<0
.5<5
0<5
08.
416
.318
9<5
0<1
0<2
0<3
SB-1
40M
06El
y08C
FA
3.18
233
<20
5.54
<10
<0.5
<50
<50
9.4
24.6
296
<50
<10
<20
<3SB
-140
M06
Ely0
8D F
A5.
661,
400
<20
9.68
<10
<0.5
<50
<50
15.8
75.8
470
<50
<10
<20
<3O
R-2
4050
M06
Ely0
9B F
A2.
9920
5<2
010
.9<1
0<0
.5<5
0<5
09.
89.
124
1<5
0<1
0<2
0<3
OR
-240
50M
06El
y09B
RA
3.03
207
<20
11<1
0<0
.5<5
0<5
09.
99.
224
3<5
0<1
0<2
0<3
OR
-240
50M
06El
y09C
FA
4.05
<10
<20
12.6
<10
<0.5
<50
<50
10.6
16.2
318
<50
<10
24in
sO
R-2
4050
M06
Ely0
9D F
A7.
786,
830
<20
16.5
<10
<0.5
<50
<50
16.1
1262
7<5
0<1
0<2
0<3
OR
-232
00M
06El
y10B
FA
1.47
364
<20
14.9
<10
<0.5
<50
<50
7.8
11.6
165
<50
<10
<20
<3O
R-2
3200
M06
Ely1
0B R
A1.
5137
3<2
015
.2<1
0<0
.5<5
0<5
08.
211
.816
9<5
0<1
0<2
0<3
OR
-232
00M
06El
y10C
FA
3.51
1,69
0<2
010
.6<1
0<0
.5<5
0<5
08.
122
.330
8<5
0<1
0<2
0<3
OR
-232
00M
06El
y10D
FA
4.04
3,70
0<2
016
.8<1
0<0
.5<5
0<5
014
.528
.139
9<5
0<1
0<2
0<3
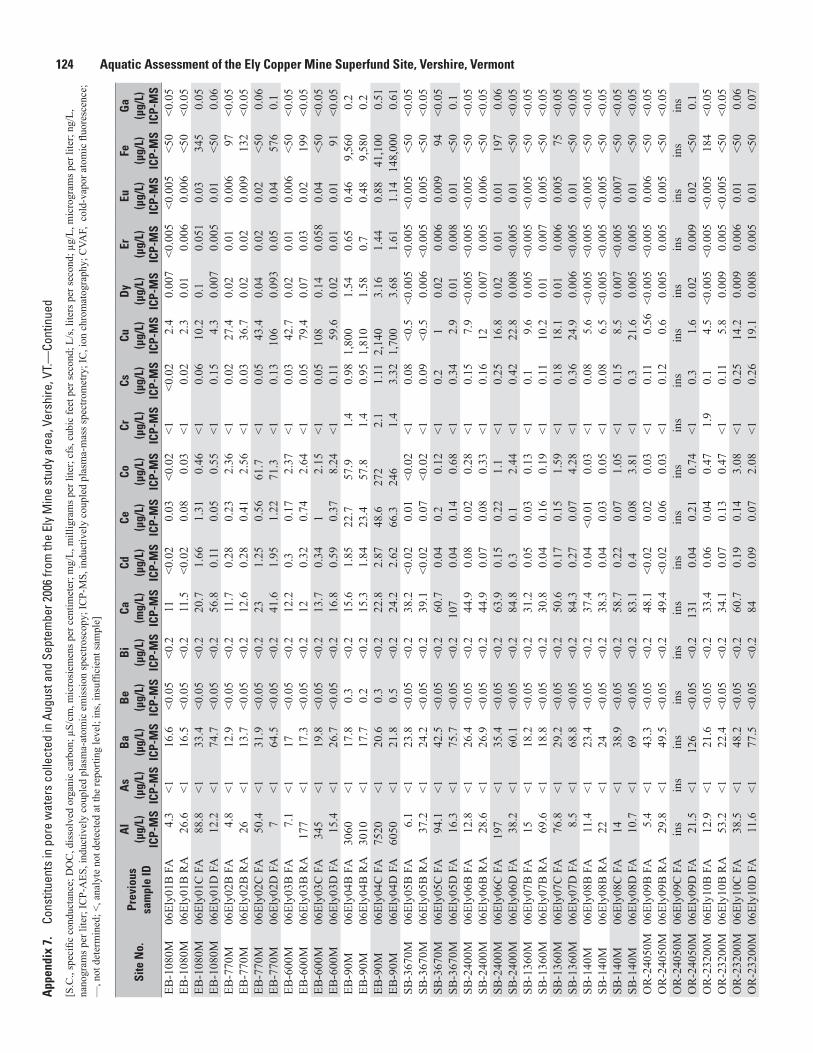
124 Aquatic Assessment of the Ely Copper Mine Superfund Site, Vershire, VermontA
ppen
dix
7.
Cons
titue
nts
in p
ore
wat
ers
colle
cted
in A
ugus
t and
Sep
tem
ber 2
006
from
the
Ely
Min
e st
udy
area
, Ver
shire
, VT.
—Co
ntin
ued
[S.C
., sp
ecifi
c co
nduc
tanc
e; D
OC
, dis
solv
ed o
rgan
ic c
arbo
n; µ
S/cm
, mic
rosi
emen
s per
cen
timet
er; m
g/L,
mill
igra
ms p
er li
ter;
cfs,
cubi
c fe
et p
er se
cond
; L/s
, lite
rs p
er se
cond
; µg/
L, m
icro
gram
s per
lite
r; ng
/L,
nano
gram
s per
lite
r; IC
P-A
ES, i
nduc
tivel
y co
uple
d pl
asm
a-at
omic
em
issi
on sp
ectro
scop
y; IC
P-M
S, in
duct
ivel
y co
uple
d pl
asm
a-m
ass s
pect
rom
etry
; IC
, ion
chr
omat
ogra
phy;
CVA
F, c
old-
vapo
r ato
mic
fluo
resc
ence
; —
, not
det
erm
ined
; <, a
naly
te n
ot d
etec
ted
at th
e re
porti
ng le
vel;
ins,
insu
ffici
ent s
ampl
e]
Site
No.
Prev
ious
sa
mpl
e ID
Al
(µg/
L)IC
P-M
S
As
(µg/
L)IC
P-M
S
Ba
(µg/
L)IC
P-M
S
Be
(µg/
L)IC
P-M
S
Bi
(µg/
L)IC
P-M
S
Ca(m
g/L)
ICP-
MS
Cd(µ
g/L)
ICP-
MS
Ce(µ
g/L)
ICP-
MS
Co(µ
g/L)
ICP-
MS
Cr(µ
g/L)
ICP-
MS
Cs(µ
g/L)
ICP-
MS
Cu(µ
g/L)
ICP-
MS
Dy
(µg/
L)IC
P-M
S
Er(µ
g/L)
ICP-
MS
Eu(µ
g/L)
ICP-
MS
Fe(µ
g/L)
ICP-
MS
Ga
(µg/
L)IC
P-M
SEB
-108
0M06
Ely0
1B F
A4.
3<1
16.6
<0.0
5<0
.211
<0.0
20.
03<0
.02
<1<0
.02
2.4
0.00
7<0
.005
<0.0
05<5
0<0
.05
EB-1
080M
06El
y01B
RA
26.6
<116
.5<0
.05
<0.2
11.5
<0.0
20.
080.
03<1
0.02
2.3
0.01
0.00
60.
006
<50
<0.0
5EB
-108
0M06
Ely0
1C F
A88
.8<1
33.4
<0.0
5<0
.220
.71.
661.
310.
46<1
0.06
10.2
0.1
0.05
10.
0334
50.
05EB
-108
0M06
Ely0
1D F
A12
.2<1
74.7
<0.0
5<0
.256
.80.
110.
050.
55<1
0.15
4.3
0.00
70.
005
0.01
<50
0.06
EB-7
70M
06El
y02B
FA
4.8
<112
.9<0
.05
<0.2
11.7
0.28
0.23
2.36
<10.
0227
.40.
020.
010.
006
97<0
.05
EB-7
70M
06El
y02B
RA
26<1
13.7
<0.0
5<0
.212
.60.
280.
412.
56<1
0.03
36.7
0.02
0.02
0.00
913
2<0
.05
EB-7
70M
06El
y02C
FA
50.4
<131
.9<0
.05
<0.2
231.
250.
5661
.7<1
0.05
43.4
0.04
0.02
0.02
<50
0.06
EB-7
70M
06El
y02D
FA
7<1
64.5
<0.0
5<0
.241
.61.
951.
2271
.3<1
0.13
106
0.09
30.
050.
0457
60.
1EB
-600
M06
Ely0
3B F
A7.
1<1
17<0
.05
<0.2
12.2
0.3
0.17
2.37
<10.
0342
.70.
020.
010.
006
<50
<0.0
5EB
-600
M06
Ely0
3B R
A17
7<1
17.3
<0.0
5<0
.212
0.32
0.74
2.64
<10.
0579
.40.
070.
030.
0219
9<0
.05
EB-6
00M
06El
y03C
FA
345
<119
.8<0
.05
<0.2
13.7
0.34
12.
15<1
0.05
108
0.14
0.05
80.
04<5
0<0
.05
EB-6
00M
06El
y03D
FA
15.4
<126
.7<0
.05
<0.2
16.8
0.59
0.37
8.24
<10.
1159
.60.
020.
010.
0191
<0.0
5EB
-90M
06El
y04B
FA
3060
<117
.80.
3<0
.215
.61.
8522
.757
.91.
40.
981,
800
1.54
0.65
0.46
9,56
00.
2EB
-90M
06El
y04B
RA
3010
<117
.70.
2<0
.215
.31.
8423
.457
.81.
40.
951,
810
1.58
0.7
0.48
9,58
00.
2EB
-90M
06El
y04C
FA
7520
<120
.60.
3<0
.222
.82.
8748
.627
22.
11.
112,
140
3.16
1.44
0.88
41,1
000.
51EB
-90M
06El
y04D
FA
6050
<121
.80.
5<0
.224
.22.
6266
.324
61.
43.
321,
700
3.68
1.61
1.14
148,
000
0.61
SB-3
670M
06El
y05B
FA
6.1
<123
.8<0
.05
<0.2
38.2
<0.0
20.
01<0
.02
<10.
08<0
.5<0
.005
<0.0
05<0
.005
<50
<0.0
5SB
-367
0M06
Ely0
5B R
A37
.2<1
24.2
<0.0
5<0
.239
.1<0
.02
0.07
<0.0
2<1
0.09
<0.5
0.00
6<0
.005
0.00
5<5
0<0
.05
SB-3
670M
06El
y05C
FA
94.1
<142
.5<0
.05
<0.2
60.7
0.04
0.2
0.12
<10.
21
0.02
0.00
60.
009
94<0
.05
SB-3
670M
06El
y05D
FA
16.3
<175
.7<0
.05
<0.2
107
0.04
0.14
0.68
<10.
342.
90.
010.
008
0.01
<50
0.1
SB-2
400M
06El
y06B
FA
12.8
<126
.4<0
.05
<0.2
44.9
0.08
0.02
0.28
<10.
157.
9<0
.005
<0.0
05<0
.005
<50
<0.0
5SB
-240
0M06
Ely0
6B R
A28
.6<1
26.9
<0.0
5<0
.244
.90.
070.
080.
33<1
0.16
120.
007
0.00
50.
006
<50
<0.0
5SB
-240
0M06
Ely0
6C F
A19
7<1
35.4
<0.0
5<0
.263
.90.
150.
221.
1<1
0.25
16.8
0.02
0.01
0.01
197
0.06
SB-2
400M
06El
y06D
FA
38.2
<160
.1<0
.05
<0.2
84.8
0.3
0.1
2.44
<10.
4222
.80.
008
<0.0
050.
01<5
0<0
.05
SB-1
360M
06El
y07B
FA
15<1
18.2
<0.0
5<0
.231
.20.
050.
030.
13<1
0.1
9.6
0.00
5<0
.005
<0.0
05<5
0<0
.05
SB-1
360M
06El
y07B
RA
69.6
<118
.8<0
.05
<0.2
30.8
0.04
0.16
0.19
<10.
1110
.20.
010.
007
0.00
5<5
0<0
.05
SB-1
360M
06El
y07C
FA
76.8
<129
.2<0
.05
<0.2
50.6
0.17
0.15
1.59
<10.
1818
.10.
010.
006
0.00
575
<0.0
5SB
-136
0M06
Ely0
7D F
A8.
5<1
68.8
<0.0
5<0
.284
.30.
270.
074.
28<1
0.36
24.9
0.00
6<0
.005
0.01
<50
<0.0
5SB
-140
M06
Ely0
8B F
A11
.4<1
23.4
<0.0
5<0
.237
.40.
04<0
.01
0.03
<10.
085.
6<0
.005
<0.0
05<0
.005
<50
<0.0
5SB
-140
M06
Ely0
8B R
A22
<124
<0.0
5<0
.238
.30.
040.
030.
05<1
0.08
6.5
<0.0
05<0
.005
<0.0
05<5
0<0
.05
SB-1
40M
06El
y08C
FA
14<1
38.9
<0.0
5<0
.258
.70.
220.
071.
05<1
0.15
8.5
0.00
7<0
.005
0.00
7<5
0<0
.05
SB-1
40M
06El
y08D
FA
10.7
<169
<0.0
5<0
.283
.10.
40.
083.
81<1
0.3
21.6
0.00
50.
005
0.01
<50
<0.0
5O
R-2
4050
M06
Ely0
9B F
A5.
4<1
43.3
<0.0
5<0
.248
.1<0
.02
0.02
0.03
<10.
110.
56<0
.005
<0.0
050.
006
<50
<0.0
5O
R-2
4050
M06
Ely0
9B R
A29
.8<1
49.5
<0.0
5<0
.249
.4<0
.02
0.06
0.03
<10.
120.
60.
005
0.00
50.
005
<50
<0.0
5O
R-2
4050
M06
Ely0
9C F
Ain
sin
sin
sin
sin
sin
sin
sin
sin
sin
sin
sin
sin
sin
sin
sin
sin
sO
R-2
4050
M06
Ely0
9D F
A21
.5<1
126
<0.0
5<0
.213
10.
040.
210.
74<1
0.3
1.6
0.02
0.00
90.
02<5
00.
1O
R-2
3200
M06
Ely1
0B F
A12
.9<1
21.6
<0.0
5<0
.233
.40.
060.
040.
471.
90.
14.
5<0
.005
<0.0
05<0
.005
184
<0.0
5O
R-2
3200
M06
Ely1
0B R
A53
.2<1
22.4
<0.0
5<0
.234
.10.
070.
130.
47<1
0.11
5.8
0.00
90.
005
<0.0
05<5
0<0
.05
OR
-232
00M
06El
y10C
FA
38.5
<148
.2<0
.05
<0.2
60.7
0.19
0.14
3.08
<10.
2514
.20.
009
0.00
60.
01<5
00.
06O
R-2
3200
M06
Ely1
0D F
A11
.6<1
77.5
<0.0
5<0
.284
0.09
0.07
2.08
<10.
2619
.10.
008
0.00
50.
01<5
00.
07

Appendix 7 125A
ppen
dix
7.
Cons
titue
nts
in p
ore
wat
ers
colle
cted
in A
ugus
t and
Sep
tem
ber 2
006
from
the
Ely
Min
e st
udy
area
, Ver
shire
, VT.
—Co
ntin
ued
[S.C
., sp
ecifi
c co
nduc
tanc
e; D
OC
, dis
solv
ed o
rgan
ic c
arbo
n; µ
S/cm
, mic
rosi
emen
s per
cen
timet
er; m
g/L,
mill
igra
ms p
er li
ter;
cfs,
cubi
c fe
et p
er se
cond
; L/s
, lite
rs p
er se
cond
; µg/
L, m
icro
gram
s per
lite
r; ng
/L,
nano
gram
s per
lite
r; IC
P-A
ES, i
nduc
tivel
y co
uple
d pl
asm
a-at
omic
em
issi
on sp
ectro
scop
y; IC
P-M
S, in
duct
ivel
y co
uple
d pl
asm
a-m
ass s
pect
rom
etry
; IC
, ion
chr
omat
ogra
phy;
CVA
F, c
old-
vapo
r ato
mic
fluo
resc
ence
; —
, not
det
erm
ined
; <, a
naly
te n
ot d
etec
ted
at th
e re
porti
ng le
vel;
ins,
insu
ffici
ent s
ampl
e]
Site
No.
Prev
ious
sa
mpl
e ID
Gd
(µg/
L)IC
P-M
S
Ge
(µg/
L)IC
P-M
S
Ho
(µg/
L)IC
P-M
S
K(m
g/L)
ICP-
MS
La(µ
g/L)
ICP-
MS
Li(µ
g/L)
ICP-
MS
Lu(µ
g/L)
ICP-
MS
Mg
(mg/
L)IC
P-M
S
Mn
(µg/
L)IC
P-M
S
Mo
(µg/
L)IC
P-M
S
Na
(mg/
L)IC
P-M
S
Nb
(µg/
L)IC
P-M
S
Nd
(µg/
L)IC
P-M
S
Ni
(µg/
L)IC
P-M
S
P(m
g/L)
ICP-
MS
Pb(µ
g/L)
ICP-
MS
Pr(µ
g/L)
ICP-
MS
Rb(µ
g/L)
ICP-
MS
EB-1
080M
06El
y01B
FA
0.01
<0.0
5<0
.005
1.4
0.04
0.2
<0.1
0.95
0.3
<20.
93<0
.20.
050.
6<0
.01
0.06
0.01
3.46
EB-1
080M
06El
y01B
RA
0.02
<0.0
5<0
.005
1.47
0.07
<0.1
<0.1
0.99
2<2
0.97
<0.2
0.08
<0.4
<0.0
1<0
.05
0.02
3.56
EB-1
080M
06El
y01C
FA
0.15
<0.0
50.
022
0.74
0.2
<0.1
1.53
45.7
<21.
11<0
.20.
871.
4<0
.01
0.91
0.21
7.56
EB-1
080M
06El
y01D
FA
0.01
<0.0
5<0
.005
3.94
0.05
0.2
<0.1
4.48
2,52
0<2
2.06
<0.2
0.04
1.7
<0.0
1<0
.05
0.01
14.4
EB-7
70M
06El
y02B
FA
0.02
<0.0
5<0
.005
1.79
0.13
1.2
<0.1
1.91
41.1
<21.
12<0
.20.
154.
3<0
.01
0.2
0.03
5.76
EB-7
70M
06El
y02B
RA
0.05
2<0
.05
0.00
51.
90.
211.
5<0
.12.
0445
.1<2
1.18
<0.2
0.26
4.2
<0.0
1<0
.05
0.06
6.25
EB-7
70M
06El
y02C
FA
0.07
1<0
.05
0.00
72.
410.
322.
5<0
.13.
32,
780
<21.
23<0
.20.
3812
.6<0
.01
<0.0
50.
0810
.3EB
-770
M06
Ely0
2D F
A0.
15<0
.05
0.02
5.24
0.93
2.3
<0.1
5.15
5,46
0<2
2.03
<0.2
0.86
20<0
.01
<0.0
50.
223
EB-6
00M
06El
y03B
FA
0.03
<0.0
5<0
.005
1.8
0.14
2.2
<0.1
1.84
14.8
<21.
16<0
.20.
164
<0.0
1<0
.05
0.04
5.55
EB-6
00M
06El
y03B
RA
0.09
4<0
.05
0.01
1.77
0.41
2.3
<0.1
1.87
19.3
<21.
13<0
.20.
524.
10.
010.
10.
115.
69EB
-600
M06
Ely0
3C F
A0.
17<0
.05
0.02
2.12
0.61
3.2
<0.1
1.77
26.5
<21.
07<0
.20.
93.
9<0
.01
0.08
0.2
6.71
EB-6
00M
06El
y03D
FA
0.04
<0.0
5<0
.005
3.1
0.28
3.3
<0.1
2.04
418
<21.
67<0
.20.
284.
5<0
.01
<0.0
50.
0612
.8EB
-90M
06El
y04B
FA
2.22
0.05
0.25
3.8
10.5
12.6
<0.1
3.47
501
<21.
510.
7112
17.4
<0.0
11.
93.
0120
.1EB
-90M
06El
y04B
RA
2.37
0.05
0.26
3.67
1112
.8<0
.13.
3650
2<2
1.46
0.35
12.6
17.5
<0.0
11.
93.
1420
.6EB
-90M
06El
y04C
FA
4.72
0.1
0.52
4.17
23.2
17.2
0.1
5.43
2,81
0<2
3.02
<0.2
2431
.1<0
.01
1.2
5.95
25.1
EB-9
0M06
Ely0
4D F
A5.
80.
20.
578.
3130
.226
.60.
15.
83,
150
<23.
57<0
.231
.539
<0.0
11.
77.
960
.4SB
-367
0M06
Ely0
5B F
A<0
.005
<0.0
5<0
.005
2.37
0.02
0.9
<0.1
1.68
0.4
<23.
72<0
.20.
01<0
.4<0
.01
0.06
<0.0
17.
31SB
-367
0M06
Ely0
5B R
A0.
009
<0.0
5<0
.005
2.39
0.05
1.2
<0.1
1.75
1.9
<23.
83<0
.20.
04<0
.4<0
.01
<0.0
50.
017.
48SB
-367
0M06
Ely0
5C F
A0.
02<0
.05
<0.0
053.
420.
11.
1<0
.12.
396.
8<2
4.6
<0.2
0.11
2.4
0.02
0.1
0.02
13SB
-367
0M06
Ely0
5D F
A0.
01<0
.05
<0.0
055.
320.
080.
2<0
.14.
123,
870
<26.
41<0
.20.
064.
10.
020.
10.
0221
SB-2
400M
06El
y06B
FA
0.00
6<0
.05
<0.0
054.
110.
031.
6<0
.13.
1111
3<2
15.3
<0.2
0.02
0.5
<0.0
1<0
.05
<0.0
18.
37SB
-240
0M06
Ely0
6B R
A0.
01<0
.05
<0.0
054.
120.
061.
8<0
.13.
1411
4<2
15.8
<0.2
0.06
0.5
<0.0
1<0
.05
0.01
8.43
SB-2
400M
06El
y06C
FA
0.02
<0.0
5<0
.005
4.08
0.12
2.2
<0.1
5.54
149
<214
.1<0
.20.
132.
90.
020.
10.
0312
.1SB
-240
0M06
Ely0
6D F
A0.
01<0
.05
<0.0
056.
730.
072
<0.1
4.5
1,03
0<2
13.5
<0.2
0.07
2.6
<0.0
10.
050.
0223
.8SB
-136
0M06
Ely0
7B F
A0.
006
<0.0
5<0
.005
2.58
0.03
1.1
<0.1
1.7
31.5
<23.
37<0
.20.
030.
8<0
.01
0.2
<0.0
17.
74SB
-136
0M06
Ely0
7B R
A0.
01<0
.05
<0.0
052.
560.
091
<0.1
1.74
35.1
<23.
36<0
.20.
090.
8<0
.01
0.08
0.02
7.88
SB-1
360M
06El
y07C
FA
0.02
<0.0
5<0
.005
3.62
0.08
1<0
.12.
8317
1<2
4.19
<0.2
0.09
2.2
<0.0
10.
090.
0211
SB-1
360M
06El
y07D
FA
0.01
<0.0
5<0
.005
6.65
0.06
1.9
<0.1
4.45
1,77
0<2
5.62
<0.2
0.04
2.2
<0.0
1<0
.05
0.01
24SB
-140
M06
Ely0
8B F
A0.
005
<0.0
5<0
.005
2.7
0.02
1.7
<0.1
1.91
0.6
<25.
78<0
.20.
010.
6<0
.01
0.2
<0.0
16.
95SB
-140
M06
Ely0
8B R
A<0
.005
<0.0
5<0
.005
2.72
0.03
1.6
<0.1
1.95
1.2
<25.
9<0
.20.
03<0
.4<0
.01
0.07
<0.0
17.
18SB
-140
M06
Ely0
8C F
A0.
008
<0.0
5<0
.005
3.26
0.04
1.1
<0.1
2.61
209
<24.
79<0
.20.
042.
60.
010.
1<0
.01
12.3
SB-1
40M
06El
y08D
FA
0.00
7<0
.05
<0.0
055.
940.
062.
1<0
.14.
041,
100
<27.
24<0
.20.
042.
2<0
.01
0.1
0.01
21.5
OR
-240
50M
06El
y09B
FA
<0.0
05<0
.05
<0.0
057.
170.
020.
7<0
.12.
9419
6<2
11<0
.20.
020.
4<0
.01
<0.0
5<0
.01
3.47
OR
-240
50M
06El
y09B
RA
0.00
6<0
.05
<0.0
057.
360.
040.
9<0
.12.
9319
4<2
11<0
.20.
03<0
.40.
01<0
.05
<0.0
13.
46O
R-2
4050
M06
Ely0
9C F
Ain
sin
sin
sin
sin
sin
sin
sin
sin
sin
sin
sin
sin
sin
sin
sin
sin
sin
sO
R-2
4050
M06
Ely0
9D F
A0.
02<0
.05
<0.0
0512
.50.
110.
4<0
.17.
446,
270
<215
.8<0
.20.
093.
80.
020.
090.
025.
51O
R-2
3200
M06
Ely1
0B F
A0.
006
<0.0
5<0
.005
3.08
0.03
1.1
<0.1
1.41
327
<214
.8<0
.20.
020.
8<0
.01
0.3
<0.0
18.
45O
R-2
3200
M06
Ely1
0B R
A0.
01<0
.05
<0.0
053.
20.
071.
4<0
.11.
4334
1<2
14.8
<0.2
0.06
0.5
<0.0
10.
050.
028.
72O
R-2
3200
M06
Ely1
0C F
A0.
01<0
.05
<0.0
053.
40.
071.
2<0
.12.
991,
500
<29.
56<0
.20.
072.
80.
010.
090.
0214
.4O
R-2
3200
M06
Ely1
0D F
A0.
006
<0.0
5<0
.005
5.44
0.04
1.7
<0.1
3.63
3,50
0<2
15.5
<0.2
0.03
2.2
<0.0
10.
2<0
.01
16.4

126 Aquatic Assessment of the Ely Copper Mine Superfund Site, Vershire, VermontA
ppen
dix
7.
Cons
titue
nts
in p
ore
wat
ers
colle
cted
in A
ugus
t and
Sep
tem
ber 2
006
from
the
Ely
Min
e st
udy
area
, Ver
shire
, VT.
—Co
ntin
ued
[S.C
., sp
ecifi
c co
nduc
tanc
e; D
OC
, dis
solv
ed o
rgan
ic c
arbo
n; µ
S/cm
, mic
rosi
emen
s per
cen
timet
er; m
g/L,
mill
igra
ms p
er li
ter;
cfs,
cubi
c fe
et p
er se
cond
; L/s
, lite
rs p
er se
cond
; µg/
L, m
icro
gram
s per
lite
r; ng
/L,
nano
gram
s per
lite
r; IC
P-A
ES, i
nduc
tivel
y co
uple
d pl
asm
a-at
omic
em
issi
on sp
ectro
scop
y; IC
P-M
S, in
duct
ivel
y co
uple
d pl
asm
a-m
ass s
pect
rom
etry
; IC
, ion
chr
omat
ogra
phy;
CVA
F, c
old-
vapo
r ato
mic
fluo
res-
cenc
e; —
, not
det
erm
ined
; <, a
naly
te n
ot d
etec
ted
at th
e re
porti
ng le
vel;
ins,
insu
ffici
ent s
ampl
e]
Site
No.
Prev
ious
sa
mpl
e ID
Sb(µ
g/L)
ICP-
MS
Sc(µ
g/L)
ICP-
MS
Se(µ
g/L)
ICP-
MS
SiO
2
(mg/
L)IC
P-M
S
Sm (µg/
L)IC
P-M
S
SO4
(mg/
L)IC
P-M
S
Sr(µ
g/L)
ICP-
MS
Ta(µ
g/L)
ICP-
MS
Tb(µ
g/L)
ICP-
MS
Th(µ
g/L)
ICP-
MS
Ti(µ
g/L)
ICP-
MS
Tl(µ
g/L)
ICP-
MS
Tm (µg/
L)IC
P-M
S
U(µ
g/L)
ICP-
MS
V(µ
g/L)
ICP-
MS
W(µ
g/L)
ICP-
MS
Y(µ
g/L)
ICP-
MS
Yb(µ
g/L)
ICP-
MS
EB-1
080M
06El
y01B
FA
<0.3
0.6
<16.
6<0
.01
<246
.1<0
.02
<0.0
05<0
.2<0
.5<0
.1<0
.005
<0.1
<0.5
<0.5
0.04
<0.0
05EB
-108
0M06
Ely0
1B R
A<0
.30.
6<1
6.9
0.02
<247
.80.
03<0
.005
<0.2
1.4
<0.1
<0.0
05<0
.1<0
.5<0
.50.
070.
006
EB-1
080M
06El
y01C
FA
<0.3
0.8
<15.
60.
166
92.4
<0.0
20.
02<0
.24
<0.1
0.00
5<0
.10.
8<0
.50.
480.
04EB
-108
0M06
Ely0
1D F
A<0
.31.
11.
88.
1<0
.01
1122
5<0
.02
<0.0
05<0
.2<0
.5<0
.1<0
.005
0.49
<0.5
<0.5
0.04
<0.0
05EB
-770
M06
Ely0
2B F
A<0
.30.
8<1
9.4
0.03
3351
<0.0
2<0
.005
<0.2
<0.5
<0.1
<0.0
05<0
.1<0
.5<0
.50.
090.
01EB
-770
M06
Ely0
2B R
A<0
.30.
9<1
9.9
0.06
3554
.9<0
.02
0.00
5<0
.21.
1<0
.1<0
.005
<0.1
<0.5
<0.5
0.13
0.01
EB-7
70M
06El
y02C
FA
<0.3
1.1
1.2
8.2
0.07
7410
2<0
.02
0.00
7<0
.21.
4<0
.1<0
.005
<0.1
<0.5
<0.5
0.2
0.02
EB-7
70M
06El
y02D
FA
<0.3
1.8
113
.10.
1513
419
5<0
.02
0.02
<0.2
1.8
<0.1
0.00
5<0
.1<0
.5<0
.50.
480.
04EB
-600
M06
Ely0
3B F
A<0
.30.
8<1
9.8
0.02
2950
.4<0
.02
<0.0
05<0
.2<0
.5<0
.1<0
.005
<0.1
<0.5
<0.5
0.09
0.00
5EB
-600
M06
Ely0
3B R
A<0
.30.
8<1
9.7
0.1
2949
.7<0
.02
0.01
<0.2
7.4
<0.1
<0.0
05<0
.1<0
.5<0
.50.
310.
03EB
-600
M06
Ely0
3C F
A<0
.31.
1<1
8.2
0.2
3456
.2<0
.02
0.02
<0.2
1.6
<0.1
0.00
7<0
.1<0
.5<0
.50.
490.
06EB
-600
M06
Ely0
3D F
A<0
.31.
2<1
9.6
0.05
3971
.9<0
.02
0.00
5<0
.20.
6<0
.1<0
.005
<0.1
<0.5
<0.5
0.14
0.01
EB-9
0M06
Ely0
4B F
A0.
772.
61.
219
.32.
3911
363
.10.
10.
31<0
.22
0.1
0.08
10.
46<0
.50.
825.
80.
48EB
-90M
06El
y04B
RA
<0.3
2.3
118
.82.
411
063
.80.
060.
32<0
.24
<0.1
0.07
80.
52<0
.5<0
.55.
850.
48EB
-90M
06El
y04C
FA
<0.3
4.2
2.6
22.1
4.58
234
82<0
.02
0.6
<0.2
3.8
0.1
0.15
0.69
<0.5
<0.5
13.4
0.97
EB-9
0M06
Ely0
4D F
A<0
.36.
42.
936
6.03
407
113
<0.0
20.
730.
215.
70.
20.
171.
01<0
.5<0
.515
.91.
11SB
-367
0M06
Ely0
5B F
A<0
.30.
7<1
6.2
<0.0
17
191
<0.0
2<0
.005
<0.2
<0.5
<0.1
<0.0
050.
26<0
.5<0
.50.
02<0
.005
SB-3
670M
06El
y05B
RA
<0.3
0.7
<16.
4<0
.01
719
4<0
.02
<0.0
05<0
.21.
6<0
.1<0
.005
0.26
<0.5
<0.5
0.04
<0.0
05SB
-367
0M06
Ely0
5C F
A<0
.31.
3<1
8.5
0.02
1627
4<0
.02
<0.0
05<0
.24.
1<0
.1<0
.005
0.42
0.6
<0.5
0.09
0.00
9SB
-367
0M06
Ely0
5D F
A0.
881.
7<1
11.1
0.01
1845
7<0
.02
<0.0
05<0
.20.
50.
2<0
.005
1.07
10.
560.
090.
007
SB-2
400M
06El
y06B
FA
0.53
1<1
9.1
<0.0
121
209
<0.0
2<0
.005
<0.2
<0.5
<0.1
<0.0
050.
33<0
.5<0
.50.
03<0
.005
SB-2
400M
06El
y06B
RA
<0.3
0.9
<19.
10.
0120
211
<0.0
2<0
.005
<0.2
1.2
<0.1
<0.0
050.
33<0
.5<0
.50.
04<0
.005
SB-2
400M
06El
y06C
FA
0.33
1.5
1.2
10.1
0.02
4328
5<0
.02
<0.0
05<0
.212
<0.1
<0.0
050.
54<0
.5<0
.50.
090.
01SB
-240
0M06
Ely0
6D F
A0.
31.
81.
513
.1<0
.01
101
430
<0.0
2<0
.005
<0.2
3.1
0.1
<0.0
050.
72<0
.5<0
.50.
08<0
.005
SB-1
360M
06El
y07B
FA
<0.3
0.7
<17.
2<0
.01
1415
9<0
.02
<0.0
05<0
.2<0
.5<0
.1<0
.005
0.23
<0.5
<0.5
0.02
<0.0
05SB
-136
0M06
Ely0
7B R
A<0
.30.
8<1
7.2
0.01
1416
0<0
.02
<0.0
05<0
.23.
1<0
.1<0
.005
0.22
<0.5
<0.5
0.06
0.00
6SB
-136
0M06
Ely0
7C F
A0.
441.
21.
38.
30.
0234
224
<0.0
2<0
.005
<0.2
2.9
<0.1
<0.0
050.
37<0
.5<0
.50.
070.
008
SB-1
360M
06El
y07D
FA
<0.3
1.6
1.1
11.9
<0.0
183
436
<0.0
2<0
.005
<0.2
1.1
<0.1
<0.0
050.
62<0
.5<0
.50.
06<0
.005
SB-1
40M
06El
y08B
FA
<0.3
0.7
<17
<0.0
115
168
<0.0
2<0
.005
<0.2
<0.5
<0.1
<0.0
050.
2<0
.5<0
.50.
02<0
.005
SB-1
40M
06El
y08B
RA
<0.3
0.8
<17.
2<0
.01
1517
6<0
.02
<0.0
05<0
.20.
7<0
.1<0
.005
0.2
<0.5
<0.5
0.02
<0.0
05SB
-140
M06
Ely0
8C F
A<0
.31
<17
<0.0
120
272
<0.0
2<0
.005
<0.2
0.8
<0.1
<0.0
050.
4<0
.5<0
.50.
040.
005
SB-1
40M
06El
y08D
FA
<0.3
1.5
111
.1<0
.01
6139
7<0
.02
<0.0
05<0
.20.
8<0
.1<0
.005
0.62
<0.5
<0.5
0.06
0.00
6O
R-2
4050
M06
Ely0
9B F
A<0
.30.
9<1
8.7
<0.0
18
228
<0.0
2<0
.005
<0.2
<0.5
<0.1
<0.0
050.
4<0
.5<0
.50.
02<0
.005
OR
-240
50M
06El
y09B
RA
<0.3
0.9
<19.
1<0
.01
922
4<0
.02
<0.0
05<0
.21.
3<0
.1<0
.005
0.4
<0.5
<0.5
0.03
<0.0
05O
R-2
4050
M06
Ely0
9C F
Ain
sin
sin
sin
sin
sin
sin
sin
sin
sin
sin
sin
sin
sin
sin
sin
sin
sin
sO
R-2
4050
M06
Ely0
9D F
A<0
.32.
21.
214
.50.
0111
559
<0.0
2<0
.005
<0.2
<0.5
<0.1
<0.0
051.
911.
8<0
.50.
160.
009
OR
-232
00M
06El
y10B
FA
<0.3
0.7
<17.
1<0
.01
1215
0<0
.02
<0.0
05<0
.2<0
.5<0
.1<0
.005
0.32
<0.5
<0.5
0.02
<0.0
05O
R-2
3200
M06
Ely1
0B R
A<0
.30.
8<1
7.4
0.01
1215
2<0
.02
<0.0
05<0
.22.
3<0
.1<0
.005
0.34
<0.5
<0.5
0.04
0.00
5O
R-2
3200
M06
Ely1
0C F
A<0
.31
<16.
30.
0119
282
<0.0
2<0
.005
<0.2
0.9
<0.1
<0.0
050.
71
<0.5
0.07
0.00
7O
R-2
3200
M06
Ely1
0D F
A<0
.31.
7<1
12.2
0.01
2738
6<0
.02
<0.0
05<0
.2<0
.5<0
.1<0
.005
0.95
<0.5
<0.5
0.06
0.00
6

Appendix 7 127A
ppen
dix
7.
Cons
titue
nts
in p
ore
wat
ers
colle
cted
in A
ugus
t and
Sep
tem
ber 2
006
from
the
Ely
Min
e st
udy
area
, Ver
shire
, VT.
—Co
ntin
ued
[S.C
., sp
ecifi
c co
nduc
tanc
e; D
OC
, dis
solv
ed o
rgan
ic c
arbo
n; µ
S/cm
, mic
rosi
emen
s per
cen
timet
er; m
g/L,
mill
igra
ms p
er li
ter;
cfs,
cubi
c fe
et p
er se
cond
; L/s
, lite
rs p
er se
cond
; µg/
L, m
icro
gram
s per
lite
r; ng
/L,
nano
gram
s per
lite
r; IC
P-A
ES, i
nduc
tivel
y co
uple
d pl
asm
a-at
omic
em
issi
on sp
ectro
scop
y; IC
P-M
S, in
duct
ivel
y co
uple
d pl
asm
a-m
ass s
pect
rom
etry
; IC
, ion
chr
omat
ogra
phy;
CVA
F, c
old-
vapo
r ato
mic
fluo
res-
cenc
e; —
, not
det
erm
ined
; <, a
naly
te n
ot d
etec
ted
at th
e re
porti
ng le
vel;
ins,
insu
ffici
ent s
ampl
e]
Site
No.
Prev
ious
sa
mpl
e ID
Zn(µ
g/L)
ICP-
MS
Zr(µ
g/L)
ICP-
MS
Job
No.
ICLa
b N
o.IC
Fiel
d N
o.IC
Cl(m
g/L)
IC
F(m
g/L)
IC
NO
3
(mg/
L)IC
SO4
(mg/
L)IC
Job
No.
CVA
FLa
b N
o.CV
AF
Fiel
d N
o.CV
AF
Hg
(ng/
L)CV
AF
EB-1
080M
06El
y01B
FA
1.5
<0.2
MR
P-07
540
C-2
8941
506
Ely0
1B F
U1.
4<.
080.
54.
4M
RP-
0754
2C
-289
491
06El
y01B
Hg
<5EB
-108
0M06
Ely0
1B R
A1.
7<0
.2—
——
——
——
——
——
EB-1
080M
06El
y01C
FA
29.2
<0.2
——
——
——
——
——
—EB
-108
0M06
Ely0
1D F
A1.
6<0
.2M
RP-
0759
7C
-290
573
06El
y01D
FU
3.2
0.2
2.7
14—
——
—EB
-770
M06
Ely0
2B F
A25
.1<0
.2M
RP-
0754
0C
-289
417
06El
y02B
FU
1.4
0.09
<.08
43M
RP-
0754
2C
-289
493
06El
y02B
Hg
<5EB
-770
M06
Ely0
2B R
A21
.9<0
.2—
——
——
——
——
——
EB-7
70M
06El
y02C
FA
50<0
.2—
——
——
——
——
——
EB-7
70M
06El
y02D
FA
114
<0.2
MR
P-07
597
C-2
9057
406
Ely0
2D F
U2.
80.
21.
417
5—
——
—EB
-600
M06
Ely0
3B F
A31
.6<0
.2M
RP-
0754
0C
-289
419
06El
y03B
FU
1.4
0.1
0.5
35M
RP-
0754
2C
-289
495
06El
y03B
Hg
<5EB
-600
M06
Ely0
3B R
A26
.4<0
.2—
——
——
——
——
——
EB-6
00M
06El
y03C
FA
24.8
<0.2
——
——
——
——
——
—EB
-600
M06
Ely0
3D F
A26
<0.2
MR
P-07
597
C-2
9057
506
Ely0
3D F
U1.
50.
10.
747
——
——
EB-9
0M06
Ely0
4B F
A31
4<0
.2M
RP-
0754
0C
-289
421
06El
y04B
FU
3.4
0.6
<.08
161
MR
P-07
542
C-2
8949
706
Ely0
4B H
g<5
EB-9
0M06
Ely0
4B R
A31
7<0
.2—
——
——
——
——
——
EB-9
0M06
Ely0
4C F
A51
4<0
.2—
——
——
——
——
——
EB-9
0M06
Ely0
4D F
A61
60.
2M
RP-
0759
7C
-290
576
06El
y04D
FU
70.
5<.
0857
4—
——
—SB
-367
0M06
Ely0
5B F
A1.
9<0
.2M
RP-
0754
0C
-289
424
06El
y05B
FU
3.5
<.08
<.08
6M
RP-
0754
2C
-289
500
06El
y05B
Hg
<5SB
-367
0M06
Ely0
5B R
A0.
7<0
.2—
——
——
——
——
——
SB-3
670M
06El
y05C
FA
3.8
<0.2
——
——
——
——
——
—SB
-367
0M06
Ely0
5D F
A4.
4<0
.2M
RP-
0759
7C
-290
577
06El
y05D
FU
7<.
081.
816
——
——
SB-2
400M
06El
y06B
FA
3<0
.2M
RP-
0754
0C
-289
429
06El
y06B
FU
—<.
08—
—M
RP-
0754
2C
-289
505
06El
y06B
Hg
<5SB
-240
0M06
Ely0
6B R
A6.
4<0
.2—
——
——
——
——
——
SB-2
400M
06El
y06C
FA
6.4
<0.2
——
——
——
——
——
—SB
-240
0M06
Ely0
6D F
A4.
9<0
.2M
RP-
0759
7C
-290
578
06El
y06D
FU
14<.
082.
599
——
——
SB-1
360M
06El
y07B
FA
149
<0.2
MR
P-07
540
C-2
8943
206
Ely0
7B F
U4
<.08
0.9
17M
RP-
0754
2C
-289
508
06El
y07B
Hg
<5SB
-136
0M06
Ely0
7B R
A2.
6<0
.2—
——
——
——
——
——
SB-1
360M
06El
y07C
FA
6<0
.2—
——
——
——
——
——
SB-1
360M
06El
y07D
FA
7<0
.2M
RP-
0759
7C
-290
579
06El
y07D
FU
6.1
<.08
2.3
87—
——
—SB
-140
M06
Ely0
8B F
A8
<0.2
MR
P-07
540
C-2
8943
406
Ely0
8B F
U7.
1<.
081
16M
RP-
0754
2C
-289
510
06El
y08B
Hg
<5SB
-140
M06
Ely0
8B R
A3.
1<0
.2—
——
——
——
——
——
SB-1
40M
06El
y08C
FA
5.3
<0.2
——
——
——
——
——
—SB
-140
M06
Ely0
8D F
A7.
4<0
.2M
RP-
0759
7C
-290
580
06El
y08D
FU
7<.
082.
564
——
——
OR
-240
50M
06El
y09B
FA
3.8
<0.2
MR
P-07
540
C-2
8943
606
Ely0
9B F
U15
<.08
4.5
10M
RP-
0754
2C
-289
512
06El
y09B
Hg
<5O
R-2
4050
M06
Ely0
9B R
A1.
4<0
.2—
——
——
——
——
——
OR
-240
50M
06El
y09C
FA
ins
ins
——
——
——
——
——
—O
R-2
4050
M06
Ely0
9D F
A2.
4<0
.2M
RP-
0759
7C
-290
582
06El
y09D
FU
15<.
082
11—
——
—O
R-2
3200
M06
Ely1
0B F
A2.
9<0
.2M
RP-
0754
0C
-289
439
06El
y10B
FU
150.
10.
511
MR
P-07
542
C-2
8951
506
Ely1
0B H
g<5
OR
-232
00M
06El
y10B
RA
1.4
<0.2
——
——
——
——
——
—O
R-2
3200
M06
Ely1
0C F
A3.
4<0
.2—
——
——
——
——
——
OR
-232
00M
06El
y10D
FA
5.7
<0.2
MR
P-07
597
C-2
9058
306
Ely1
0D F
U12
<.08
325
——
——
1 Est
imat
ed v
alue
, rep
orte
d co
ncen
tratio
n is
less
than
the
repo
rting
leve
l but
gre
ater
than
the
long
-term
met
hod-
dete
ctio
n le
vel (
E).


Appendix 8 129
App
endi
x 8.
Ch
emis
try re
sults
for s
edim
ents
col
lect
ed in
Aug
ust a
nd S
epte
mbe
r 200
6 fro
m th
e El
y M
ine
stud
y ar
ea, V
ersh
ire, V
T.
[wt.
%, w
eigh
t per
cent
; mg/
kg, m
illig
ram
s per
kilo
gram
; —, n
ot d
eter
min
ed; <
, ana
lyte
not
det
ecte
d at
the
repo
rting
leve
l]
Site
nu
mbe
rFi
eld
nu
mbe
rD
ate
Job
nu
mbe
rLa
b nu
mbe
r
Tota
l C(w
t. %
as
C)
CO2
(wt.
%
as C
)
Carb
onat
e(w
t. %
as
C)
Tota
l or
gani
c C
(wt.
% a
s C)
Hg
(mg/
kg)
Al
(wt.
%)
Ca(w
t. %
)Fe
(wt.
%)
K(w
t. %
)M
g(w
t. %
)
PEC
a—
——
——
——
1.06
——
——
—EB
-108
0M06
Ely0
18/
23/2
006
MR
P-07
598
C-2
9058
60.
350.
040.
010.
34<0
.02
4.26
1.05
2.76
1.03
0.98
EB-7
70M
06El
y02
8/23
/200
6M
RP-
0759
8C
-290
587
0.55
0.07
0.02
0.53
<0.0
24.
811.
245.
51.
061.
01EB
-600
M06
Ely0
38/
23/2
006
MR
P-07
598
C-2
9058
90.
250.
090.
020.
23<0
.02
4.66
1.25
7.09
1.05
1.05
EB-9
0M06
Ely0
48/
23/2
006
MR
P-07
598
C-2
9059
00.
280.
060.
020.
26<0
.02
3.98
1.13
16.7
0.95
0.76
EB-9
0M (o
verb
ank
sed.
)06
Ely0
4-O
BS
8/23
/200
6M
RP-
0759
8C
-290
592
2.46
0.15
0.04
2.42
0.13
3.21
0.31
36.3
2.45
0.7
SB-3
670M
06El
y05
8/22
/200
6M
RP-
0759
8C
-290
593
0.52
0.75
0.2
0.32
<0.0
23.
11.
421.
390.
810.
66SB
-240
0M06
Ely0
68/
22/2
006
MR
P-07
598
C-2
9059
40.
410.
690.
190.
22<0
.02
3.61
1.34
2.03
0.86
0.63
SB-1
360M
06El
y07
8/23
/200
6M
RP-
0759
8C
-290
595
0.4
0.56
0.15
0.25
<0.0
23.
481.
622.
780.
850.
67SB
-140
M06
Ely0
88/
22/2
006
MR
P-07
598
C-2
9059
60.
340.
350.
10.
24<0
.02
3.69
1.3
2.63
0.92
0.62
OR
-240
50M
06El
y09
8/22
/200
6M
RP-
0759
8C
-290
598
0.41
0.15
0.04
0.37
<0.0
23.
271.
131.
40.
80.
73O
R-2
3200
M06
Ely1
08/
22/2
006
MR
P-07
598
C-2
9059
90.
30.
170.
050.
25<0
.02
3.54
1.3
2.28
0.84
0.71
EB-2
0M06
Ely1
18/
23/2
006
MR
P-07
598
C-2
9060
00.
550.
080.
020.
530.
034.
121.
0814
.61.
030.
73SB
-326
0M06
Ely1
28/
23/2
006
MR
P-07
598
C-2
9060
10.
390.
480.
130.
26<0
.02
3.56
1.43
5.88
0.82
0.62
EM-P
ON
D1
06El
yPon
d1S
09/1
9/06
MR
P-07
598
C-2
9060
28.
040.
160.
048
0.07
6.68
1.93
4.39
0.89
1.56
EM-P
ON
D2
06El
yPon
d2S
09/1
9/06
MR
P-07
598
C-2
9060
39.
360.
230.
069.
30.
116.
121.
894.
481.
091.
38EM
-PO
ND
306
ElyP
ond3
S09
/19/
06M
RP-
0759
8C
-290
604
10.4
0.26
0.07
10.3
30.
155.
491.
475.
840.
841.
22EM
-PO
ND
406
ElyP
ond4
S09
/19/
06M
RP-
0759
8C
-290
605
10.1
0.18
0.05
10.0
50.
095.
631.
113.
881.
111.
25EM
-PO
ND
506
ElyP
ond5
S09
/19/
06M
RP-
0759
8C
-290
606
9.57
0.26
0.07
9.5
0.09
6.45
0.92
4.99
0.79
1.02
EM-P
ON
D6
06El
yPon
d6S
09/1
9/06
MR
P-07
598
C-2
9060
76.
540.
270.
076.
470.
0711
.10.
673.
50.
750.
73

130 Aquatic Assessment of the Ely Copper Mine Superfund Site, Vershire, Vermont
App
endi
x 8.
Ch
emis
try re
sults
for s
edim
ents
col
lect
ed in
Aug
ust a
nd S
epte
mbe
r 200
6 fro
m th
e El
y M
ine
stud
y ar
ea, V
ersh
ire, V
T.—
Cont
inue
d
[wt.
%, w
eigh
t per
cent
; mg/
kg, m
illig
ram
s per
kilo
gram
; —, n
ot d
eter
min
ed; <
, ana
lyte
not
det
ecte
d at
the
repo
rting
leve
l]
Site
nu
mbe
rN
a(w
t. %
)S
(wt.
%)
Ti(w
t. %
)A
g(m
g/kg
)A
s(m
g/kg
)B
a(m
g/kg
)B
e(m
g/kg
)B
i(m
g/kg
)Cd
(mg/
kg)
Ce(m
g/kg
)Co
(mg/
kg)
Cr(m
g/kg
)Cs
(mg/
kg)
Cu(m
g/kg
)G
a(m
g/kg
)In
(mg/
kg)
La(m
g/kg
)Li
(mg/
kg)
Mn
(mg/
kg)
PEC
a—
——
—33
——
—4.
98—
—11
1—
149
——
——
—
EB-1
080M
10.
040.
29<1
<124
91.
40.
190.
123
.39.
857
<575
.410
.50.
0413
.524
780
EB-7
70M
1.06
0.3
0.36
<12
255
1.6
0.31
0.4
3322
.466
<51,
160
11.5
0.08
17.3
222,
090
EB-6
00M
1.05
0.41
0.32
<13
236
1.5
0.5
141
.165
.564
<52,
730
11.4
0.1
19.4
211,
820
EB-9
0M1.
061.
70.
323
216
61.
11.
611
11.4
14.4
62<5
5,95
010
.40.
266
102,
200
EB-9
0M (o
verb
ank
sed.
)0.
564.
660.
3417
436
00.
77.
410.
223
.513
.389
51,
440
16.1
0.42
1316
429
SB-3
670M
0.68
0.03
0.14
<13
207
1.8
0.13
<0.1
19.5
4.8
24<5
10.4
7.99
0.02
10.5
2450
1SB
-240
0M0.
760.
080.
14<1
119
11.
70.
210.
119
.810
.823
<516
78.
20.
0410
.622
504
SB-1
360M
0.79
0.1
0.21
<11
191
1.6
0.18
0.2
199.
628
<519
87.
680.
0310
2486
4SB
-140
M0.
790.
080.
22<1
119
81.
60.
180.
224
.113
.532
<524
38.
490.
0311
.719
869
OR
-240
50M
0.72
0.02
0.16
<13
187
1.6
0.09
<0.1
16.5
4.5
37<5
4.5
7.68
<0.0
29.
328
475
OR
-232
00M
0.76
0.03
0.27
<15
195
1.8
0.07
0.1
21.7
8.1
29<5
76.7
7.77
0.03
10.9
241,
120
EB-2
0M1.
191.
410.
273
219
11.
31.
740.
714
.115
.167
<53,
700
11.8
0.22
7.4
131,
020
SB-3
260M
0.8
0.42
0.23
<12
173
1.4
0.56
0.3
19.6
1140
<51,
390
8.54
0.08
9.9
181,
120
EM-P
ON
D1
1.78
0.42
0.51
<1<1
276
1.8
0.3
0.8
45.1
19.8
102
686
.617
.40.
0827
.944
527
EM-P
ON
D2
1.3
0.54
0.52
<1<1
321
1.8
0.31
1.3
56.7
2413
05
87.6
15.7
0.07
30.4
4476
9EM
-PO
ND
30.
910.
370.
46<1
337
71.
60.
31.
268
.630
.985
581
.713
.90.
0634
.239
3,13
0EM
-PO
ND
40.
690.
340.
31<1
733
71.
60.
182.
565
.229
.267
538
013
.60.
0528
.441
2,41
0EM
-PO
ND
50.
890.
710.
3<1
329
61.
60.
174
102
78.3
70<5
3,54
011
.30.
0549
.432
1,43
0EM
-PO
ND
60.
650.
930.
19<1
318
42.
20.
260.
270
.113
.347
<51,
770
10.7
0.06
23.1
2344
3

Appendix 8 131
App
endi
x 8.
Ch
emis
try re
sults
for s
edim
ents
col
lect
ed in
Aug
ust a
nd S
epte
mbe
r 200
6 fro
m th
e El
y M
ine
stud
y ar
ea, V
ersh
ire, V
T.—
Cont
inue
d
[wt.
%, w
eigh
t per
cent
; mg/
kg, m
illig
ram
s per
kilo
gram
; —, n
ot d
eter
min
ed; <
, ana
lyte
not
det
ecte
d at
the
repo
rting
leve
l]
Site
No.
Mo
(mg/
kg)
Nb
(mg/
kg)
Ni
(mg/
kg)
P(m
g/kg
)Pb
(mg/
kg)
Rb(m
g/kg
)Sb
(mg/
kg)
Sc(m
g/kg
)Sn
(mg/
kg)
Sr(m
g/kg
)Te
(mg/
kg)
Th(m
g/kg
)Tl
(mg/
kg)
U(m
g/kg
)V
(mg/
kg)
W(m
g/kg
)Y
(mg/
kg)
Zn(m
g/kg
)Se
(mg/
kg)
PEC
a—
—48
.6—
128
——
——
——
——
——
——
459
—
EB-1
080M
0.41
3.9
16.5
330
24.8
49.9
<0.0
510
1.5
133
<0.1
3.8
0.3
0.9
730.
411
.156
0.3
EB-7
70M
2.11
5.1
2039
014
.650
.50.
0616
1.4
111
0.2
4.5
0.3
1.4
960.
520
.712
24.
1EB
-600
M8.
334.
523
.428
017
447
.51.
1515
.21.
899
0.3
4.5
0.3
1.6
970.
618
.418
68.
1EB
-90M
17.4
3.6
10.6
120
38.1
362.
0313
2.6
73.1
12.
50.
30.
711
20.
612
.520
630
.1EB
-90M
(ove
rban
k se
d.)
44.5
7.2
19.9
790
78.6
106
0.53
10.6
3.4
55.3
2.7
5.4
1.3
0.9
154
1.1
514
771
.1SB
-367
0M0.
283.
813
.226
011
.244
.30.
155.
61.
120
2<0
.13.
50.
20.
840
0.4
8.5
32<0
.2SB
-240
0M2.
294.
811
.426
010
.543
.80.
658.
61
193
<0.1
3.6
0.2
0.8
430.
412
.454
1.8
SB-1
360M
2.53
3.3
11.6
290
1143
.11.
86.
61.
220
6<0
.13.
40.
20.
848
0.5
7.8
661.
5SB
-140
M2.
595.
113
.626
031
.445
2.14
9.3
2.2
188
<0.1
3.6
0.2
0.9
520.
510
.885
1.1
OR
-240
50M
0.16
411
.726
09.
642
0.19
5.6
1.1
198
<0.1
2.8
0.2
0.7
380.
38.
133
<0.2
OR
-232
00M
0.5
5.3
10.8
270
10.4
40.5
0.22
8.6
1.7
193
<0.1
3.5
0.2
0.8
490.
414
530.
3EB
-20M
16.2
4.2
1527
038
40.7
1.15
11.6
2.3
92.2
1.1
2.8
0.3
0.8
112
0.7
7.9
196
35.2
SB-3
260M
7.26
4.7
11.5
230
17.9
37.7
2.39
10.5
2.2
164
0.3
3.3
0.2
162
0.6
12.8
939.
8EM
-PO
ND
10.
6310
.935
.698
026
.454
.8<0
.05
17.5
317
2<0
.15.
20.
42.
316
30.
728
.812
60.
7EM
-PO
ND
22.
5810
.345
.41,
020
31.8
54.2
0.11
15.8
2.7
165
<0.1
6.4
0.6
3.5
148
0.8
26.8
131
1.1
EM-P
ON
D3
2.15
9.3
38.6
1,12
043
.744
.40.
314
.42.
513
4<0
.17.
70.
83.
512
50.
827
.512
71.
4EM
-PO
ND
41.
755.
261
.166
020
.252
.70.
3112
1.9
91.9
<0.1
80.
53.
193
0.7
22.5
316
0.7
EM-P
ON
D5
2.54
656
.861
023
.534
.80.
9712
.71.
676
.5<0
.16.
40.
55.
779
0.6
32.1
507
1.3
EM-P
ON
D6
2.8
529
.555
018
.432
.31.
4213
.11.
494
.2<0
.15.
30.
26.
268
0.6
27.9
681.
4a P
roba
ble
effe
ct c
once
ntra
tion
(Mac
Don
ald
and
othe
rs, 2
000)
.

Prepared by: USGS Publishing Network Raleigh Publishing Service Center 3916 Sunset Ridge Road Raleigh, NC 27607
For additional information regarding this publication, contact: Robert R. Seal, II
U.S. Geological Survey 954 National Center Reston, VA 20192
email: [email protected]
Or visit the USGS New Hampshire and Vermont Water Science Center Web site at: http://vt.water.usgs.gov/


Seal and others—A
quatic Assessm
ent of the Ely Copper Mine Superfund Site, Vershire, Verm
ont—Scientific Investigations Report 2010–5084