AquaPrime Cloth Media Filtration€¢3,000+ Cloth Media Filters Worldwide • New Plants and...
51
AquaPrime Cloth Media Filtration John Dyson Product Channel Manager
Transcript of AquaPrime Cloth Media Filtration€¢3,000+ Cloth Media Filters Worldwide • New Plants and...

AquaPrime Cloth Media Filtration
John DysonProduct Channel Manager
Presenter
Presentation Notes

Presentation Outline
• Applications
• AquaPrime Cloth Media Filter Design
• Pilot and Full Scale Testing
• Frequently Asked Questions
• Summary
Presenter
Presentation Notes
Today, you’ll learn: Why Pile Cloth has replaced granular media and become the “go to” technology for Tertiary Filtration, About the wide variety of mechanical configurations available to better suit specific application requirements, That “Performance” means more than just “Influent loadings vs. effluent quality”, and especially, how the media cleanliness affects performance, And how Pile Cloth Filtration is used to meet stringent effluent quality requirements in a number of different applications We’ll end with a Summary of the key points and a Q & A period. Then we will go to the shop to observe some Pile Cloth Filters. TRANSITION: Let’s get started…(click)

Technology TimelineCloth Media Filtration
•3,000+ Cloth Media Filters Worldwide• New Plants and Retrofits
Aqua MegaDisk®
AquaABF® Filter
Cloth Media Filtration
2011 2012
Aqua BioMax®
OptiFiber PES-14® Microfiber Media
2013
Research & Technology Center
2014 20151975 1993 2003
AquaMB Process® System
2004
AquaDiamond® Filter
Primary Filtration
Cloth Media Filter IntelliPro®
ContinuedInnovation
•Size Ranging from 0.1 to 300+ MGD

OptiFiber® Pile Cloth Media
Pile Fibers
Support Backing
Presenter
Presentation Notes
(click through)

Primary Filtration &Primary Effluent Filtration

Primary Influent & Effluent Filtration
Screening
Biological Treatment
Secondary Clarifier
Tertiary Filtration(CMF)
Disinfection
Anaerobic DigesterThickener
AquaPrime (CMF)
Wastewater
Blowers
Primary Sludge
Digested Sludge
Return Activated Sludge Waste Activated Sludge Digester Gas
Discharge
AquaPrime (CMF)
Presenter
Presentation Notes
The AquaPrime can be used in many different applications within a WWTP. In the case of primary treatment, the AquaPrime can replace conventional primary clarifiers as show here. Also, can be in a used for primary effluent filtration applications too.

• Qualifies as a Green Technology
• Energy saving, less blower energy, more gas produced
• Replace/Retrofit existing primary clarifiers
• Plant expansions
• New construction, space savings
• Increased Capacity
• Nutrient removal in the same basin
• Increase hydraulic capacity
Primary & PEF FiltrationWhere to Apply?

AquaPrime Cloth Media Filter Design

AquaPrimeBasics - Differentiation
Floatable Zone
Solids Zone
Filtration Zone

AquaPrimeCMF Adaptations Floatable Added
Redesigned Solids Collection Manifold
Raised Centertube
Influent Baffle Relocated
Elevated Tank Height
Redesigned Hopper Bottom
Presenter
Presentation Notes
Emphasize the BNR Include 3-D Version with modifications (3 zones)

AquaPrimeCMF Adaptations
Floatable Weir Added
Redesigned Solids Collection Manifold
Raised Centertube
Elevated Tank Height
Redesigned Hopper Bottom
Presenter
Presentation Notes
Emphasize the BNR Include 3-D Version with modifications (3 zones)

AquaPrimeCMF Adaptations
Floatable Weir Added
Redesigned Solids Collection Manifold
Raised Centertube
Influent Baffle Relocated
Elevated Tank Height
Redesigned Hopper Bottom
Presenter
Presentation Notes
Emphasize the BNR Include 3-D Version with modifications (3 zones)

Mechanical ConfigurationsMid-sized to Large Flows
Aqua MegaDisk® AquaDisk®
Presenter
Presentation Notes
AquaDisk and Aqua MegaDisk are for mid-sized and large flows.

Primary & PEFPilot and Full Scale Testing

Primary Effluent FiltrationLinda County WWTP, CA
• Funded by California Energy Commission CEC
• Ran for 2 years with 99% uptime, no cloth wear
• Flux of 4.0 gpm/sf sustainable
• Influent TSS 80-160 mg/L
• TSS removal 50-60%
• Reduce load to aeration basin
• Increase quality of solids to anaerobic digestion

Influent EffluentTSS (mg/L) 120 60VSS (mg/L) 110 50BOD (mg/L) 180 130COD (mg/L) 160 120
Pilot TestingLinda County WWTP, CA
• Filter influent TSS 80-160 mg/L
• Filter TSS removal about 50-60%
• Filter effluent TSS 40-60 mg/L
• Backwash approximately 5-6%

Primary FiltrationTest Results: Example of Energy Management

40 ft
60 ft
Settling Basin
12 ft
20 ft
Aqua MegaDisk
Filter
OptiFiber® Pile Cloth MediaTest Results: Implications
Presenter
Presentation Notes
…a very small footprint. For 10.0 MGD peak capacity, a settling basin would occupy 2400 sf with assumption of surface overflow rate (SOR) of 4000 gpd/sf. Aqua MegaDisks (1 x 10 package tank) would take even less footprint. Kruger used SOR of 2600 gpd/sf for their calculation which results in larger settling basin. TRANSITION: Of course, Disk filters come in different size…(click)
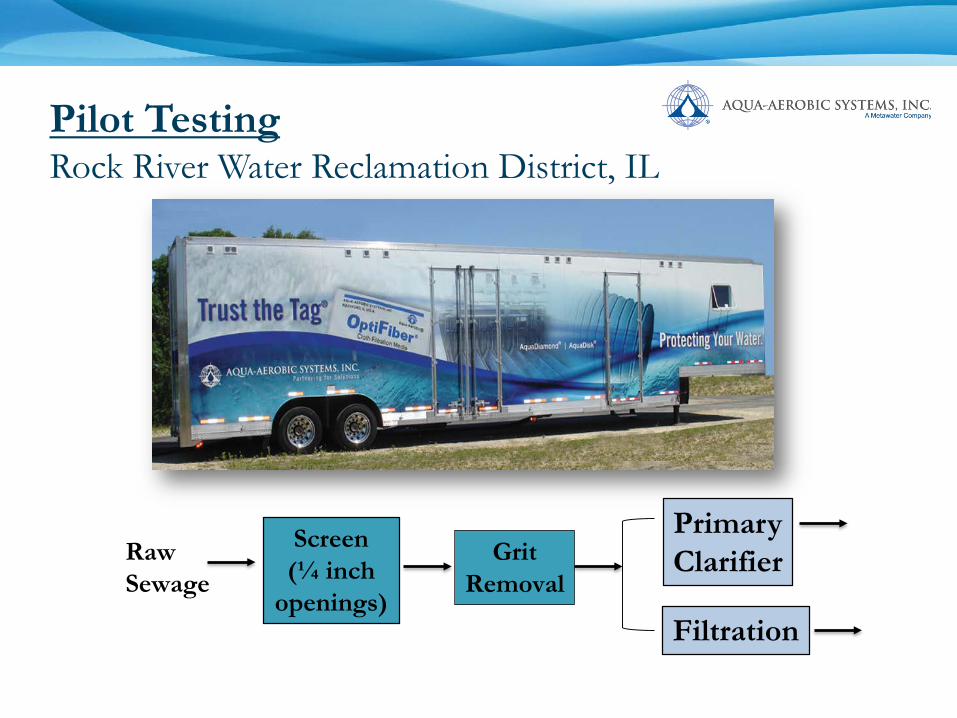
Screen (¼ inch
openings)Filtration
Grit Removal
Raw Sewage
PrimaryClarifier
Pilot TestingRock River Water Reclamation District, IL

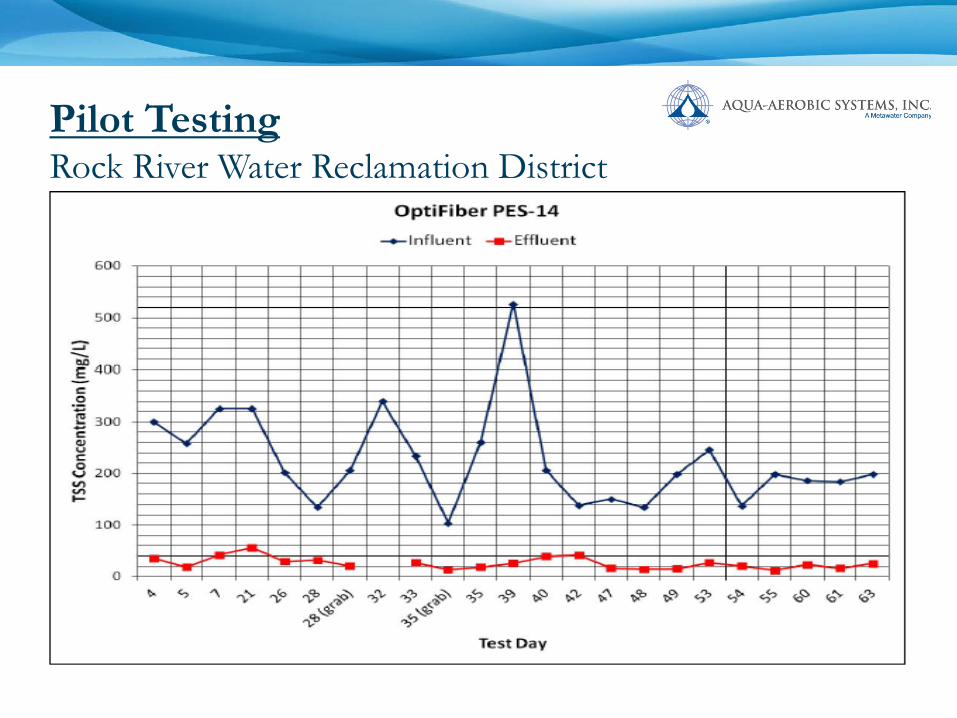
Pilot TestingRock River Water Reclamation District
Presenter
Presentation Notes
Tank is filling up with primary influent. It is clean cloth and eventually will be totally submerged

• 24/7 operation
• Side-by-side testing with primary clarifier
• Flux rates 3.25 – 4.0 gpm/sf-day
• Filter influent TSS averaged 236 mg/L (104 – 526 mg/L)
• Solids loading rates approximately 9 – 10 lb/sf-day
• No chemical addition for most runs
Pilot TestingRock River Water Reclamation District

OptiFiber PA2-13®
(Apr – May 2014)OptiFiber PES-14®
(May – Sep 2014)
Pilot TestingRock River Water Reclamation District
Presenter
Presentation Notes
PA2-13 It is originally introduced in 2000 Nylon pile fibers with polyester backing White color PES-13 Introduced in 2006 Polymer pile fibers with polyester backing Developed because of chlorine resistant properties White and blue color TRANSITION: Both of these cloths have been proven to provide high quality effluent over long periods of time and at hundreds of WWTP

Pilot TestingRock River Water Reclamation District
Presenter
Presentation Notes
Date range: 4/14 – 5/8/14 Data does not include weekend composites (due to long holding times and temperature preservation)

Pilot TestingRock River Water Reclamation District
Pilot TestingRock River Water Reclamation District

Pilot TestingRock River Water Reclamation District

Pilot TestingRock River Water Reclamation District
Presenter
Presentation Notes
High UVT means easier disinfection and less energy consumption.
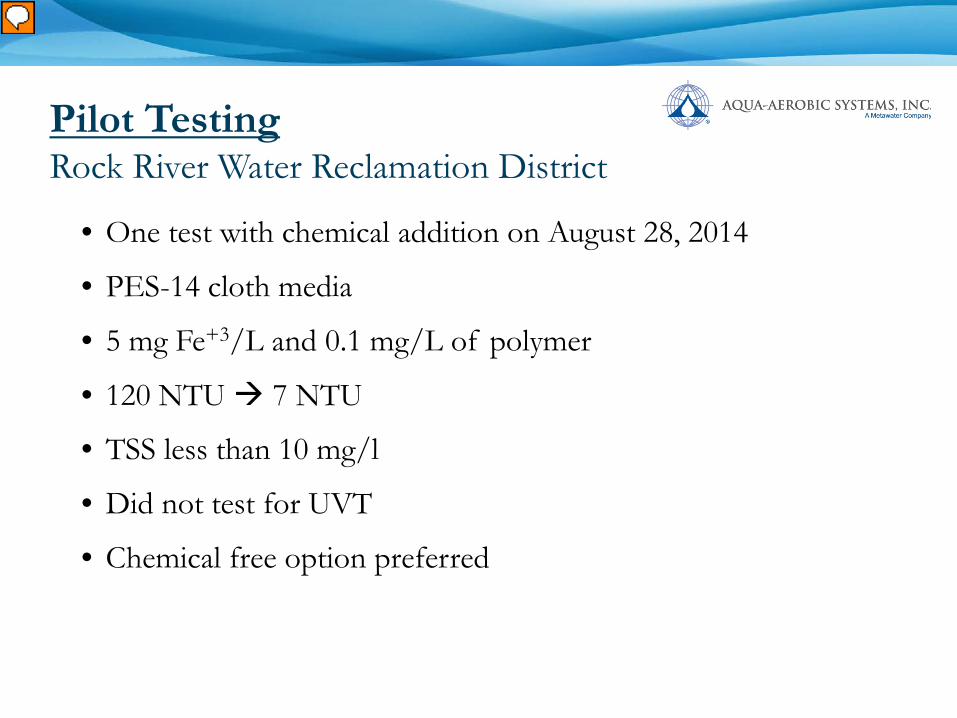
• One test with chemical addition on August 28, 2014
• PES-14 cloth media
• 5 mg Fe+3/L and 0.1 mg/L of polymer
• 120 NTU 7 NTU
• TSS less than 10 mg/l
• Did not test for UVT
• Chemical free option preferred
Pilot TestingRock River Water Reclamation District
Presenter
Presentation Notes
Terry recalls TSS of 6 mg/L. Other primary processes such as actiflo, CoMag, and chemically enhanced treatment typically requires addition of large amount of chemical. However, it is not preferred due to the added operational difficulty and cost. Our testing demonstrated that CMF can achieve high removals of solids, 80 to 90%. However, just to better understand the effect of chem, we did a spot check in end of piloting.

Primary & PEFPilot Test Summary

• Oak Hill, WV has been asked to take on additional flow from
a neighboring town
• To bring this town online, the plant capacity needs to increase.
Oak Hill, WV Testing & Results
Presenter
Presentation Notes

Screen FiltrationGrit Channel
Raw Sewage
Oak Hill, WVPilot Setup
• 2.0 – 3.0 gpm/ft2 / No chemical addition

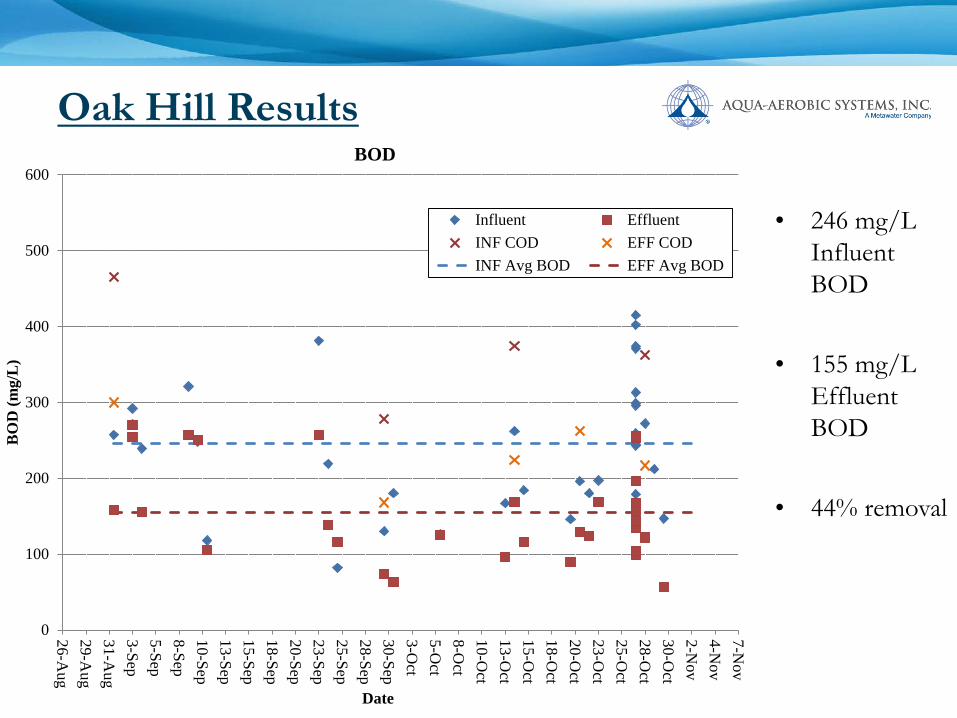
Oak Hill Results

Oak Hill Results
0
50
100
150
200
250
300
350
400
26-Aug
29-Aug
31-Aug
3-Sep5-Sep8-Sep10-Sep13-Sep15-Sep18-Sep20-Sep23-Sep25-Sep28-Sep30-Sep3-O
ct5-O
ct8-O
ct10-O
ct13-O
ct15-O
ct18-O
ct20-O
ct23-O
ct25-O
ct28-O
ct30-O
ct2-N
ov4-N
ov7-N
ov
Tota
l Sus
pend
ed S
olid
s, (m
g/L
)
Total Suspended Solids
InfluentEffluentavg Effluentavg Influent
• 178 mg/L Influent TSS
• 32 mg/L Effluent TSS
• 81% removal
Oak Hill Results
• 246 mg/L Influent BOD
• 155 mg/L Effluent BOD
• 44% removal
0
100
200
300
400
500
600
26-Aug
29-Aug
31-Aug
3-Sep5-Sep8-Sep10-Sep13-Sep15-Sep18-Sep20-Sep23-Sep25-Sep28-Sep30-Sep3-O
ct5-O
ct8-O
ct10-O
ct13-O
ct15-O
ct18-O
ct20-O
ct23-O
ct25-O
ct28-O
ct30-O
ct2-N
ov4-N
ov7-N
ov
BO
D (m
g/L
)
Date
BOD
Influent EffluentINF COD EFF CODINF Avg BOD EFF Avg BOD

Ashville, NCTSS Results
0
25
50
75
100
125
150
175
200
225
250
275
300
325
350
375
400
1 2 3 4 5 6 7 8 9 10 11 12 13 14 15 16 17 18
Tota
l Sus
pend
ed S
olid
s, (m
g/L
)
Test
Influent Effluent avg Effluent avg Influent
Presenter
Presentation Notes
Again > 80% TSS removal

Ashville, NCBOD Results
0
50
100
150
200
250
300
350
400
1 2 3 4 5 6 7 8 9 10 11 12 13 14 15 16 17 18
BO
D (m
g/L
)
Test Run
Inf. BOD Eff. BOD Inf. COD Eff. COD Avg. Inf. BOD Avg. Eff. BOD

Ashville, NCRemoval Efficiencies
0.0%
10.0%
20.0%
30.0%
40.0%
50.0%
60.0%
70.0%
80.0%
90.0%
100.0%
0 1 2 3 4 5 6 7 8 9 10 11 12 13 14 15 16 17 18 19
%R
emov
ed
%BOD5 Removed Average %BOD Removed %TSS Removal Average %TSS Removed

Typical Questions• Backwash & Solids Waste
• Ranged from 12 to 13% of the applied flow
• Send to thickener prior to digestion
• Cloth Wear• Two year PEF operation – no visible wear
• Nearly half year PF operation – no visible wear
• Fats, Oils and Grease (FOG)• Did not affect the operation or removal performance
• Removal considerations in full scale design
• Grit Was Not a Problem
• Includes removal in tank bottom

TRA – Central WWTP, TXPI Removal Efficiencies
273
330
50
100
150
200
250
300
mg/
L
Figure 1Primary Influent Study
Overall Average Filter Influent and Effluent TSS Levels
Influent TSS Effluent TSS
0%
20%
40%
60%
80%
100%
0
100
200
300
400
500
02/22/16 02/24/16 02/26/16 02/28/16 03/01/16 03/03/16 03/05/16
mg/
L
Figure 2Primary Influent Study
Daily TSS Removals
Influent Effluent

TRA – Central WWTP, TXPE Removal Efficiencies
65
30.7
0
10
20
30
40
50
60
70
mg/
L
Figure 3Primary Effluent Study
Overall Average Filter Influent and Effluent TSS Levels
Influent TSS Effluent TSS
0%
10%
20%
30%
40%
50%
60%
70%
0
100
200
300
400
500
03/05/16 03/06/16 03/07/16 03/08/16 03/09/16 03/10/16 03/11/16m
g/L
Figure 4 Primary Effluent Study
Daily TSS Removals
Influent TSS (mg/L) Effluent TSS (mg/L)

TRA – Central WWTP, TXSLR
0
2
4
6
8
10
12
02/24/16 02/25/16 02/26/16 02/27/16 02/28/16 02/29/16 03/01/16 03/02/16 03/03/16lb
s. T
SS/f
t2-d
ay
Figure 9Primary Influent Study
Daily SLRs
0.0
0.5
1.0
1.5
2.0
2.5
3.0
03/04/16 03/05/16 03/06/16 03/07/16 03/08/16 03/09/16 03/10/16 03/11/16
lbs.
TSS
/ft2
-day
Figure 10Primary Effluent Study
Daily SLR

Pilot Test SummaryTSS Removal
Media Influent Effluent Removal(mg/L) (mg/L) (%)
RRWRD PA2-13 253 44 80%
RRWRD PES-14 221 26 88%
Oak Hill, WV PES-14 176 31 81%
The Dalles, OR PES-14 206 40 80%
Asheville, NC PES-14 188 24 87%
Presenter
Presentation Notes
TSS removal has been consistently > 80% at all sites tested.

Pilot Test SummaryBOD Removal
Media Influent Effluent Removal(mg/L) (mg/L) (%)
RRWRD PA2-13 220 95 54%
RRWRD PES-14 169 59 64%
Oak Hill, WV PES-14 242 149 40%
The Dalles, OR PES-14 168 65 59%
Ashville, NC PES-14 184 112 40%
Presenter
Presentation Notes
BOD removal varies significantly from site to site depending on how much of the BOD is in a particulate form. A good rule of thumb is between 0.5 and 0.6 mg BOD is removed for each mg of TSS removed.

• Carbon for Biological Nutrient Removal
• Smaller, uniform particle size would benefit BNR
• Stage feed will compensate
• CEC Study 2 will specifically address this issue
• Backwash
• Ranged from 12 to 13% of the applied flow
• Send to thickener prior to digestion
Primary & Primary Effluent FiltrationTypical Questions

Primary & Primary Effluent FiltrationTypical Questions
• Cloth Wear
• Two year PEF operation – no visible wear
• Nearly half year PF operation – no visible wear
• Fats, Oils and Grease (FOG)
• Did not affect the operation or removal performance
• Removal considerations in full scale design
• Grit Was Not a Problem
• Will include storage at the tank bottom

Testing Capabilities

Primary Filtration Piloting
• Rapid Mix Tank
• 2-Stage Floc Chamber
• In-line TSS, Flow
• Lab
• SCADA
• Class 1 Div 2 Group D

Primary Filtration Piloting

Summary

• Primary filtration and wet weather filtration are rapidly emerging technologies in the industry.
• Cloth media filtration technology is uniquely suited for primary filtration and wet weather filtration.
• Aqua-Aerobic Systems has done and continues to do extensive testing to answer questions regarding the technology.
• The technology operates on similar principals to tertiary filtration with improvements to filter design for the primary environment.
Summary
Presenter
Presentation Notes
Saving energy, chemical and time…

Questions