APX GROUP HOLDINGS, INC.
44
UNITED STATES SECURITIES AND EXCHANGE COMMISSION Washington, D.C. 20549 FORM 8-K CURRENT REPORT Pursuant to Section 13 or 15(d) of the Securities Exchange Act of 1934 Date of Report (Date Earliest Event Reported): November 14, 2017 APX GROUP HOLDINGS, INC. (Exact name of registrant as specified in its charter) Delaware 333-191132-02 46-1304852 (State or Other Jurisdiction of Incorporation) (Commission File Number) (IRS Employer Identification No.) 4931 North 300 West Provo, Utah 84604 (Address of Principal Executive Offices) (Zip Code) (801) 377-9111 (Registrant’s telephone number, including area code) Not Applicable (Former Name or Former Address, if Changed Since Last Report) Check the appropriate box below if the Form 8-K filing is intended to simultaneously satisfy the filing obligation of the registrant under any of the following provisions: ☐ Written communications pursuant to Rule 425 under the Securities Act (17 CFR 230.425) ☐ Soliciting material pursuant to Rule 14a-12 under the Exchange Act (17 CFR 240.14a-12) ☐ Pre-commencement communications pursuant to Rule 14d-2(b) under the Exchange Act (17 CFR 240.14d-2(b)) ☐ Pre-commencement communications pursuant to Rule 13e-4(c) under the Exchange Act (17 CFR 240.13e-4(c)) Indicate by check mark whether the registrant is an emerging growth company as defined in Rule 405 of the Securities Act of 1933 (§230.405 of this chapter) or Rule 12b-2 of the Securities Exchange Act of 1934 (§240.12b-2 of this chapter). Emerging growth company ☐ If an emerging growth company, indicate by check mark if the registrant has elected not to use the extended transition period for complying with any new or revised financial accounting standards provided pursuant to Section 13(a) of the Exchange Act. ☐
Transcript of APX GROUP HOLDINGS, INC.

UNITED STATESSECURITIES AND EXCHANGE COMMISSION
Washington, D.C. 20549
FORM 8-K
CURRENT REPORTPursuant to Section 13 or 15(d)
of the Securities Exchange Act of 1934
Date of Report (Date Earliest Event Reported): November 14, 2017
APX GROUP HOLDINGS, INC.(Exact name of registrant as specified in its charter)
Delaware 333-191132-02 46-1304852(State or Other Jurisdiction
of Incorporation) (CommissionFile Number)
(IRS EmployerIdentification No.)
4931 North 300 WestProvo, Utah 84604
(Address of Principal Executive Offices) (Zip Code)
(801) 377-9111(Registrant’s telephone number, including area code)
Not Applicable(Former Name or Former Address, if Changed Since Last Report)
Check the appropriate box below if the Form 8-K filing is intended to simultaneously satisfy the filing obligation of the registrant under any of the followingprovisions:
☐ Written communications pursuant to Rule 425 under the Securities Act (17 CFR 230.425)
☐ Soliciting material pursuant to Rule 14a-12 under the Exchange Act (17 CFR 240.14a-12)
☐ Pre-commencement communications pursuant to Rule 14d-2(b) under the Exchange Act (17 CFR 240.14d-2(b))
☐ Pre-commencement communications pursuant to Rule 13e-4(c) under the Exchange Act (17 CFR 240.13e-4(c))
Indicate by check mark whether the registrant is an emerging growth company as defined in Rule 405 of the Securities Act of 1933 (§230.405 of this chapter) orRule 12b-2 of the Securities Exchange Act of 1934 (§240.12b-2 of this chapter).
Emerging growth company ☐
If an emerging growth company, indicate by check mark if the registrant has elected not to use the extended transition period for complying with any new orrevised financial accounting standards provided pursuant to Section 13(a) of the Exchange Act. ☐

Item 2.02 Results of Operations and Financial Condition.
On November 14, 2017, APX Group Holdings, Inc. (the “Company”) issued a press release announcing the results of the Company’s operations for thequarter ended September 30, 2017. The full text of the press release is furnished as Exhibit 99.1 to this Current Report on Form 8-K and is incorporated herein byreference in this Item 2.02.
In connection with the press release, the Company held a telephone conference call that was webcast on November 14, 2017. Presentation slides referencedduring the conference call were available on the Company’s website for viewing by call participants. A transcript of that call together with presentation slidesreferenced during the conference call are furnished as Exhibit 99.2 to this Current Report on Form 8-K and are incorporated by reference in this Item 2.02.
The attached transcript and presentation slides contain information that includes Adjusted EBITDA, a non-GAAP financial measure as defined inRegulation G adopted by the Securities and Exchange Commission (the “SEC”).
The Company defines “Adjusted EBITDA” as net income (loss) before interest expense (net of interest income), income and franchise taxes and depreciationand amortization (including amortization of capitalized subscriber acquisition costs), further adjusted to exclude the effects of certain contract sales to third parties,non-capitalized subscriber acquisition costs, stock based compensation, the historical results of Solar and certain unusual, non-cash, non-recurring and other itemspermitted in certain covenant calculations under the indentures and other agreements governing the Company’s notes and the credit agreement governing theCompany’s revolving credit facility.
The Company believes that the presentation of Adjusted EBITDA is appropriate to provide additional information to investors about the calculation of, andcompliance with, certain covenants in the indentures and other agreements governing the Company’s notes and the credit agreement governing the Company’srevolving credit facility. The Company cautions investors that amounts presented in accordance with the Company’s definition of Adjusted EBITDA may not becomparable to similar measures disclosed by other issuers, because not all issuers and analysts calculate Adjusted EBITDA in the same manner.
Adjusted EBITDA is not a measurement of the Company’s financial performance under GAAP and should not be considered as an alternative to net income(loss) or any other performance measures derived in accordance with GAAP or as an alternative to cash flows from operating activities as a measure of theCompany’s liquidity. Tables providing reconciliations of Adjusted EBITDA to the closest GAAP financial measure are included with the press release and thepresentation slides filed as Exhibits 99.1 and 99.2, respectively, to this Current Report on Form 8-K.
The information in this Current Report on Form 8-K and Exhibits 99.1 and 99.2 is being furnished pursuant to Item 2.02 of Form 8-K and shall not bedeemed to be “filed” for purposes of Section 18 of the Securities Exchange Act of 1934, as amended (the “Exchange Act”), or otherwise subject to the liabilities ofthat section, nor shall it be deemed incorporated by reference in any filing made by the Company under the Securities Act of 1933, as amended, or the ExchangeAct, except as shall be expressly set forth by specific reference in such a filing.
In addition, the press release, transcript and presentation slides furnished as exhibits to this report include certain forward-looking statements as defined bythe Private Securities Litigation Reform Act of 1995, including statements regarding, among other things, the Company’s plans, strategies and prospects, bothbusiness and financial, including without limitation with respect to the Vivint Flex Pay plan and the Company’s partnership with Best Buy. Forward-lookingstatements convey the Company’s current expectations or forecasts of future events. These statements are based on the beliefs and assumptions of management.Although the Company believes that its plans, intentions and expectations reflected in or suggested by these forward-looking statements are reasonable, theCompany cannot assure you that it will achieve or realize these plans, intentions or expectations. Forward-looking statements are inherently subject to risks,uncertainties and assumptions. Generally, statements that are not historical facts, including statements concerning the Company’s possible or assumed futureactions, business strategies, events or results of operations, are forward-looking statements. These statements may be preceded by, followed by or include the words“believes,” “estimates,” “expects,” “projects,” “forecasts,” “may,” “will,” “should,” “seeks,” “plans,” “scheduled,” “anticipates” or “intends” or similarexpressions.
Forward-looking statements are not guarantees of performance. You should not put undue reliance on these statements which speak only as of the datehereof. You should understand that the following important factors, in addition to those discussed in “Risk Factors” in the Company’s most recent annual report onForm 10-K, and other reports filed with the SEC, as such factors may be updated from time to time in the Company’s periodic filings with the SEC, which areavailable on the SEC’s website at www.sec.gov , could affect the Company’s future results and could cause those results or other outcomes to differ materially fromthose expressed or implied in the Company’s forward-looking statements:
• risks of the smart home and security industry, including risks of and publicity surrounding the sales, subscriber origination and retention process;
• the highly competitive nature of the smart home and security industry and product introductions and promotional activity by the Company’scompetitors;
• litigation, complaints or adverse publicity;
• the impact of changes in consumer spending patterns, consumer preferences, local, regional, and national economic conditions, crime, weather,demographic trends and employee availability;
• adverse publicity and product liability claims;
• increases and/or decreases in utility and other energy costs, increased costs related to utility or governmental requirements;
• cost increases or shortages in smart home and security technology products or components;
• the introduction of unsuccessful new products and services;
• privacy and data protection laws, privacy or data breaches, or the loss of data; and
• the impact to the Company’s business, results of operations, financial condition, regulatory compliance and customer experience of the Vivint FlexPay plan and the Best Buy Smart Home powered by Vivint program.

In addition, the origination and retention of new subscribers will depend on various factors, including, but not limited to, market availability, subscriberinterest, the availability of suitable components, the negotiation of acceptable contract terms with subscribers, local permitting, licensing and regulatorycompliance, and the Company’s ability to manage anticipated expansion and to hire, train and retain personnel, the financial viability of subscribers and generaleconomic conditions.
These and other factors that could cause actual results to differ from those implied by the forward-looking statements in the press release, transcript andpresentation slides furnished as exhibits to this report are more fully described in the “Risk Factors” section in the Company’s most recent annual report onForm 10-K, as such factors may be updated from time to time in the Company’s periodic filings with the SEC. The risks described in “Risk Factors” are notexhaustive. New risk factors emerge from time to time and it is not possible for the Company to predict all such risk factors, nor can the Company assess the impactof all such risk factors on the Company’s business or the extent to which any factor or combination of factors may cause actual results to differ materially fromthose contained in any forward-looking statements. All forward-looking statements attributable to the Company or persons acting on its behalf are expresslyqualified in their entirety by the foregoing cautionary statements. The Company undertakes no obligations to update or revise publicly any forward-lookingstatements, whether as a result of new information, future events or otherwise.
Item 9.01 Financial Statements and Exhibits.
(d) Exhibits. Exhibit
No. Description
99.1 Press Release issued by APX Group Holdings, Inc., dated November 14, 2017, announcing results for the quarter ended September 30, 2017.
99.2 Transcript of Conference Call by APX Group Holdings, Inc. dated November 14, 2017 and Call Presentation Slides.
1

EXHIBIT INDEX Exhibit
No. Description99.1 Press Release issued by APX Group Holdings, Inc., dated November 14, 2017, announcing results for the quarter ended September 30, 2017.
99.2 Transcript of Conference Call by APX Group Holdings, Inc. dated November 14, 2017 and Call Presentation Slides.
2

SIGNATURES
Pursuant to the requirements of the Securities Exchange Act of 1934, the registrant has duly caused this report to be signed by the undersigned hereunto dulyauthorized.
APX GROUP HOLDINGS, INC.
By: /s/ Dale GerardName: Dale GerardTitle: Senior Vice President of Finance and Treasurer
Date: November 17, 2017
3

Exhibit 99.1
APX GROUP HOLDINGS, INC. REPORTS THIRD QUARTER 2017 RESULTS
Third Quarter 2017 Highlights
• Total revenues of $228.7 million, an increase of 15.3% year over year
• LTM attrition of 11.3%, 160 bps year-over-year improvement
Provo, UT – November 14, 2017 – APX Group Holdings, Inc. (“APX Group”, “Vivint” or the “Company”) today reported results for the three months endedSeptember 30, 2017.
“This has been a year of significant change in our sales and go-to-market activities,” said Todd Pedersen, CEO of APX Group, Inc. “Our work to create a retailchannel, specifically the Best Buy partnership, will yield significant scale to our business. The aggressive ramp of approximately 325 Best Buy store openingsduring Q3 2017, along with corresponding hiring and training activities, required significant resources and management bandwidth. We are working closely withBest Buy corporate and store management to integrate our activities and prepare for the holiday selling season with a commensurate improvement in salesproductivity. With the introduction of the Vivint Flex Pay program, our sales professionals have a new set of product offerings and underwriting procedures. Weexpected sales productivity to dip during the Vivint Flex Pay transition, and we believe we’re approaching the point where we have recovered to our pre-VivintFlex Pay momentum. These changes put the Company in a better position to take advantage of the market opportunities in front of us. We’ll spend the remainder of2017 fine-tuning both our sales and operational functions to prepare for a successful 2018.”
Revenue and Subscriber Data
APX Group reported total revenues of $228.7 million for the three month period ended September 30, 2017, an increase of $30.3 million or 15.3%, as compared tothe same period in 2016. Approximately $20.9 million of the increase in total revenues was driven by an increase in Total Subscribers of 11.2% and $10.4 millionof the increase in total revenues was from the recognition of imputed interest and deferred revenue from the sale of products and installation associated with theCompany’s transition to the Vivint Flex Pay model. The increase in total revenues was partially offset by $0.8 million due to lower Average Monthly ServiceRevenue per User, also attributable to the Vivint Flex Pay program, and a decrease in revenues of $0.4 million associated with the Wireless internet business. TotalRevenues for the third quarter of 2017 were positively impacted by $0.7 million from foreign exchange translation as compared to the same period in 2016.

Total revenues for the nine-month period ended September 30, 2017, increased 16.8% to $646.1 million as compared to $553.4 million for the same period in2016.
The Company added 89,019 net new smart home subscribers during the third quarter of 2017. Vivint’s inside sales channel originated 31,059 net new smart homesubscribers in the three months ended September 30, 2017, while the DTH channel added 57,960 net new smart home subscribers during the quarter. During thethird quarter of 2017, Vivint received an average of $997 of upfront proceeds per net new smart home subscriber at the point of installation, an increase of $887 pernet new smart home subscriber, as compared to the same period in 2016, which can be attributed to Vivint Flex Pay. As a result of the increase in the amountcollected at the point of installation, the Company’s LTM net subscriber acquisition costs per net new smart home subscriber decreased by $451 versus the sameperiod LTM in 2016. Average Monthly Revenue per New User, which includes the recognition of imputed interest and deferred revenue related to the consumerpurchasing of products was $67.42 for the three months ended September 30, 2017, as compared to $68.85 for the same period in 2016.
Summary of Key Financial and Portfolio Metrics
($ in millions, except for subscriber data)
September 30,2016
December 31, 2016
March 31, 2017
June 30, 2017
September 30, 2017
Total Revenues $ 198.3 $ 204.5 $ 205.4 $ 212.1 $ 228.7 Net Loss $ (70.0) $ (71.2) $ (82.6) $ (84.2) $ (107.9) Adjusted EBITDA (a) $ 118.0 $ 118.3 $ 115.4 $ 120.5 $ 128.5
Adj EBITDA Margin 59.5% 57.8% 56.2% 56.8% 56.2% Total Monthly Service Revenue (1) $ 65.3 $ 65.6 $ 66.0 $ 68.5 $ 71.2 Net New Smart Home Subscribers 94,272 39,805 39,292 92,837 89,019Average Monthly Revenue per New User (1) $ 68.85 $ 66.33 $ 68.90 $ 67.51 $ 67.42 Total Subscribers (1) 1,142,571 1,146,746 1,151,453 1,215,056 1,270,478 Average Monthly Service Revenue per
User (1) $ 57.16 $ 57.23 $ 57.31 $ 56.40 $ 56.07 Subscriber Account Attrition (2) 12.9% 12.6% 12.0% 11.5% 11.3% (1) Data excludes wireless Internet business and pilot programs and are provided as of each period end(2) Subscriber attrition is reported on an LTM basis for each period end and excludes wireless Internet business and pilot programs
“Summarizing third quarter 2017 performance, I would call out our strong revenue growth of 15%, attrition improving to 11.3% for the LTM and total subscribersincreased to 1.27 million,” said Mark Davies, chief financial officer of APX Group, Inc. “Significantly, we are seeing the cash flow benefits from our Vivint FlexPay program as we generated $88 million in proceeds at point of sale through paid in full and third-party financing during the quarter. As result of this Vivint FlexPay impact, our LTM net creation cost was reduced by 22%, or $451 per new subscriber. The third quarter was the first full quarter for the Vivint Flex Pay programand we expect the net subscriber acquisition cost improvements to continue, until we have a full year to measure the LTM impact. As planned, adjusted EBITDAdid not grow as rapidly as revenue in the third quarter 2017. Start-up costs associated with the Best Buy roll-out, as well as targeted investments in customer servicedelivery, quality, reliability, and platform technology, have had an impact on currents results, but which we believe will yield return in the coming quarters.” a This earning release includes Adjusted EBITDA, a metric that is not calculated in accordance with Generally Accepted Accounting Principles in the U.S.
(“GAAP”). See the “Statement Regarding Non-GAAP Financial Measures” section at the end of this earnings release for the definition of Adjusted EBITDAand a reconciliation to its most directly comparable financial measure calculated in accordance with GAAP.

Costs and Expenses
Operating expenses in the third quarter of 2017 increased by 17.7% to $81.1 million as compared to $68.9 million in the third quarter of 2016. The $12.2 millionincrease was primarily related to $6.9 million in personnel and support costs driven by an 11.2% increase in the Total Subscribers and $3.3 million for theexpansion of our sales channels, related to the startup of our large-format retail program (Best Buy). Net service cost per user was $15.04 as compared to $14.59 inthe third quarter 2016 as we made focused investments to improve customer service.
Selling expenses, net of capitalized subscriber acquisition costs, for the third quarter of 2017 were $53.8 million, compared to $32.6 million for the same period in2016. The 65.0% year-over-year increase in selling expenses is primarily attributable to $2.2 million in marketing costs, primarily lead generation costs to supportthe growth in origination from Inside Sales, $14.6 million to support the Company’s sales channel expansion, mostly related to Best Buy, and $2.0 million inpersonnel and related cost to support growth within our core business.
General and administrative (“G&A”) expenses, net of allocations, for the third quarter of 2017 were $49.4 million as compared to $35.3 million for the same periodin 2016. The year-over-year increase of $14.1 million was primarily due to an additional $6.9 million to support expansion of the Company’s large-format retailprogram, $4.3 million in personnel and related costs, and $1.5 million contracted services, primarily related to legal and professional services.
Adjusted EBITDA and Net Loss
Adjusted EBITDA for the third quarter of 2017 grew by 8.9% to $128.5 million on a net loss of $107.9 million, compared to adjusted EBITDA of $118.0 millionon a net loss of $70.0 million for the same period in 2016.
Adjusted EBITDA for the nine-month period ended September 30, 2017 was $364.5 million on a net loss of $274.8 million as compared to $325.8 million on a netloss of $204.8 million for the same period in 2016.
Liquidity
On August 10, 2017, we entered into a Third Amended and Restated Credit Agreement among APX Group, Inc., the Company, the other guarantors party thereto,each lender from time to time party thereto and Bank of America, N.A., as administrative agent, L/C issuer and swing line lender (the “Amended and RestatedCredit Agreement”). The Amended and Restated Credit Agreement amended and restated our existing credit agreement to provide for, among other things, (1) anincrease in the aggregate commitments previously available to us from $289.4 million to $324.3 million and (2) the extension of the maturity date with respect tocertain of the previously available commitments.
As of September 30, 2017, the Company’s liquidity position on a consolidated basis, defined as cash on hand, short-term marketable securities and availableborrowing capacity under the Company’s revolving credit facility, was approximately $431 million.

Certain Credit Statistics
Our net leverage ratio, defined as the ratio of net debt to LTM Adjusted EBITDA, was 5.5x at September 30, 2017.
Conference Call
Vivint Smart Home will host a conference call and webcast to discuss the quarterly results at 5:00 p.m. ET today, November 14, 2017. To join the live webcast andconference call, please visit the Investor Relations section of the Vivint Smart Home website, www.investors.vivint.com/events-presentations/events or dial (866)393-4306 for domestic participants or (734) 385-2616 for international participants with the conference code of 5389009.
A financial results presentation and online access to join the webcast will be available immediately before the call on the Investor Relations section of theCompany’s website at http://www.investors.vivint.com/events-presentations/events. A replay of the webcast will be available for 30 days on the Investor Relationssection of the Company’s website at www.investors.vivint.com following the completion of the webcast and conference call.
About Vivint Smart Home
Vivint Smart Home is a leading provider of smart home services in North America. Vivint delivers an integrated smart home system with in-home consultation,professional installation and support delivered by its Smart Home Pros, as well as 24-7 customer care and monitoring. Dedicated to redefining the home experiencewith intelligent products and services, Vivint serves more than one million customers, J.D. Power ranked Vivint Smart Home “Highest in Customer Satisfaction forHome Security System”. For more information, visit www.vivint.com.
Forward Looking Statements
This earnings release and accompanying conference call include certain forward-looking statements as defined by the Private Securities Litigation Reform Act of1995, including statements regarding, among other things, our plans, strategies and prospects, both business and financial, including without limitation with respectto the Vivint Flex Pay plan and our partnership with Best Buy. Forward-looking statements convey the Company’s current expectations or forecasts of futureevents. All statements contained in this earnings release other than statements of historical fact are forward-looking statements. These statements are based on thebeliefs and assumptions of our management. Although we believe that our plans, intentions and expectations reflected in or suggested by these forward-lookingstatements are reasonable, we cannot assure you that we will achieve or realize these plans, intentions or expectations. Forward-looking statements are inherentlysubject to risks, uncertainties and assumptions. These statements may be preceded by, followed by or include the words “believes,” “estimates,” “expects,”“projects,” “forecasts,” “may,” “will,” “should,” “seeks,” “plans,” “scheduled,” “anticipates” or “intends” or similar expressions.
Forward-looking statements are not guarantees of performance. You should not put undue reliance on these statements which speak only as of this date hereof. Youshould understand that the following important factors, in addition to those discussed in “Risk Factors” in our most recent annual report on Form 10-K, and otherreports filed with the Securities and Exchange Commission (“SEC”), as such factors may be updated from time to time in our periodic filings with the SEC, whichare available on the SEC’s website at www.sec.gov, could affect our future results and could cause those results or other outcomes to differ materially from thoseexpressed or implied in our forward-looking statements:

• risks of the smart home and security industry, including risks of and publicity surrounding the sales, subscriber origination and retention process;
• the highly competitive nature of the smart home and security industry and product introductions and promotional activity by our competitors;
• litigation, complaints or adverse publicity;
• the impact of changes in consumer spending patterns, consumer preferences, local, regional, and national economic conditions, crime, weather,demographic trends and employee availability;
• adverse publicity and product liability claims;
• increases and/or decreases in utility and other energy costs, increased costs related to utility or governmental requirements;
• cost increases or shortages in smart home and security technology products or components;
• the introduction of unsuccessful new products and services;
• privacy and data protection laws, privacy or data breaches, or the loss of data; and
• the impact to our business, results of operations, financial condition, regulatory compliance and customer experience of the Vivint Flex Pay plan andthe Best Buy Smart Home powered by Vivint program.
In addition, the origination and retention of new subscribers will depend on various factors, including, but not limited to, market availability, subscriber interest, theavailability of suitable components, the negotiation of acceptable contract terms with subscribers, local permitting, licensing and regulatory compliance, and ourability to manage anticipated expansion and to hire, train and retain personnel, the financial viability of subscribers and general economic conditions.
These and other factors that could cause actual results to differ from those implied by the forward-looking statements in this press release are more fully describedin the “Risk Factors” section in our most recent annual report on Form 10-K, and other reports as such factors may be updated from time to time in our periodicfilings with the SEC. These risk factors should not be construed as exhaustive. We undertake no obligations to update or revise publicly any forward-lookingstatements, whether a result of new information, future events, or otherwise, except as required by law.
Certain Definitions
Total subscribers - the aggregate number of our smart home and security subscribers under contract as of the end of a given period.
Total monthly service revenue (“MSR”) - the aggregate, contracted recurring monthly Service billings to our smart home and security subscribers, based on thenumber of Total Subscribers as of the end of a given period. This metric reflects billings on our Services and excludes monthly billings for the purchases of ourProducts.
Average monthly service revenue per user (“AMSRU”) - MSR divided by the number of Total Subscribers as of the end of a given period.
Attrition rate - the aggregate number of canceled smart home and security subscribers during the prior twelve-month period divided by the monthly weightedaverage number of Total Subscribers for such period. Subscribers are considered canceled when they terminate in accordance with the terms of their contract, areterminated by us or if payment from such subscribers is deemed uncollectible (when at least four monthly Service Billings become past due). If a sale of a servicecontract to third parties occurs, or a subscriber relocates but continues their service, we do not consider this as a cancellation. If a subscriber transfers their servicecontract to a new subscriber, we do not consider this as a cancellation.

Net service cost per user - average monthly service costs for the period, including monitoring, customer service, field service and other service support costs, lesstotal non-recurring Product and Service billings for the period divided by average monthly Total Subscribers for the same period.
New subscribers - the aggregate number of net new smart home and security subscribers originated during a given period. This metric excludes new subscribersacquired by the transfer of a service contract from one subscriber to another.
Average monthly service revenue per new user (“AMSRNU”) - the AMSRU for New Subscribers divided by New Subscribers during a given period.
Average monthly revenue per new user (“AMRNU”) - AMSRNU plus the average monthly recognized deferred and interest revenue associated with Product salesto New Subscribers during a given period.
Net subscriber acquisition cost per new user - the total capitalized and expensed costs to acquire New Subscribers for a given period, divided by New Subscribersadded for the period. These costs include commissions, equipment, installation, marketing and other sales support costs, less upfront proceeds received at contractorigination from Product sales, activation and installation fees.
Contact:Dale R. GerardSenior Vice President of Finance and [email protected]

APX GROUP HOLDINGS, INC. and SUBSIDIARIES
Consolidated Statements of Operations
(In thousands)
(Unaudited)
Three Months Ended September 30,
Nine Months Ended September 30,
2017 2016 2017 2016 Revenues:
Recurring and other revenue $ 219,111 $189,032 $ 618,752 $ 528,950 Service and other sales revenue 6,764 6,005 18,513 16,842 Activation fees 2,783 3,298 8,872 7,603
Total revenues 228,658 198,335 646,137 553,395 Costs and expenses:
Operating expenses 81,108 68,872 229,776 195,806 Selling expenses 53,821 32,633 134,894 98,856 General and administrative expenses 49,416 35,284 127,179 101,834 Depreciation and amortization 84,460 76,837 241,425 209,418 Restructuring and asset impairment recoveries — 2,445 — 1,765
Total costs and expenses 268,805 216,071 733,274 607,679
Loss from operations (40,147) (17,736) (87,137) (54,284) Other expenses (income):
Interest expense 58,005 51,962 166,644 144,827 Interest income — (130) (104) (153) Other loss, net 8,611 551 18,808 5,304
Total other expenses 66,616 52,383 185,348 149,978 Loss before income taxes (106,763) (70,119) (272,485) (204,262)
Income tax expense (benefit) 1,157 (145) 2,308 527
Net loss $(107,920) $ (69,974) $(274,793) $(204,789)

APX GROUP HOLDINGS, INC. and SUBSIDIARIES
Condensed Consolidated Balance Sheets
(In thousands)
(Unaudited)
September 30,2017
December 31,2016
ASSETS Current Assets:
Cash and cash equivalents $ 115,567 $ 43,520 Accounts and notes receivable, net 34,414 12,891 Inventories 99,185 38,452 Prepaid expenses and other current assets 19,969 10,158
Total current assets 269,135 105,021 Property, plant and equipment, net 72,920 63,626 Subscriber acquisition costs, net 1,275,364 1,052,434 Deferred financing costs, net 3,373 4,420 Intangible assets, net 402,961 475,392 Goodwill 837,210 835,233 Long-term investments and other assets, net 83,057 11,536
Total assets $ 2,944,020 $ 2,547,662
LIABILITIES AND STOCKHOLDERS’ DEFICIT Current Liabilities:
Accounts payable $ 81,348 $ 49,119 Accrued payroll and commissions 103,456 46,288 Accrued expenses and other current liabilities 108,558 34,265 Deferred revenue 83,288 45,722 Current portion of capital lease obligations 10,063 9,797
Total current liabilities 386,713 185,191 Notes payable, net 2,759,200 2,486,700 Capital lease obligations, net of current portion 8,220 7,935 Deferred revenue, net of current portion 227,442 58,734 Other long-term obligations 70,501 47,080 Deferred income tax liabilities 7,761 7,204
Total liabilities 3,459,837 2,792,844 Total stockholders’ deficit (515,817) (245,182)
Total liabilities and stockholders’ deficit $ 2,944,020 $ 2,547,662

APX GROUP HOLDINGS, INC. and SUBSIDIARIES
Summary Cash Flow Data
(In thousands)
(Unaudited)
Three Months Ended September 30,
Nine Months Ended September 30,
2017 2016 2017 2016 Net cash used in operating activities $ (16,007) $ (53,216) $(149,268) $(224,789) Net cash used in investing activities (3,778) (4,976) (15,780) (9,873) Net cash provided by financing activities 133,800 129,266 237,023 425,024 Effect of exchange rate changes on cash 82 (41) 72 (482)
Net increase in cash and cash equivalents $114,097 $ 71,033 72,047 189,880 Cash and cash equivalents:
Beginning of period 1,470 121,406 43,520 2,559
End of period $115,567 $192,439 $ 115,567 $ 192,439

Statement Regarding Non-GAAP Financial Measures
This earnings release includes Adjusted EBITDA, which is a supplemental measure that is not required by, or presented in accordance with, accounting principlesgenerally accepted in the United States (“GAAP”).
“Adjusted EBITDA” is defined as net income (loss) before interest expense (net of interest income), income and franchise taxes and depreciation and amortization(including amortization of capitalized subscriber acquisition costs), further adjusted to exclude the effects of certain contract sales to third parties, non-capitalizedsubscriber acquisition costs, stock based compensation, the historical results of Solar and certain unusual, non-cash, non-recurring and other items permitted incertain covenant calculations under the indentures and other agreements governing our notes and the credit agreement governing our revolving credit facility.
We believe that the presentation of Adjusted EBITDA is appropriate to provide additional information to investors about the calculation of, and compliance with,certain covenants in the indentures and other agreements governing our notes and the credit agreement governing our revolving credit facility. We caution investorsthat amounts presented in accordance with our definition of Adjusted EBITDA may not be comparable to similar measures disclosed by other issuers, because notall issuers and analysts calculate Adjusted EBITDA in the same manner.
Adjusted EBITDA is not a measurement of our financial performance under GAAP and should not be considered as an alternative to net income (loss) or any otherperformance measures derived in accordance with GAAP or as an alternative to cash flows from operating activities as a measure of our liquidity.
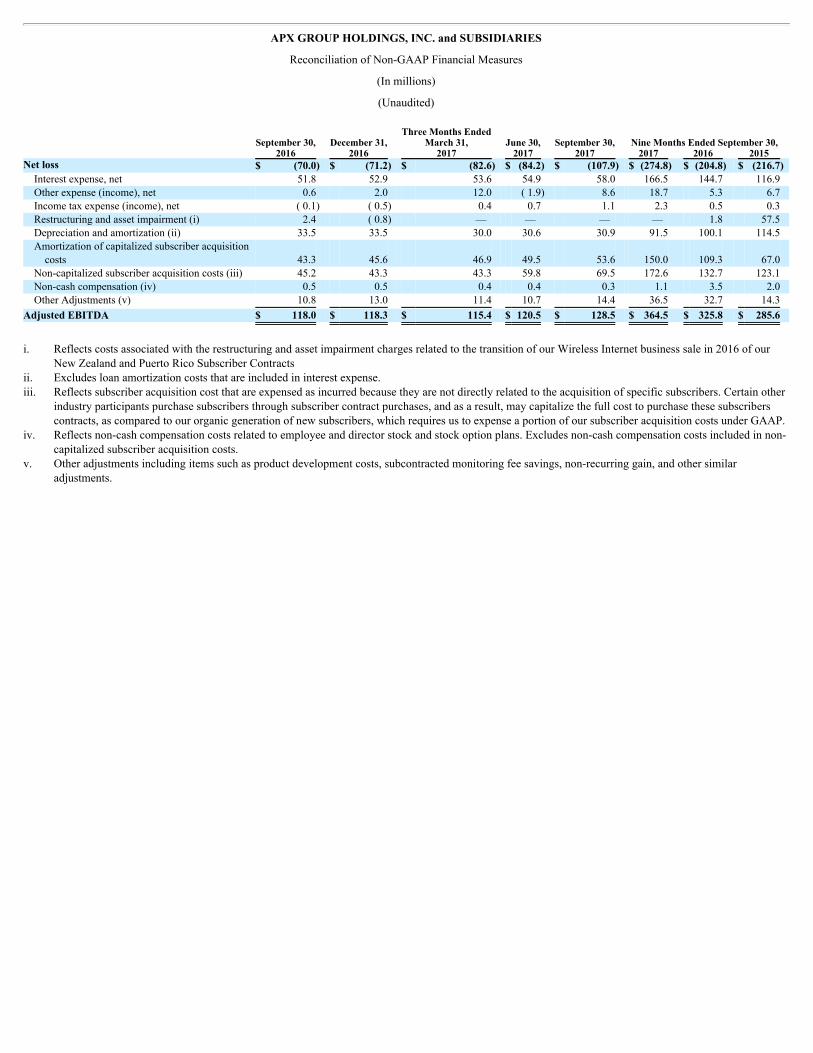
See the following table for a quantitative reconciliation of Adjusted EBITDA to Net Loss, which we believe is the most comparable financial measure calculated inaccordance with GAAP.
APX GROUP HOLDINGS, INC. and SUBSIDIARIES
Reconciliation of Non-GAAP Financial Measures
(In millions)
(Unaudited) Three Months Ended September 30, December 31, March 31, June 30, September 30, Nine Months Ended September 30, 2016 2016 2017 2017 2017 2017 2016 2015 Net loss $ (70.0) $ (71.2) $ (82.6) $ (84.2) $ (107.9) $ (274.8) $ (204.8) $ (216.7)
Interest expense, net 51.8 52.9 53.6 54.9 58.0 166.5 144.7 116.9 Other expense (income), net 0.6 2.0 12.0 ( 1.9) 8.6 18.7 5.3 6.7 Income tax expense (income), net ( 0.1) ( 0.5) 0.4 0.7 1.1 2.3 0.5 0.3 Restructuring and asset impairment (i) 2.4 ( 0.8) — — — — 1.8 57.5 Depreciation and amortization (ii) 33.5 33.5 30.0 30.6 30.9 91.5 100.1 114.5 Amortization of capitalized subscriber acquisition
costs 43.3 45.6 46.9 49.5 53.6 150.0 109.3 67.0 Non-capitalized subscriber acquisition costs (iii) 45.2 43.3 43.3 59.8 69.5 172.6 132.7 123.1 Non-cash compensation (iv) 0.5 0.5 0.4 0.4 0.3 1.1 3.5 2.0 Other Adjustments (v) 10.8 13.0 11.4 10.7 14.4 36.5 32.7 14.3
Adjusted EBITDA $ 118.0 $ 118.3 $ 115.4 $ 120.5 $ 128.5 $ 364.5 $ 325.8 $ 285.6
i. Reflects costs associated with the restructuring and asset impairment charges related to the transition of our Wireless Internet business sale in 2016 of our
New Zealand and Puerto Rico Subscriber Contractsii. Excludes loan amortization costs that are included in interest expense.iii. Reflects subscriber acquisition cost that are expensed as incurred because they are not directly related to the acquisition of specific subscribers. Certain other
industry participants purchase subscribers through subscriber contract purchases, and as a result, may capitalize the full cost to purchase these subscriberscontracts, as compared to our organic generation of new subscribers, which requires us to expense a portion of our subscriber acquisition costs under GAAP.
iv. Reflects non-cash compensation costs related to employee and director stock and stock option plans. Excludes non-cash compensation costs included in non-capitalized subscriber acquisition costs.
v. Other adjustments including items such as product development costs, subcontracted monitoring fee savings, non-recurring gain, and other similaradjustments.

Exhibit 99.2
APX Group Holdings, Inc. - Third Quarter 2017 Earnings Call and Webcast, November 14, 2017 CORPORATE PARTICIPANTS
Dale R. Gerard, Senior Vice President, Finance & Treasurer
Todd R. Pedersen, Chairman, Chief Executive Officer & Co-Founder
Mark J. Davies, Chief Financial Officer
Alexander J. Dunn, President & Director
CONFERENCE CALL PARTICIPANTS
Jeffrey Kessler, Imperial Capital
Geoffrey McKinney, Deutsche Bank AG
PRESENTATION
Operator:
Good afternoon. My name is Chantal, and I will be your conference Operator today. At this time, I would like to welcome everyone to Vivint’s Third Quarter 2017Earnings Call and Webcast. All lines have been placed on mute to prevent any background noise. After the speakers’ remarks, there will be aquestion-and-answer session. If you would like to ask a question during this time, simply press star, then the number one on your telephone keypad. If you wouldlike to withdraw your question, press the pound key. Thank you.
Dale Gerard, Senior Vice President of Finance and Treasurer, you may begin your conference.
Dale R. Gerard:
Thanks, Chantal. Good afternoon, everyone. Thanks for joining us this afternoon to discuss our results for the three-month period ended September 30, 2017.Joining me on the conference call this afternoon are Todd Pedersen, APX Chief Executive Officer; Alex Dunn, APX Group’s President; and Mark Davies, APXGroup’s Chief Financial Officer.
I would like to begin by reminding everyone that today’s discussion may contain forward—certain forward-looking statements, including with regard to theCompany’s future performance and prospects. Forward-looking statements are inherently subject to risks, uncertainties and assumptions and are not guarantees ofperformance. You should not put undue reliance on these statements. You should understand that a number of important factors, including the items discussedunder the Risk Factors in our most recent annual report on Form 10-K, such as factors—such factors may be updated from time to time in our filings with the SEC,which are available on the Investor Relations section of our website, could cause actual
1

APX Group Holdings, Inc. - Third Quarter 2017 Earnings Call and Webcast, November 14, 2017 results to differ materially from those expressed or implied in our forward-looking statements. The Company undertakes no obligations to update or revise publiclyany forward-looking statements, whether as a result of new information, future events or otherwise.
In today’s remarks, we will also refer to certain non-GAAP financial measures. Reconciliations of these non-GAAP financial measures to the most comparablemeasures calculated and presented in accordance with GAAP are available on the earnings release and the accompanying presentation or in the FinancialInformation page of the Investor Relations portion of our website.
Now I’ll turn the call over to Todd.
Todd R. Pedersen:
Thanks, Dale. As always, we’ve had a very busy year. Q3 is no different. We’ve got projects that we started to implement during the year, some investments thatwe’ve been making, new products, new sales processes. Obviously, we released a new financing structure for our customers. Some of these, I’ve got a little bitbetter view on them in Q3, so I will go through some of those. We’ve continued to make investment in service, employees, process and IT. Those are going tocontinue and we hope drive consumer satisfaction, NPS scores, easier onboarding for the consumer. With some of the new channels that we’ve launched this year,there are some definite changes to IT, and the processes that need to come along with those. Those are coming along nicely, and we’re going to see results to thatover time.
Sales is obviously something that we’ve focused on with the Flex Pay coming about this year. Obviously, there was change to how we executed the sale. The factthat we’re now two contracts, one with us, one with Citizens with a consumer, that did change how customers were sold, the whole process. We have had to focuson sales to try to get that back to par, and we’ve done that. It did take some time. I think we had mentioned we felt there was going to be some pullback inproductivity, which we did see. But we’ve come back full force and are very happy that we made this step because it’s been phenomenal.
Then, obviously, with product, we’ve been making incremental changes. No major releases of product but incremental changes to reliability and usability of theproducts that we have in the consumer’s home where we think that’s going to drive customer satisfaction, lower service costs, higher NPS scores also, so those arenecessary changes. We think we’ll see quite a bit of impact from that investment, although, I guess, investments, because there’s quite a few things we’re workingon over the next few quarters and especially the next couple of years.
Again, we’ve talked about Flex Pay quite a bit. But we think this is the single biggest decision that we’ve made in the Company as far as positive impact to help—well, one, to help the consumer. It’s a great product for the consumer, but it’s also great from the Company from a balance sheet perspective. Sixty-nine percent ofour customers this quarter, this past quarter, Q3, utilized Flex Pay, either Flex Pay or paid-in-full. We’re kind of right at what we hoped for from a percentage ofpeople utilizing that product. Eighty-eight million dollars of cash was collected at the point of sale during the quarter, which is, for us, phenomenal, astounding.We’re happy with that.
We’ve talked some about the Best Buy partnership and our general retail focus. This is a very new part to our business. We think it’s—as you do anything that’snew that hasn’t been done by the Company before, it takes a lot of effort and focus. At the end of Q3, we had 350 chain stores open. We now have 450 Best Buystores fully opened up, and we have some test stores with another retail partner that are open also in full test mode right now. We’re very bullish on this part of thebusiness, but as I said, it’s new. It’s different than what we’ve done before. We are integrated inside of the store, someone else’s store, not ours, not controlled byus. But we see that there is very big potential for the Company from a sales perspective but also branding. There’s—millions of people are coming to these storeson a daily basis, and so we see a
2

APX Group Holdings, Inc. - Third Quarter 2017 Earnings Call and Webcast, November 14, 2017 lot of upside from different areas in having this partnership, and we’re very focused on it. I will say, and you’ll probably ask anyway, that it’s going to take time forus to get to the point that we stabilize that part of the business. We have a lot of sales people that are brand new to Vivint, brand new to selling a Smart Home thathave never worked inside of a Best Buy structure that are being up and trained right now. But we feel confident that we’re going to get that accomplished. It’s justgoing to take some time and some focus.
During the holiday season, which, if you follow Best Buy at all or any retail generally, that will be a very important season for us. We’re supplementing our localBest Buy salespeople and Management with our sales leadership and experienced sales people from Vivint for about a six-week period. One, there’s quite a bit ofincreased foot traffic in the stores. We did not want to scale up and then scale back and essentially fire people post-holiday season. We really wanted to takeadvantage of the knowledge and skill set of our direct-to-home sales force in going out in the market and working side by side with our retail agents and helpingthem understand how to present the product and the service, represent Vivint, pricing and really walk the customer through the process A to Z. This is a majoradvantage that Vivint has compared to any other organization. We’d want to try to do something like roll out full nationwide retail operations, so we’re very bullishon it. But again, it’s going to take some time to get that stabilized but see a lot of future in that.
With that, I’m going to turn it over to Mark.
Mark J. Davies:
Okay. Let’s go through some of the financials here. There’s a deck that you might want to follow along with. We’re on Page six. On the left-hand side, we’ll justwalk through the quarterly results. Revenue was up $30 million to $228 million. Twenty-one million dollars of that increase came up from subs, incrementalsubscribers during the year-over-year period, and about $10 million of that is growth in the hardware sales from the Flex Pay program that we’ll continue to seecome on as revenue over the—as we evolve and sell more through the Flex Pay program.
The Adjusted EBITDA, that rose $10 million to $128 million. That’s up 9% for the year-over-year period. I would point out that there was about $7 million of BestBuy startup costs in that, which we signaled earlier this year that there would be expenses to bring up these 350 stores that we exited Q3 with, about $4 million inG&A and about $3 million in service and operations cost around G&A. If you normalize for that, then we would have had a pretty normal scaling quarter, wouldhave been about a 15% rise in EBITDA, Adjusted EBITDA.
If you look at the next page on service and subscriber costs, on the left-hand side, it shows that, year-over-year, our service cost are up about $0.45 from $14.59 to$15.04, really two drivers for that. One is we chose to invest a bit more in our call center staffing, which really drives down wait times, hold times on calls cominginto our centers. We’ve actually seen a pretty close correlation between hold times and NPS, transactional NPS, and so we’ve invested some there. About 1/3 of theraise year-over-year is due to payment processing. With the Flex Pay, we’ve had an increase in credit card payments versus ACH or debits to checking accounts.That has a higher cost of—as everyone knows—to process a credit card. That’s something that is a by-product, the negative by-product of consumer financing. Ishould point out also that, while it’s up year-over-year on service costs, it’s actually down quarter-over-quarter. It’s actually down $0.41 from $15.45 in Q2, andthat’s really volume scaling on the fixed cost portion of the service cost center.
On the right-hand side of the page, talk a little bit about subscriber acquisition costs, pretty significant move year-over-year. Last year, we had a net subscriber cost,which is total net cost of putting on a subscriber less cash that we receive at point of sale. Last year, we received about $110 at point of sale.
3

APX Group Holdings, Inc. - Third Quarter 2017 Earnings Call and Webcast, November 14, 2017 This year, we’re receiving about $997 on average across all of the payment programs, which has brought our last 12-month creation cost down by about $451 to$1,560. You can see that there’s really only about a quarter’s worth of Flex Pay run rate in this metric since its trailing 12 months. I think you’ll see that kind offlatline or come into a run rate of about $1,200 when we get a full four quarters in that metric.
I kind of—I guess I would also say that the average—and this is like Todd was saying, we think this is really pretty favorable from a customer perspective. Wedidn’t expect this, but we’re actually selling more hardware per sale than we did last year. We’re now up to about $1,500 average through all of the channels, sothat’s kind have been a positive impact to us. We’re driving, on aggregate, about a 50% margin on that hardware sale. That’s a bit of color around how Flex Pay hasimpacted acquisition costs.
Also, there’s a few changes on our per-user metric. If you look at Slide 8, from the left-hand side, we’ll start with sales. We put on 89,000 new subs during thequarter. That’s down about 5,000 year-over-year. The decline is really per-rep average productivity, sales productivity, which we believe is primarily related to thenew program of Flex Pay versus the old model where we gave hardware away for free, basically. We saw that the per-rep average started coming back towards theend of Q3, and we’re fairly confident that we will quickly come back to the pre-Flex Pay run rate on sales per sales rep.
In our inside sales, we actually had good growth year-over-year, quarter-over-quarter, so it’s easier and quicker to roll out the new product offering of Flex Paythrough our inside sales. It’s a smaller sales force. They’re all held in one physical location. It’s easier to come up to speed on that.
In terms of ARPUs, or average revenue per user, there’s a change with this new offering. We have both hardware revenue and service revenue. You see on this$48.28, we call it average service revenue per new user, which is this RNU metric. We’re averaging about 85% of our sales across all of our channels are the SmartHome with video. If you recall, we have two packages, $49.99 with Smart Home and cameras or $39.99 if you don’t take cameras. About 85% are taking cameras.Therefore, 15% are at $39.99, and that averages about $48.28. Mix is a bit different by channel.
Then if you walk over to the next set of columns, you’ll take—you’ll see the $67.42, and that includes the hardware amortization. There’s a $48.28 and about $19of hardware revenue, which is coming off the balance sheet. All of our hardware revenue is capitalized and put on as deferred revenue, and then it comes off over a15-year period according to GAAP. You see a slight decrease in average total revenue, even though we’re selling more hardware than last year, because of the waythe amortization periods work. But that’s kind of how you can track year-over-year metrics with hardware and service.
Then on the far right, this is a bit of a mix indication. Of the 100% of sales in the U.S., about 8% of our sales paid cash at point of sale. They use their own creditcards, their own checks to pay that $1,500 upfront. About 61% during Q3 paid using the Citizens program, and about 31% paid on installment contracts that wefunded.
You’ll see right below that for the mix by—over the entire nine-month period. You’ll see that, that 44% had moved up to 61% for the amount of Citizens funding.We didn’t have this fully turned on in Q1 or Q2, so there’s kind of a ramp. I think you’ll see, roughly, we’ll stabilize at the Citizens mix around 70% or so, high60% to 70%. A lot of cash flow. That’s what generated that $88 million in the quarter that Todd mentioned through either paid-in-full or Citizens.
Kind of standard metrics that we show you on this next page. Our total recurring revenue at the end of Q3, which is the contracted, high-margin, long-term revenuewas $71 million. Then there’s about a $3 million hardware amortization that’s coming off over time that’s on top of that. That $71 million is a service. Totalsubscribers moved up to 1.27 million. As we talked about, the service revenue here on a portfolio basis came down slightly to $56.07 and that’s really because wesplit the hardware and the
4
APX Group Holdings, Inc. - Third Quarter 2017 Earnings Call and Webcast, November 14, 2017 software. You’ll see, we’ll kind of asymptotically get to about $49 on the service revenue, probably a little less meaningful going forward because we have thesetwo packages now and the differentiation in packages coming in through hardware. That’s how we’ll see that metric going forward.
Finally, standard chart that we show on attrition. Attrition was pretty good for the quarter. The trailing 12 months was 11.3%. That was down from 12.9 % a yearago and even down from last quarter, which was 11.5%. We feel pretty good about customer retention and churn. We put on about 261,000 customers over the lastyear and lost about 133 on that 11.3% attrition.
I think that’s a pretty good summary of where we are on our financials as it relates to where the Company has—how the Company has moved through Q3. I guessI’ll turn this back over to Todd to give a summary of where we are in the year and then to maybe open up for Q&A.
Todd R. Pedersen:
Yes. Just some things, and kind of repeating a little bit of what I said to start with. Some of the priorities for ‘17 are things that I’ve stated already: continued focuson IT implementation to improve processes and current business and some of the new initiatives with small and big box retail. They’re super important. Obviously,interacting with sales people and customers, you want to make things as seamless as possible. We’re working towards that, and we think we’re making the rightinvestments in those areas.
Customer experience, which includes investment in product and reliability and connectivity of product. Some of the investments we’ve made are somewhat for thefuture with some of those same things in mind, and again, always focused on delivering great service to the customer, which we think will drive NPS scores andsatisfaction to our consumers.
Sales activity is another area of focus. We are intending to start to expand our direct-to-home program for—coming to this next year. We’ve opened up some—afew new recruiting offices. We think we’ll see some impact in the 2018 season on number of overall sales reps. Best Buy is a huge initiative for us. The holidayseason, there’s a lot of traffic and a lot of people coming through, a great opportunity for us to present our product and services to those consumers. We’re excitedwith the fact that we have our support of our experienced direct-to-home sales force in talking to those customers but then also doing a large amount of training forour new hires in that portion of the business.
Then one other thing I would say, just from a market positioning perspective, I think more than ever, we are confident. We’ve always been confident but just kindof seeing the competitive landscape out there. The single-point solution products are not Smart Home. They’re a Smart Home product. They’re a single-pointsolution, but they’re not solving to what we’re trying to solve to, which is making sure that people’s lives are easier and you can live in a home that’s more self-driving or autonomous, like when they speak about a car, the autonomous car. We’re trying to build the autonomous home, so that it’s seamless. It knows theconsumer. It knows what’s happening in a real-time basis.
With that, that requires everything that we do. We’ve got the technology platform. We’ve got to own it. We’ve got to control it. We have to have people involvedin the process that do the sales, do the installation. When they do the installation, they’ve got to install the right equipment, the right products, the right sensors andperipherals in the right area. We collect real data, the correct data to deliver on the self-driving or autonomous home. We already have—believe we’re ahead ofanyone else in that area. We think we’ve got an incredible game plan towards that. It’s going to require a lot of work for us to get to where we feel consumers aregoing to demand that we are from a service perspective and use case perspective in the upcoming years, but we think there’s a massive market opportunity. Thereare definite other business opportunities and partnerships that will be available if we pull this off properly, and we think we’re on track to do that. We’ve got a lotof excitement over what we’re doing currently, what we’re working on for the future. Of course, as always, we appreciate your support being on the call, just beingpart of this over the years and letting us do what we do.
5

APX Group Holdings, Inc. - Third Quarter 2017 Earnings Call and Webcast, November 14, 2017 With that, we’ll probably turn it over to Q&A.
Mark J. Davies:
All right. Chantal, we’re ready to start taking questions.
Operator:
At this time, I would like to remind everyone, in order to ask a question, press star, then number one on your telephone keypad. We will pause for just a moment tocompile the Q&A roster.
Your first question comes from Jeff Kessler with Imperial Capital. Your line is open.
Jeffrey Kessler:
Thanks. Hi, guys. How are you doing?
Todd R. Pedersen:
Great.
Jeffrey Kessler:
Quick—a couple of quick questions. One, you mentioned that the hardware component of the sale, the percentage going into hardware, has gone up as you’vebegun to feel out what the sales component will be at Best Buy. Can you talk a little bit about this? Are there any ramifications about—with regard to paybackperiod, with regard to the type of customer who’s taking this? I mean, what is this indicating to you?
Todd R. Pedersen:
Yes. Just so you know, Jeff, this is across all channels, core hardware across all channels. I think if you’ve taken a look at our pricing model previously, we hadpackages, predetermined packages for the consumer. There was some flexibility in it. They could add things. But the interesting part about this, this year is this isconsumer choice. They’re going through and picking the hardware they want with our direct-to-home sales force or the person in retail or the person over thephone, but they’re choosing—we’re not—we didn’t build a bigger package. The consumers are building a bigger package for themselves, and we think this is goingto be a trend that we could see continue. Again, a lot of it is based on consumer awareness and demand and understanding of what’s possible in the Smart Home.But it’s been a great—what’s that?
Mark J. Davies:
Jeff, this significantly reduces the time to breakeven. On the Flex Pay cash program, we’ve seen our IRR go up significantly. We’ve seen our time to breakeven godown by 2/3, so it’s a much better financial model for us.
6

APX Group Holdings, Inc. - Third Quarter 2017 Earnings Call and Webcast, November 14, 2017 Jeffrey Kessler:
Had you modeled 30% that you would—30% of the Flex that you would be financing? Or is that something—you mentioned that you expect that the Citizenspercentage is going to go up and stabilize at a higher level.
Mark J. Davies:
We modeled about 30%. I mean, we—Dale Gerard’s team did a pretty good job of working with the Heros and Citizens team to work through the underwritingalgorithms, and we knew we would have about this take rate. I guess the one thing that’s kind of a pleasant surprise that we didn’t expect, we did not expect 8% ofour customers to just pay in full. That’s certainly the most efficient way to do this from our perspective, and we haven’t, at this point, incented any sort of eithersales commission or a customer incentive to pay in full. But that’s something that we could look at in the future.
Todd R. Pedersen:
No. I mean, last year, we had tens of customers paid in full. This year, 8%, that’s pretty phenomenal. We’re pretty excited about that.
Jeffrey Kessler:
Okay. Just one final question. The Best Buy experience, if you have—obviously, when you walk into a Best Buy, you are not the only game in town when youwalk into Best Buy. There’s different games, I should say, different ways of buying into either point products or a fully integrated product like yours. Can youdescribe how you intend to—how you’re positioning yourself? What the consumer, walking into Best Buy, sees when they go into that big department, that BestBuy, depending on to keep that in business?
Alexander J. Dunn:
Yes. This is Alex, Jeff. There’s actually a picture in the presentation of what that looks like, and so we’re positioned right there in the Smart Home section. It’s aBest Buy Smart Home powered by Vivint. I think the strategy too is, is that we’re on—on our platform, we’re connected to many of the other third-party devicesthat are being sold in the store. We don’t actually think it—in most cases, have to be mutually exclusive one or the other, but that we can really help improve theexperience of many products that are sold in that section. We’re right—the picture is in the presentation, and that’s kind of how we’re positioned.
Todd R. Pedersen:
Yes. I think, Jeff, we’ll see in the future, there’ll probably be more product integrations on our platform, and now it’s hitting on the head. Those other products thatare inside of the Best Buy store, they help us and we help them. It’s not necessarily competitive. It’s beneficial. Now, someone may want just a single-pointsolution initially, and that’s fine. But we—most of the product or the segment winners, I guess, high-selling product segments, we’re integrated with those folks sowe think it’s kind of a helpful partnership more than a competitive situation.
Jeffrey Kessler:
Thank you very much.
Operator:
Again, if you would like to ask a question, press star, then the number one on your telephone keypad.
7

APX Group Holdings, Inc. - Third Quarter 2017 Earnings Call and Webcast, November 14, 2017 Your next question comes from Geoffrey McKinney with Deutsche Bank. Your line is open.
Geoffrey McKinney:
Hi. Thanks for the question. I guess just one question on the revolving credit facility. You increased the amount in the—during the quarter. In the context of theFlex Pay working to bring down capital intensity, can you kind of walk through the reasoning behind that increase? What drove that? What’s the incrementalamount and what potentially the proceeds for that could be utilized for?
Mark J. Davies:
It was just a strategy to improve the liquidity of the business going forward. We obviously believe that our growth trajectory in terms of cash usage with Flex Payand Citizens financing is significantly less per sub than we’ve had in the past. We do think that we will see an accelerated growth going forward with all of thischannel expansion and that we may have needs for growth or investments going forward. But there is no specific use of proceeds right now for that incremental. Itwasn’t—it went from $289 million to $324 million roughly.
Todd R. Pedersen:
Yes. Which then, again, one of those institutions was dropping out. As of right now, I think we’re back to roughly about $300 million in that revolving creditfacility.
Geoffrey McKinney:
Okay. That helped. I guess in kind of understanding the comments around that the expectation for Flex Pay, understand the benefits of capital upfront for you guys.But you’re potentially looking to utilize some of that benefit to accelerate customer acquisition or subscriber growth. Is that the right way to think about this?Maybe we see the business grow at a greater rate than previously and kind of maintain a similar cash flow usage dynamic.
Mark J. Davies:
Yes. I think so. For example, I think what you will continue to see is the same economics for the same unit of one dynamics (phon) that we see today. I don’t thinkwe plan on putting on less profitable or less secure customers. I think what you will see is us increase the aperture around sales, so direct-to-home sales people.We’ve been relatively stable at about 2,500 sales reps making sales during the season. We’re actually investing in recruiting right now, recruiting centersthroughout the U.S., to add more sales people. I think you’ll see our direct to channel—direct-to-home channel increase. But that’s probably the best use of fundsthat I—If I were modeling this, it would be to either use less debt or put on more customers.
Geoffrey McKinney:
Okay. I guess, if you had a choice between the two, which would you pick?
Mark J. Davies:
We would pick more customers at this point, the breakeven, the return, the NVD IRR, with as much cash as we’re collecting upfront and the margins that we enjoyon that $48-plus service margin or service revenue is a great investment. We can’t think of a better investment, and I don’t think we would look to be paying down.We certainly aren’t thinking about a dividend. This is to give us a bigger footprint and a larger space in the market.
8

APX Group Holdings, Inc. - Third Quarter 2017 Earnings Call and Webcast, November 14, 2017 Geoffrey McKinney:
Okay. That’s helpful. Thank you, guys.
Todd R. Pedersen:
Thank you.
Operator:
Again, if you would like to ask a question, press star, then the number one on your telephone keypad.
There are no further questions at this time. I will now turn the call back over to the presenter.
Todd R. Pedersen:
Again, we appreciate everyone getting on the call. Thanks for those two questions, thought we were going to get at least three. But anyway, we look forward tohaving a great quarter, and we’ll get back to everyone in about three months. But again, thank you.
Mark J. Davies:
Thanks.
Operator:
This concludes this conference call. You may now disconnect.
9

APX Group Holdings, Inc. 3rd Quarter 2017 Results November 14, 2017

APX Group Holdings, Inc. (the ”Company”, “Vivint”, “we”, “our”, or “us”) obtained the industry, market and competitive position data included in this presentation from its estimates and research as well as from industry publications, surveys and studies conducted by third parties. Industry publications studies and surveys generally state that the information contained therein has been obtained from sources believed to be reliable but there can be no assurance as to the accuracy or completeness of such information. While APX Group Holdings, Inc. believes that each of the publications, studies and surveys is reliable, we have not independently verified industry, market and competitive position data from third-party sources. While we believe our internal business research is reliable and the market definitions are appropriate, neither such research nor these definitions have been verified by any independent sources. Accordingly, you should not place undue weight on the industry and market share data in this presentation. This presentation includes forward-looking statements as defined by the Private Securities Litigation Reform Act of 1995, including but not limited to, statements related to the performance of our business, our financial results, our liquidity and capital resources, our plans, strategies and prospects, both business and financial and other non-historical statements. Forward-looking statements convey the Company’s current expectations or forecasts of future events. All statements contained in this presentation other than statements of historical fact are forward-looking statements. These statements are based on the beliefs and assumptions of our management. Although we believe that our plans, intentions and expectations reflected in or suggested by these forward-looking statements are reasonable, we cannot assure you that we will achieve or realize these plans, intentions or expectations. Forward-looking statements are inherently subject to risks, uncertainties and assumptions. These statements may be preceded by, followed by or include the words “believes,” “estimates,” “expects,” “projects,” “forecasts,” “may,” “will,” “should,” “seeks,”“plans,” “scheduled,” “anticipates” or “intends” or similar expressions. Forward-looking statements are not guarantees of performance. You should not put undue reliance on these statements which speak only as of this date hereof. You should understand that the following important factors, in addition to those discussed in “Risk Factors” in our most recent annual report on Form 10K, and other reports filed with the Securities Exchange Commission (“SEC”) including our quarterly report on Form 10-Q for the quarterly period ended September 30,2017, could affect our future results and could cause those results or other outcomes to differ materially from those expressed or implied in our forward-looking statements: (1) risks of the smart home industry and security, including risks of and publicity surrounding the sales, subscriber origination and retention process; (2) the highly competitive nature of the smart home and security industry and product introductions and promotional activity by our competitors; (3) litigation, complaints or adverse publicity; (4) the impact of changes in consumer spending patterns, consumer preferences, local, regional, and national economic conditions, crime, weather, demographic trends and employee availability; (5) adverse publicity and product liability claims; (6) increases and/or decreases in utility and other energy costs, increased costs related to utility or governmental requirements; (7) cost increases or shortages in smart home and security technology products or components; and (8) the introduction of unsuccessful new products and services; (9) privacy and data protection laws, privacy or data breaches, or the loss of data; and (10) the impact to our business, results of operations, financial condition, regulatory compliance and customer experience of the Vivint Flex Pay plan and the Best Buy Smart Home powered by Vivint Program. In addition, the origination and retention of new subscribers will depend on various factors, including, but not limited to, market availability, subscriber interest, the availability of suitable components, the negotiation of acceptable contract terms with subscribers, local permitting,licensing and regulatory compliance, and our ability to manage anticipated expansion and to hire, train and retain personnel, the financial viability of subscribers and general economic conditions. These and other factors that could cause actual results to differ from those implied by the forward-looking statements in this presentation are more fully described in the “Risk Factors” section of our most recent annual report on Form 10-K, as such factors may be updated from time to time in our periodic filings with the SEC. These risk factors should not be construed as exhaustive. We disclaim any obligations to and do not intend to update the above list or to announce publicly the results of any revisions to any of the forward-looking statements to reflect future events or developments. All forward-looking statements attributable to us or persons acting on our behalf are expressly qualified in their entirety by the foregoing cautionary statements. We undertake no obligations to update or revise publicly any forward-looking statements, whether a result of new information, future events, or otherwise. forward-looking statements

non-GAAP financial measures This presentation includes Adjusted EBITDA which is a supplemental measure that is not required by, or presented in accordance with, accounting principles generally accepted in the United States (“GAAP”). Adjusted EBITDA is not a measurement of our financial performance under GAAP and should not be considered as an alternative to net income or any other measure derived in accordance with GAAP or as an alternative to cash flows from operating activities as a measure of our liquidity. We believe the presentation of Adjusted EBITDA is appropriate to provide useful information about the flexibility we have under our covenants to investors, lenders, financial analysts and rating agencies since these groups have historically used EBITDA-related measures in our industry, along with other measures, to estimate the value of a company, to make informed investment decisions, and to evaluate a company’s ability to meet its debt service requirements. Adjusted EBITDA eliminates the effect of non-cash depreciation of tangible assets and amortization of intangible assets, much of which results from acquisitions accounted for under the purchase method of accounting. Adjusted EBITDA also eliminates the effects of interest rates and changes in capitalization which management believes may not necessarily be indicative of a company’s underlying operating performance. Adjusted EBITDA is also used by us to measure covenant compliance under the indenture governing our senior secured notes, the indenture governing our senior unsecured notes and the credit agreement governing our revolving credit facility. We caution investors that amounts presented in accordance with our definition of Adjusted EBITDA may not be comparable to similar measures disclosed by other issuers, because not all issuers and analysts calculate Adjusted EBITDA in the same manner. See Annex A of this presentation for a reconciliation of Adjusted EBITDA to net loss for the Company, which we believe is the most closely comparable financial measure calculated in accordance with GAAP. Adjusted EBITDA should be considered in addition toand not as a substitute for, or superior to, financial measures presented in accordance with GAAP.

participants Todd Pedersen Chief Executive Officer Alex Dunn President Mark Davies Chief Financial Officer Dale R. Gerard SVP, Finance & Treasurer

third quarter 2017 update Vivint Flex Pay Positive customer adoption… ~69% of new subscribers paid for the purchase of products and installation through consumer finance and paid-in-full options ~$88 million of cash collected at point of sale during the quarter Best Buy Partnership 353 stores at Q3 exit… currently fully deployed at 450 stores Supplementing holiday selling season with direct to home sales reps and installation techs Operational investments are ramping and taking shape Service: Employees, process, and IT to drive customer service and improving NPS Sales: Working through the sales productivity impact from the transition to Vivint Flex Pay in direct to home and inside sales channels Product: Deploying incremental resources to both quality and targeted technology development… system reliability, AI, video and connectivity

revenue and adjusted EBITDA(1) (1) A reconciliation of Adjusted EBITDA to GAAP Net Loss is included in Annex A of this presentation Adjusted EBITDA Three Month Period ended September 30, Revenue ($ in Millions) Growth: 17.6% 15.3% Growth: 14.9% 8.9% Revenue Adjusted EBITDA Nine Month Period ended September 30, ($ in Millions) Growth: 15.6% 16.8% Growth: 14.1% 11.9%

service and subscriber acquisition costs(1) Net Subscriber Acquisition Costs LTM Ended September 30, Net Service Costs and Margin per Subscriber Quarter Ended September 30, (1) Excludes wireless internet business and pilot sales channel initiatives Net Service Costs Net Service Margin 74.5% 73.2% Focused investment in customer care and service support to drive improved products and customer experience Impact of Vivint Flex Pay ~$997 Upfront Revenue per subscriber collected in 3Q17 vs $110 in 3Q16 Product cost reductions, largely offset by higher installation and sales support costs

Three-Month Period ended September 30, new smart home subscriber originations (1) Net New Subscribers 88,406 94,272 89,019 US Flex Pay Mix Nine-Month Period ended September 30, 203,400 237,436 221,148 AMRNU AMSRNU (1) Excludes wireless internet business and other pilot sales channel initiatives. Canada: 100% RIC Canada: 100% RIC

smart home subscriber portfolio data(1) Excludes wireless internet business and pilot sales channel initiatives and data is stated as of the end of each period As of September 30, Total Subscribers Growth: 16.9% 9.0% ($ in Millions) Total MSR Growth: 12.5% 11.2% AMSRU Growth: 3.9% (1.9%)

11.3% Annualized Attrition 12.0% Annualized Attrition 12.9% Annualized Attrition subscriber account attrition(1) ~ 6% of portfolio reaching initial end of contract term in 2017 2013 42-mo contracts (4Q16 – 1Q17) 2014 42-mo contracts (4Q17 – 1Q18) (1) Excludes wireless internet business and pilot sales channel initiatives LTM Quarterly Subscriber Account Attrition 160 bps

Management’s focus… building toward the future Priorities for the remainder of 2017 Execute on changes and improvements made in 2017… flex pay, large-format retail Vivint customer experience… technology, reliability and service System and process improvements… people, process, systems Q4 Sales activities Best Buy holiday selling season Recruiting and retention of DTH, including opening of recruiting centers Expansion of small retail format pilots Vivint’s market positioning Continue to believe that technology combined with service is the winning model in smart home Point products and voice interfaces do not overcome the barriers to smart home adoption Vision of a self-driving, diffentiated smart home experience is predicated on an integrated platform, physical presence in the home, and large number of strategically placed sensors and devices

Q&A

APX Group Holdings, Inc. Quarters Ended September 30, 2017 and 2016 Consolidated Financial Statements

condensed consolidated balance sheets APX Group Holdings, Inc. and Subsidiaries (In thousands) (Unaudited)

consolidated statements of operations APX Group Holdings, Inc. and Subsidiaries (In thousands) (Unaudited)

summary of consolidated statements of cash flows APX Group Holdings, Inc. and Subsidiaries (In thousands) (Unaudited)

APX Group Holdings, Inc. Annex A

reconciliation of non-GAAP financial measures – APX Group ($ in Millions) Reflects costs associated with the restructuring charges and asset impairments related to the transition of our Wireless Internet business and the sale in 2016 of our New Zealand and Puerto Rico Subscriber Contracts Excludes loan amortization costs that are included in interest expense Reflects subscriber acquisition costs that are expensed as incurred because they are not directly related to the acquisition of specific subscribers. Certain other industry participants purchase subscribers through subscriber contract purchases, and as a result, may capitalize the full cost to purchase these subscribers contracts, as compared to our organic generation of new subscribers, which requires us to expense a portion of our subscriber acquisition costs under GAAP. Reflects non-cash compensation costs related to employee and director stock and stock option plans Other adjustments including items such as product development costs, subcontracted monitoring fee savings, non-recurring gain, and other similar adjustments

certain definitions Total Subscribers - the aggregate number of active smart home and security subscribers at the end of a given period Monthly Service Revenue - the aggregate, contracted recurring monthly Service billings to our smart home and security subscribers as of the end of a given period. This metric reflects billings on our Services and excludes monthly billings for the purchases of our Products. Average MSR per User - MSR divided by Total Subscribers. Attrition rate - the aggregate number of canceled smart home and security subscribers during the prior twelve month period divided by the monthly weighted average number of Total Subscribers for such period. Subscribers are considered canceled when they terminate in accordance with the terms of their contract, are terminated by us or if payment from such subscribers is deemed uncollectible (when at least four monthly billings become past due). If a sale of a service contract to third parties occurs, or a subscriber relocates but continues their service, we do not consider this as a cancellation. If a subscriber transfers their service contract to a new subscriber, we do not consider this as a cancellation. Net Service Cost per User - the average monthly service costs for the period, including monitoring, customer service, field service and other service support costs, less total non-recurring Product and Service billings for the period divided by average monthly Total Subscribers for the same period. Net Service Margin Percentage - the AMSRU for the period less Net Service Cost per User, divided by the AMSRU for the period. New subscribers - the aggregate number of net new smart home and security subscribers originated during a given period. This metric excludes new subscribers acquired by the transfer of a service contract from one subscriber to another. Average monthly service revenue per new user (“AMSRNU”) – Total MSR from New Subscribers divided by New Subscribers during a given period. Average monthly revenue per new user (“AMRNU”) - AMSRNU plus the average monthly deferred and expected interest revenue recognized during the first year after originationassociated with our Product sales to New Subscribers during a given period. Net Subscriber Acquisition Cost - the total capitalized and expensed costs to acquire new smart home and security subscribers for a given period, divided by Total New Subscribers added for the period. These costs include commissions, equipment, installation, marketing and other sales support costs, less cash received at contract origination from Product sales, activation and installation fees.