A/Prof Nikki Turner, School of Population Health, University of Auckland Sept 2013
42
A/Prof Nikki Turner, School of Population Health, University of Auckland Sept 2013
description
A/Prof Nikki Turner, School of Population Health, University of Auckland Sept 2013. Why does childhood poverty matter?. Poverty in childhood affects their whole life affecting every health outcome educational outcome future jobs and income. Poverty leads to poor health. - PowerPoint PPT Presentation
Transcript of A/Prof Nikki Turner, School of Population Health, University of Auckland Sept 2013
A/Prof Nikki Turner, School of Population Health, University of AucklandSept 2013
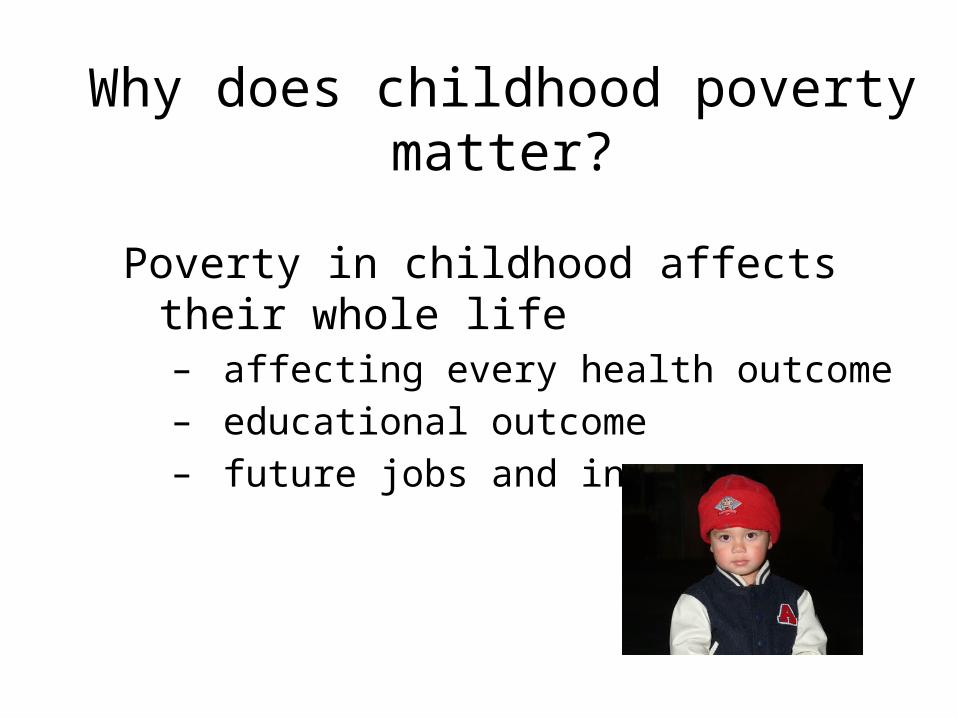
Why does childhood poverty matter?
Poverty in childhood affects their whole life– affecting every health outcome– educational outcome– future jobs and income
Poverty leads to poor health
"Income is the single most important
determinant of health. There is a persistent correlation worldwide
between low income and poor health.“
The National Health Committee in its report to the MOH in June 1998
“Determinants of Health in New Zealand: Action to Improve Health"
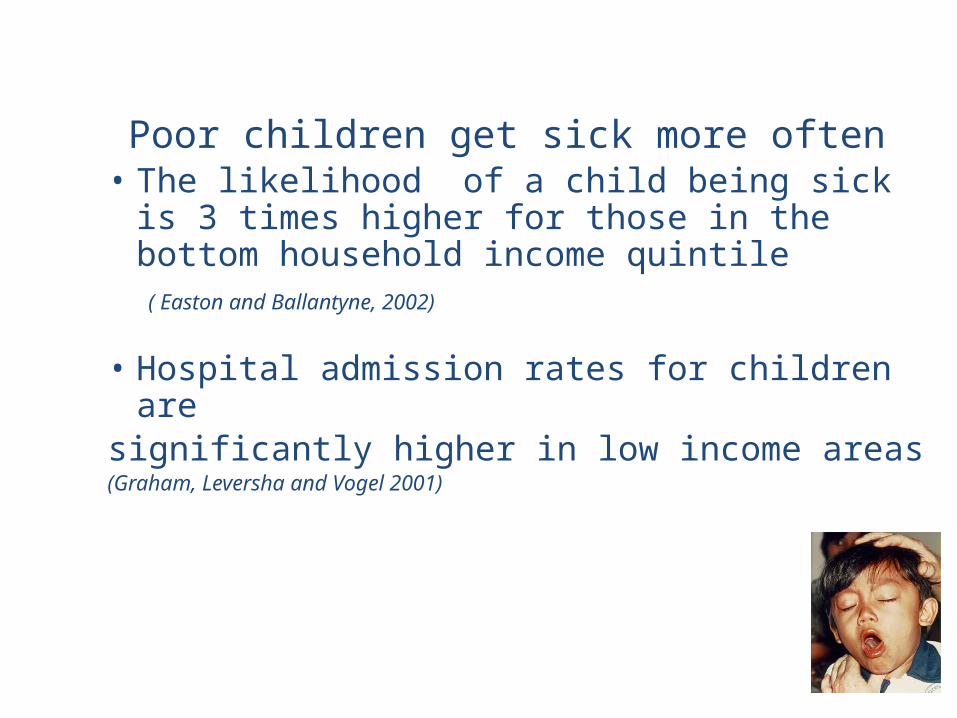
Poor children get sick more often• The likelihood of a child being sick is 3 times
higher for those in the bottom household income quintile
( Easton and Ballantyne, 2002)
• Hospital admission rates for children are significantly higher in low income areas (Graham, Leversha and Vogel 2001)
The reality?

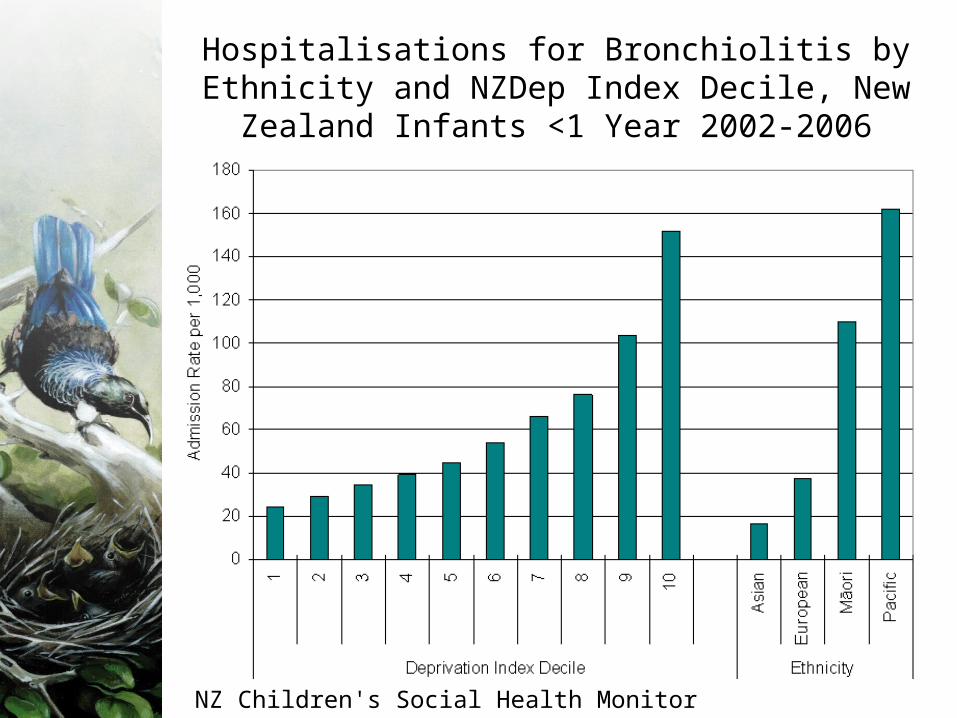
Hospitalisations for Bronchiolitis by Ethnicity and NZDep Index Decile, New Zealand Infants <1 Year 2002-2006
NZ Children's Social Health Monitor 2012

Hospitalisation for Preventable Serious Bacterial Infections and Respiratory Diseases, Risk by ‘Deprivation’,
0-14 years, 2002-2006
Source: Craig E, et al. NZCYES: Indicator Handbook. 2007.
Cause of Hospital Admission Least deprived (NZDep1)
Most deprived (NZDep10)
Meningococcal disease# 1 4.93 Rheumatic fever 1 28.65* Serious skin infection 1 5.16 Tuberculosis 1 5.06* Gastroenteritis 1 2.00 Bronchiolitis## 1 6.18 Pertussis 1 3.70* Pneumonia 1 4.47 Bronchiectasis 1 15.58 Asthma 1 3.35 #0-24yr ##<1yr *NZDep9-10
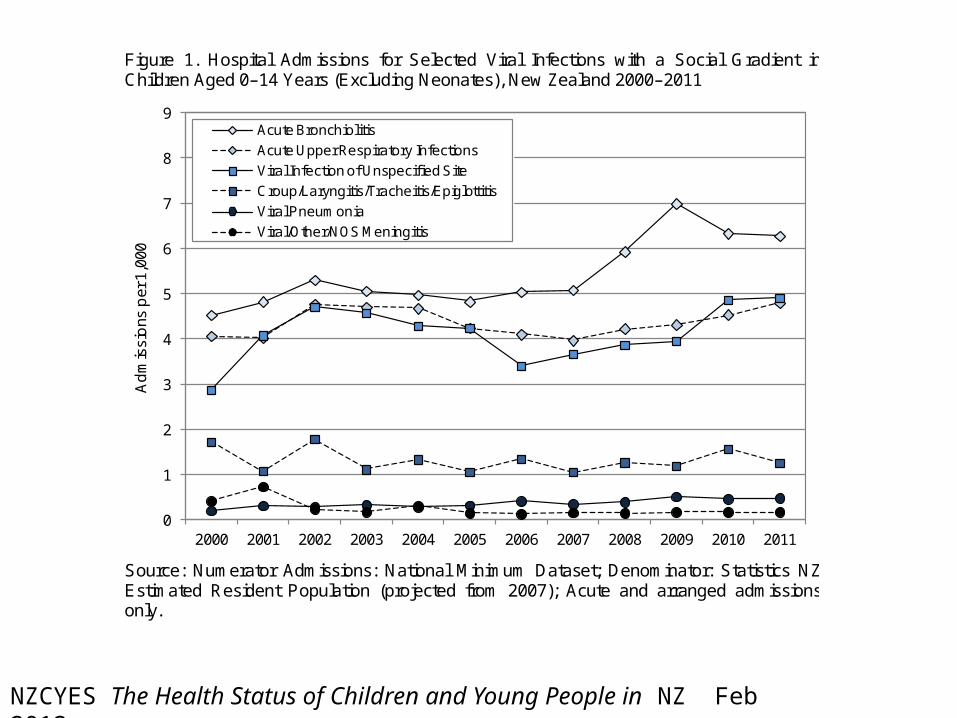
Figure 1. Hospital Admissions for Selected Viral Infections with a Social Gradient in Children Aged 0–14 Years (Excluding Neonates), New Zealand 2000–2011
0
1
2
3
4
5
6
7
8
9
2000 2001 2002 2003 2004 2005 2006 2007 2008 2009 2010 2011
Adm
issi
ons
per 1
,000
Acute BronchiolitisAcute Upper Respiratory InfectionsViral Infection of Unspecified SiteCroup/Laryngitis/Tracheitis/EpiglottitisViral PneumoniaViral/Other/NOS Meningitis
Source: Numerator Admissions: National Minimum Dataset; Denominator: Statistics NZ Estimated Resident Population (projected from 2007); Acute and arranged admissions only.
NZCYES The Health Status of Children and Young People in NZ Feb 2013,
Primary Diagnosis
New Zealand
Number: Total 2007−2011
Number: Annual
Average
Rate per 1,000 % of Total
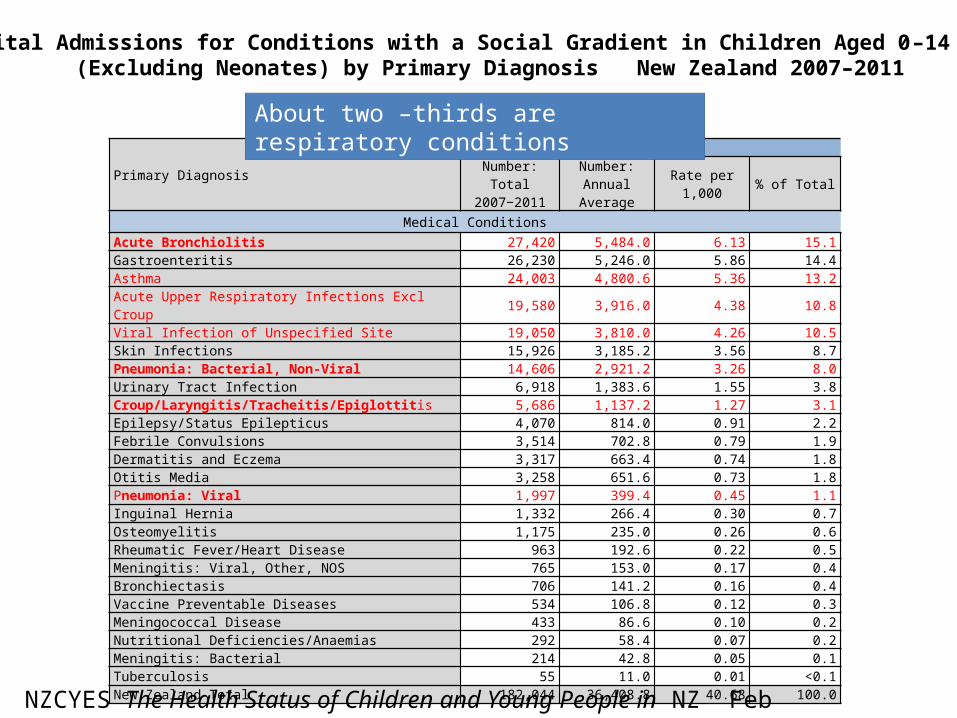
Medical ConditionsAcute Bronchiolitis 27,420 5,484.0 6.13 15.1Gastroenteritis 26,230 5,246.0 5.86 14.4Asthma 24,003 4,800.6 5.36 13.2Acute Upper Respiratory Infections Excl Croup 19,580 3,916.0 4.38 10.8Viral Infection of Unspecified Site 19,050 3,810.0 4.26 10.5Skin Infections 15,926 3,185.2 3.56 8.7Pneumonia: Bacterial, Non-Viral 14,606 2,921.2 3.26 8.0Urinary Tract Infection 6,918 1,383.6 1.55 3.8Croup/Laryngitis/Tracheitis/Epiglottitis 5,686 1,137.2 1.27 3.1Epilepsy/Status Epilepticus 4,070 814.0 0.91 2.2Febrile Convulsions 3,514 702.8 0.79 1.9Dermatitis and Eczema 3,317 663.4 0.74 1.8Otitis Media 3,258 651.6 0.73 1.8Pneumonia: Viral 1,997 399.4 0.45 1.1Inguinal Hernia 1,332 266.4 0.30 0.7Osteomyelitis 1,175 235.0 0.26 0.6Rheumatic Fever/Heart Disease 963 192.6 0.22 0.5Meningitis: Viral, Other, NOS 765 153.0 0.17 0.4Bronchiectasis 706 141.2 0.16 0.4Vaccine Preventable Diseases 534 106.8 0.12 0.3Meningococcal Disease 433 86.6 0.10 0.2Nutritional Deficiencies/Anaemias 292 58.4 0.07 0.2Meningitis: Bacterial 214 42.8 0.05 0.1Tuberculosis 55 11.0 0.01 <0.1New Zealand Total 182,044 36,408.8 40.68 100.0
Hospital Admissions for Conditions with a Social Gradient in Children Aged 0–14 Years (Excluding Neonates) by Primary Diagnosis New Zealand 2007–2011
About two –thirds are respiratory conditions
NZCYES The Health Status of Children and Young People in NZ Feb 2013,

But why are they getting sick…..


“If you have five bucks left to feed the family with at the end of the week, you’ll go and get $4
worth of chips and a loaf of Rivermill bread, not fruit and vegetables.”
NZ Teacher 2005

Juliette

Juliette’ s background
• Had first vaccination event, none since• Mum – solo parent, 17 years old
– Hard background……..• Dad – awol, drug and alcohol problems• Home
– Aunty’s house– Currently 16 in the house- smokers– Moved 4 times since birth

Why does she get sick?
Spread of the organism
Weaker immune response
Reduced access to health care services

Jack is a 9 year old boy well know to the general practice. He has come in very many times to the GP and local A & M with a range of health issues: asthma, eczema, chest infections, skin infections, injuries.
Since birth he has had TEN hospital admissions: bronchiolitis (baby x2) asthma (x3), broken leg, head injury, cellulitis (x2), dental abscess

Jack is overweight, doing poorly at school, described by the school as having a learning difficulty. Furthermore the school are concerned because he is a playground bully. His father is in jail. He has a brother and a sister and another died as an infant. His Mum is 29 with a chronic medical condition. She has been in and out of a lot of jobs, never lasts more than a few months

Jack’s future……
• Poor health lifelong• Obesity• Drug and alcohol abuse• School failure, limited occupational options• Criminality• Broken relationships• Shorter life expectancy
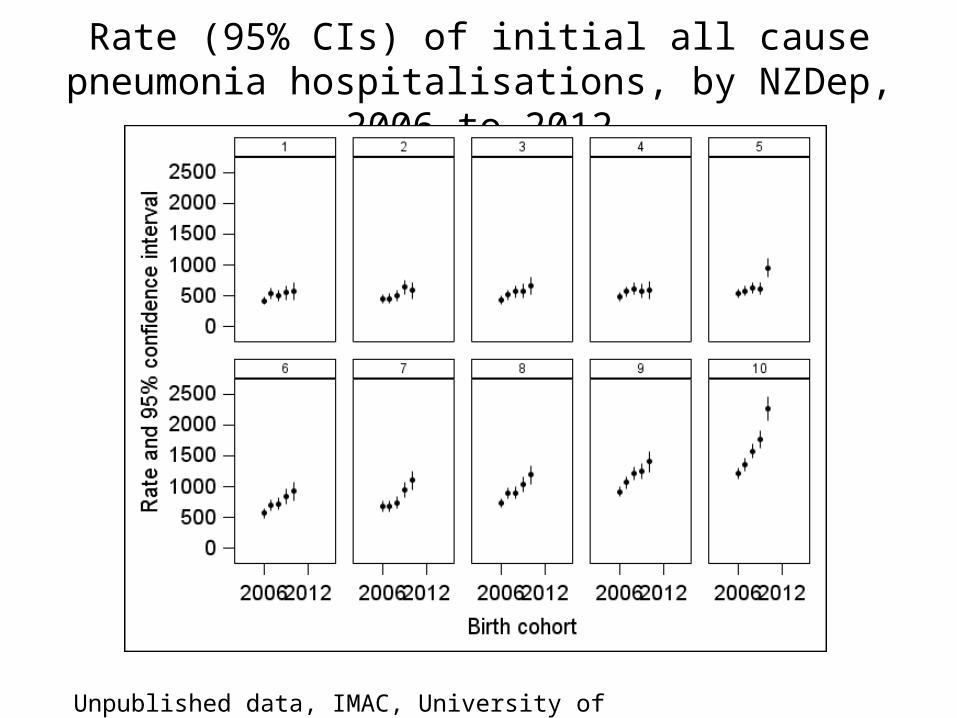
Rate (95% CIs) of initial all cause pneumonia hospitalisations, by NZDep, 2006 to 2012
Unpublished data, IMAC, University of Auckland Sept 2013

Rate (95% CIs) of initial all cause pneumonia hospitalisations, by ethnicity, 2006 to 2012
Unpublished data, IMAC, University of Auckland Sept 2013


Who is in most hardship in NZ?% in severe/significant hardship 2008
Children 0 – 17 years 2318 – 24 years 1525 – 44 years 1645-64 years 1365 + years 4Overall 15
Adapted from: Perry B Non-income measures of material wellbeing and hardship: results from the 2008 New Zealand Living Standards Survey MSD Wellington Dec 2009. p, 22
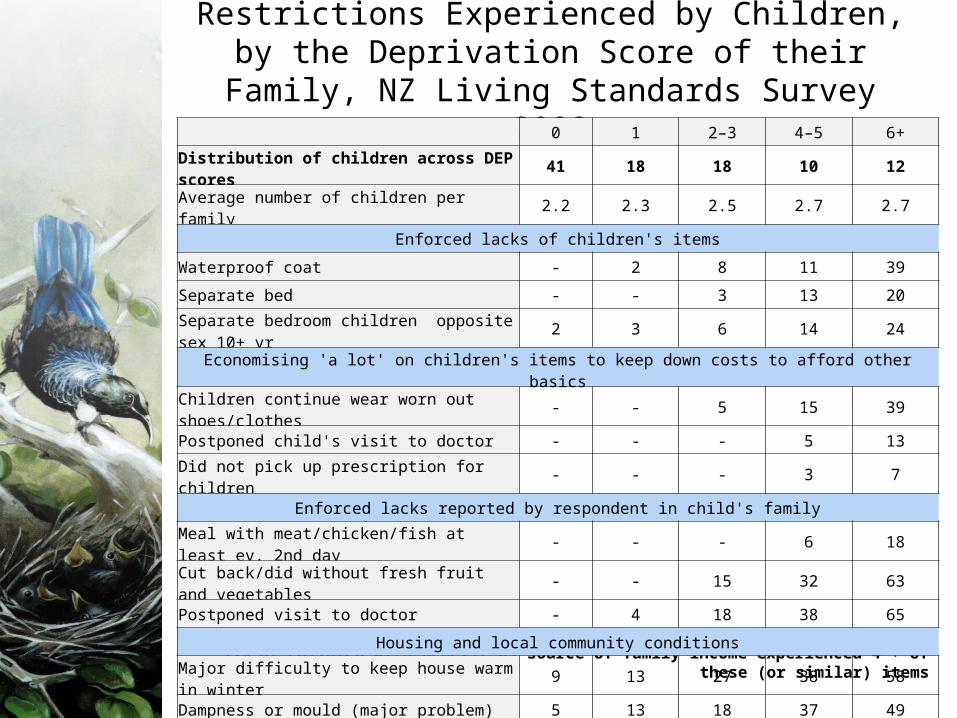
Restrictions Experienced by Children, by the Deprivation Score of their Family, NZ Living Standards Survey 2008
59% of children with Benefit as source of family income experienced 4 + of these (or similar) items
0 1 2–3 4–5 6+
Distribution of children across DEP scores 41 18 18 10 12Average number of children per family 2.2 2.3 2.5 2.7 2.7
Enforced lacks of children's items
Waterproof coat - 2 8 11 39
Separate bed - - 3 13 20Separate bedroom children opposite sex 10+ yr 2 3 6 14 24
Economising 'a lot' on children's items to keep down costs to afford other basics
Children continue wear worn out shoes/clothes - - 5 15 39
Postponed child's visit to doctor - - - 5 13
Did not pick up prescription for children - - - 3 7
Enforced lacks reported by respondent in child's family
Meal with meat/chicken/fish at least ev. 2nd day - - - 6 18
Cut back/did without fresh fruit and vegetables - - 15 32 63
Postponed visit to doctor - 4 18 38 65
Housing and local community conditions
Major difficulty to keep house warm in winter 9 13 27 38 58
Dampness or mould (major problem) 5 13 18 37 49
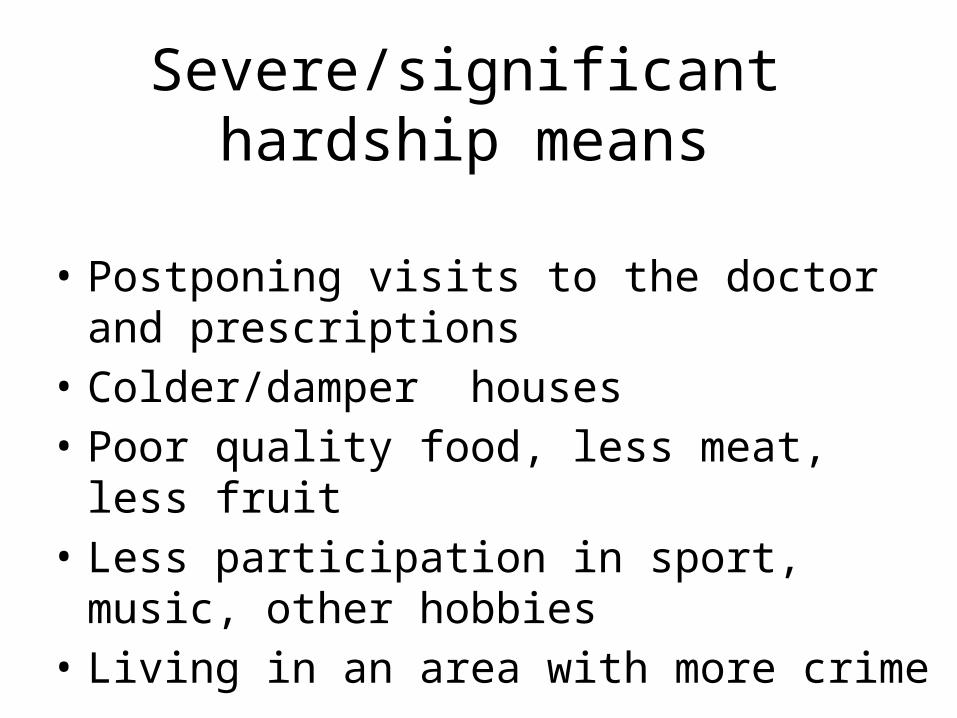
Severe/significant hardship means
• Postponing visits to the doctor and prescriptions• Colder/damper houses• Poor quality food, less meat, less fruit • Less participation in sport, music, other hobbies• Living in an area with more crime


This is not inevitable
We have a choice as a country
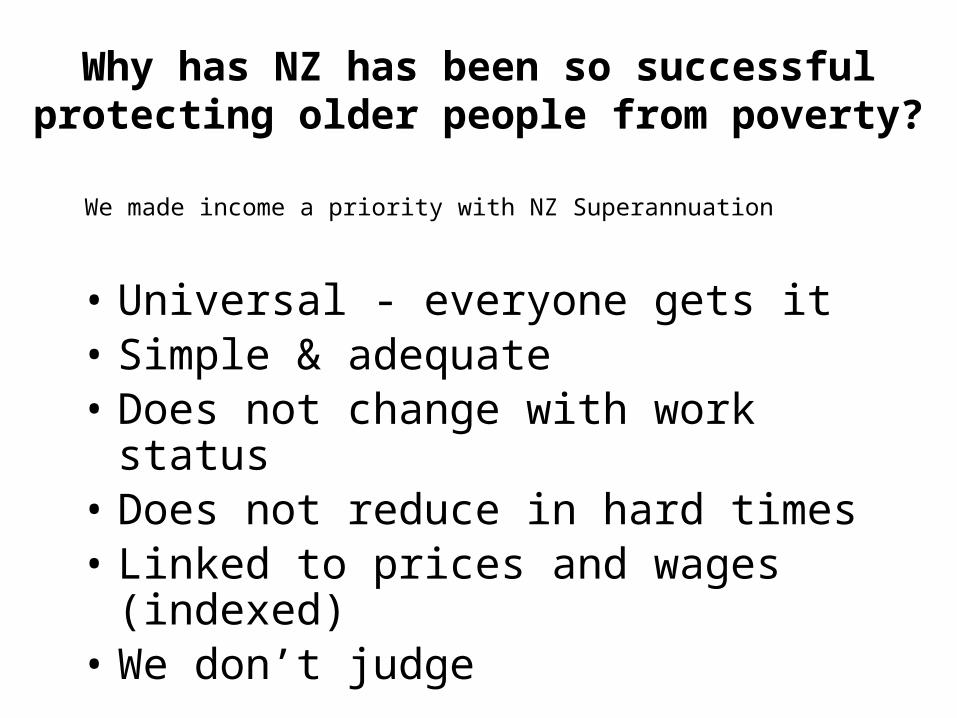
Why has NZ has been so successful protecting older people from poverty?
• Universal - everyone gets it• Simple & adequate• Does not change with work status• Does not reduce in hard times• Linked to prices and wages (indexed)• We don’t judge
We made income a priority with NZ Superannuation

• Awareness• Empathy• Practical help• Advocacy

1. Low family incomes, inadequate child assistance and poorly targeted resources
2. Low take-up rates for many child-related benefits3. Relatively low employment amongst sole parents4. A poorly designed child support system5. Poor quality, unaffordable, overcrowded houses6. Inequitable access to many social services, including health7. Poorly integrated information and service delivery systems8. No plan, no authoritative child poverty measures, no targets
The Nature of the Problem?
OCC EAG Report 2012

Bryan Perry, MSD, March 2012
NZ child poverty trends, - After housing costs incomes
0
10
20
30
40
50
1980 1985 1990 1995 2000 2005 2010
HES year
Prop
ortio
n of
chi
ldre
n in
low
-inco
me
HH
s (%
)
60% 98 CV
60% 07 CV

‘Multiple bee stings’
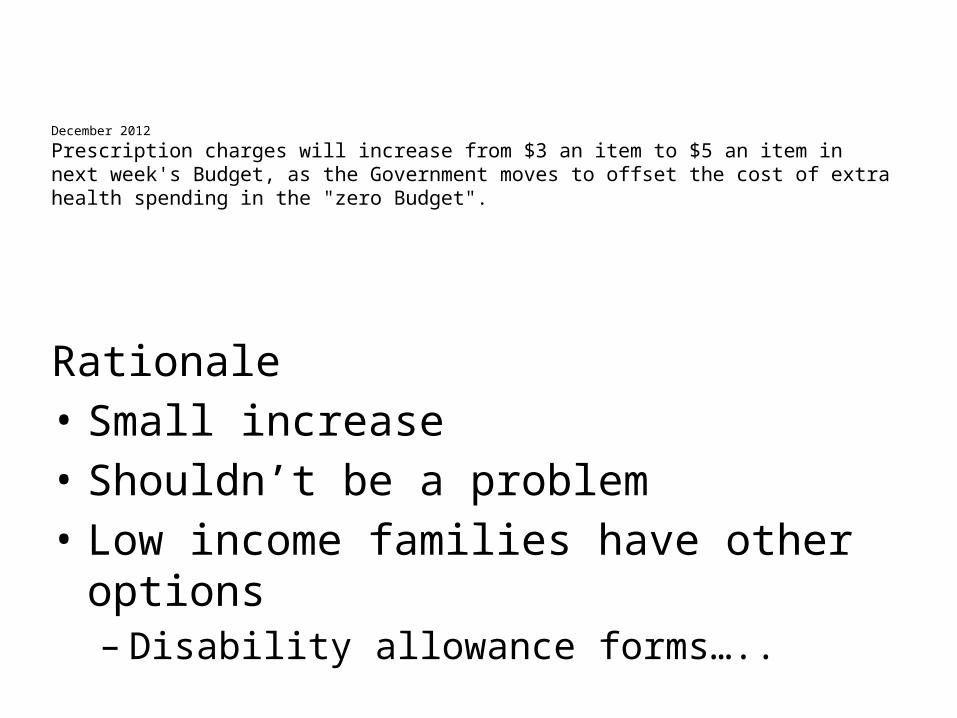
December 2012
Prescription charges will increase from $3 an item to $5 an item in next week's Budget, as the Government moves to offset the cost of extra health spending in the "zero Budget".
Rationale• Small increase• Shouldn’t be a problem• Low income families have other options
– Disability allowance forms…..

URGENCY to ACT
"Many things we need can wait. The child cannot. Now is the time his bones are being formed; his blood is being made; his mind is being developed. To him we cannot say tomorrow. His name is today.”
Gabriela Mistral

Wicked problems…..messy solutions
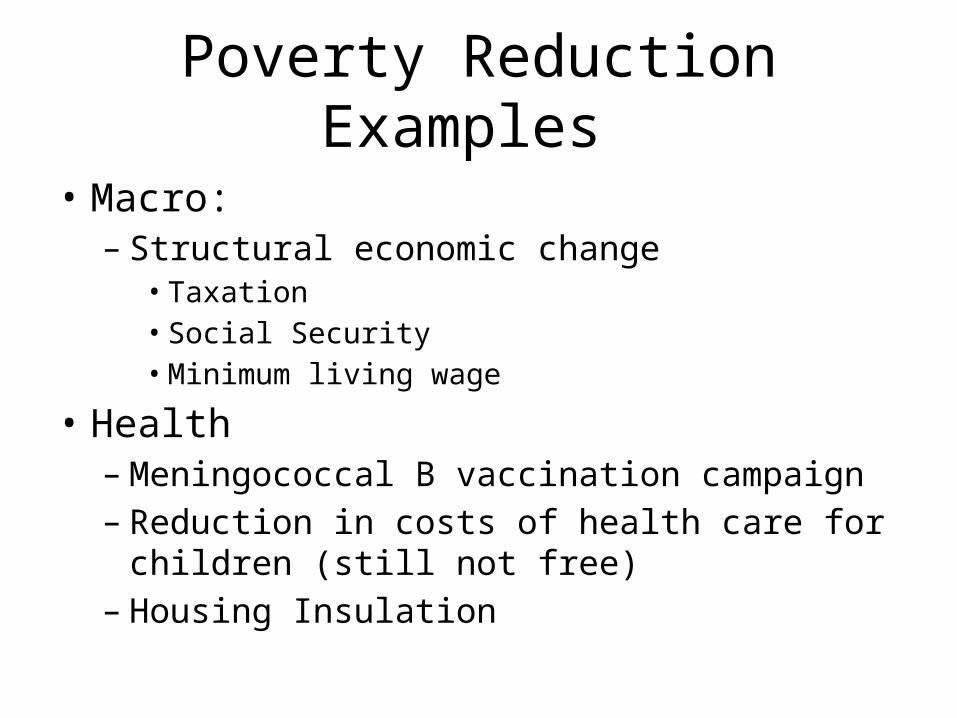
Poverty Reduction Examples
• Macro:– Structural economic change
• Taxation• Social Security• Minimum living wage
• Health– Meningococcal B vaccination campaign– Reduction in costs of health care for children (still not
free)– Housing Insulation
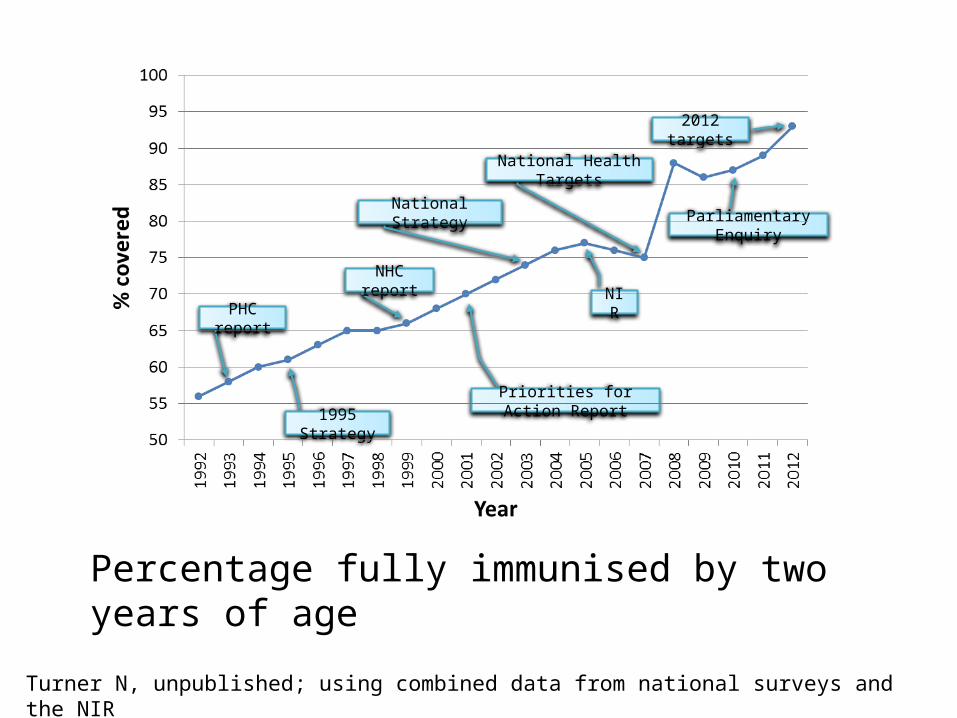
1995 Strategy
Priorities for Action Report
National Strategy Parliamentary Enquiry
National Health Targets
2012 targets
NIR
NHC report
PHC report
Turner N, unpublished; using combined data from national surveys and the NIR
Percentage fully immunised by two years of age
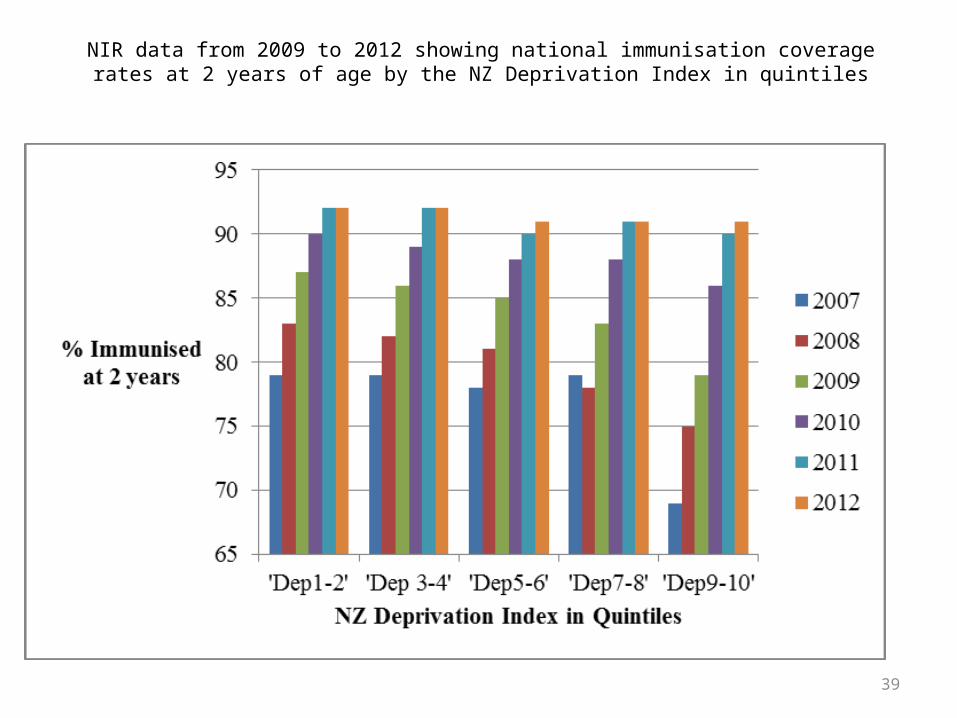
NIR data from 2009 to 2012 showing national immunisation coverage rates at 2 years of age by the NZ Deprivation Index in quintiles
39

• We need a plan• Measures, targets, reporting• Legally mandated• Our proposed targets are ambitious, but realistic:
– to reduce overall child poverty by at least 30-40% within 10 years– to reduce those living in severe and/or persistent poverty by over
50% within 10 years
Specific Proposals OCC EAG 2012: A Child Poverty Act

E aku rangatira, he aha te mea nui o tenei ao? Maku e kii atu,
he tamariki, he tamariki, a taatou, tamariki. Dame Anne Salmond
With thanks to IMAC whanau for the children illustrations